Article

Equivalent Frame Model with a Decaying Nonlinear Moment-Curvature of Steel-Reinforced Concrete Joints

Departamento de Ingeniería Civil, Universidad de Alicante, 03080 Sant Vicent del Raspeig, Spain
*
Author to whom correspondence should be addressed.
Appl. Sci. 2019, 9(24), 5533; https://doi.org/10.3390/app9245533
Submission received: 7 November 2019 / Revised: 2 December 2019 / Accepted: 12 December 2019 / Published: 16 December 2019

Abstract

:
A numerical model for the analysis of frame structures that is capable of reproducing the behavior of reinforced concrete (RC) members and steel-reinforced concrete (SRC) members in all steps until collapse by simulating a reduced resistance capacity is presented in this work. Taking into account the solid models obtained in previous research that have been validated by experimental results, moment-curvature graphics were obtained in all steps: elastic, plastic, and post-critical to collapse. Beam models versus 3D models considerably simplified the calculation of frame structures and correctly described both the plastic and post-critical phases. The moment-curvature graph can be used in a simplified frame analysis, from post critical behavior to collapse.

1. Introduction

When seismic load actions are considered in steel-reinforced concrete (SRC), structure failure occurs mostly at the joints. A joint can be reinforced with an embedded steel cross-section to absorb a huge amount of energy in order to prevent a structure from failing. The greater the ductility, the larger the energy absorption during an earthquake and the larger the deformation that can be achieved before collapse, thus reducing the risk of injury to the people occupying the building.
The leading references for experimental studies on this subject are those carried out by Wakabayasi [1], who in 1973, reported the behavior of SRC structures.
Chen et al. [2] investigated over 17 specimens with different steel cross-section solutions for concrete. They were composed of L or T steel cross-sections with reinforced concrete. Their force–displacement graphs are comparable to other numerical studies that have been carried out, such as those of Yan et al. [3], who analyzed the hysteretic curves and introduced the attenuation coefficient to represent the effects of seismic damage.
Chen et al. [4] conducted different studies on steel-reinforced concrete joints. The results show that SRC joints efficiently dissipated energy. The superposition method was able to very accurately estimate the joint strength. The research by Wilkinson and Hancock [5] concluded that, after carrying out flexion tests on Class 1 rectangular hollow sections, it is not possible to show proper rotation for plastic designs. They define the capacity of rotation (R) according to the curvature (χ) and the cross-section and its plastic curvature (χp), where Mp is the plastic moment and E I is the elastic rigidity of the cross-section. The expressions for R and χ are given as Equations (1) and (2):
R = χ χ p
χ p = M p E I
The behavior of the linear structural members under flexion during nonlinear calculations of the plastic region can be better understood with moment-curvature graphs.
In a moment-curvature graph, the rotation capacity can be represented by the distance between the point where it reaches the plastic moment of the cross-section for the first time and the intersection point between the horizontal branch and the unloading one.
The studies of Anastasiadis et al. [6] provide us with a better understanding of the relationship between the rotation capacity of a beam and its ductility. These authors studied the rotation capacity of steel wide-flange beams, their mechanical characteristics, and the collapse mechanisms inside and outside the web plane. Two different descriptions of ductility can be considered: one is the curving capacity of the section, the other is the rotation capacity between the front and rear sections of a beam member portion. In this way, classes of sections can be classified according to Eurocode 3 [7]: Class 1 is a plastic section, Class 2 is a compact section, Class 3 is a semi-compact section, and Class 4 is as slender section, which can be classified according to the ductility of the beam element, namely high ductility, medium ductility, and low ductility. The second class is the most suitable to guarantee stress redistribution capacity and energy absorption [8].
The nonlinear relationship between the moment and curvature can be experimentally obtained from the theoretical behavior of the section by using extensometric wires or by means of numerical nonlinear models validated by experimental tests.
The definition of ductility as the ratio between the collapse curvature and elastic curvature (quoted in Eurocode 2 [9], despite talking about rotation instead) is not appropriate. Curvature is the ratio of the difference between the unitary deformation of superior and inferior fibers divided by the height of the section. By considering the integration of these curvatures along the beam axis, movements can be obtained. The elastoplastic model allows us to accurately predict behavior in all load phases during the loading process: a former lineal phase regarding serviceability situations and a plastic phase that allows us to predict behavior close to collapse.
Two cross-sections with identical resistance characteristics (in elastic moment and collapse moment terms) can show a very different moment-curvature (M–χ), regardless of whether the section is fragile or ductile.
The collapse curvature is bigger when ductile behavior occurs [10]. When fragile, phenomena happen very quickly with no warning time, and compressed concrete loses its resistance to displacement crack propagation and low deformations. As collapse load values are reached, stresses correspond to the sections in which the plastic hinges needed for collapse in the simplified model appear; the final figure is reached simultaneously among collapsing sections, while the values of other sections still remain far from this figure.
When comparing different moment-load graphics on different joints in a frame, several plastification grades are noticeable given the stress redistribution in the plastic phase. Gioncu and Petcu [11] studied the rotation capacity of double T- and beam-column joints when looked at from a local plastic mechanism point of view. They wrote code algorithms to obtain the beam rotation capacity, the results of which were in line with experimental tests.
Nowadays, finite element method (FEM)-based software is capable of solving several different types of analyses with multiple applications in the engineering field, from simple linear analyses to nonlinear complex analyses [12]. To solve the relevant equations, nonlinear calculations require an incremental process with increasing loads starting from a value of zero.
In recent years, many scientific works [13,14,15] have attempted to analyze the behavior of SRC joints. Models with moment-curvature graphs have become a very interesting tool to simulate the complex behavior of large structures [16]. The article describes the experimental tests carried out to better understand the behavior of different models.
The experimental tests to obtain the moment-curvature graphs were made in previous investigations [17]. Several experimental results were obtained for RC and SRC models.
In Montava et al. [18], three solid numerical models were tested to understand their behavior and obtain the moment-curvature graphs required in the present research.
The solid finite elements were modeled and validated with experimental results until reliable models were obtained. Starting with the numerical solid model, a moment-curvature graph was created to extrapolate the characteristics of the analyzed models to a frame structure of prismatic pieces, and to perform a nonlinear calculation on a wireframe model [19]. The main goal was to generate a new simplified frame model by taking into account the moment-curvature graph whose behavior better fits the experimental results. Moment-curvature graph decadence allows for the loss of the resistance of reinforcing bars of reinforced concrete and their breakage to be simulated using nonlinear calculations with large displacements. With this new validated simplified model, the intention was to better understand the behavior of 2D gantries as opposed to a horizontal load to simulate seismic action with vertical loads [20]. The displacements obtained in the different tested prototypes and the absorbed energies were compared. The simulation was validated by starting with a 3D solid model of a beam with two simple supports at the ends and a load at the mid-span, which was simulated. This new bar model, with the moment-curvature graphs taken as the main data source, allowed for complex frames to be simulated. The improvement of the SRC was demonstrated, and the matching results were reinforced only at the joints. The 3D solid model is not a complex tool, but accurately describes plastic and post-critical behavior and can be used for further analysis.
Recent articles have attempted to simulate the decreasing plastic behavior until breakage of reinforced concrete structures using moment-curvature graphs [21].
The main objective of this investigation is to obtain a numerical model of a moment-curvature graph to be used in a simplified frame analysis, from post-critical behavior to collapse. References [17,18] have been used in order to validate the experimental data versus the numerical data.

2. Description

2.1. Description of the Model

The process of analyzing the model was highly nonlinear, and therefore, involved very complex calculations as two non-linearities intervened at the same time: the geometric nonlinearity and the nonlinearity of the material’s behavior in terms of the stress–strain curve. The decreasing branch of the resistance to rupture was included in this nonlinearity.
To build the wireframe model, the module APDL of Ansys (Version 16.2 and 17.2, Company: Ansys Inc., Canonsburg, Pennsylvania, United States, 2015), whose research license is held at the Department of Civil Engineering of the University of Alicante (Alicante, Spain). The intention was to simulate three prototypes (see Table 1):
The experimental tests are detailed in Montava et al. [17]. The first model, P03, aimed to describe reinforced concrete. The model P04 had the same reinforcement by including an HEB-100 cross-section in the central part (which covered a length of 2000 mm). The third model, P05, had a reinforced concrete beam capable of supporting a similar load to the P04 model, but without the steel section (Figure 1).
The characteristics of the joint in the reinforced concrete structures with the embedded steel cross-sections were essential to understanding their behavior because it increased the rigidity and ductility at the most vulnerable point, mainly in order to withstand seismic activity.
As the applied deformations were progressively increased, the following states represented in Figure 2 could be distinguished.

2.2. Equivalent Frame Model with Ansys APDL M–χ Nonlinear Relationship

Obtaining the moment-curvature graphs allowed us to simulate wireframe structures using a nonlinear analysis because the moment of the section is related to its curvature; this is a relationship in which the reduced inertia of the concrete from cracking and loss of compression resistance, and even the rupture of bars, are implicit.
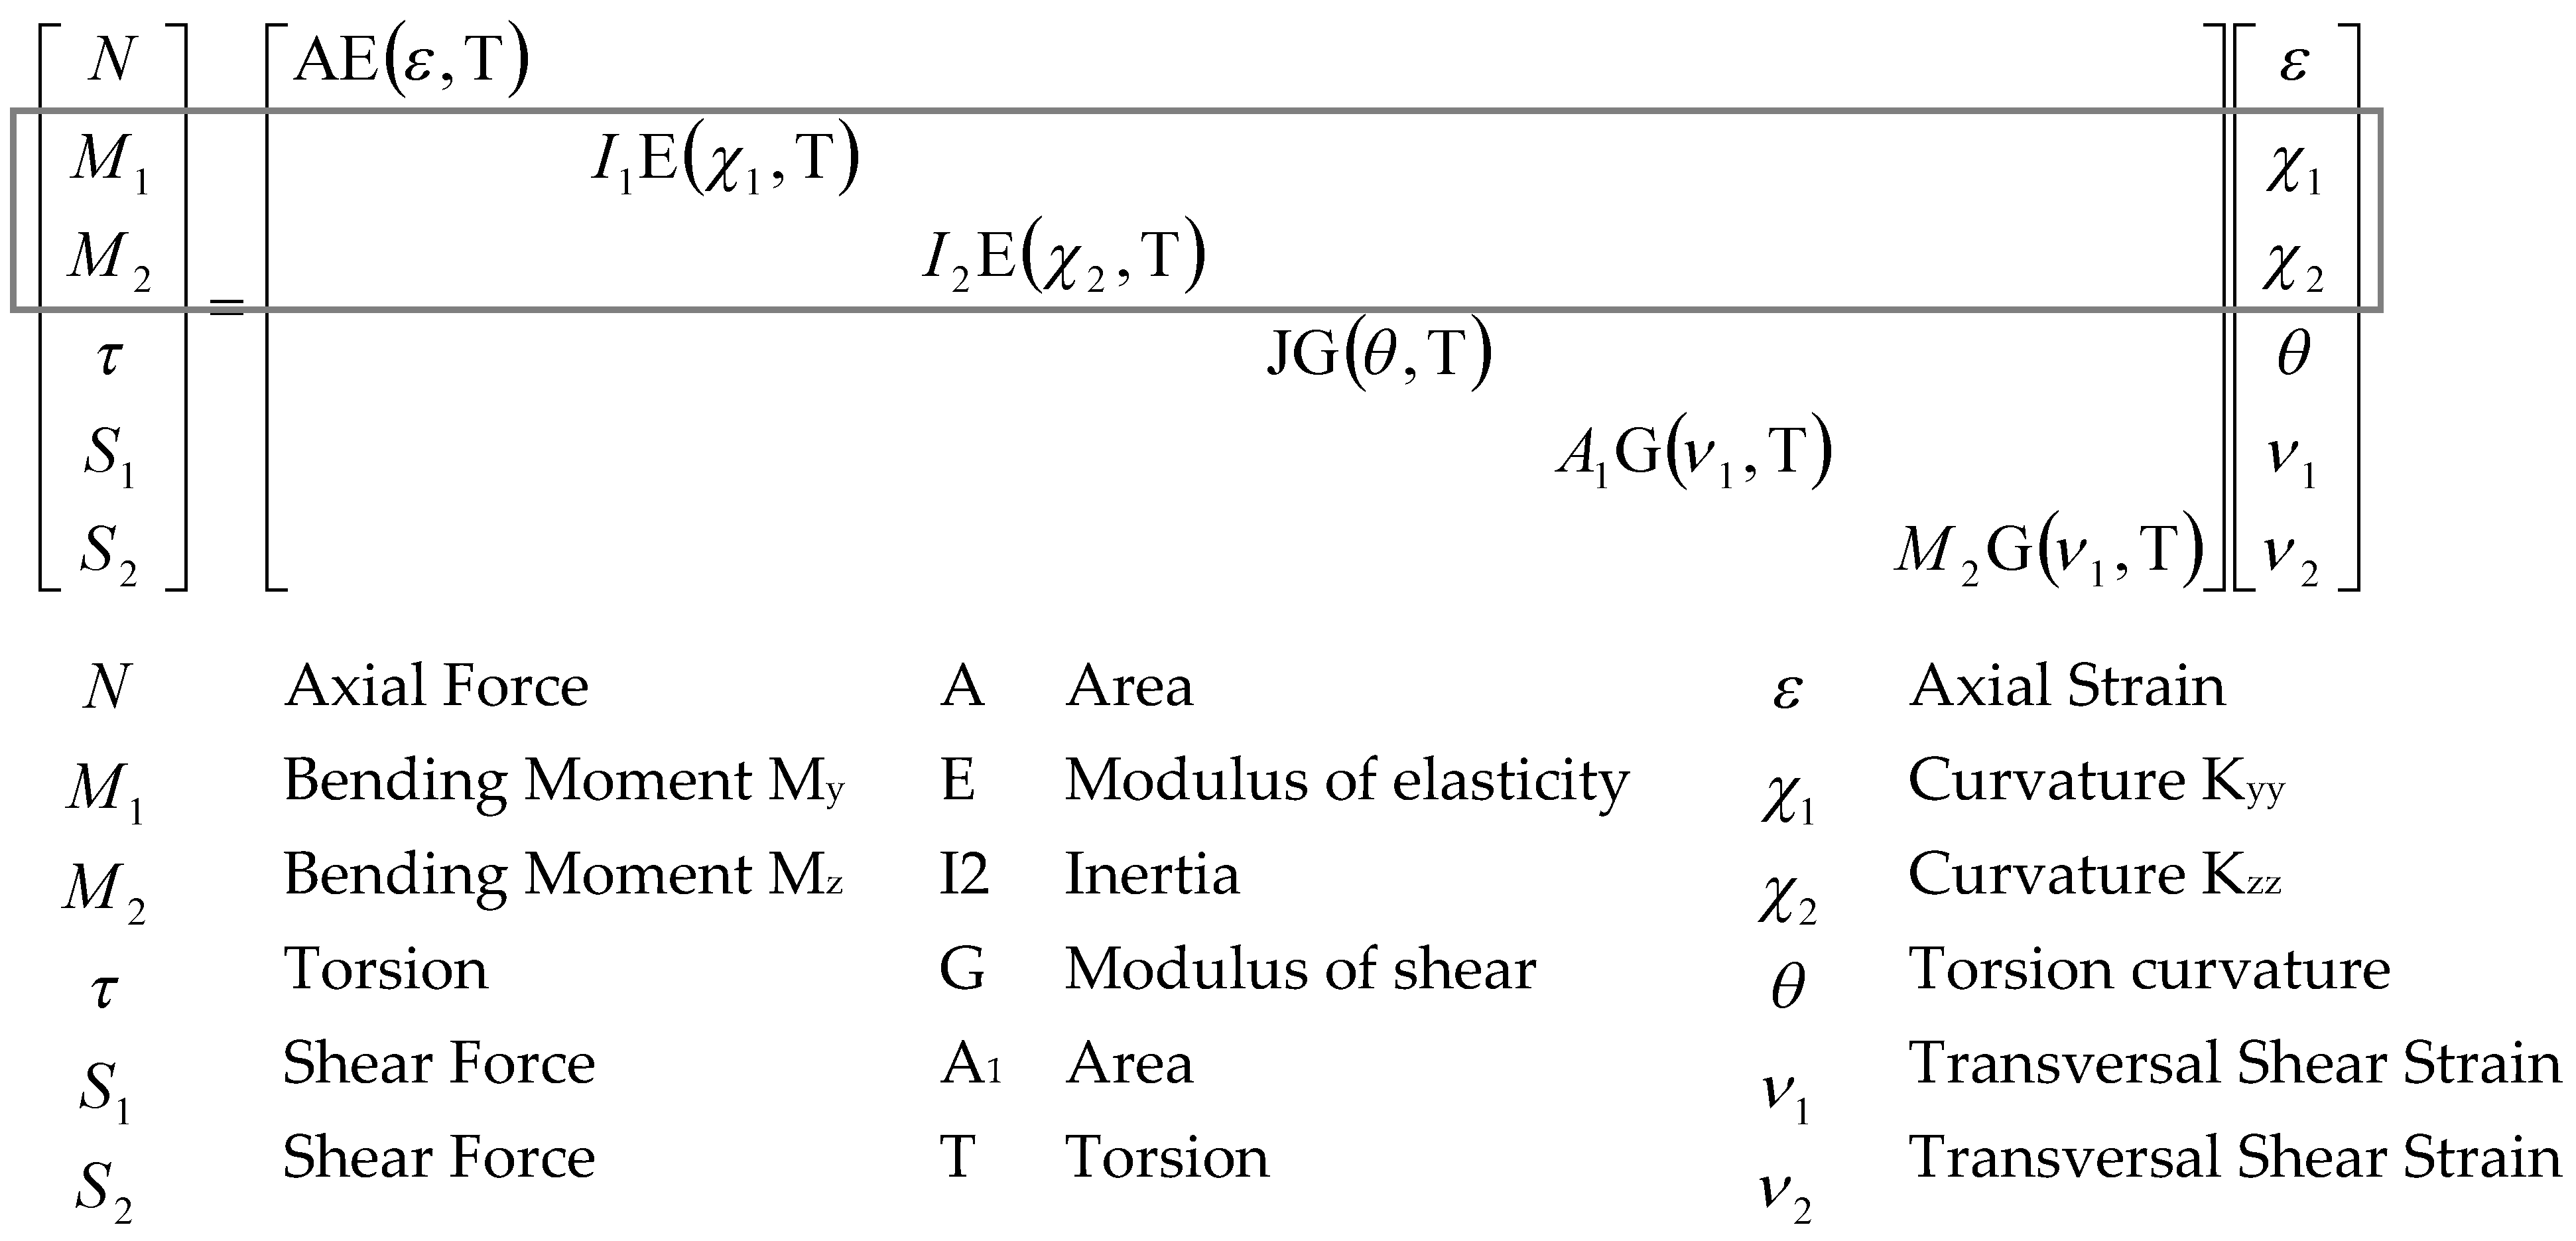
With this graph, data were input into the bar-type model using the BEAM188 (Ansys code) element, implemented with SECTYPE and GENB for non-linear calculations in bar sections (Figure 3).
The simplified wireframe model allowed for a much simpler and more concise nonlinear calculation to be made than if the corresponding 3D solid model were used.
The behavior of beam elements is governed by the main moment-curvature relationship in the nonlinear calculation, and the other (axial, torsion, and shear) are described using linear relationships as their influence on the plastic behavior of the deflected bar is far weaker.
With greater ductility in the plastic phase, the structure allows for stresses to be better redistributed when some of its bars weaken, which is desired behavior for withstanding seismic actions.

3. Simulated Models

3.1. Prototypes P03, P04 and P05

The moment-curvature graph was obtained from the solid model [18]. It was made to compare the numerical model results with those obtained with the tested prototypes [17].
The novel procedure was used to build a 3D solid model of the finite elements validated with the experimental models and to obtain the moment-curvature graph from the deformations and moments obtained from the section.
It is important to note that for those materials showing deterioration, such as concrete, the moment-curvature graph changes to a decreasing trend for large curvatures, after verifying in this case that the behavior noted in the depletion of the modeled beam was similar to that tested if the graph changed to decreasing.
The moment-curvature graph was obtained from the solid model. The curvature obtained was the difference in the strain along the x-axis (beam direction) between the upper and lower nodes of the section 100 mm apart along the face of the column divided by the height of the section, see Figure 4.
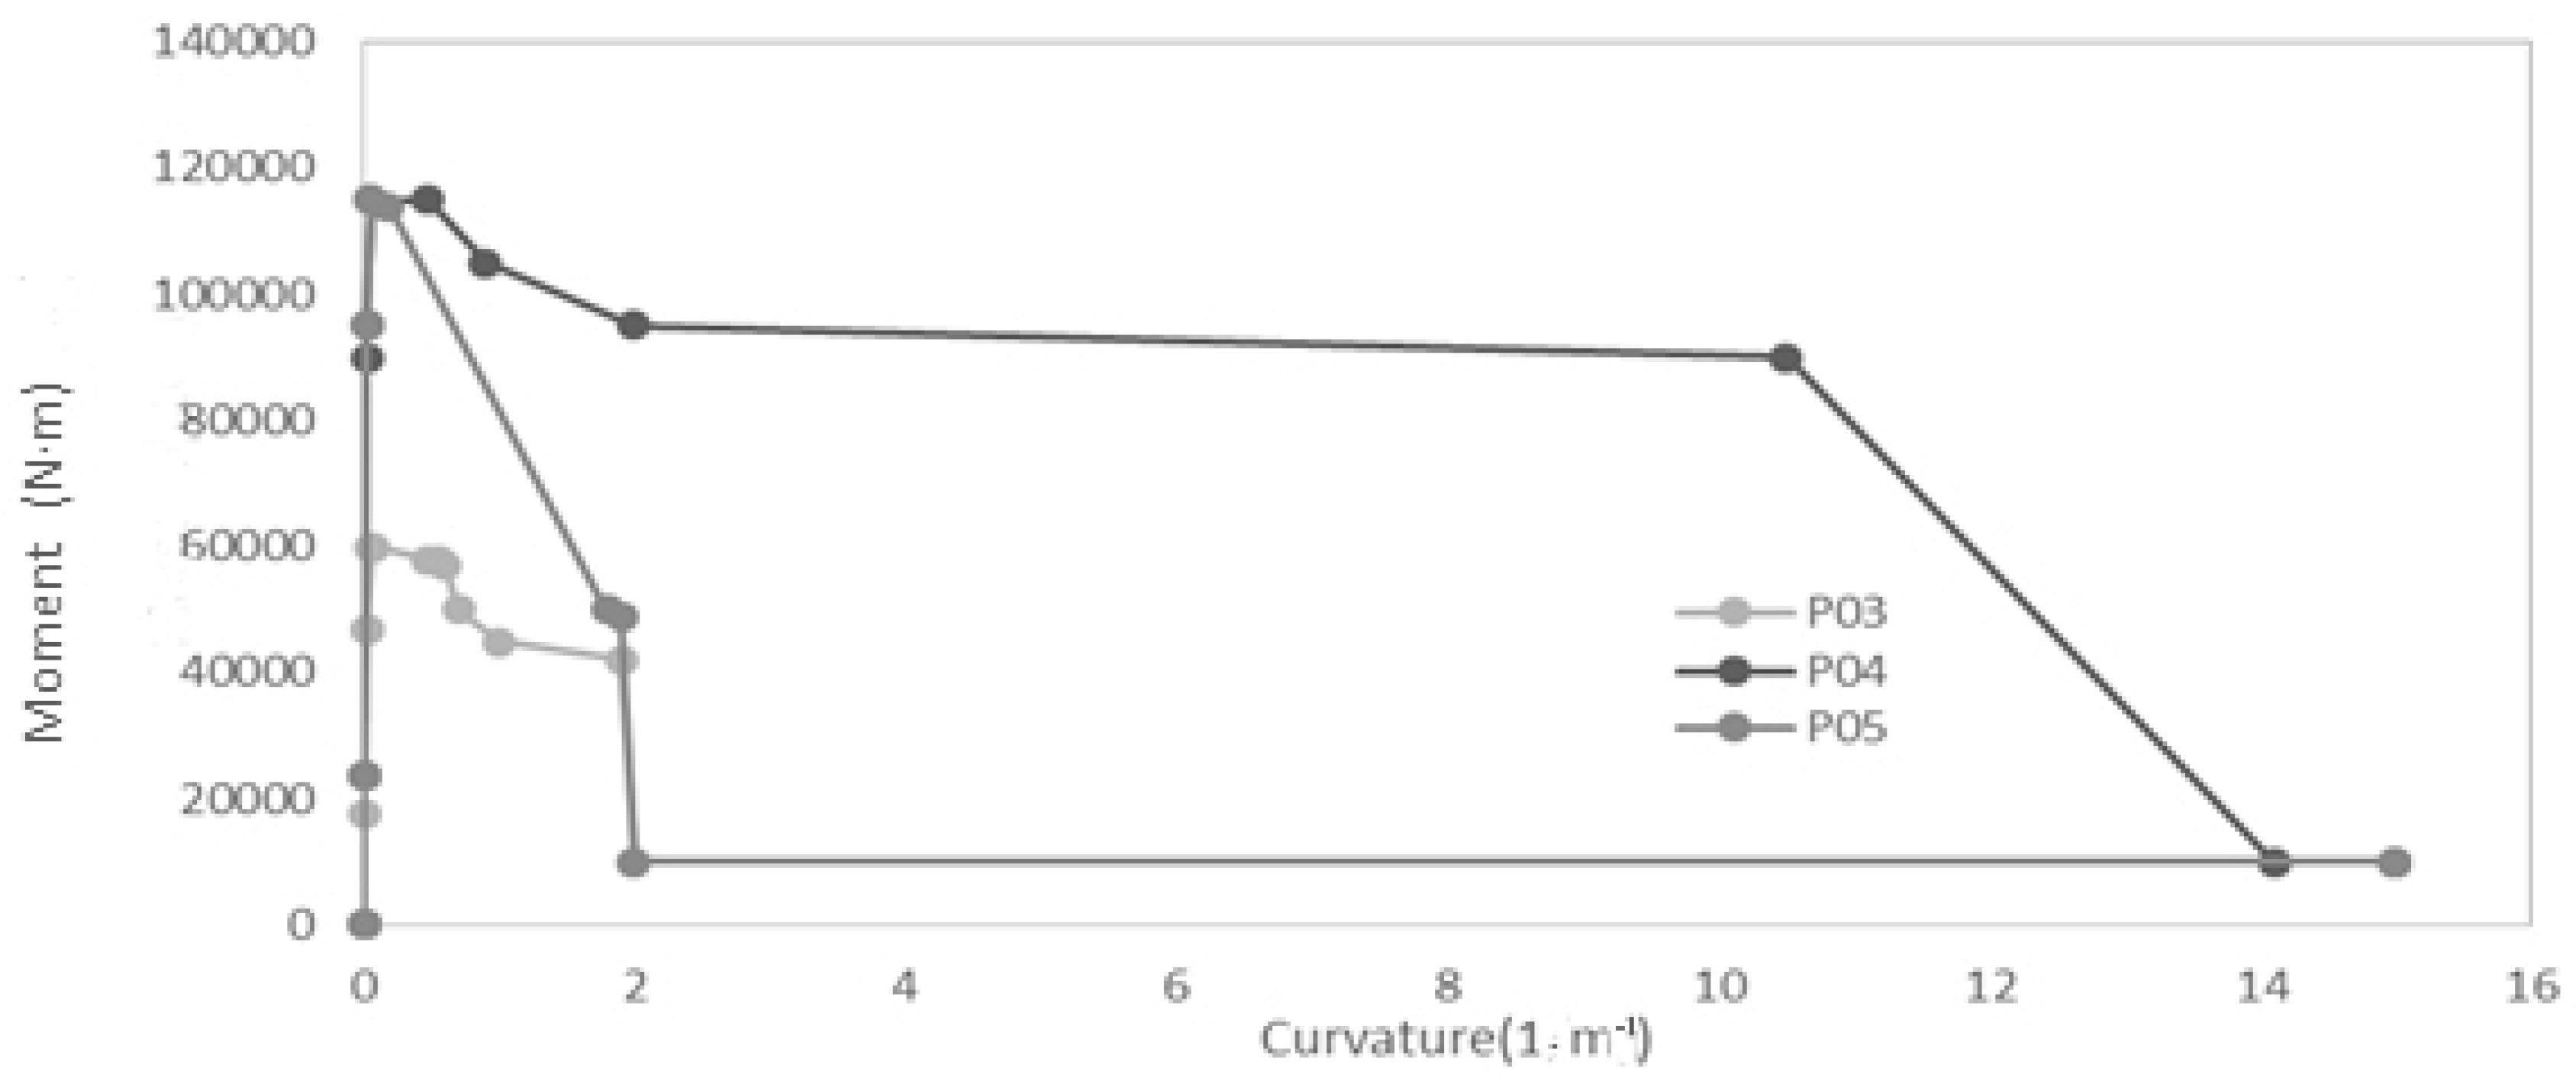
The graph corresponding to prototype P04 allowed for a wider range of ductility compared to the other two obtained, where the break prevented greater deformations. It was possible to simulate the breakage of the section by including a drastic reduction that simulated the loss of resistance due to the deterioration of the concrete and breakage of reinforcements in the moment-curvature graph (Figure 5).
The moment-curvature graph was obtained from the solid model [18]. This novel procedure consisted of a three-dimensional finite element model validated by the experimental models to obtain the moment-curvature graph from the strains and moments in the section. The curvature obtained was the difference in the strain along the x-axis between the upper and lower nodes of the section 100 mm apart along the face of the column divided by the height of the section from the different prototypes P03, P04, and P05.

3.1.1. Reinforced Concrete P03 Prototype

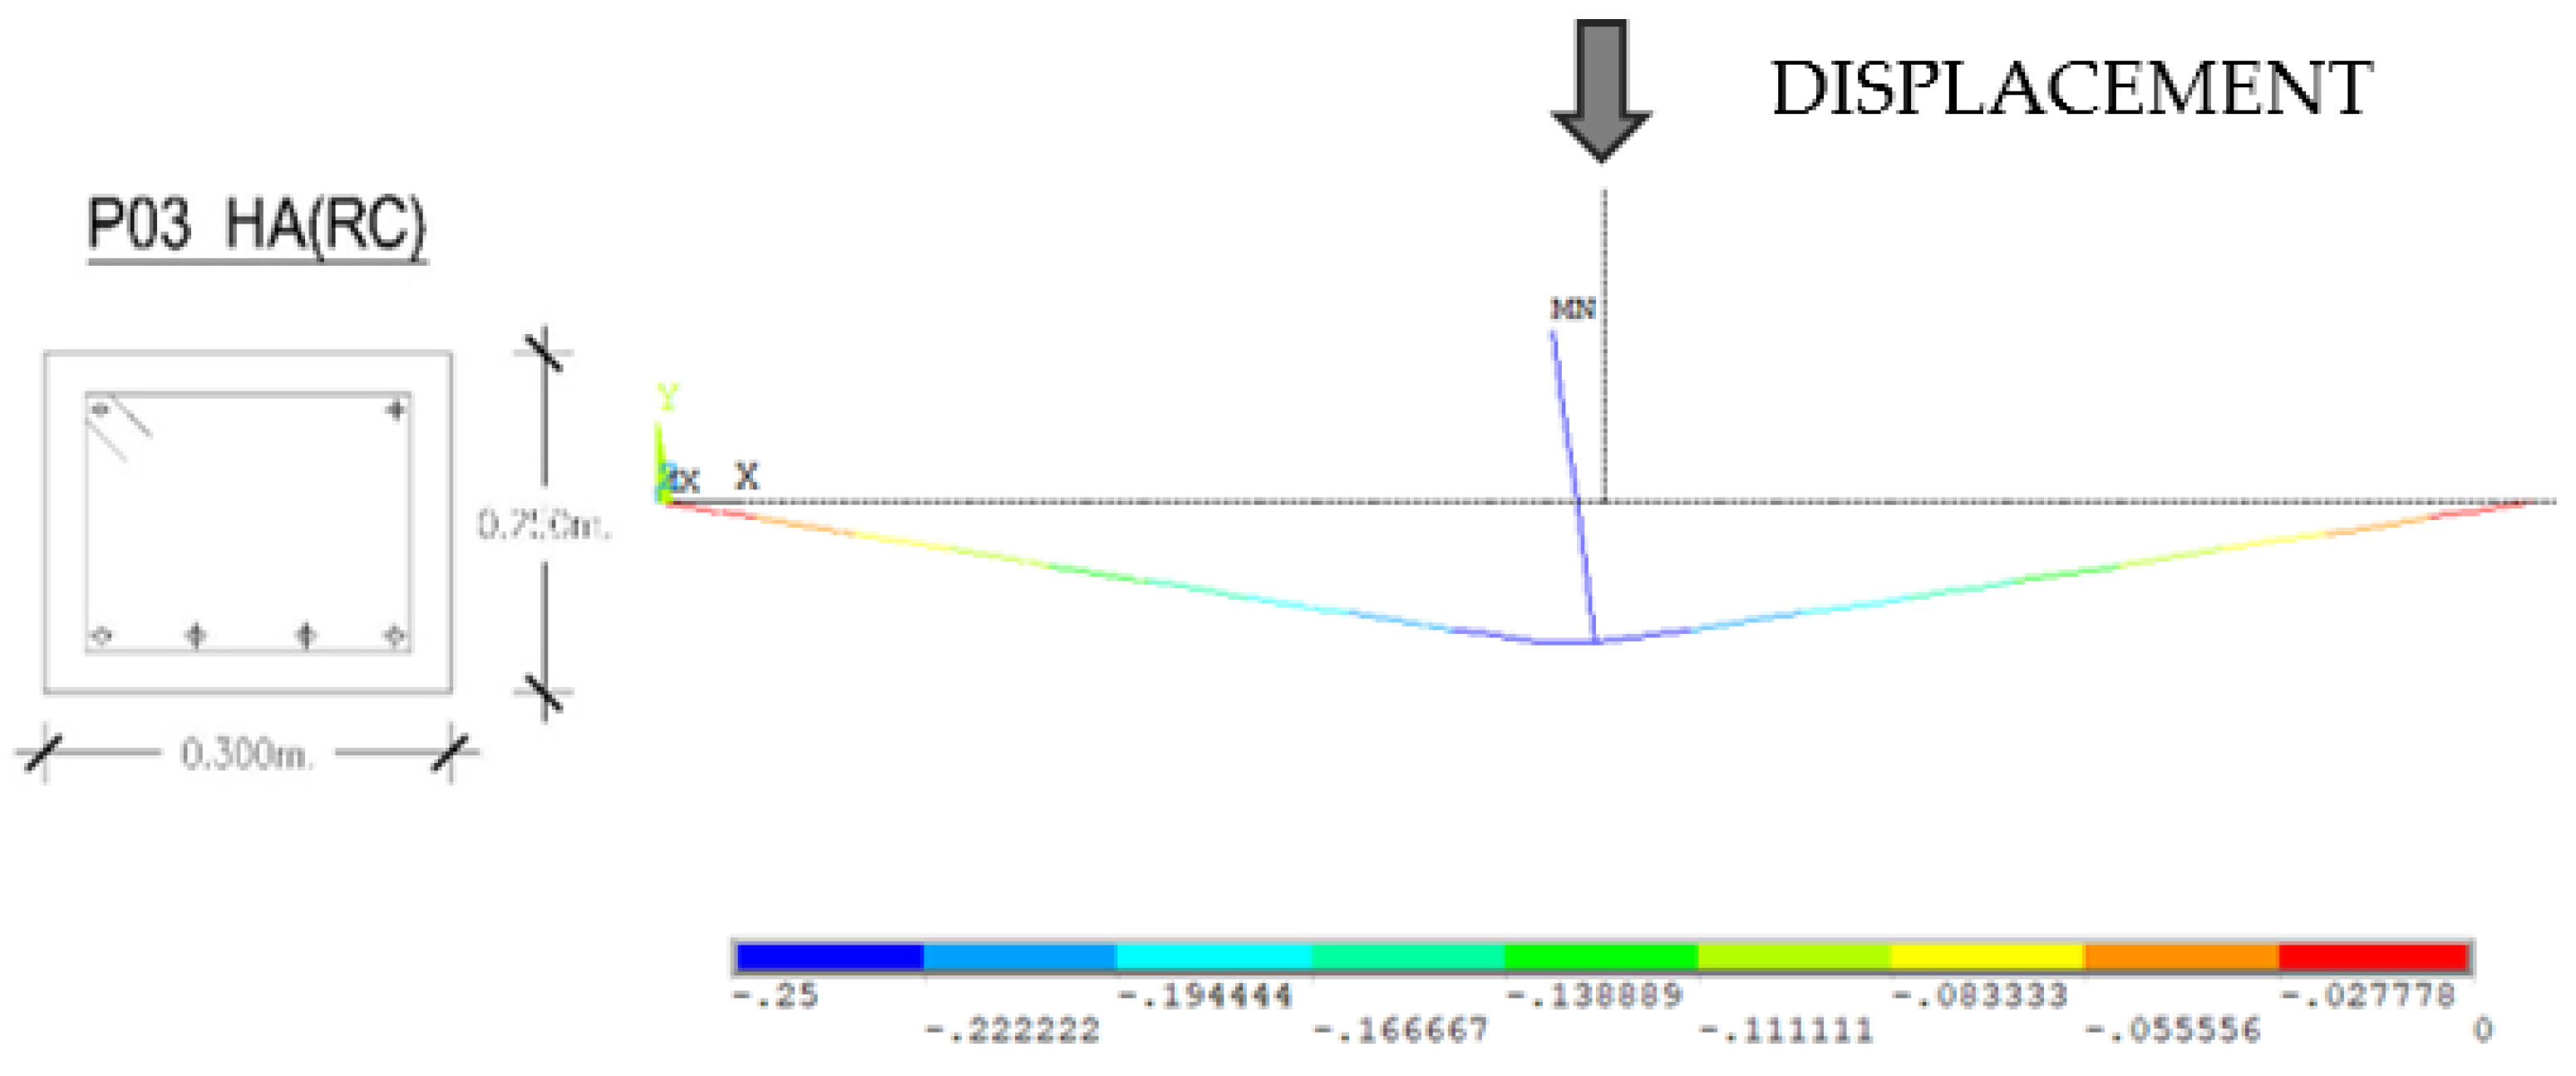
From the moment-curvature graph, data were input into Ansys APDL to simulate a similar simplified bar model to the experimental test, and to verify its ability to reproduce the experimental tests and the corresponding 3D solid model. A displacement of 250 mm was introduced as the movement imposed to obtain the reactions and to verify that the behavior was similar to the experimental behavior (Figure 6).
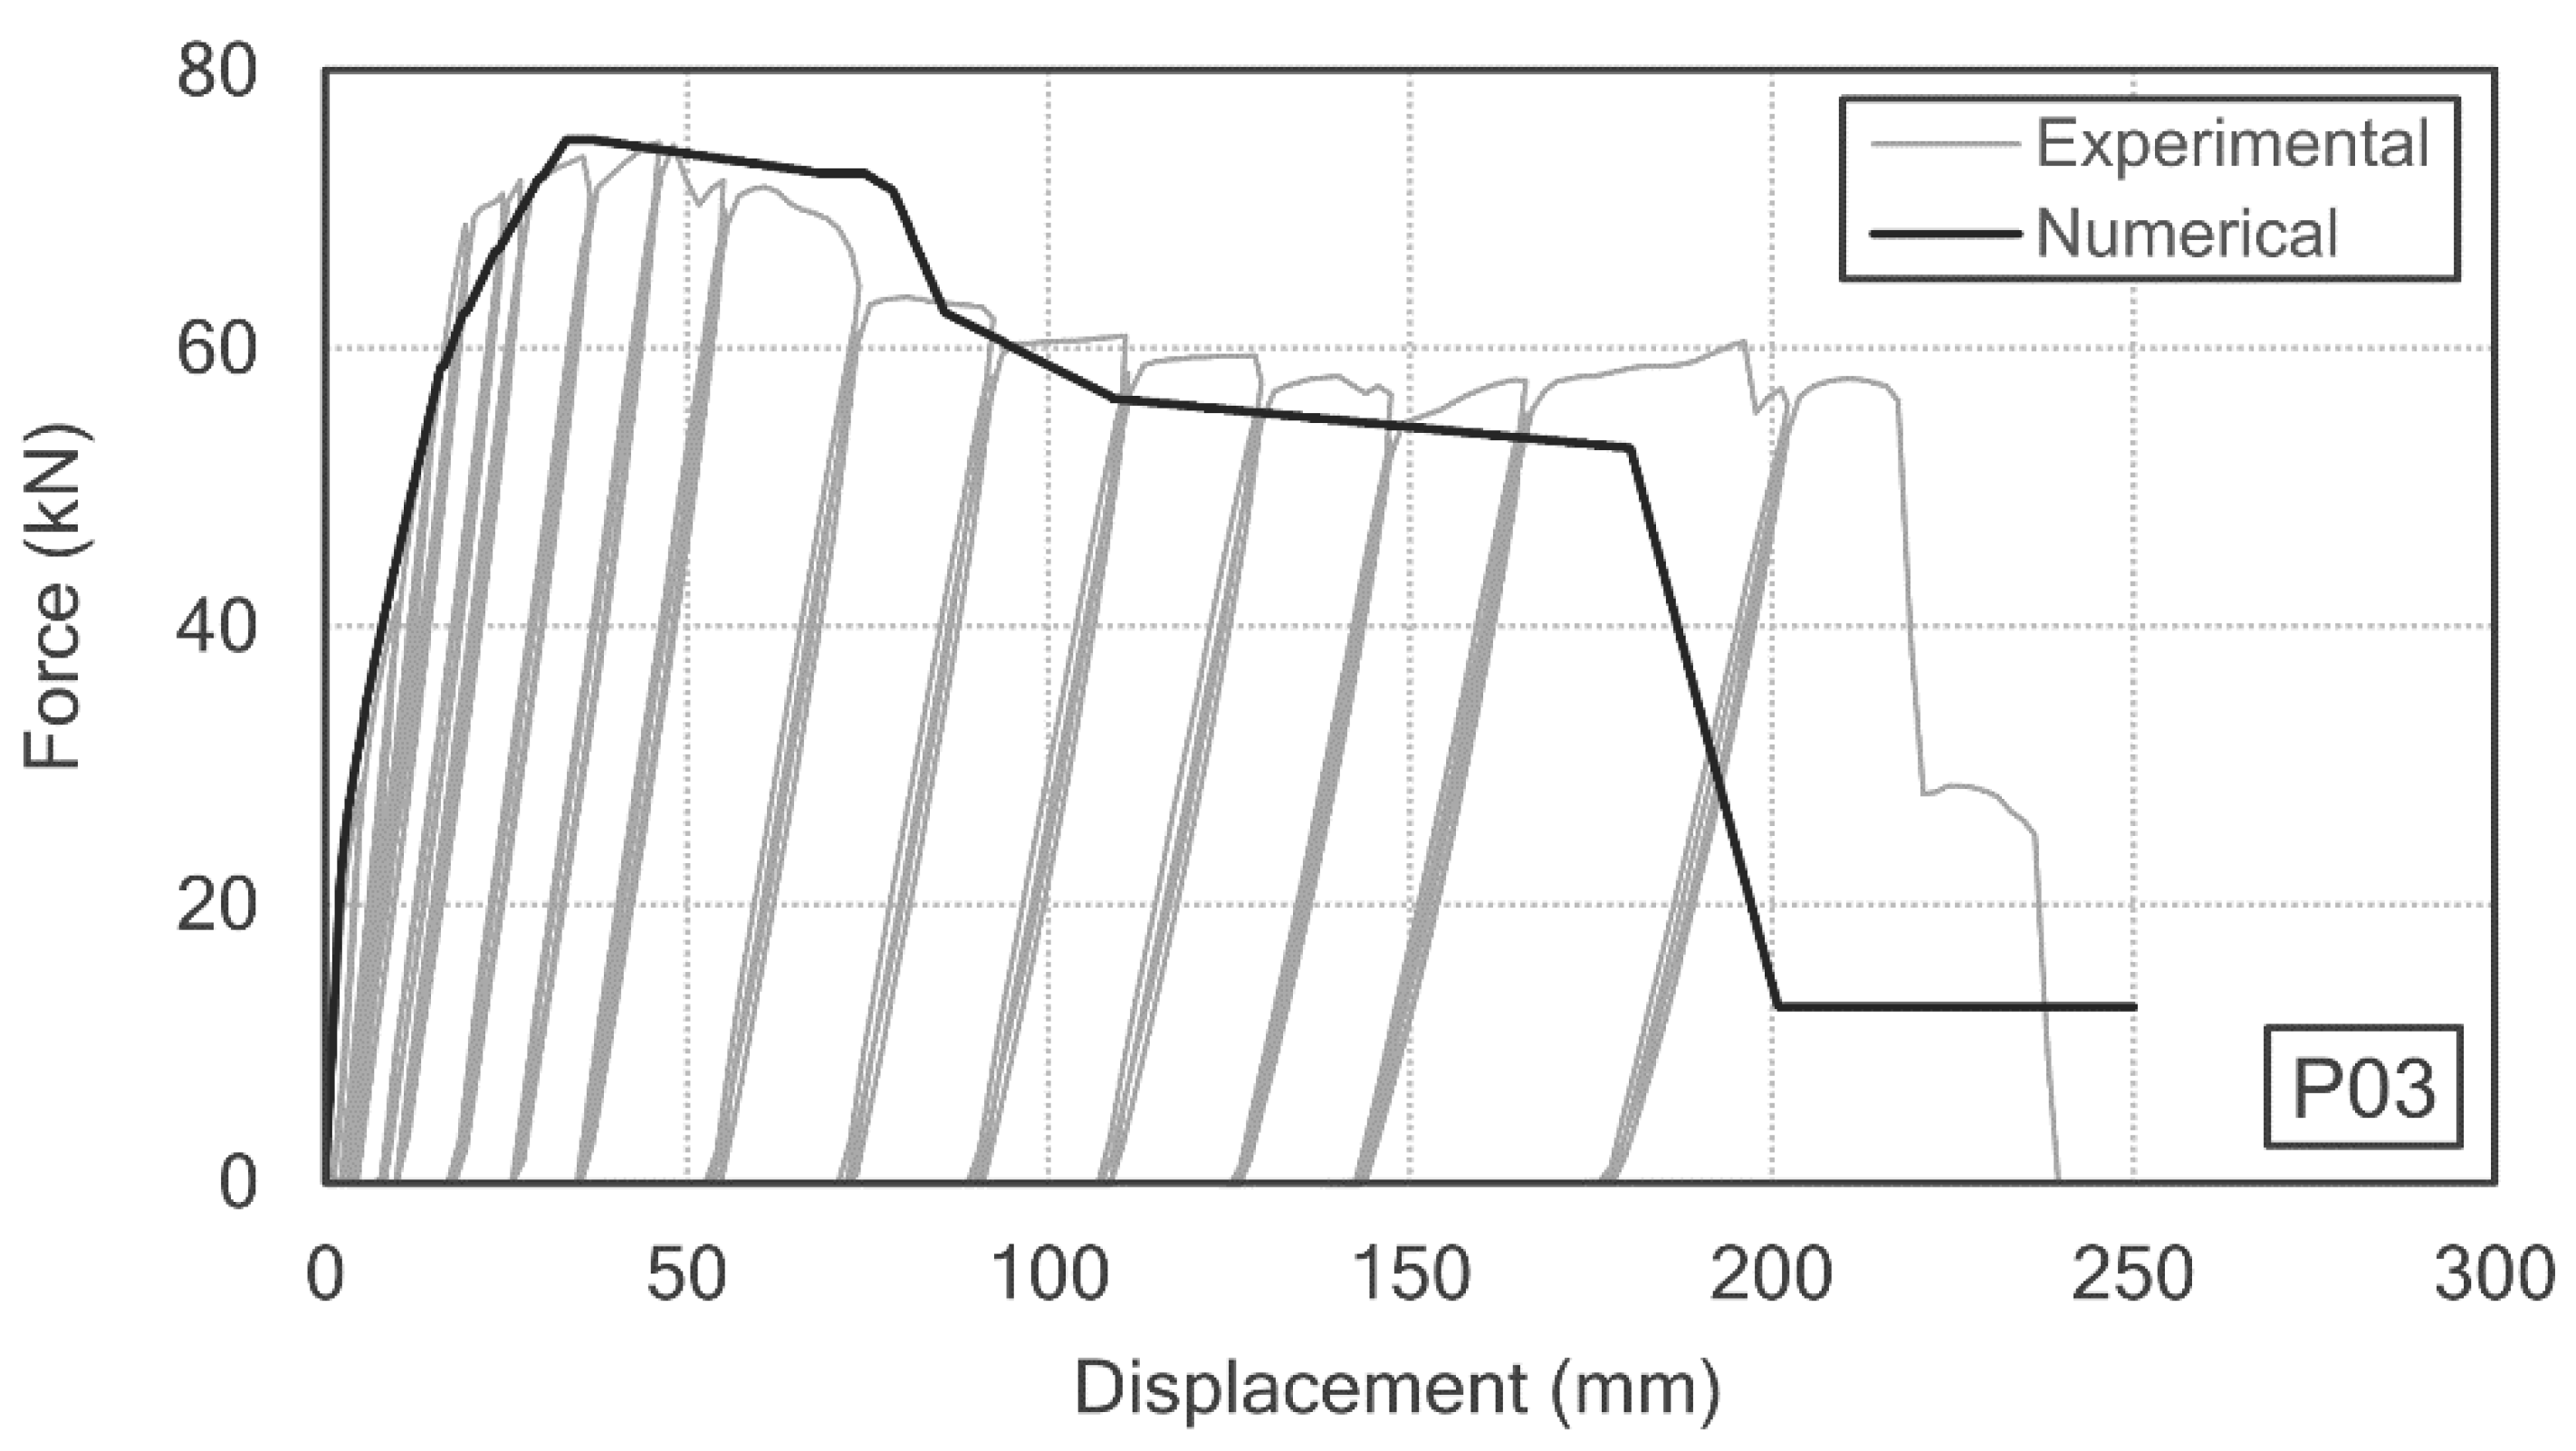
From Figure 7, in which the force–displacement graph is represented at the center of the beam, we can verify that the maximum load that the section resists was 74 kN in the FEM model versus 73 kN in the test, with a maximum displacement of 250 mm when the rupture of the reinforcing steel occurred.
The behavior was elastoplastic, and it was possible to simulate a very complex behavior with significant deformations in both the concrete and steel from the nonlinear behavior of the moment-curvature graph (Figure 8). The reduced resistance of the calculation model was comparable to the experimental model.

3.1.2. Steel Reinforced Concrete P04 Prototype

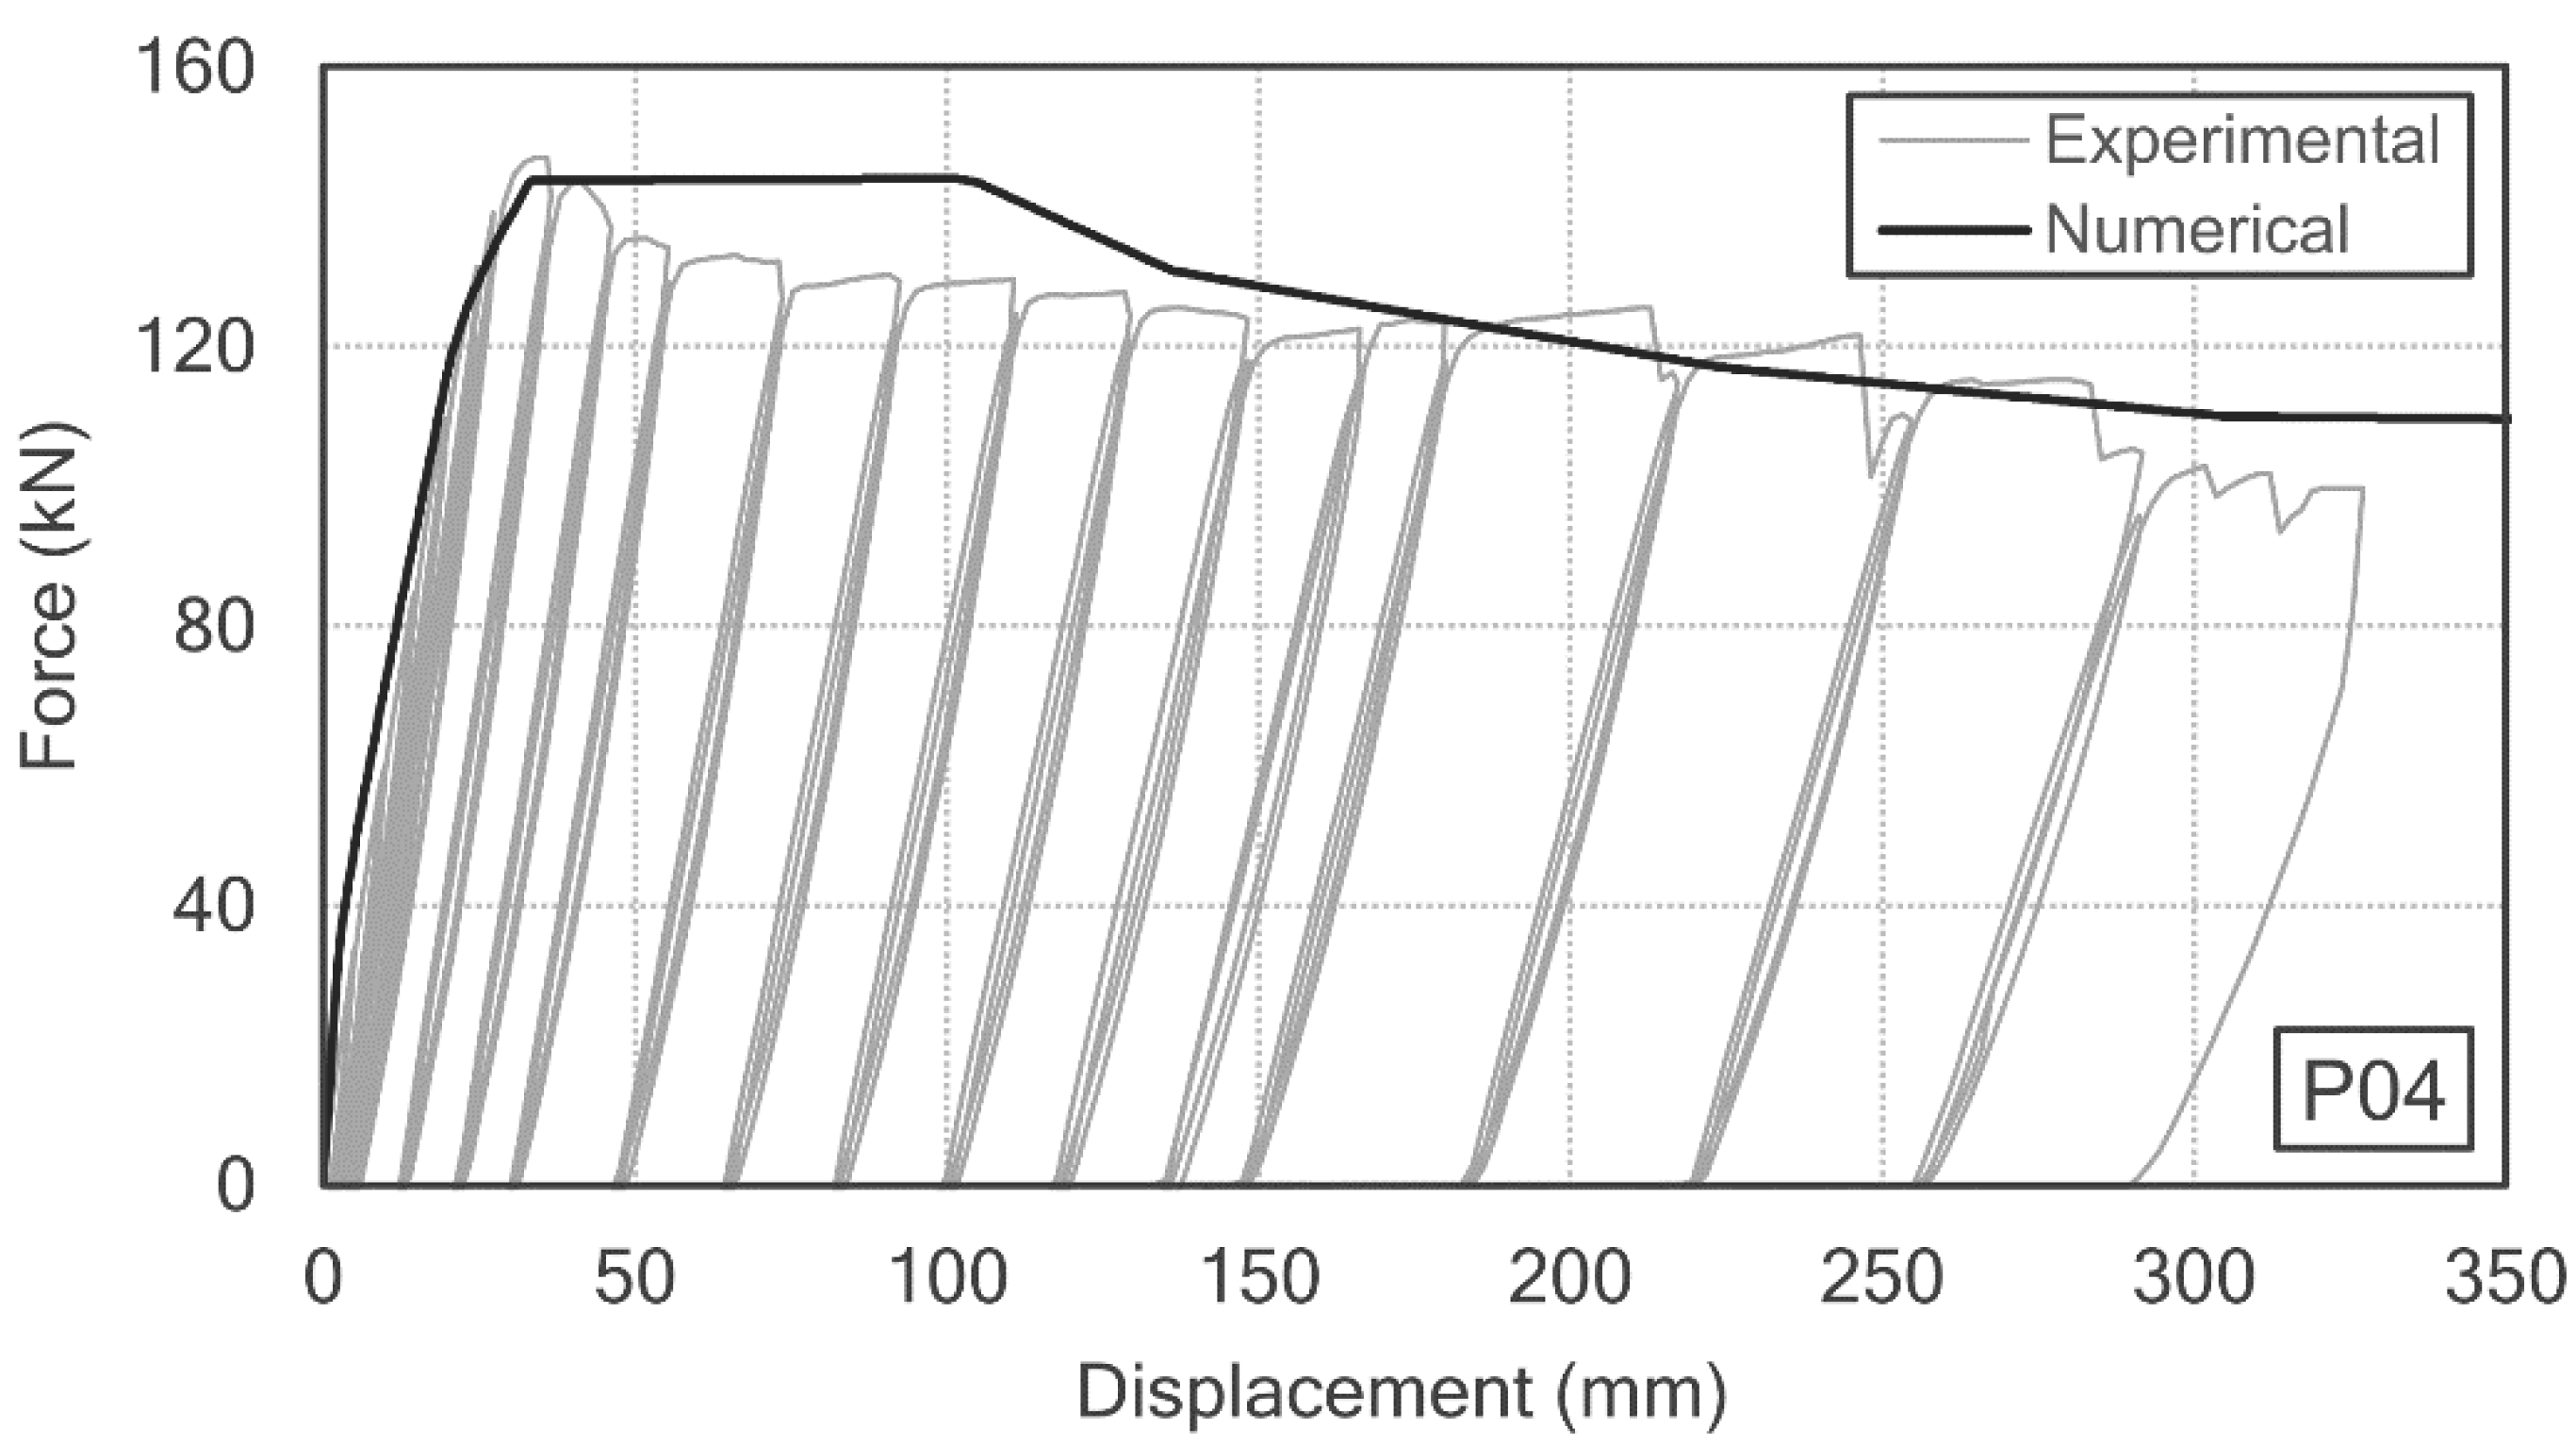
The simulation was carried out with the frame model and the moment-curvature graph obtained from simulating the P04 prototype as in the previous section. In this case, the curvature that the section reached was much greater than in the previous one given the capacity of the steel cross-section’s rotation in Montava et al. [17]; a 350 mm displacement was reached without having exhausted the steel cross-section and without considerably reducing the section’s strength capacity (Figure 9).
Figure 10 illustrates the diagram of moments (a) and curvatures (b) in the last step of a hinge with a high curvature in the section near the center.
The maximum load in the center of the beam that the section was capable of resisting was 150 kN in the simulated model, compared to 152 kN in the experimental test (Figure 11).

3.1.3. Reinforced Concrete P05 Prototype

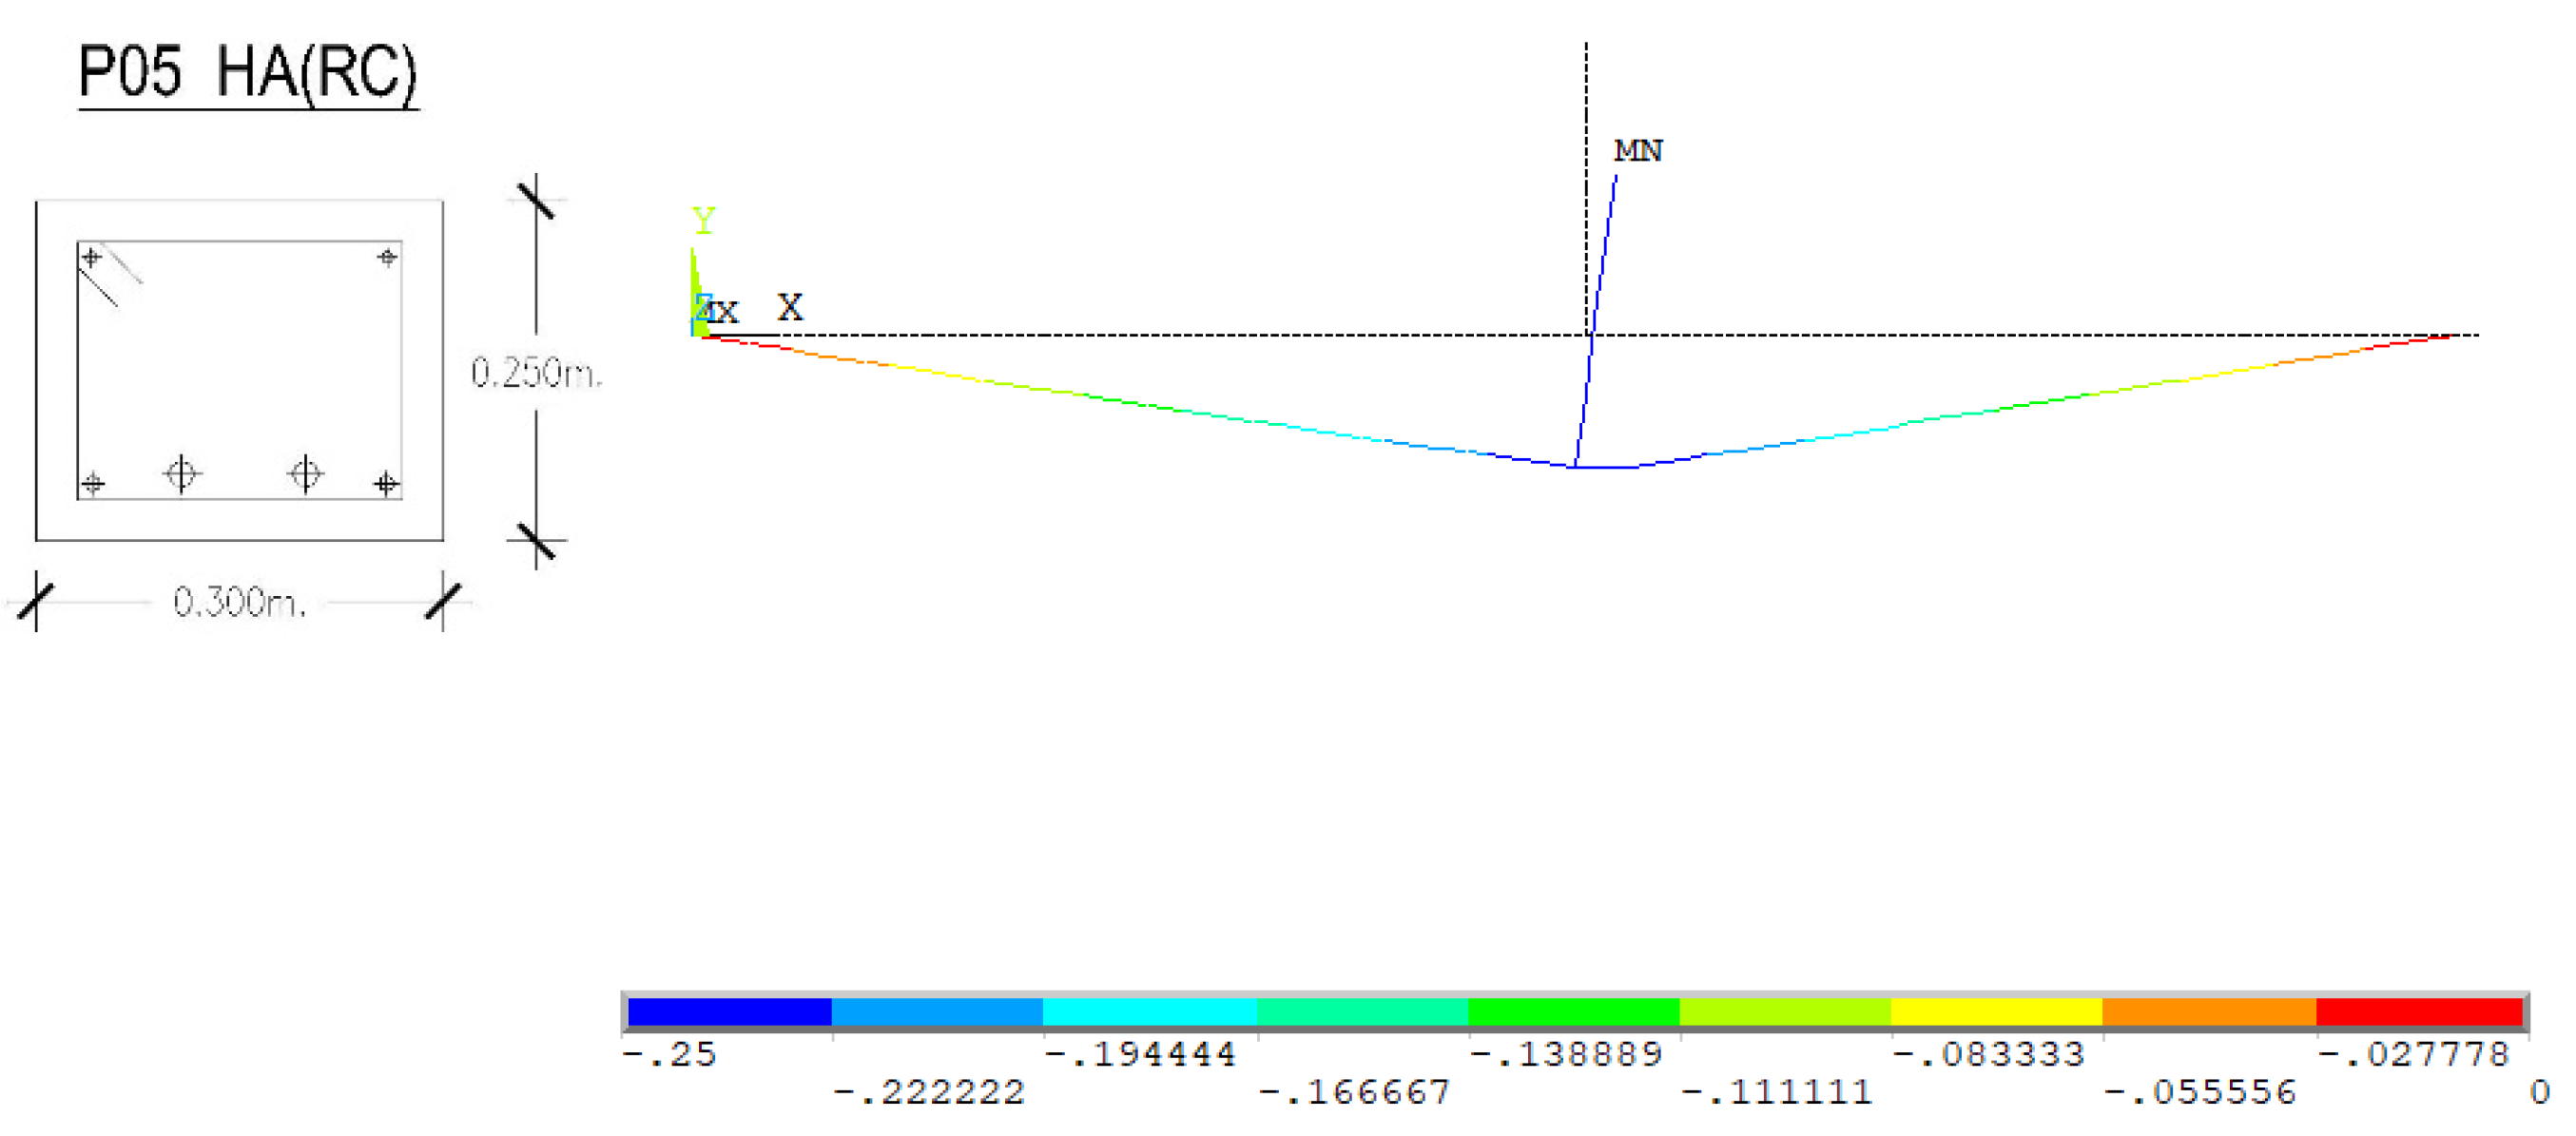
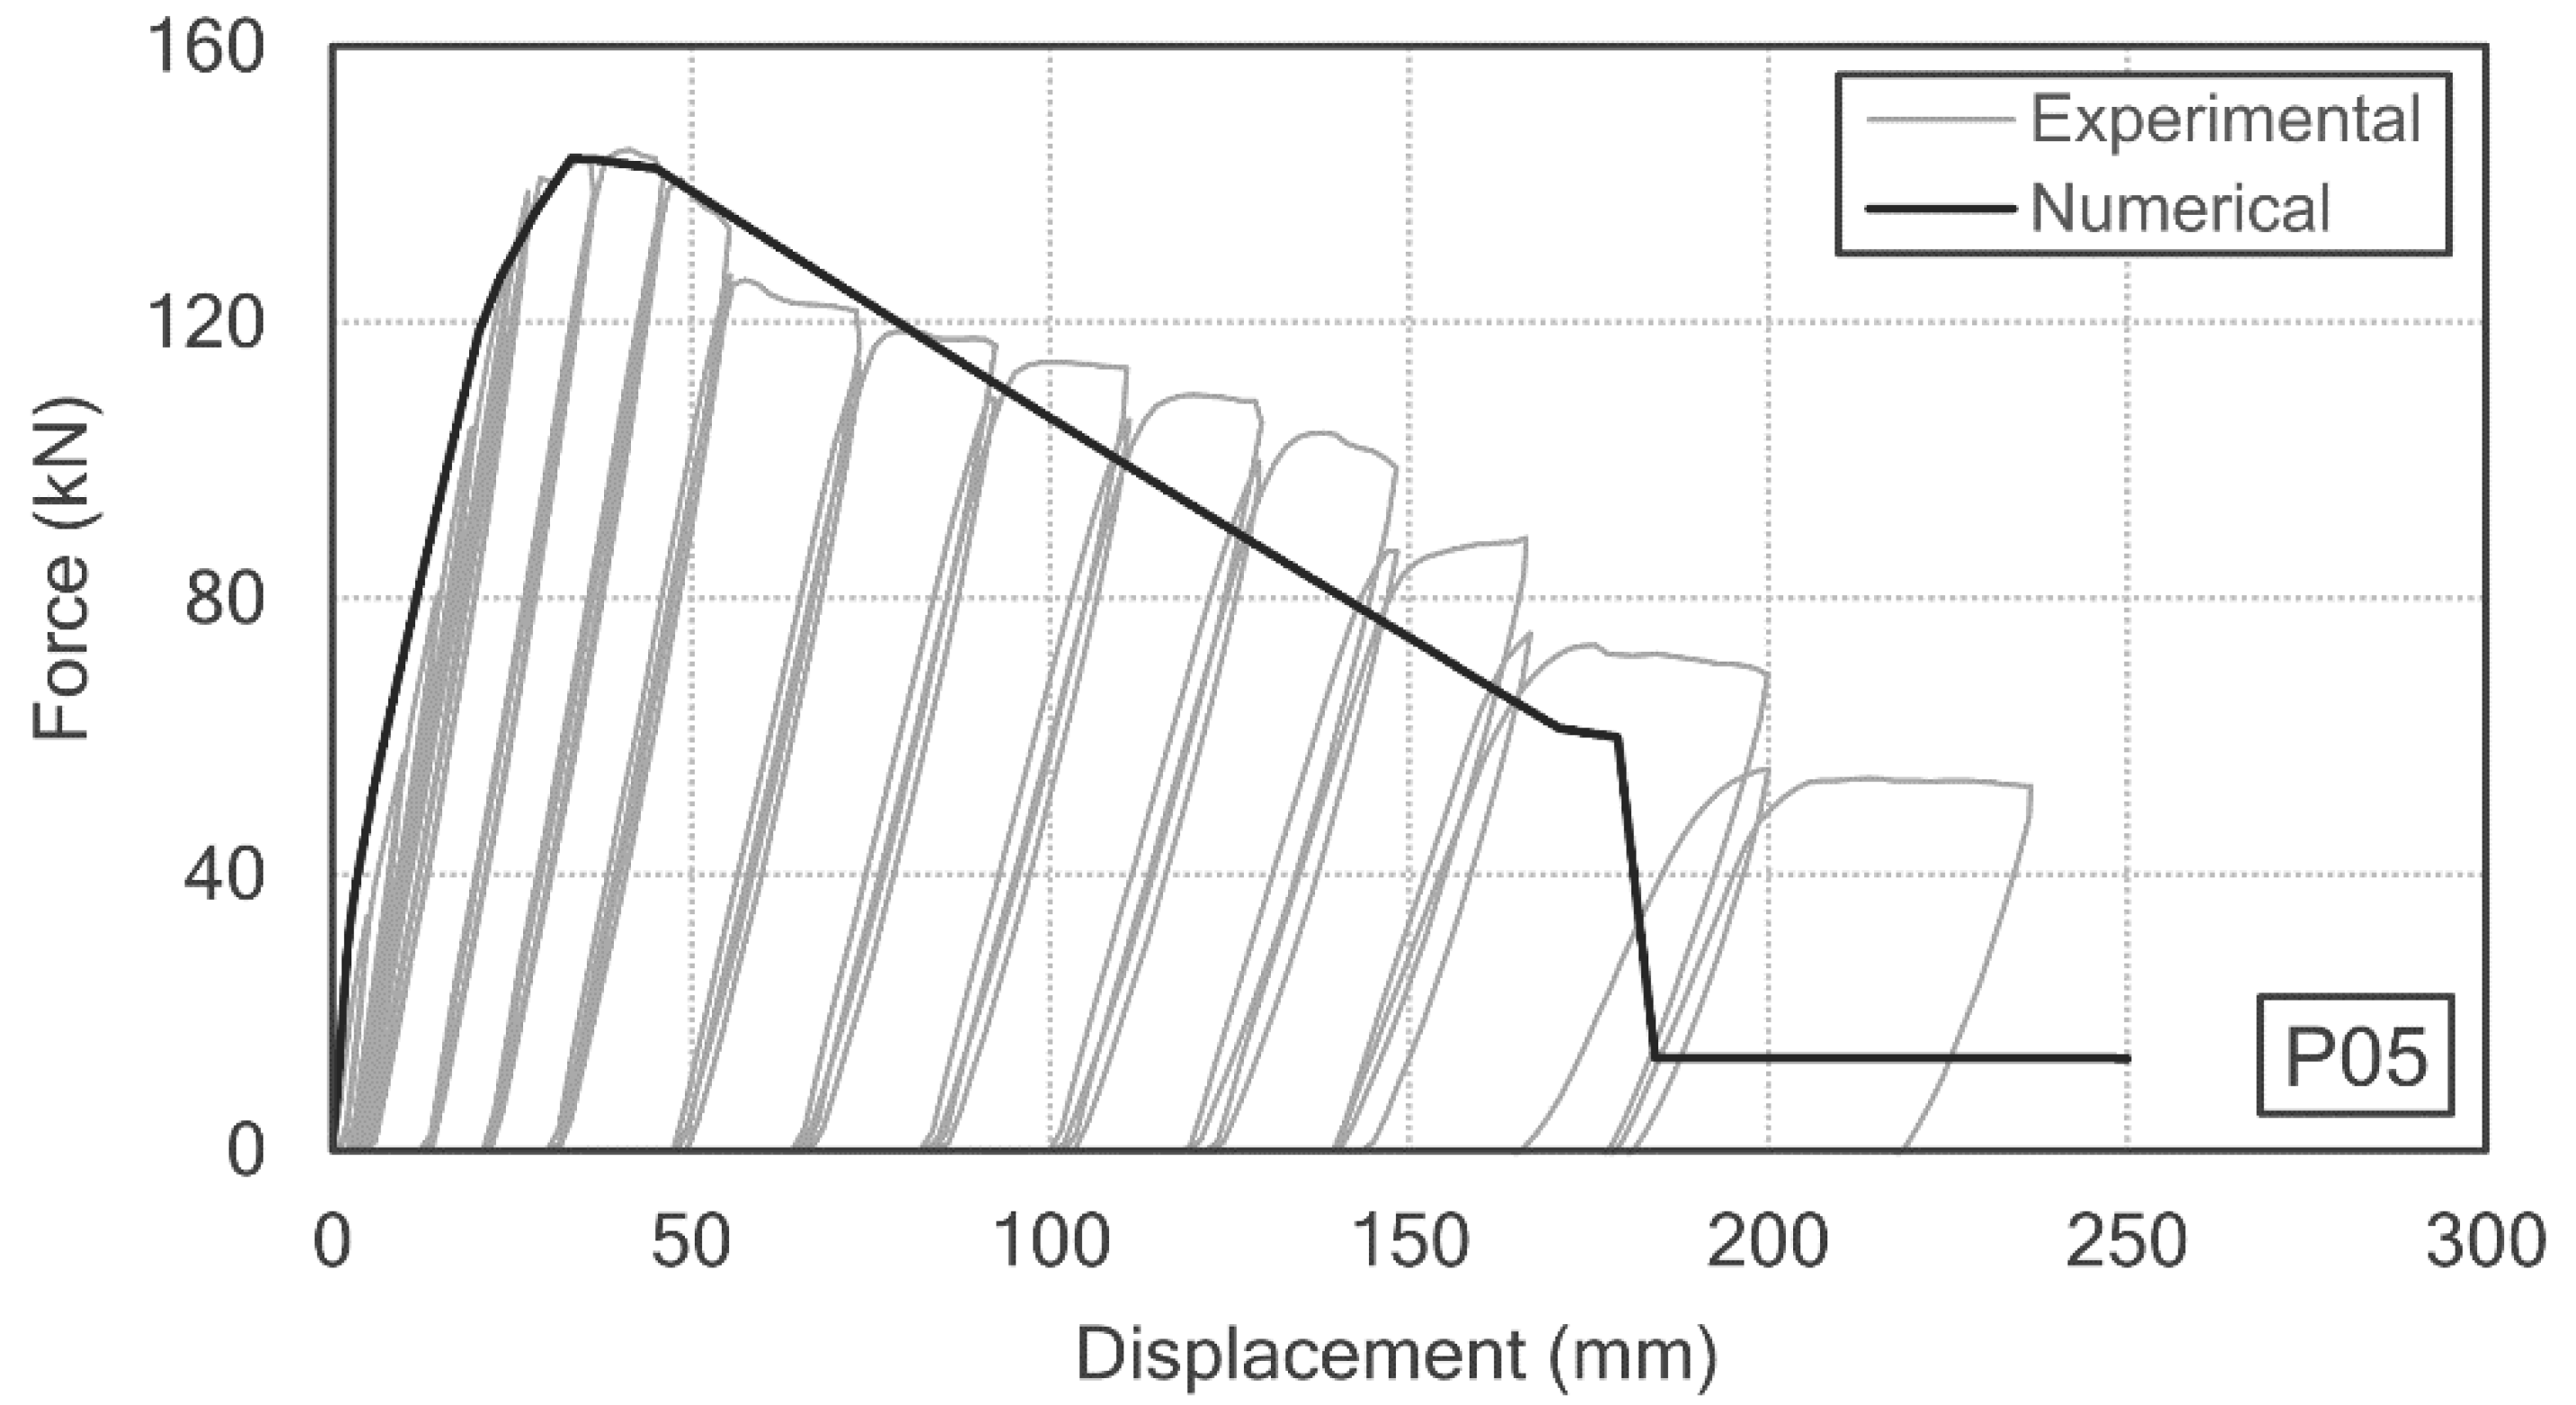
Prototype P05 was simulated to compare it with P04. It showed a similar resistance, but showed alower ductility than the steel-embedded cross-section. The maximum displacement was 250 mm (Figure 12 and Figure 13).
The maximum load in the center of the beam that the section was capable of resisting was 145 kN in the simulated model, which was also 145 kN in the test (Figure 14).
It was possible to simulate the decrease in the force–displacement graph. With 200 mm of displacement, this simulated section was in agreement with the moment-curvature graph obtained from the solid model.

3.2. Frame Structure in 2D

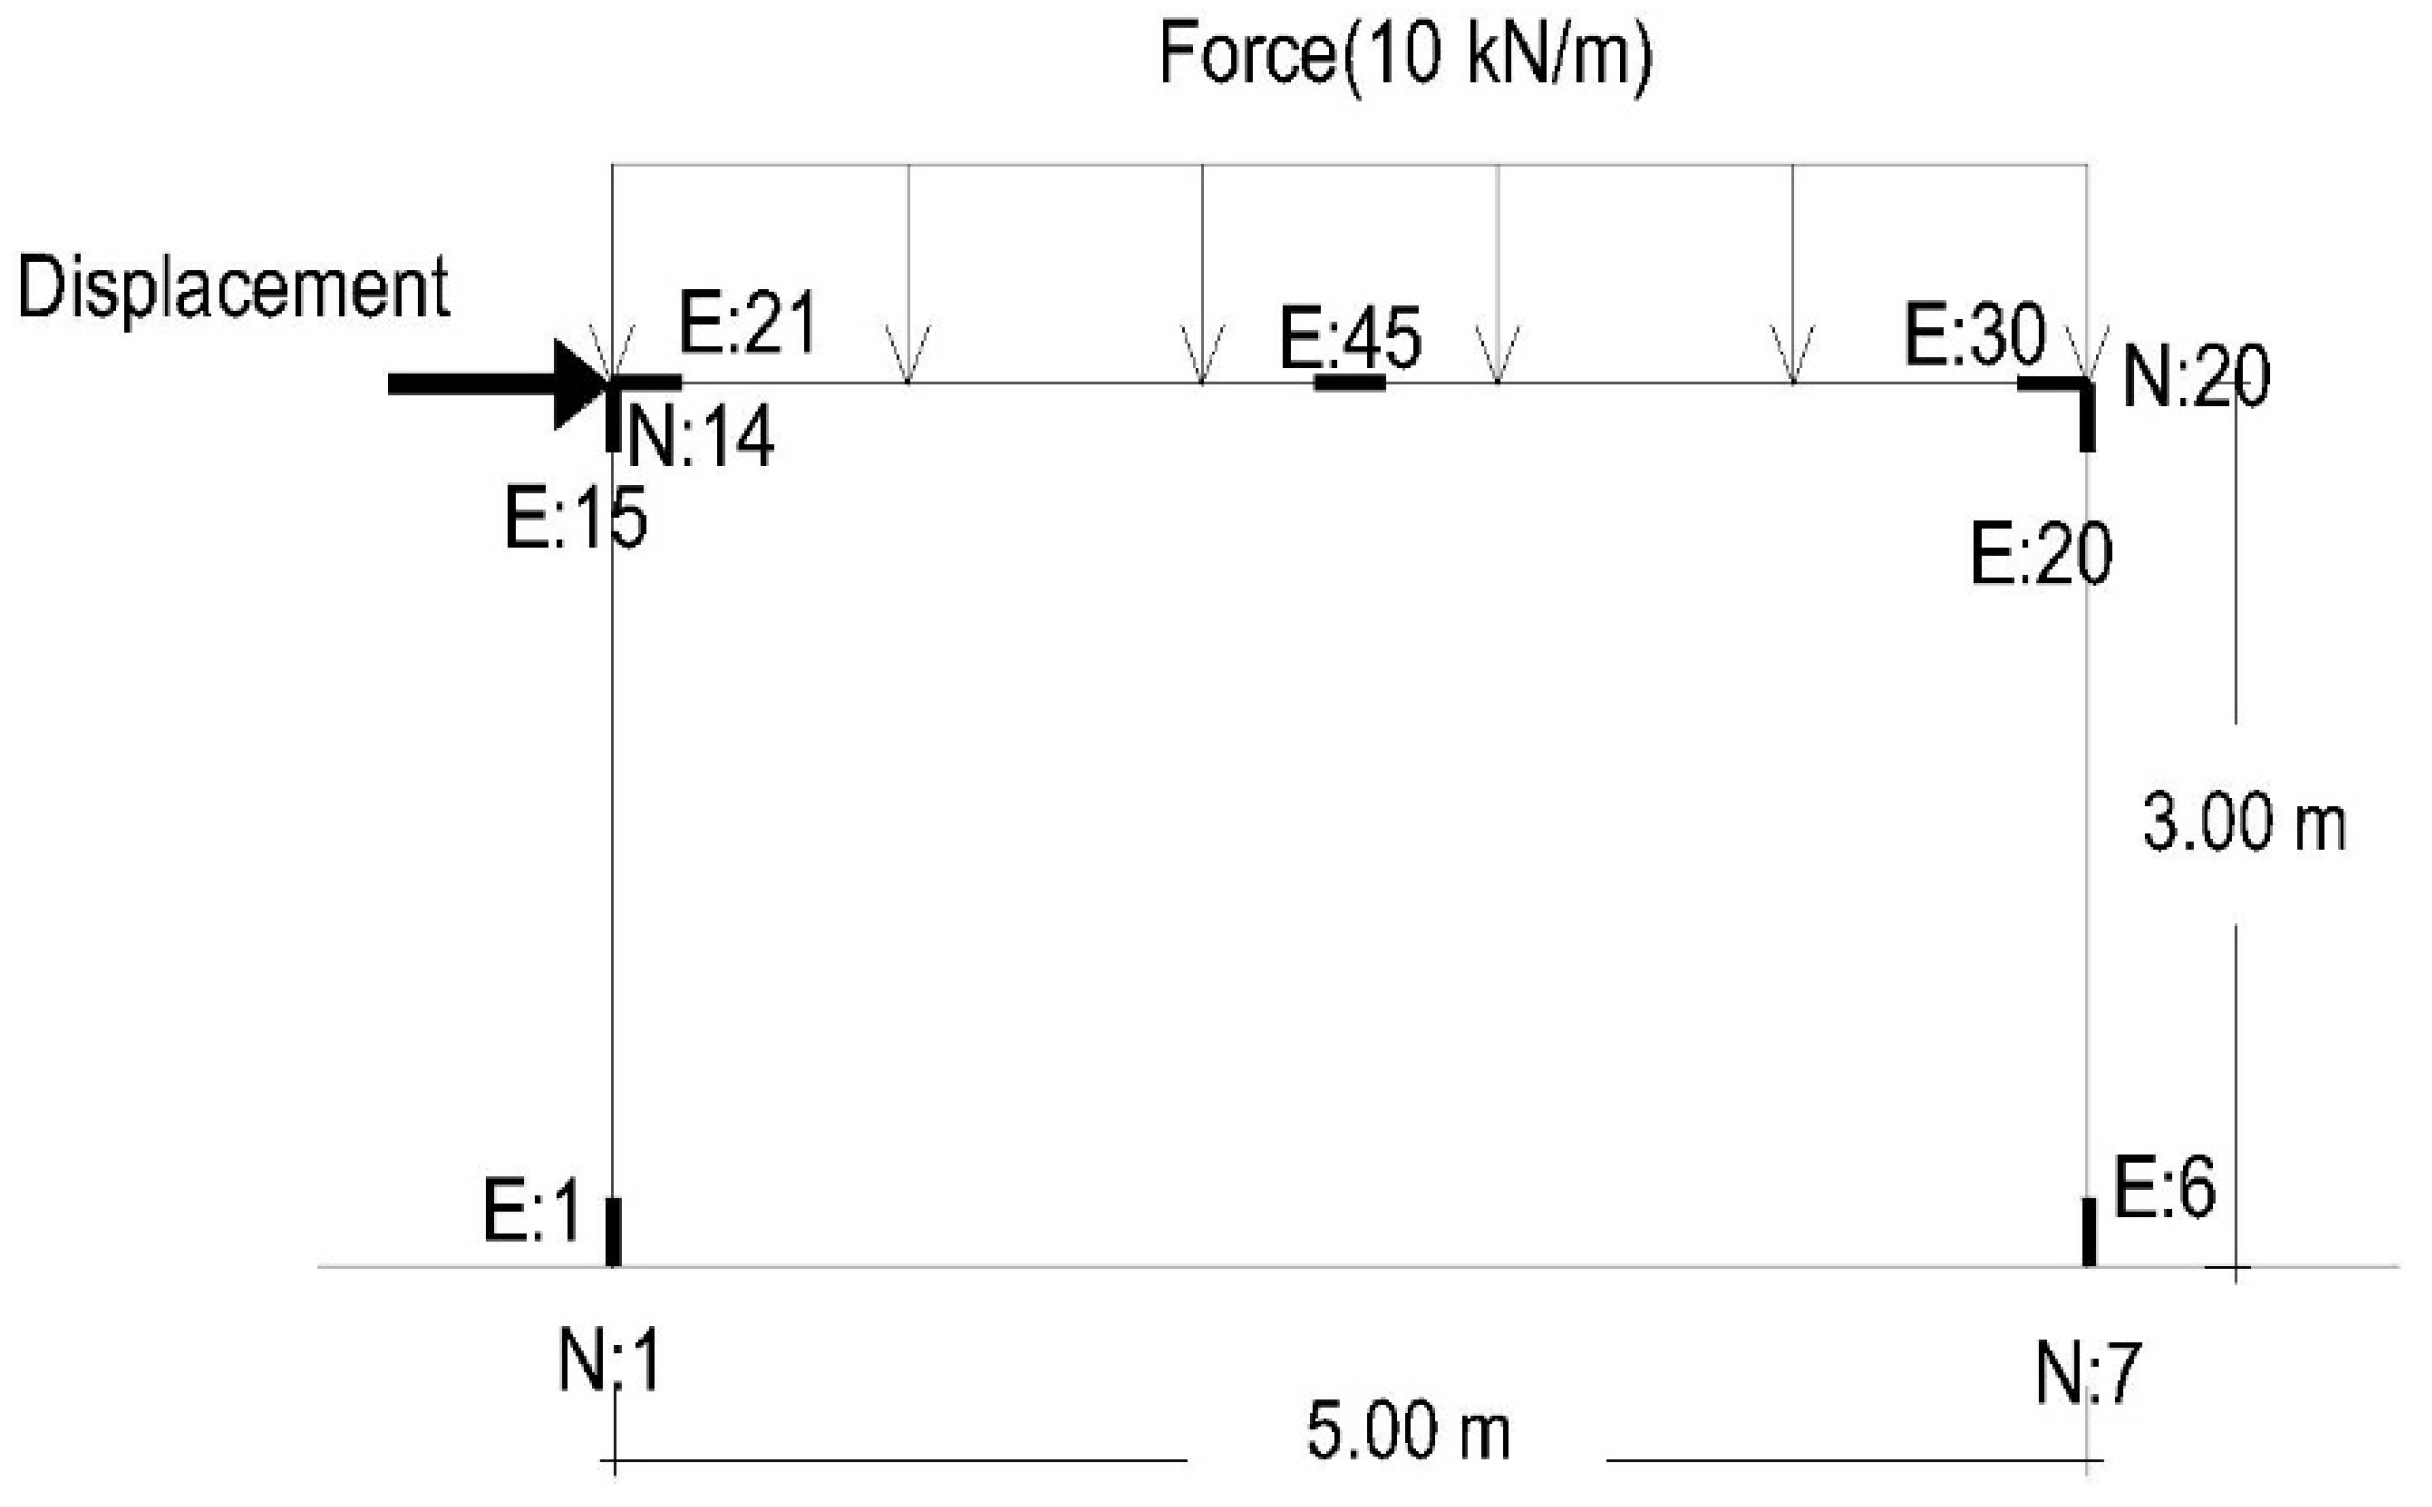
With the procedure validated in the two previous sections, we analyzed a classical frame structure of two columns and one beam to compare the maximum load, along with a horizontal displacement imposed on the top of the left column, that was able to be withstood by several arrangements of reinforcements.
To analyze the plastic behavior, an increasing horizontal displacement was imposed to collect data on the evolution of the variables during both plastification and the post-critical branch.
The beam was subjected to a vertical load in order to simulate the weight of the slab and the overload (10 kN/m) (Figure 15).
As it is a simplified frame model, the calculation was performed in a short time despite the nonlinearities (Table 2).

3.2.1. Frame A (RC P03 Section)

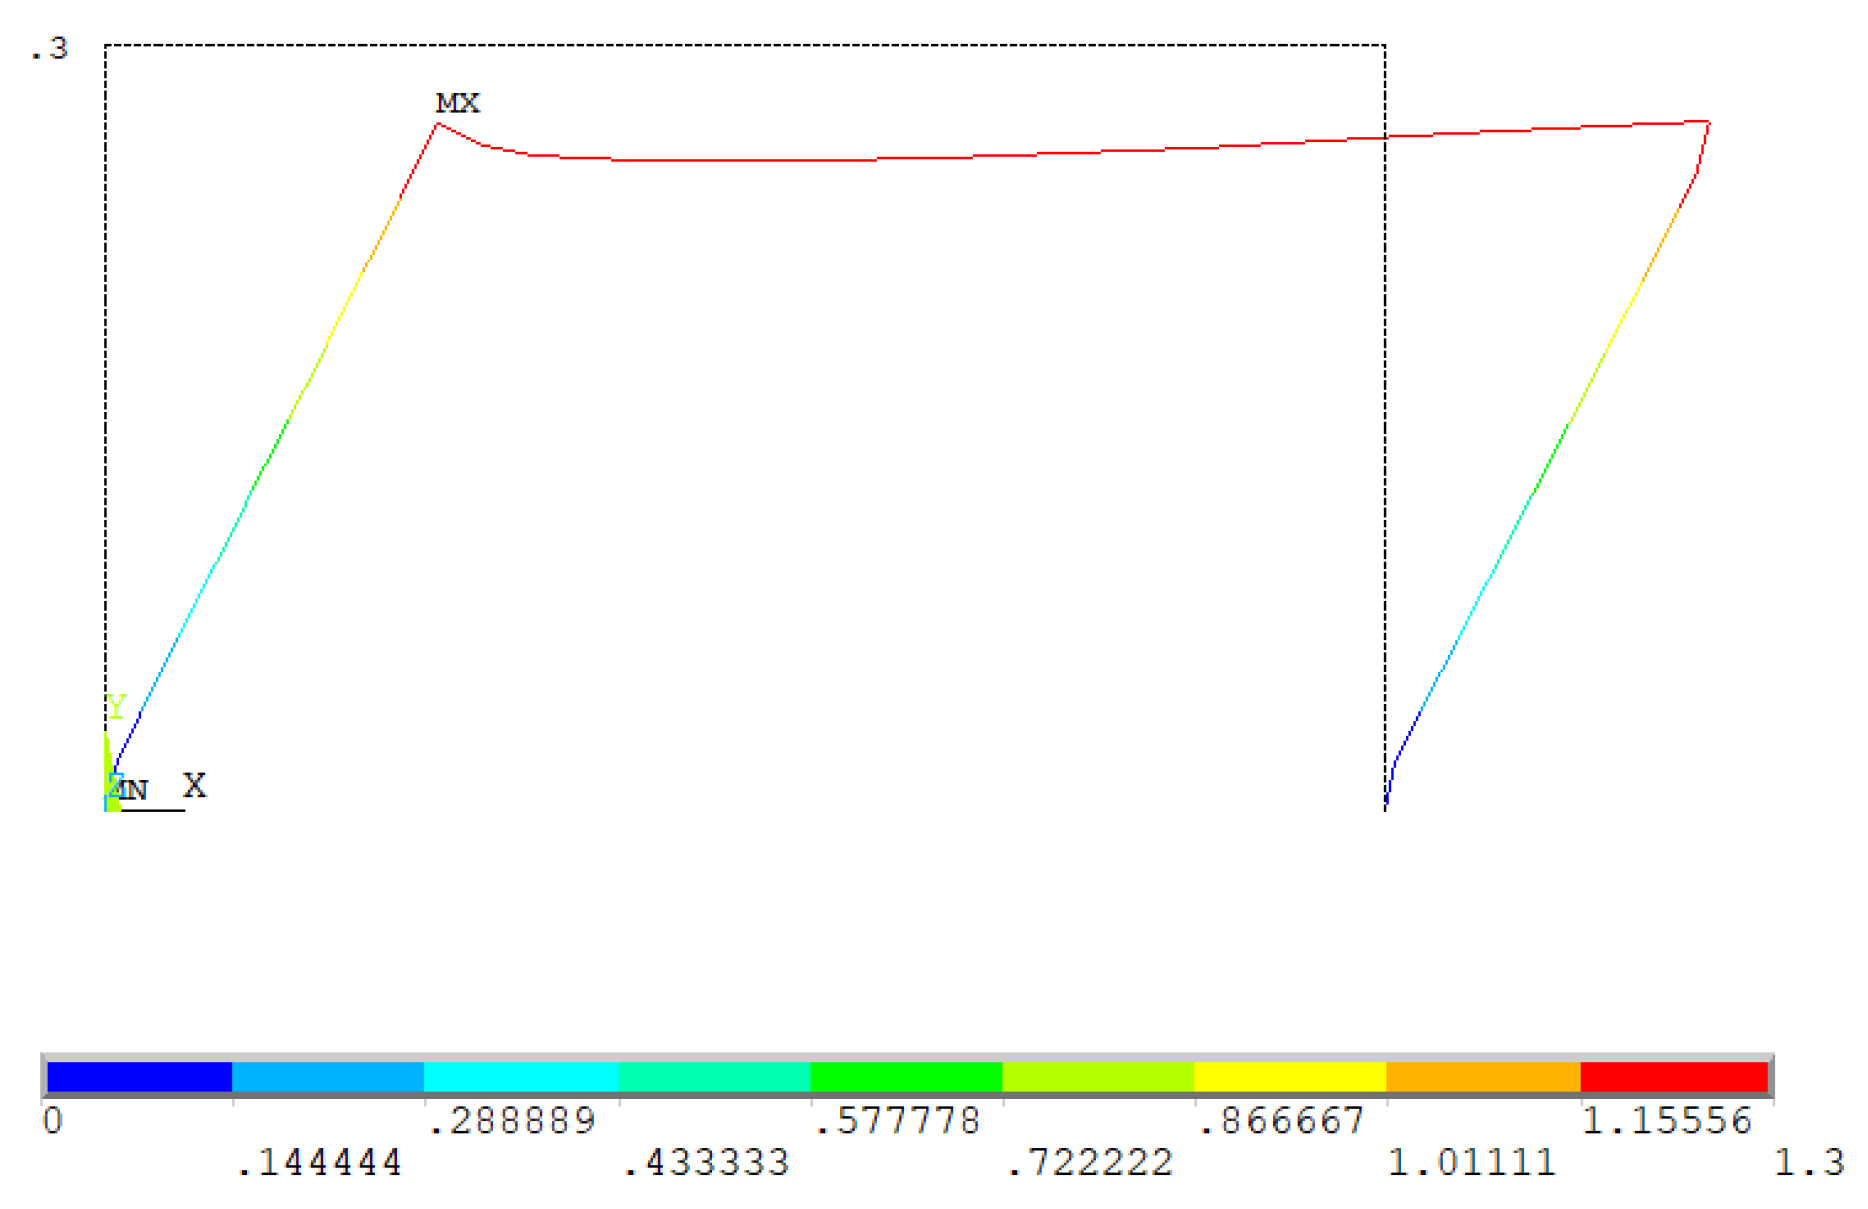
Large displacements were applied to the joint until the maximum curvature value was reached at critical nodes, which was when the break took place (disintegration of concrete and breakage of reinforcements) (Figure 16).
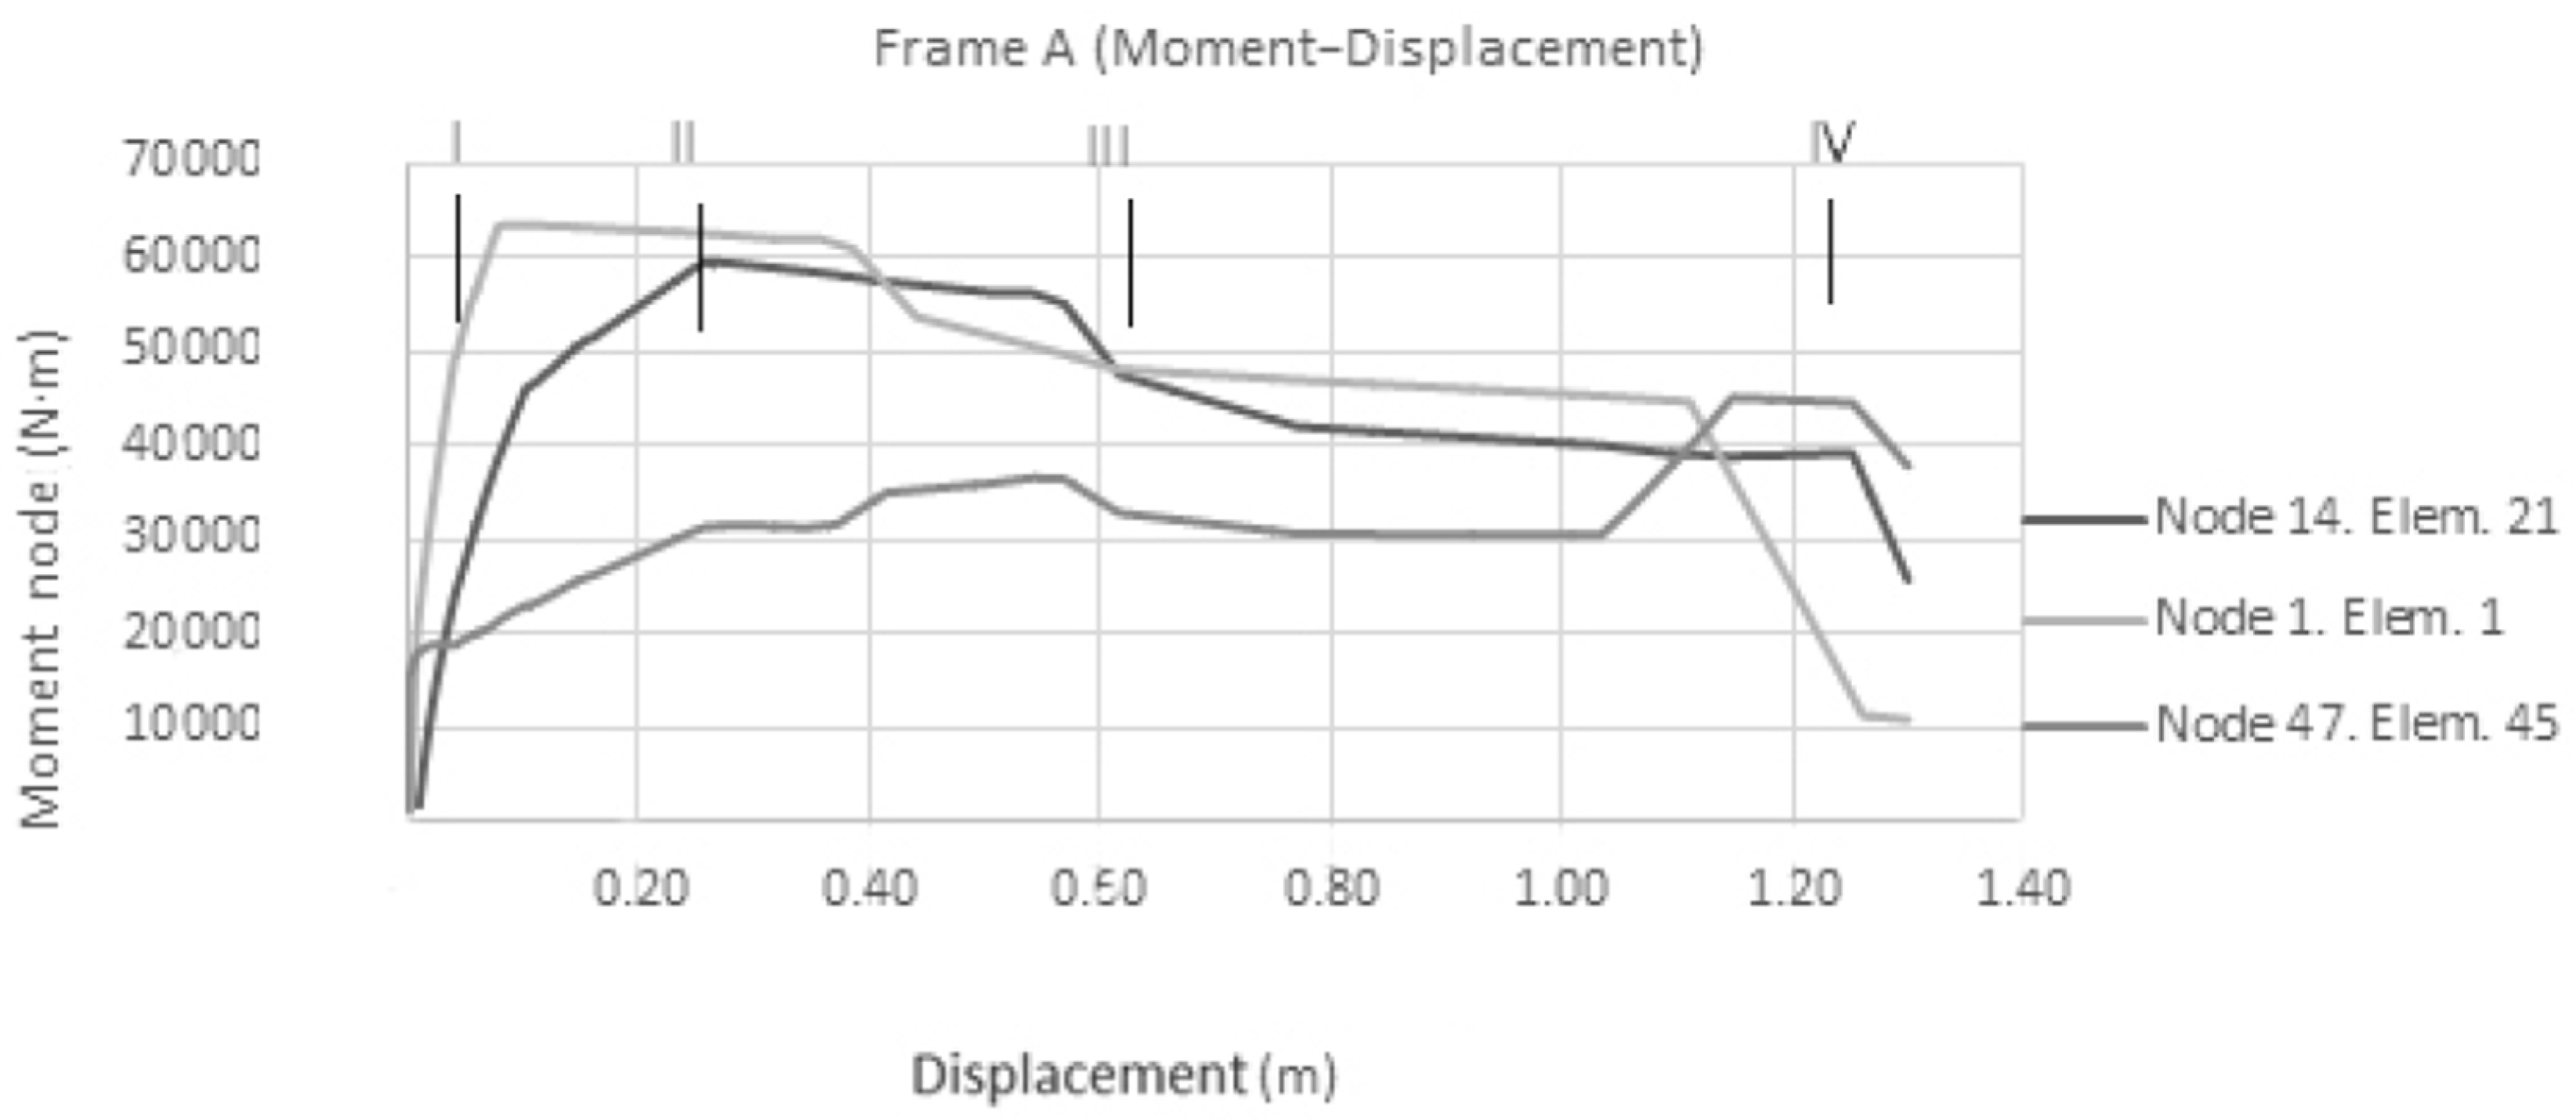
The different nonlinear calculation steps correspond to points I, II, III, and IV in Figure 17.
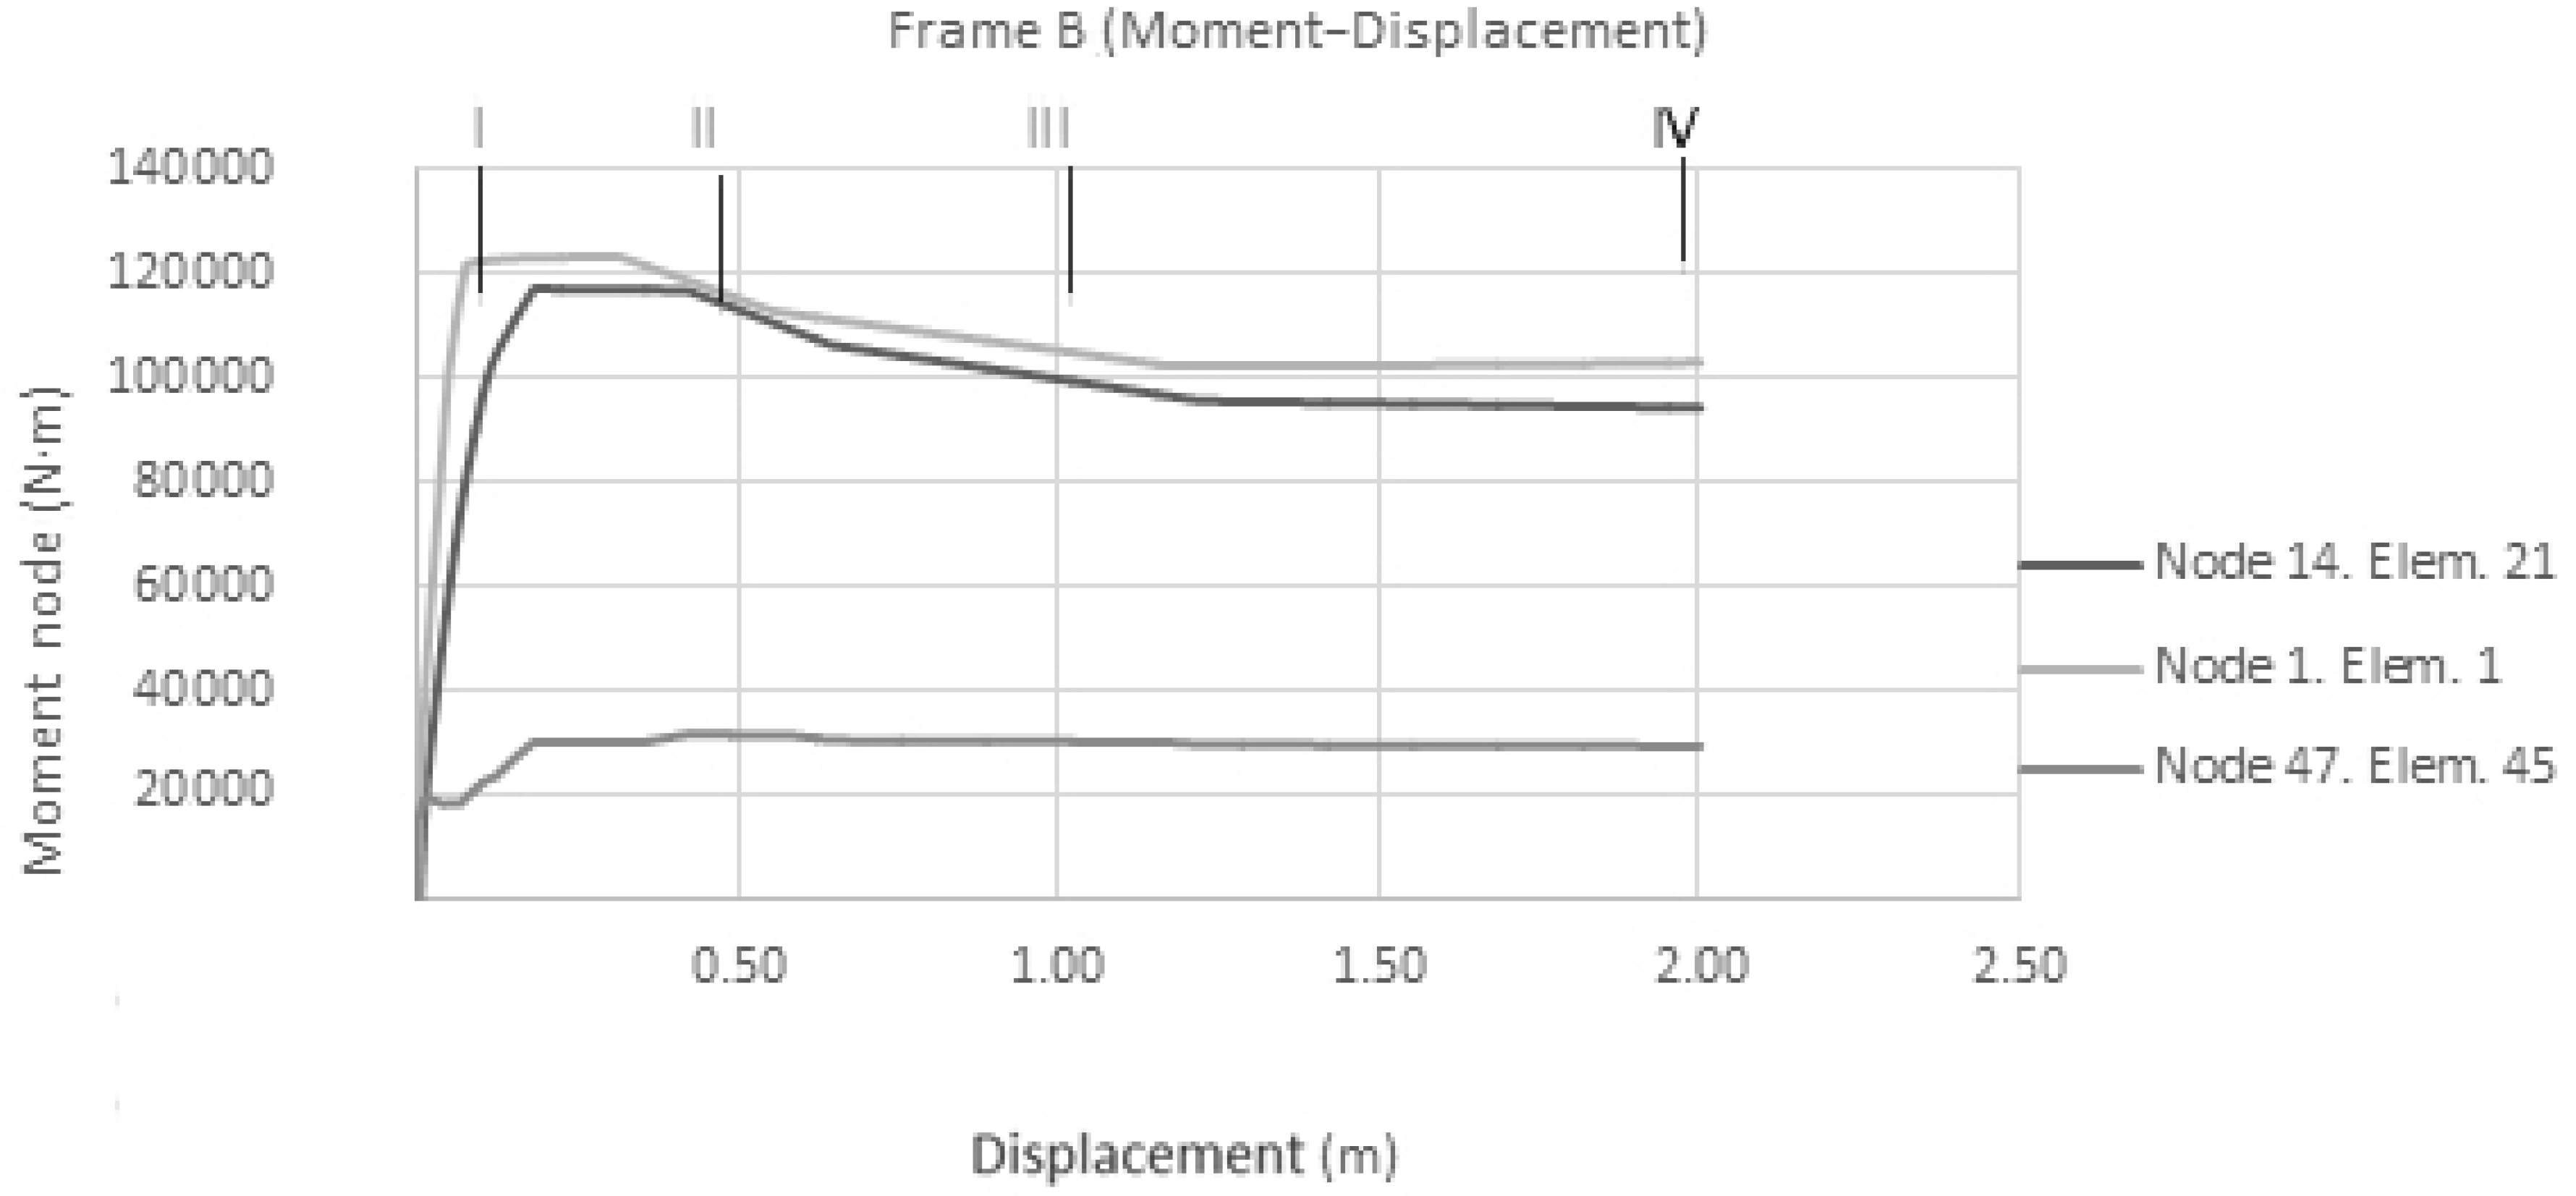
It was important to obtain the graph of the moments in the elements near the joints in relation to the displacement imposed on node 14 in order to compare the different behaviors of the nodes depending on the applied displacement and the degree of plastification. The graph of moments obtained (Figure 17) was based on the imposed displacement analyzed at node 14.
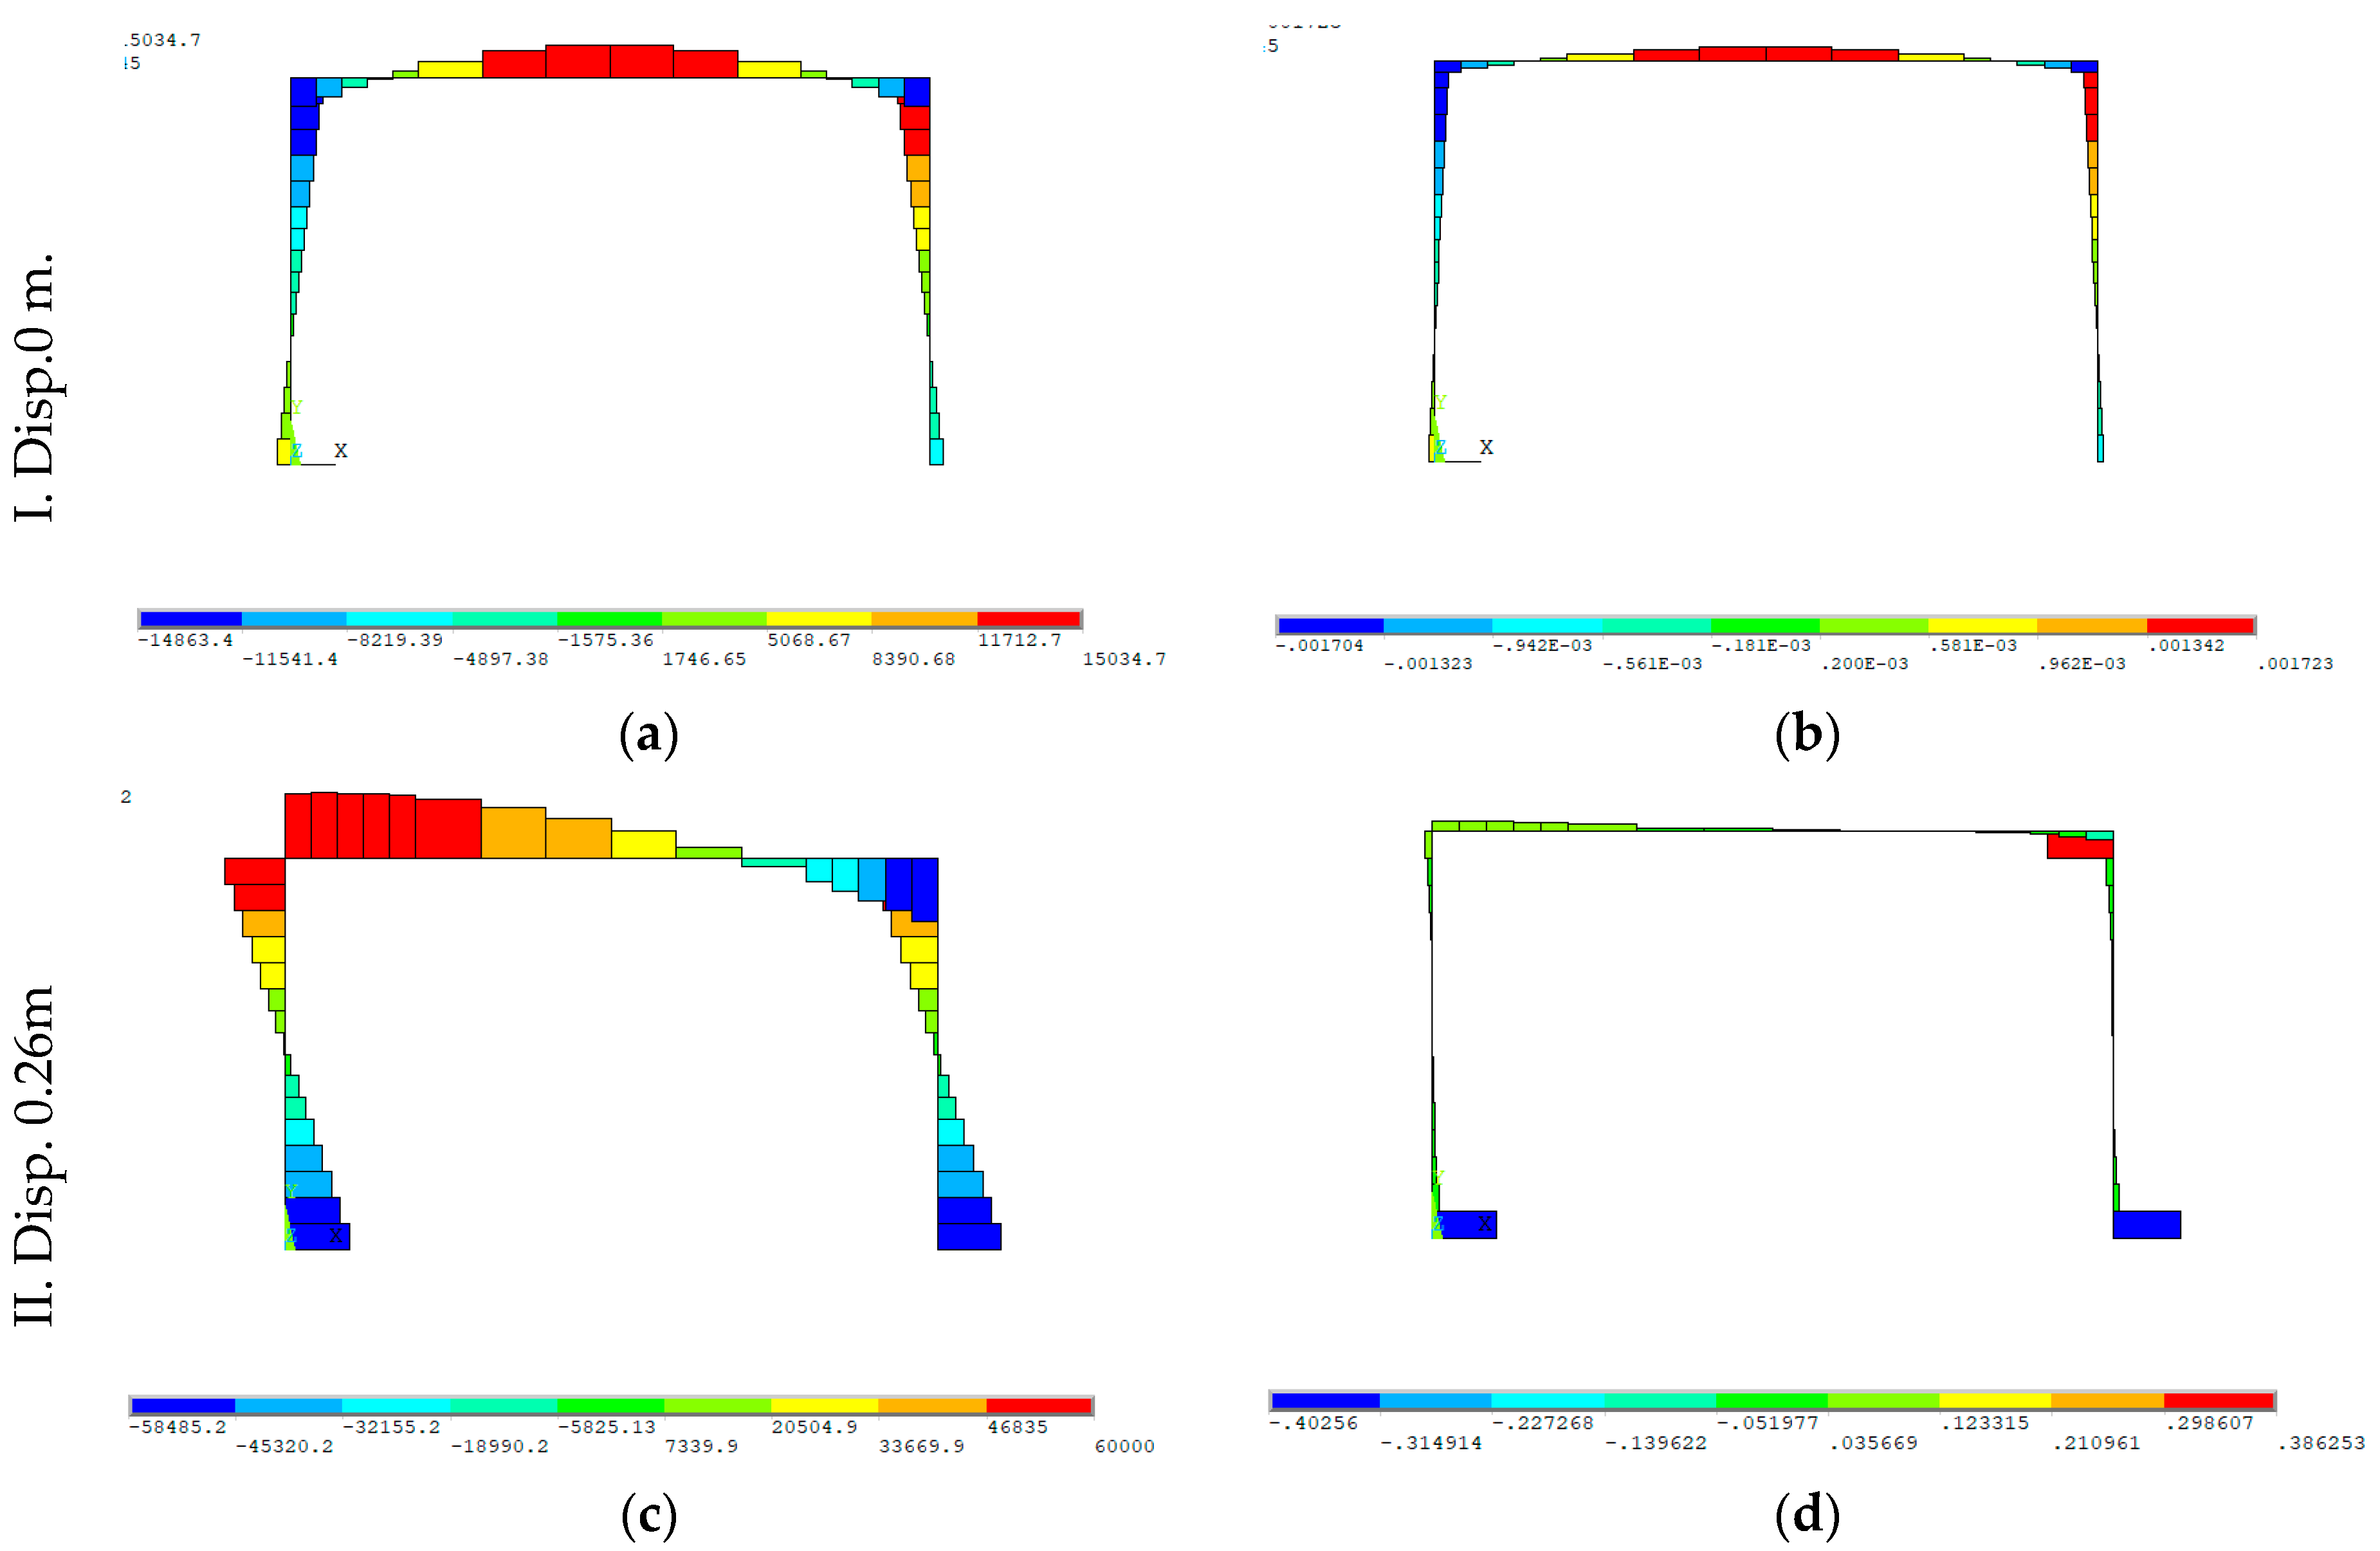
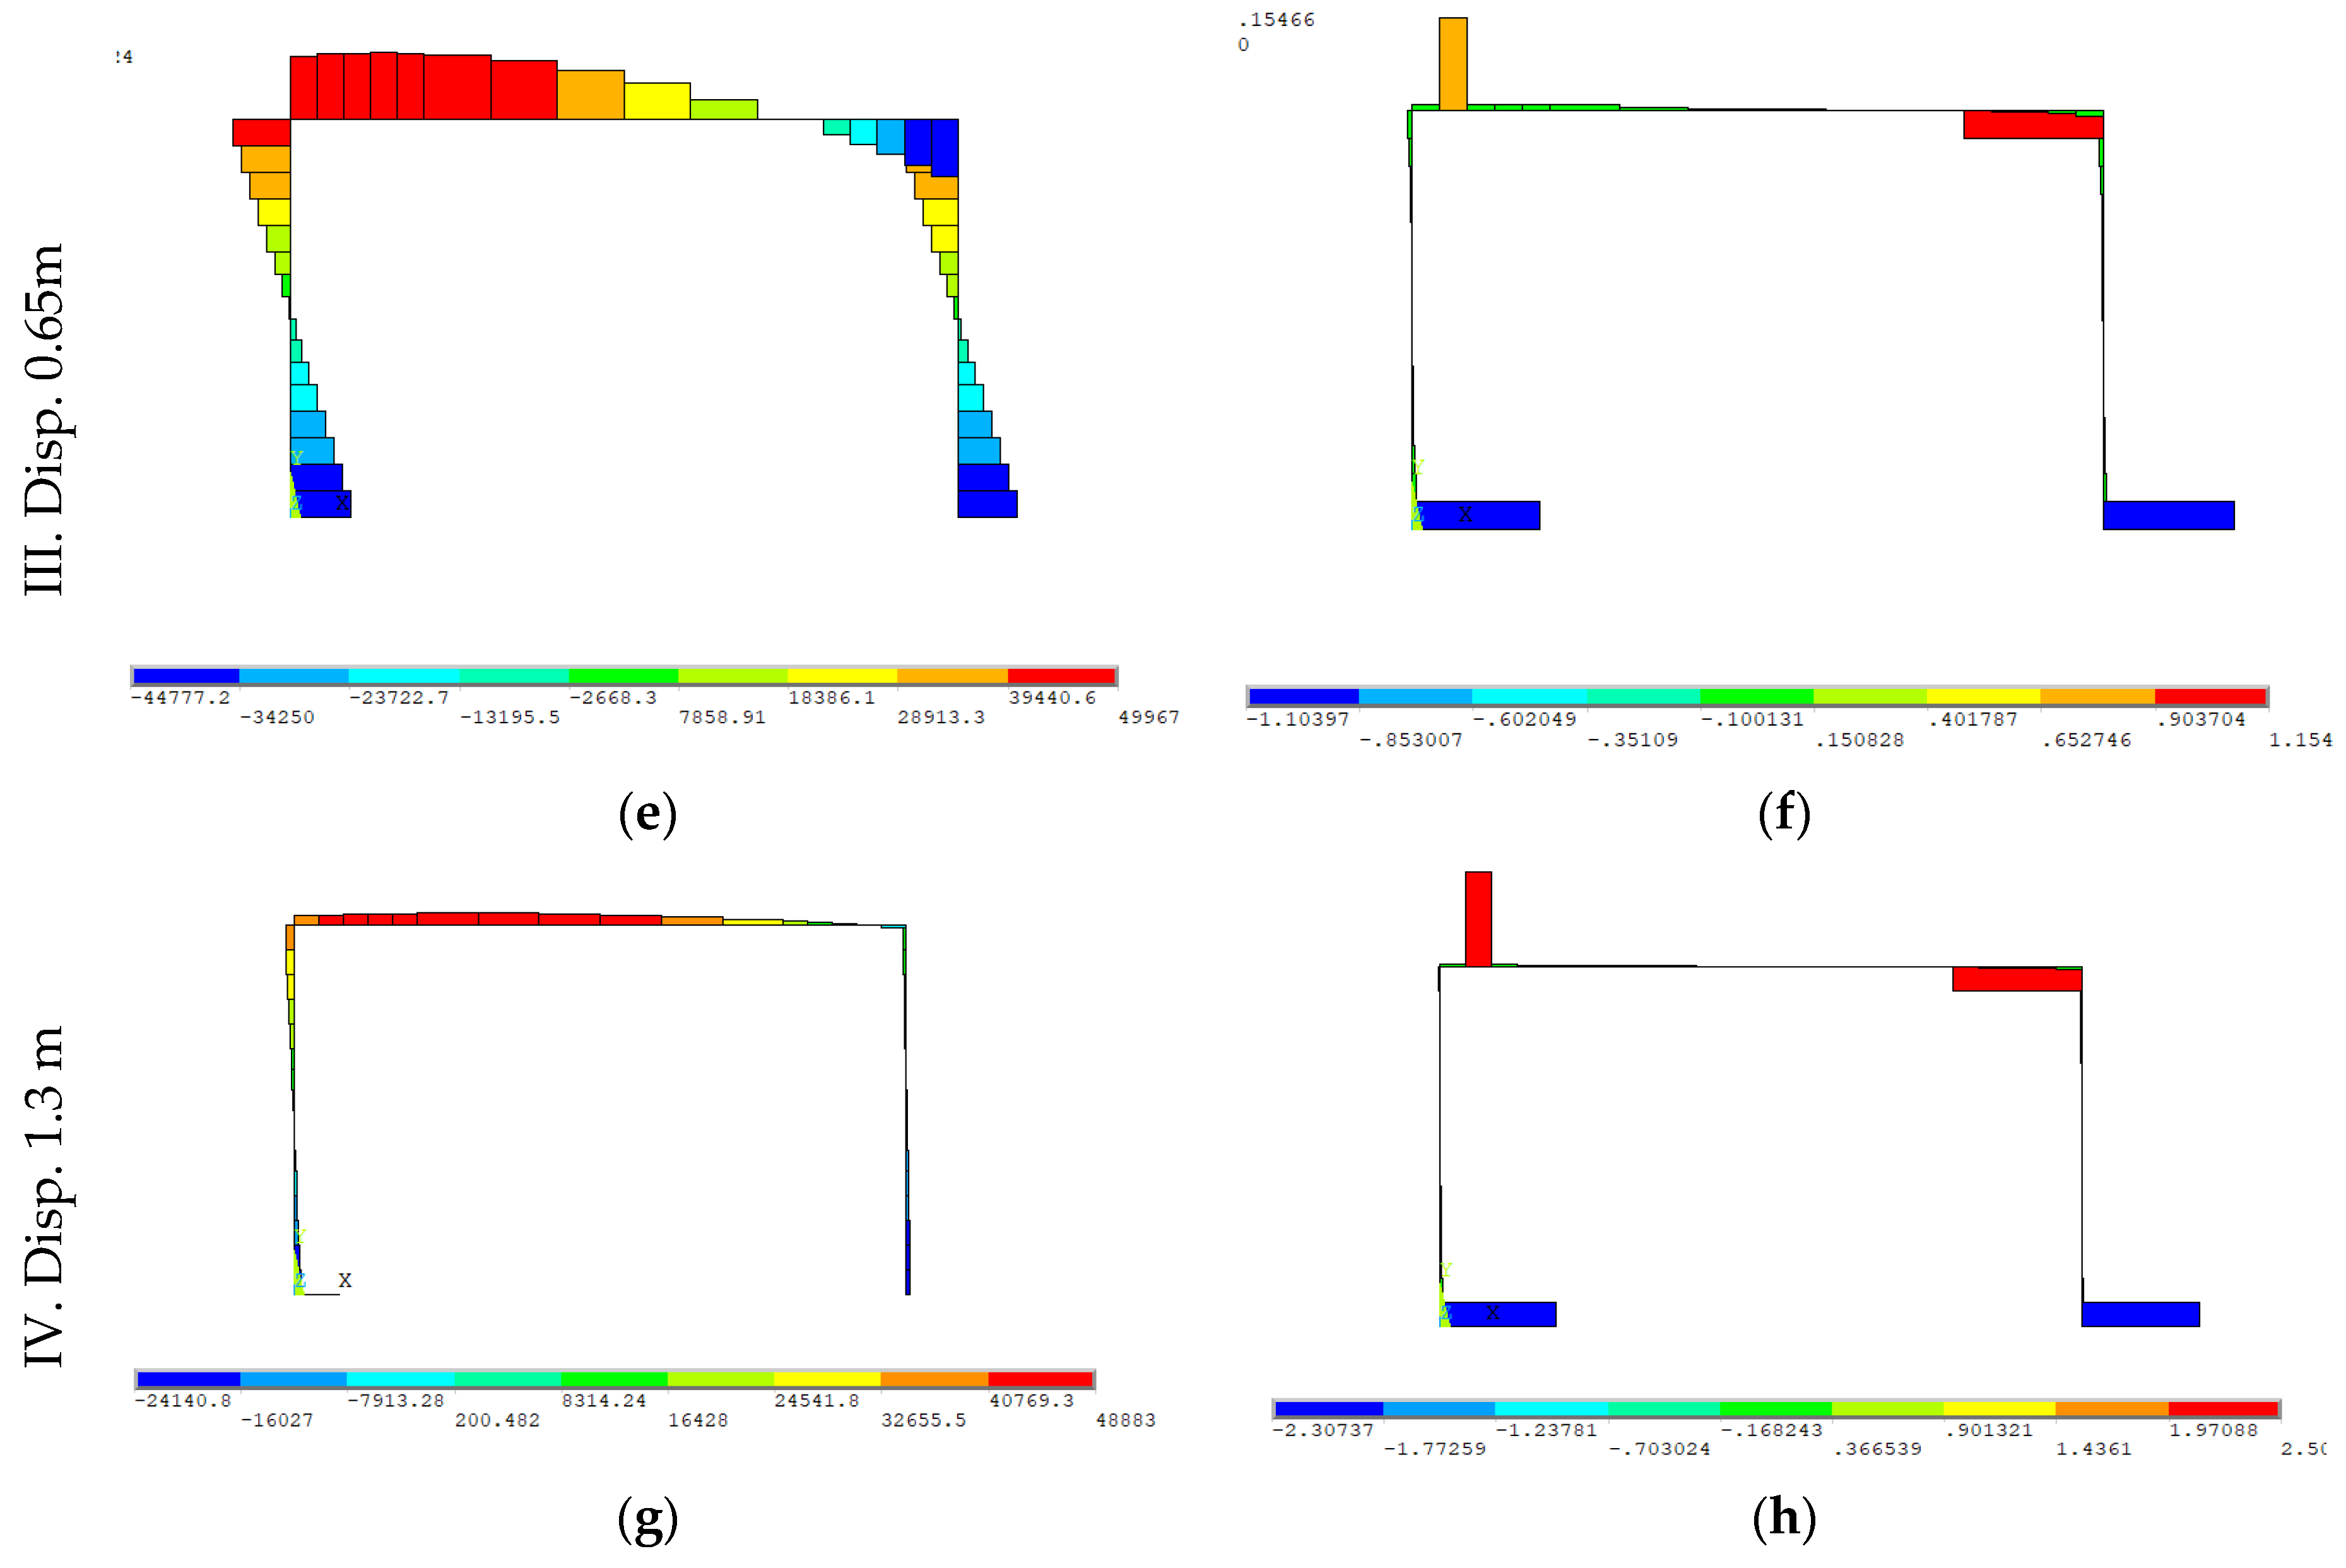
The collapse of the structure was simulated. In parts b, d, f, and h in Figure 18, the different curvatures of the modeled elements and their evolution with the imposed displacement can be seen.
The appearance of hinges in the structure was seen with the very high curvature of the section. In Figure 18(I), the elements were found in the area of the proportional M–χ graph and had not reached the maximum moments. In Figure 18(II), some elements reached the maximum moment of the M–χ graph and began to plasticize. In Figure 18(III), some elements near the joint exceeded the maximum moment and the curvature increased considerably. Plasticization was intense, resulting in the development of high curvatures and hinge joints. The structure’s strength thereby diminished. In Figure 18(IV), the values of stresses were very small when elements near the most plastified joint appeared with very high curvatures. They were considered to be plastified joints and appeared as a hinge. As this was a hyperstatic structure, different hinges appeared until the structure finally collapsed.
From the configuration that exhausted the elastic regime, the stresses were redistributed and displacements continued to increase considerably. Finally, the whole strength capacity collapsed.

3.2.2. Frame B (SRC P04 Section)

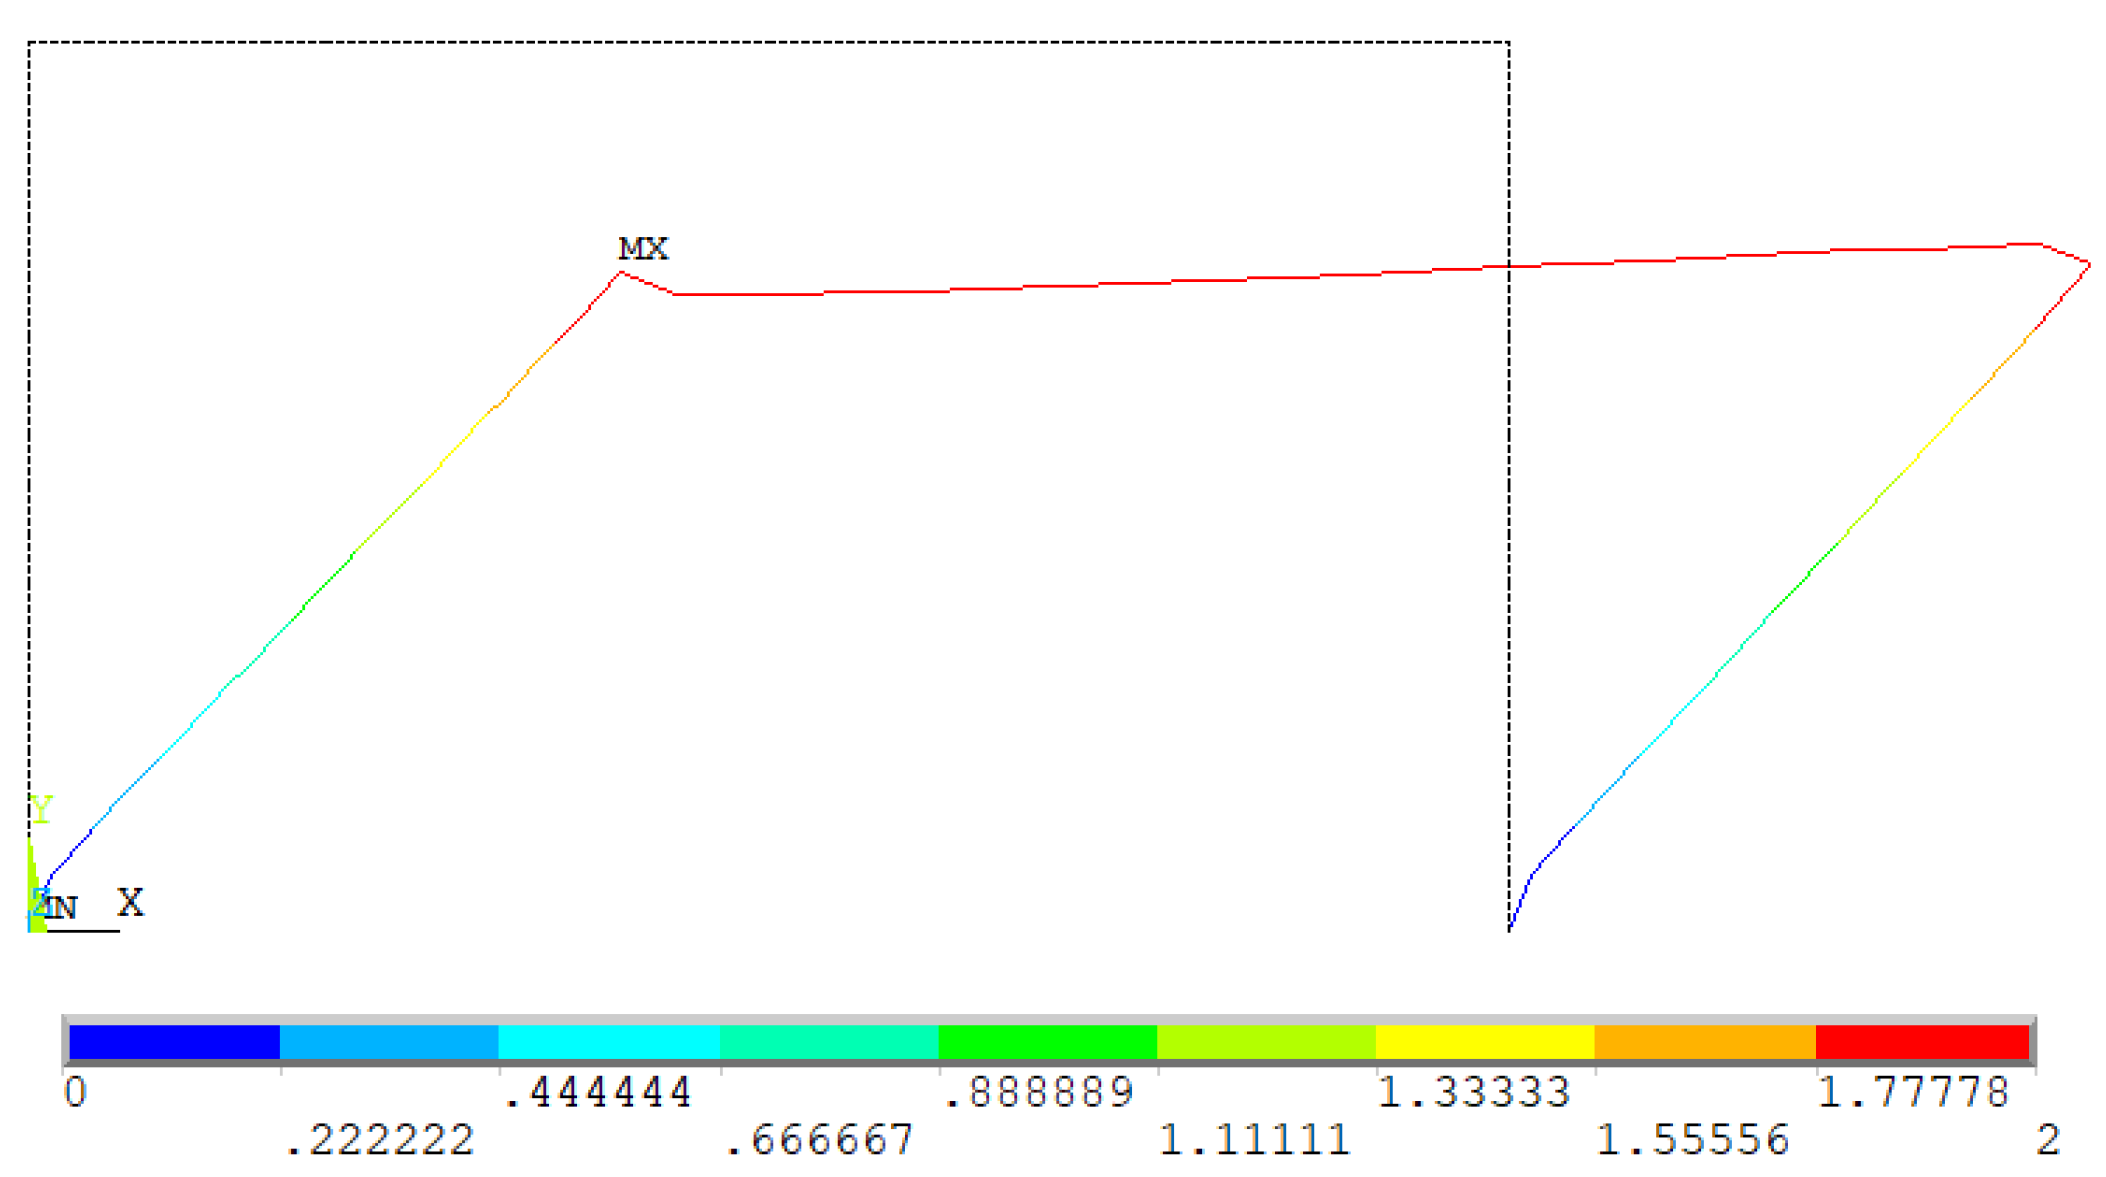
This was simulated with a horizontal 2-m displacement on the beam. Shifts higher than the previous model were reached because the boundary curvature of the SRC section was higher than that of reinforced concrete, which did not allow for such high curvatures (Figure 19).
Thus, the model and procedure to simulate the nonlinear calculation of reinforced concrete beams were validated (Figure 20). The maximum moments coincided with the maximum values of the moment-curvature graph, included to define the frame B section, which was 115 kN·m, and achieved for a 0.4 m displacement at node 14. Meanwhile, the maximum 2-m displacement at node 14 gradually reduced without reaching the maximum curvature of exhaustion. In the first calculation steps, the maximum moments were reached by increasing the curvature, and with it, displacements, and by redistributing the strength (Figure 21).
It was verified that the capacity of the deformations was much greater than in the simulations modeled with the moment-curvature graph of reinforced concrete for frame A. This solution was able to resist large displacements before the structure collapsed by redistributing the forces and maintaining bearing capacity.

3.2.3. Frame C (RC P05 Section)

The two-column planar frame and one beam were simulated with a horizontal displacement in the lower 1.3 m joint with the moment-curvature graph of the prototype P05 section, which was the same strength in relation to the P04 prototype section but without the embedded steel cross-section.
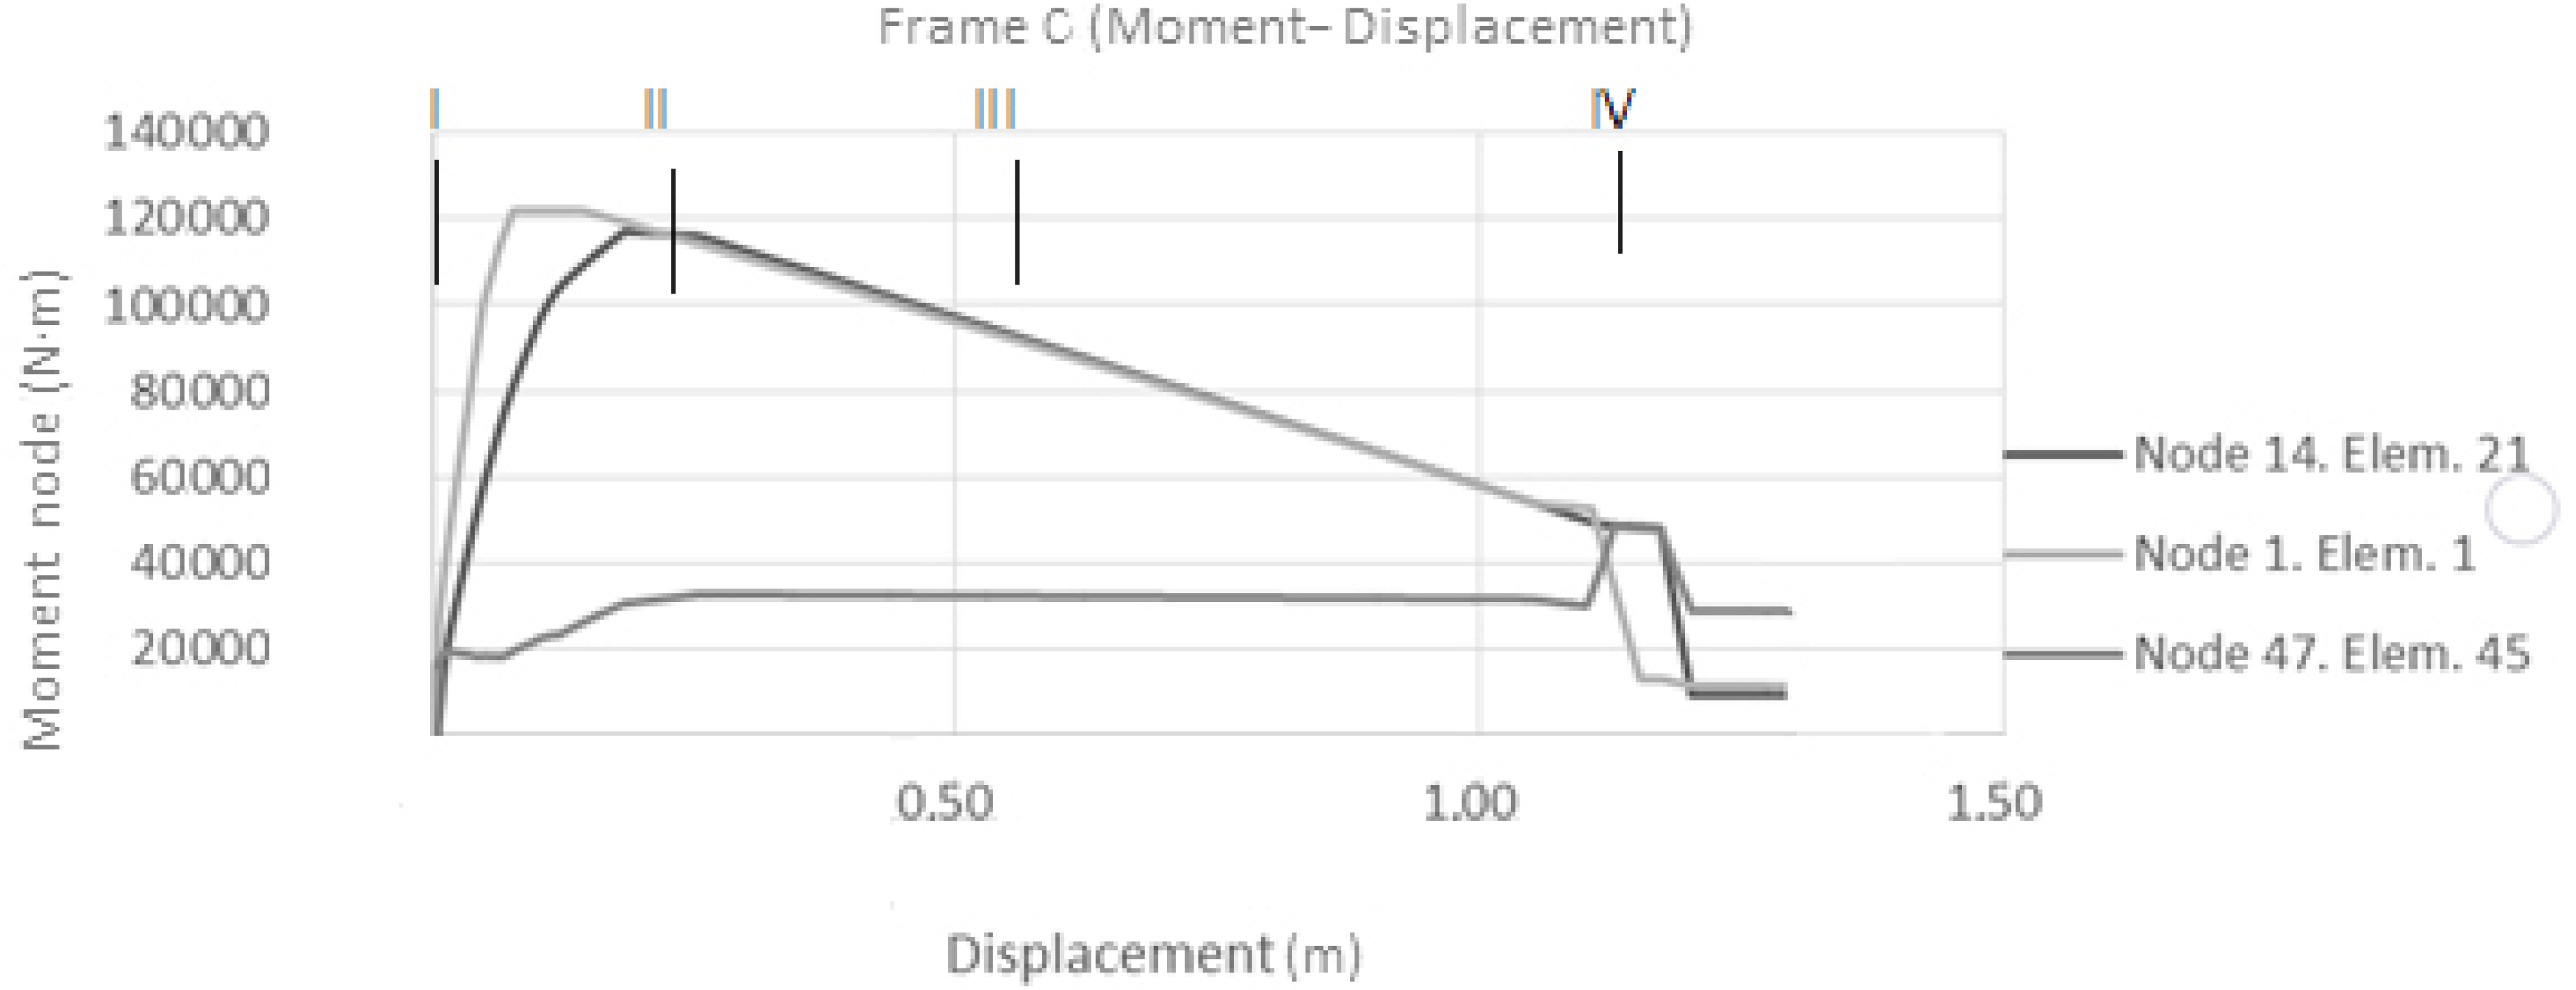
The maximum moment that the frame structure modeled with the frame C graph was capable of resisting was 120 kN·m, which was equivalent to the frame structure modeled with the prototype P04 graph. During the maximum displacement imposed on node 14 (of 1.3 m) corresponding to the last step, a 30 kN·m moment was reached. This corresponded to the greater curvature values of the moment-curvature graph.
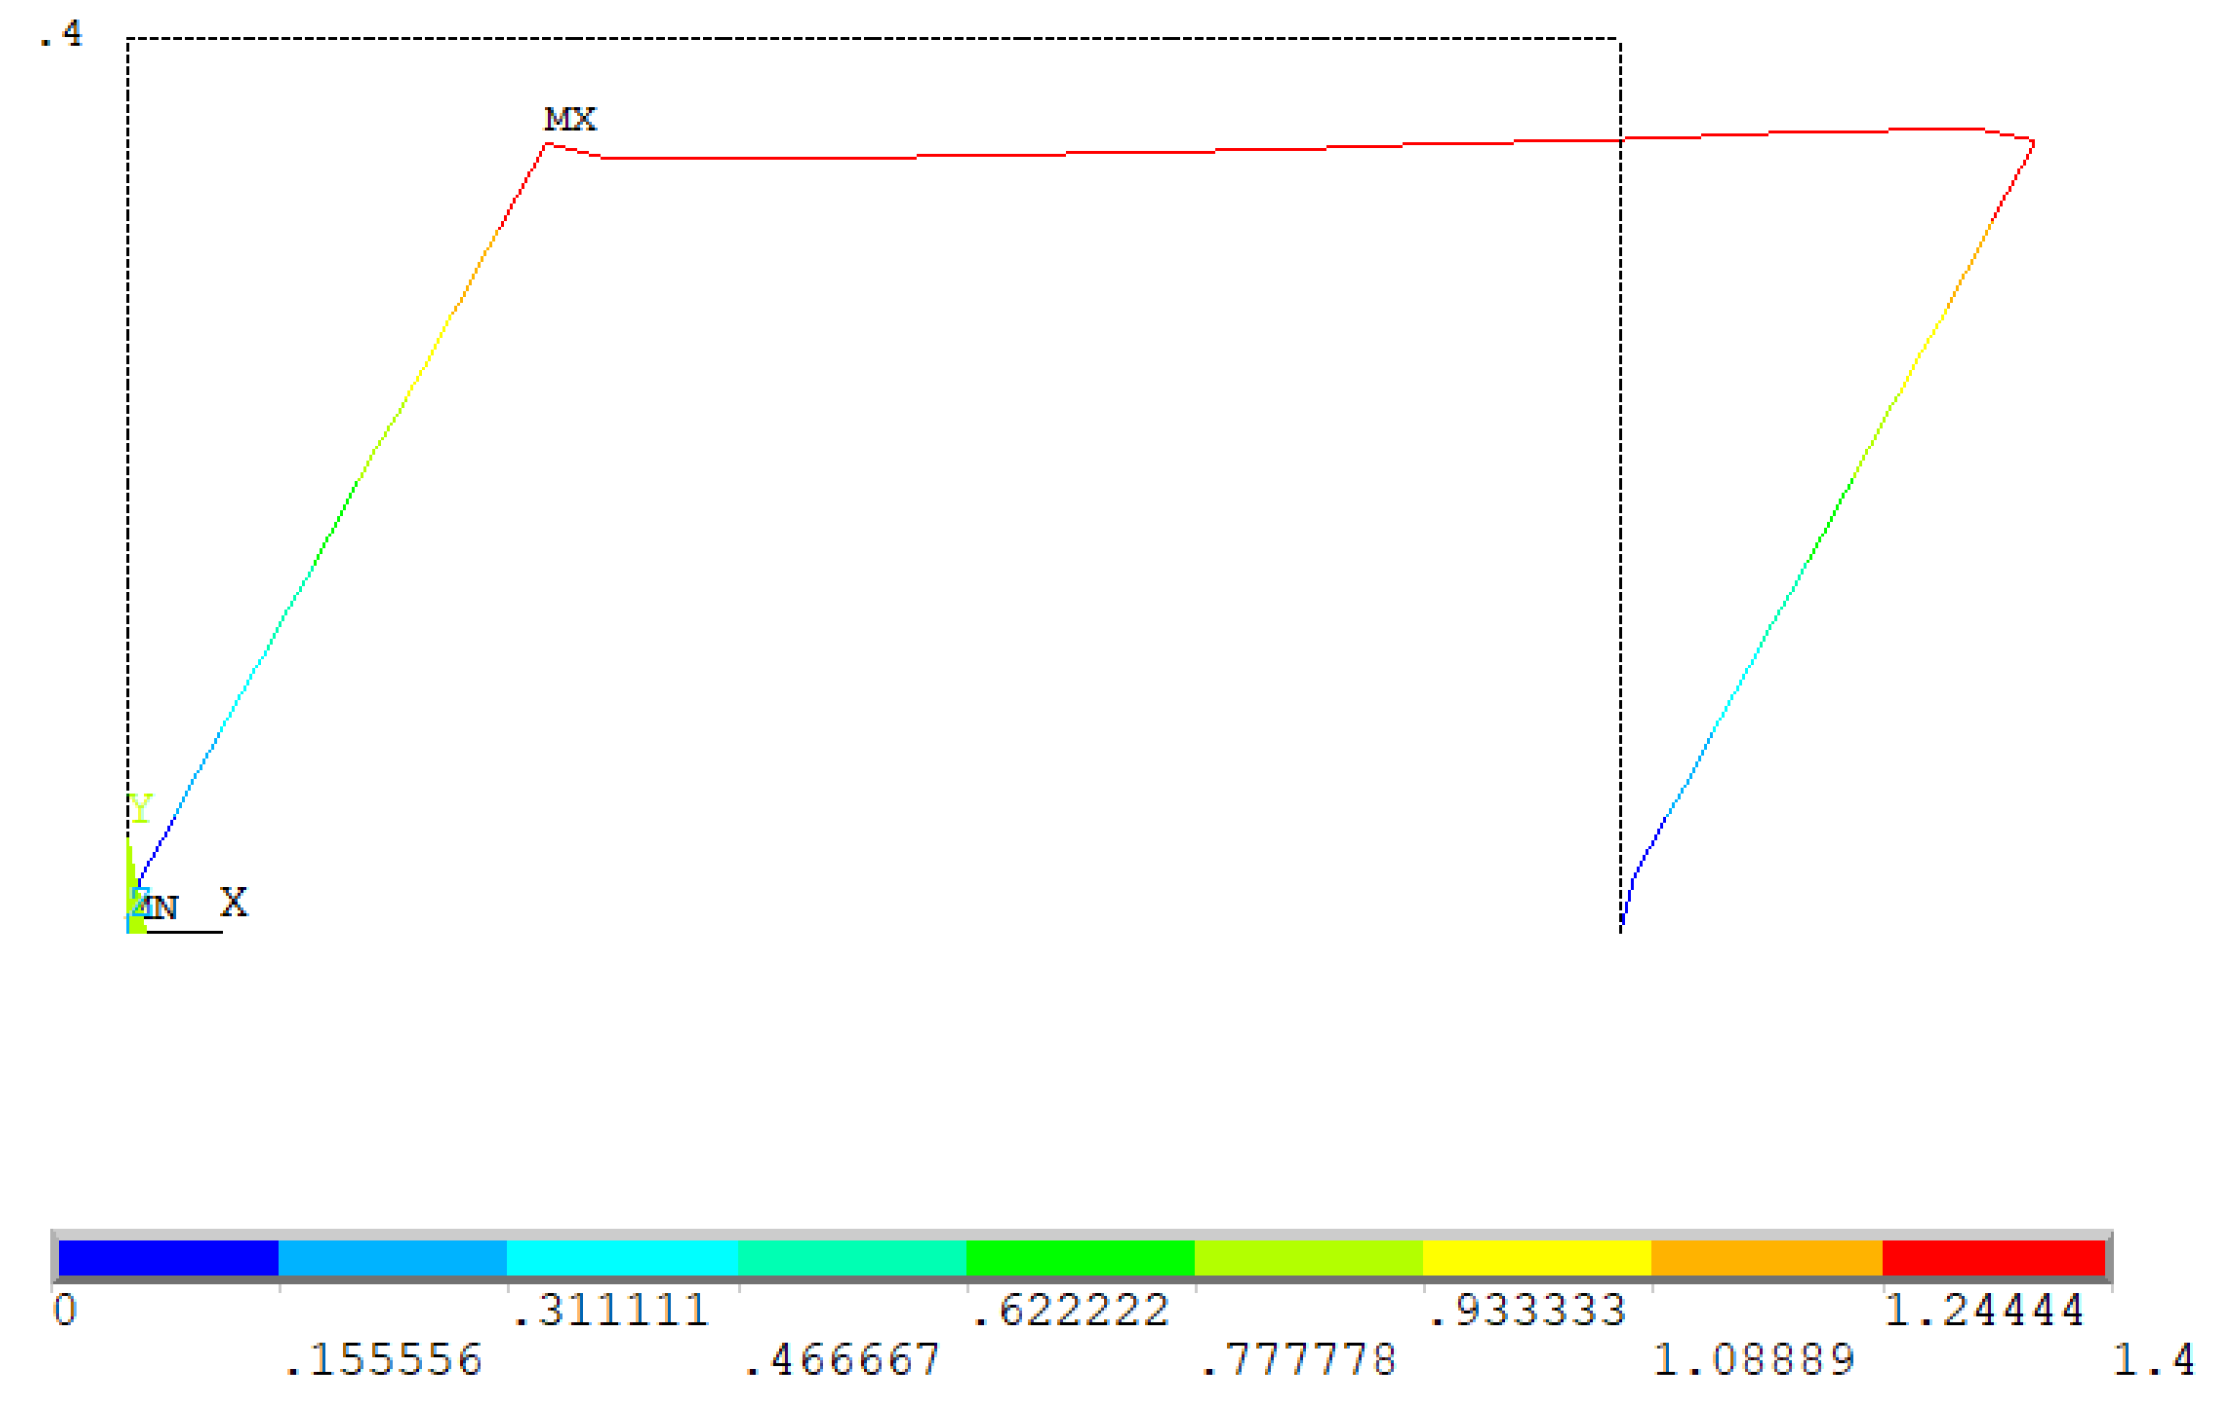
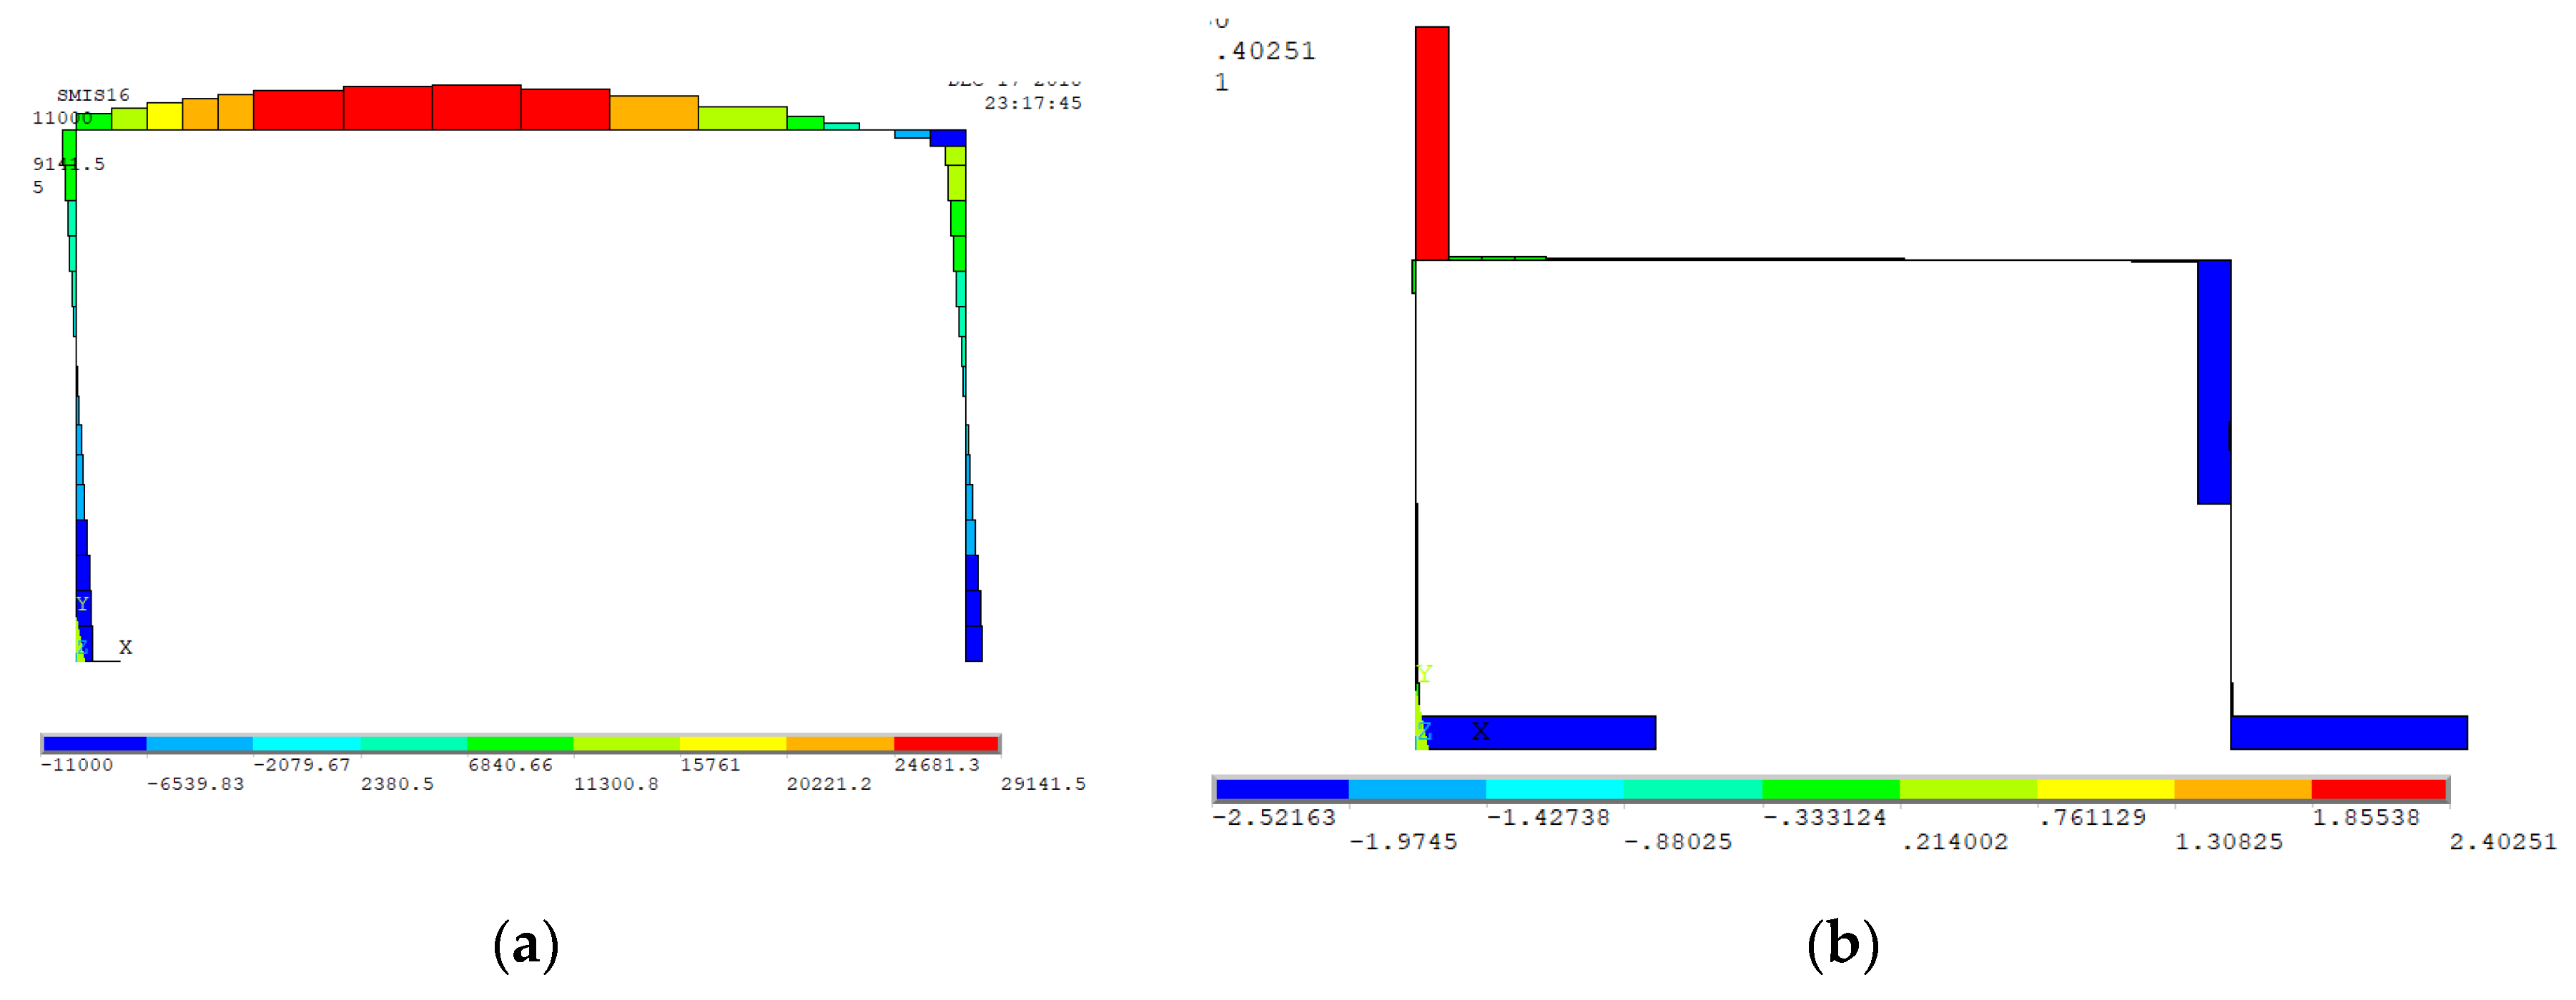
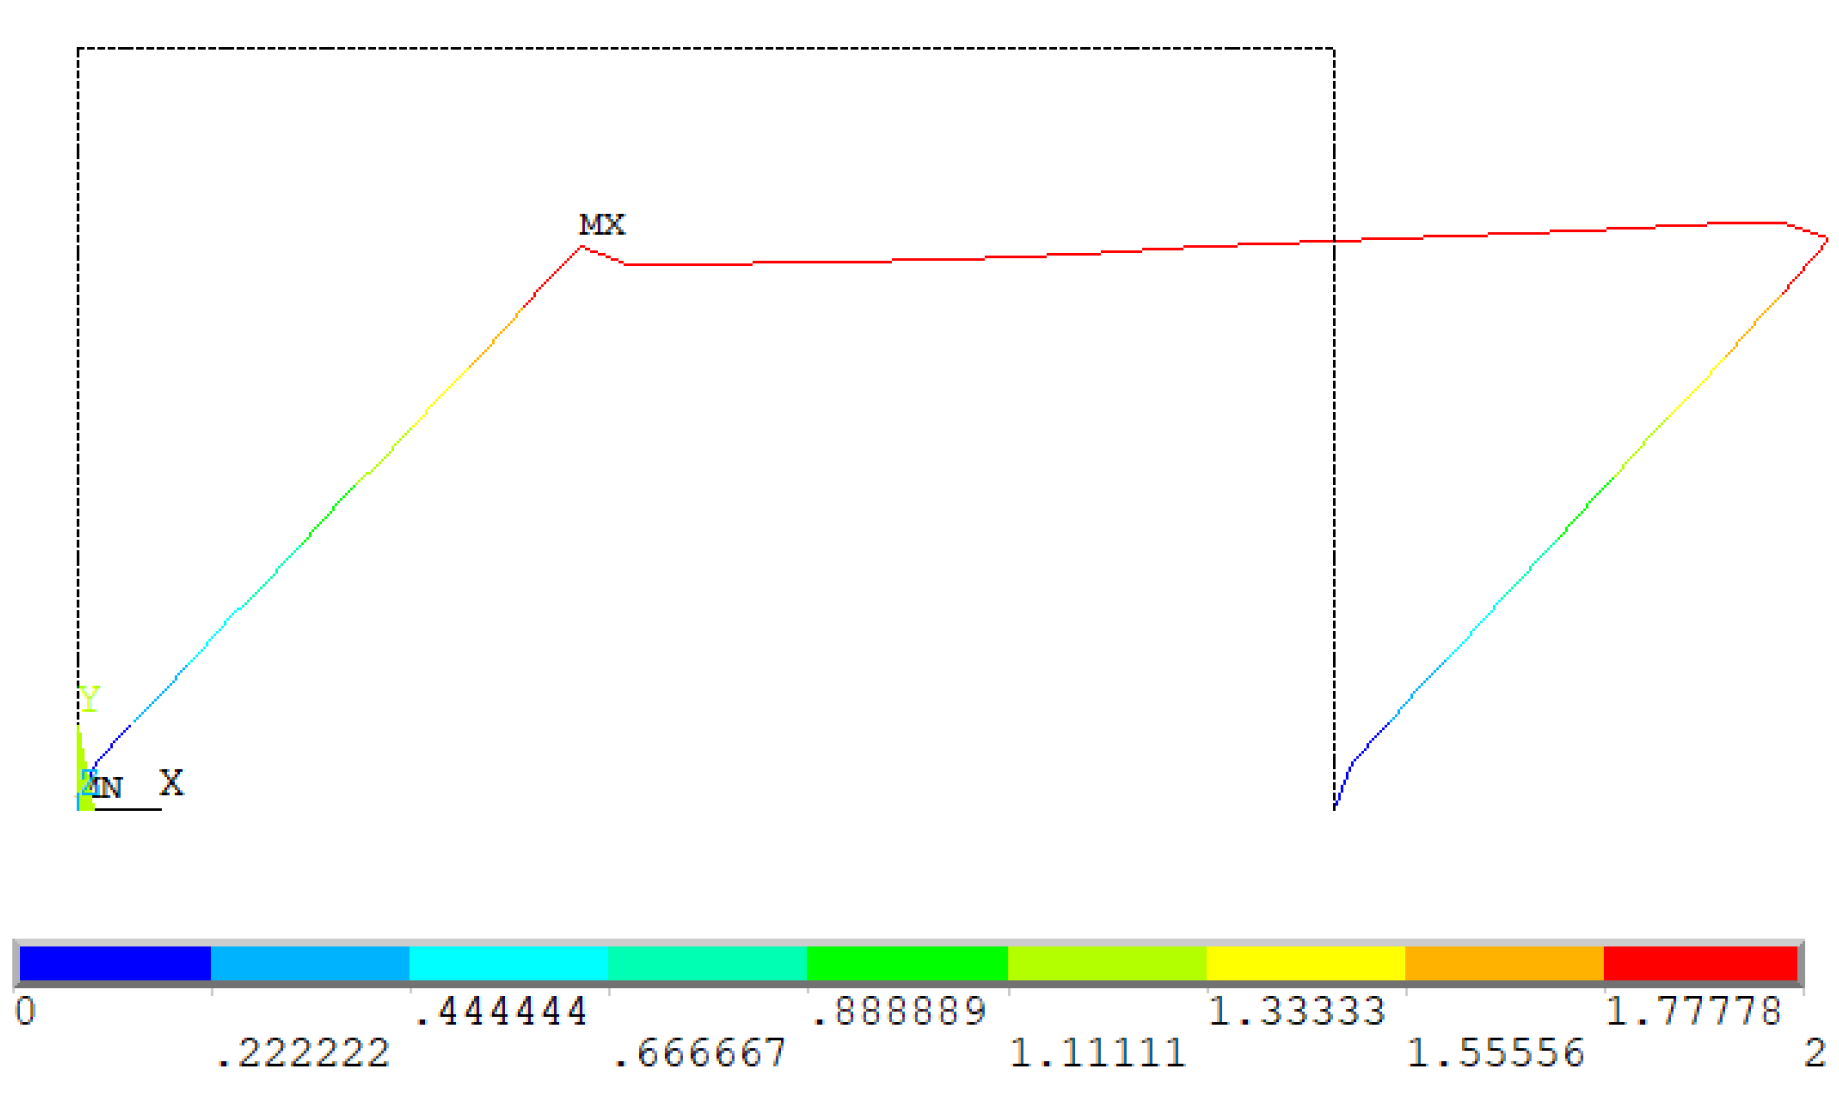
With the same moments, the maximum curvature that prototype P05 was capable of supporting was lower than that of prototype P04. When this curvature was surpassed, the tensioned steel bars exceeded their deformation limit and broke, which caused the structure to also break (Figure 22, Figure 23 and Figure 24). The structure’s ductility was considerably reduced.

3.2.4. Frame D (RC P05 Section + SRC P03 Section Joint Only)

The same frame structure was simulated with the behavior of the moment-curvature graph of the reinforced concrete prototype section P05 in all the bars, except for joints, which were simulated from a fifth of the length at the ends of bars with the behavior of the moment-curvature graph of the SRC P04 prototype section.
The similarity of the results obtained with the simulated frame structure to the behavior of the moment-curvature graph of frame B, which extended to all the bars, was surprising. Its behavior was similar and offers consequent savings in material by incorporating steel cross-sections only into the joint. The structure’s ductility was much greater than that of the previous model (Figure 25).

3.2.5. Analysis of the Results

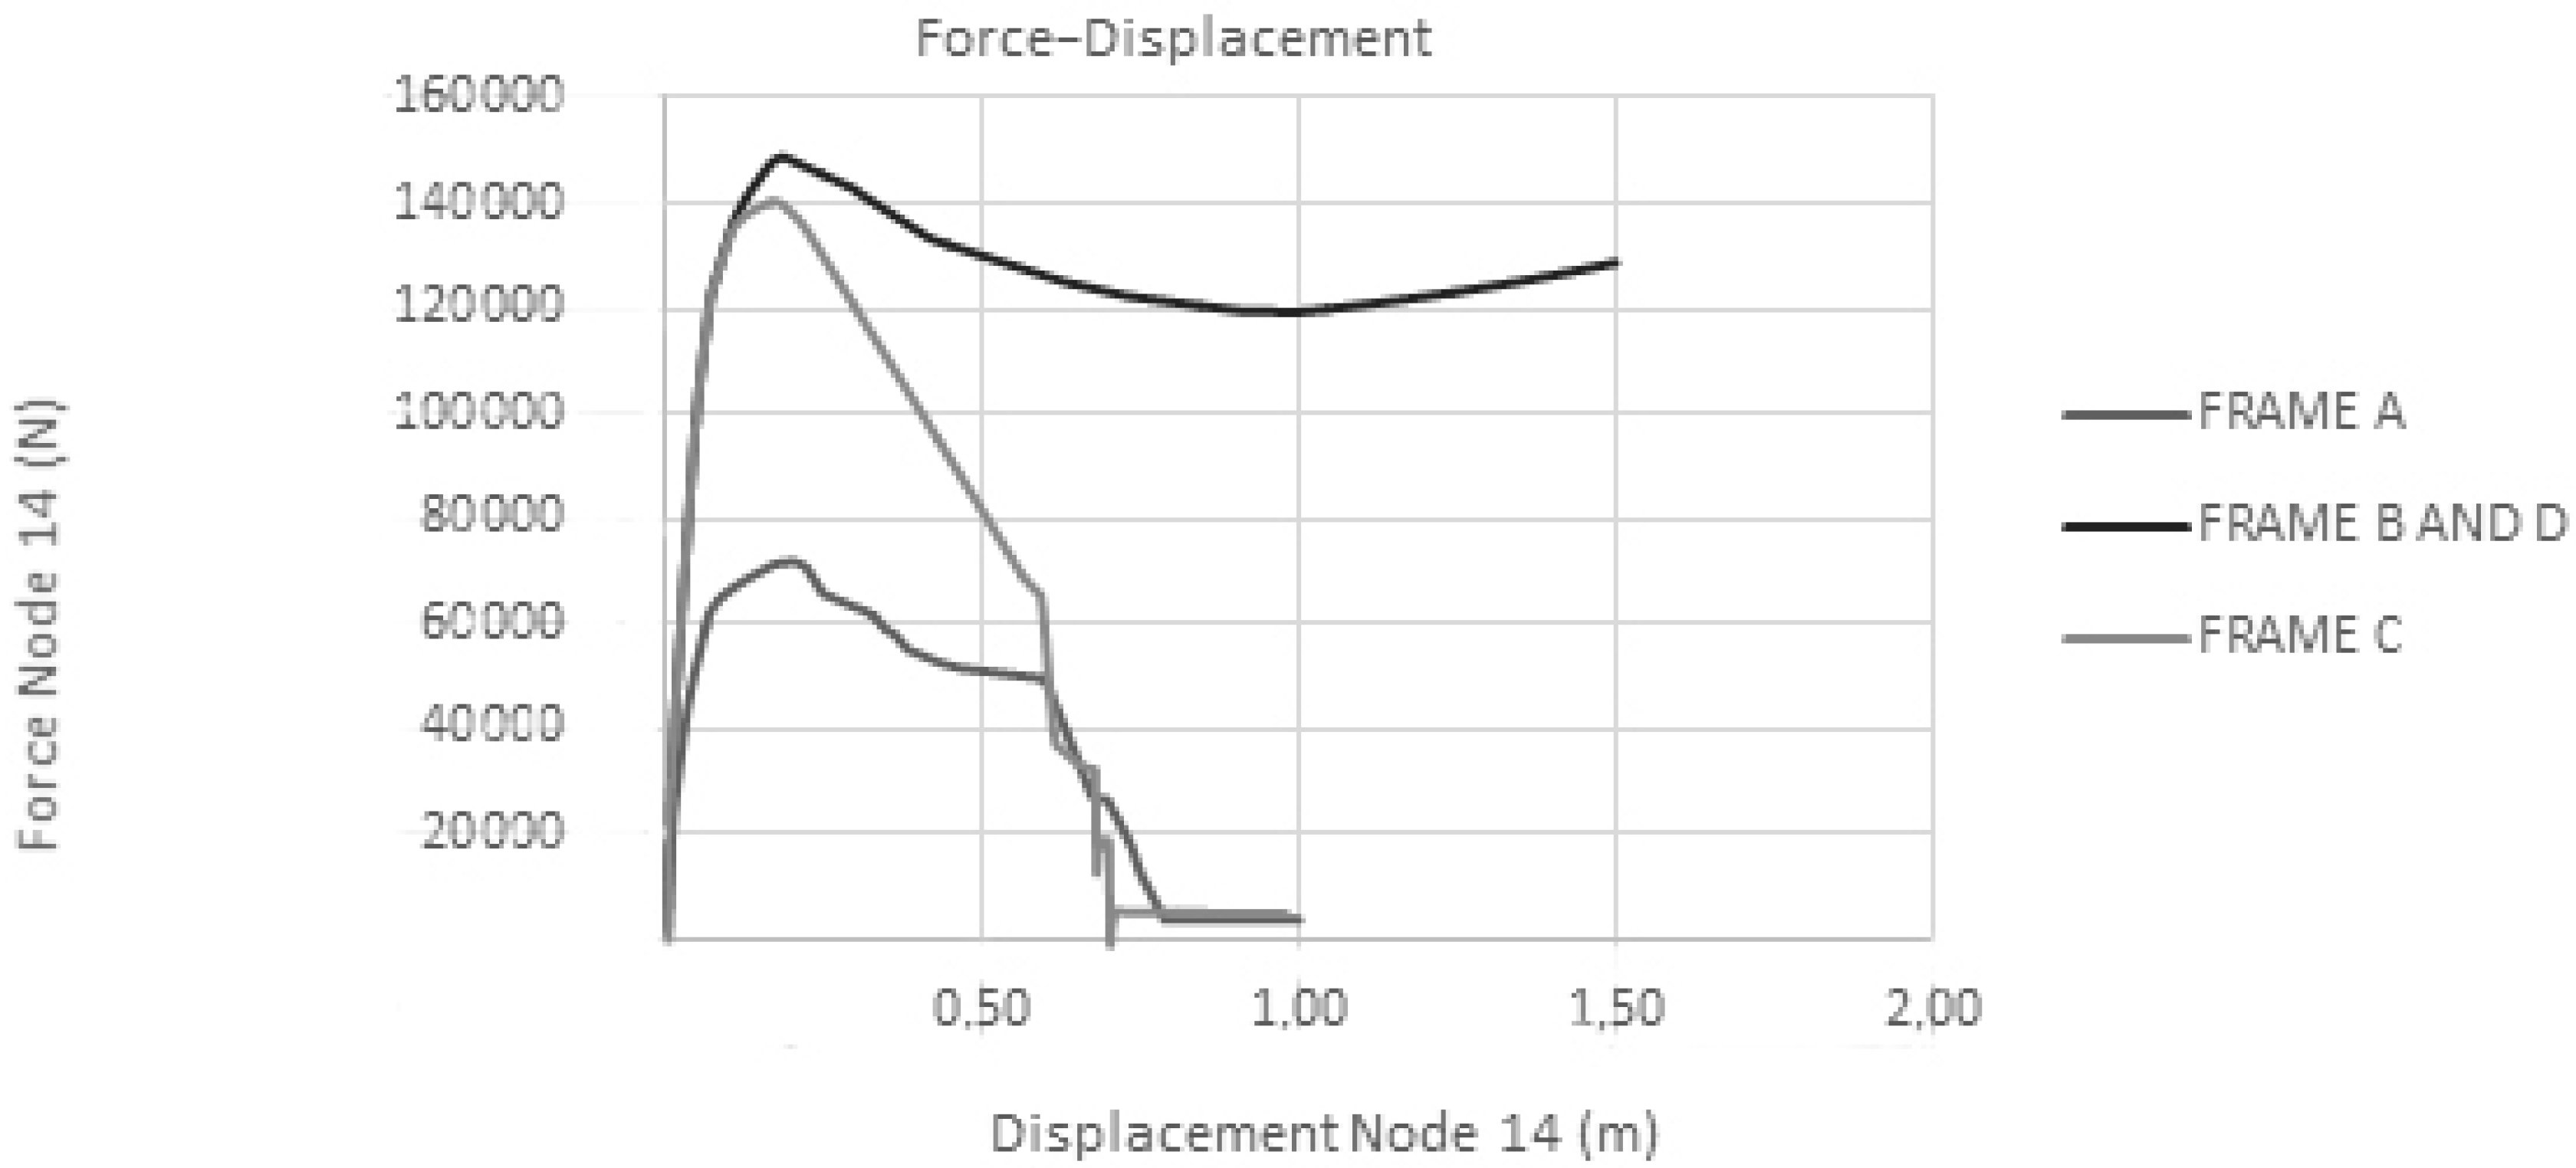
Figure 26 shows the results obtained from the different prototypes with the displacement applied at node 14 and the corresponding horizontal load. The highest energy absorption in frame B versus frame C is also observed in this figure. It resisted a comparable maximum value, but without the same ductility.
The similarity of the curves in the frame B and frame D figures was remarkable given that the moment-curvature behavior of prototype frame B was simulated only in the joints to save material. Meanwhile, the rest of the bar was simulated with the behavior of frame C, which allowed for greater curvatures and bigger displacements than if joints were not reinforced, but with considerable savings in material.
The maximum moments coincide with the moments introduced from the moment-curvature graphs of each prototype. The simulated SRC frame achieved the greatest displacements, a bigger load capable of support, and was able to absorb the most energy. Therefore, it behaved better when faced with horizontal seismic loads, but showed no difference when we embedded the reinforcement of the steel cross-sections in only the joints, which is where the strength was greater and the plastification was concentrated.
The numerical model was obtained and a force–displacement graph from the simulated model with the moment–rotation graph was given. Once the non-linear simulation was carried out, the resulting force and the displacement of the most representative point of the gantry were obtained and the graph was drawn. When processing the non-linear calculation from the moment-curvature graph, a final result was obtained, from which, it was possible to extract the force–displacement values according to Figure 26. The force–displacement curve related to node 14 can be seen. The decreasing load starting from the maximum force the column was capable of, and the hardening at high displacements due to the strength mechanism change, with columns in tension are noticeable.
The results in the frame B and frame D graphs are the same.
The bending capacity of the steel cross-sections gave the structure a very high deformation capacity by maintaining major points of resistance until collapse took place due to a great energy absorption capacity and high ductility.
From the strengths (F) and displacement ( D m a x ) of each 2D frame up until collapse, the energy absorbed by the structure can be calculated. The energy absorbed by the vertical force is calculated using Equation (3):
Absorbed   Energy   =   0 D m a x F ( u ) d u .
Table 3 summarizes the results obtained, from which we can conclude that the reinforced concrete (frame A) structures absorbed less energy than the steel-reinforced concrete structures (frame B). All the bars of the steel-reinforced concrete structures (frame B) coincided with the behavior of the model containing steel-reinforced concrete only at the joints of frame D. The latter was more advantageous as it offered the greatest absorption capacity of displacements and its respective strength, as well as an important saving in steel, which was achieved by using sections only at joints.
In the reinforced concrete structures, it would be convenient to explicitly consider the possibility of including reinforcements of reinforced concrete joints with embedded steel cross-sections as a solution for creating very high ductility according to Eurocode 4 [22] as the current regulation for designing structures with mixed steel and concrete.
Either a unidirectional or bi-directional reinforced concrete structure with flat beam slabs, which has a low ductility according to Eurocode 8 [23], can be improved by embedding steel cross-sections in the three spatial directions in all the structure’s reinforced concrete joints to offer very high ductility. It would compete advantageously with the expensive construction devices that require high or very high ductility reinforced concrete with standard bars. The simplicity of the ordinary construction of flat floors when faced with seismic activity would be maintained.
The extension of Eurocode 4 [22] would be interesting for designing reinforced concrete structures with joints of fully embedded steel cross-sections, and not only in columns. The design can be achieved using moment-curvature graphs.

4. Conclusions

Based on the results of the numerical simulations obtained in this article, the following conclusions are drawn:
-
Steel-reinforced concrete (SRC) structures double the ductility compared to the reinforced concrete (RC) structures, where a break prevented greater strains being reached.
-
It was possible to simulate the elastoplastic or post-critical behavior until a section broke. A drastic reduction in the moment that simulated the deterioration of concrete, breakage of reinforcements, and loss resistance of steel cross-sections has been included in the moment-curvature graph.
-
Hinges appeared simultaneously by redistributing forces along sections until collapse took place.
-
SRC structures reinforced only at joints reduced the steel cross-section used in the structure compared to reinforcing all the bars with equal strength, ductility, and safety against a structure collapsing during earthquakes.
-
Frame models with nonlinear moment-curvatures until the point of collapse were able to satisfactorily reproduce the behavior of three-dimensional models and the experimental test of the prototypes. The frame model was used to elucidate the hyperstatic behavior. It described the redistribution of strength and the structure’s general behavior until a break occurred. It provides designers with a much simpler tool than the complete three-dimensional modeling of the contributed structure.
-
It would be interesting to consider the generalization of the reinforcement with steel cross-sections embedded in the joint of reinforced concrete structures to achieve more earthquake-resistant structures, especially in public buildings and for emergencies where excellent seismic safety must be guaranteed.
-
In the reinforced concrete structures, it would be convenient to explicitly consider the possibility of including reinforcements of reinforced concrete joints with embedded steel cross-sections as a solution for creating structures with very high ductility using Eurocode 4 as the current regulation for designing structures with mixed steel and concrete.
-
The extension of Eurocode 4 would be interesting for designing reinforced concrete structures with joints having fully embedded steel cross-sections, and not only in columns, as contemplated by Japanese JIA(The Japan Institute of Architects) regulations. The design can be achieved by using moment-curvature graphs.
-
Simulation with numerical models allowed for the analysis of complex situations. In particular, the model of simplified frames with the relationship of moment-curvature allowed for nonlinear calculations until large displacements were reached, taking into account the reduction of rigidity because of the cracking of the concrete.
-
A new procedure was developed to obtain the moment-curvature graphs of the sections from the numerical models. The moment-curvature graph can be used in the simplified frame analysis by contemplating post-critical behavior in future research.
-
The principal scientific contribution is that, using the Ansys program, it was possible to numerically validate a procedure to simulate until the breaking of a bar structure from some bar elements with a behavior introduced by means of the moment-curvature graph. The behavior was the same independent of whether all the bars were reinforced or only the joints were reinforced.

Author Contributions

Formal analysis, I.M., R.I., L.E. and I.V.; Investigation, I.M. and R.I.; Writing—original draft, I.M.; Writing—review & editing, I.M., R.I., L.E. and I.V.

Funding

This research received no external funding.

Conflicts of Interest

The authors declare no conflict of interest.

Data Availability

The data used to support the findings of this study were supplied by Isaac Montava under license and so cannot be made freely available. Requests for access to these data should be made to Isaac at [email protected].

References

  1. Wakabayashi, M. Design of Earthquake—Resistant Buildings; McGraw: New York, NY, USA, 1986. [Google Scholar]
  2. Chen, C.C.; Lin, K.T. Behavior and strength of steel reinforced concrete beam–Column joints with two-side force inputs. J. Constr. Steel Res. 2009, 65, 641–649. [Google Scholar] [CrossRef]
  3. Yan, C.; Yang, D.; Ma, Z.J.; Jia, J. Hysteretic model of SRUHSC column and SRC beam joints considering damage effects. Mater. Struct. 2017, 50, 88. [Google Scholar] [CrossRef]
  4. Chen, Z.; Xu, J.; Xue, J. Hysteretic behavior of special shaped columns composed of steel and reinforced concrete (SRC). Earthquake Eng. Eng. Vibr. 2015, 14, 329–345. [Google Scholar] [CrossRef]
  5. Wilkinson, T.; Hancock, G.J. Compact or Class 1 Limits for Rectangular Hollow Sections in Bending. In Proceedings of the 8th International Symposium on Tubular Structures, Singapore, 26–28 August 1998. [Google Scholar]
  6. Gioncu, V.; Mosoarca, M.; Anastasiadis, A. Prediction of available rotation capacity and ductility of wide-flange beams. Part 1: DUCTROT-M computer program. J. Constr. Steel Res. 2012, 69, 8–19. [Google Scholar] [CrossRef]
  7. European Committee for Standardization. EN 1993-1-8, Eurocode 3: Design of Steel Structures—Part 1–8: Design of Joints; European Committee for Standardization: Brussels, Belgium, 2005. [Google Scholar]
  8. Li, J.; Wang, Y.; Lu, Z.; Li, J. Experimental Study and Numerical Simulation of a Laminated Reinforced Concrete Shear Wall with a Vertical Seam. Appl. Sci. 2017, 7, 6299. [Google Scholar] [CrossRef]
  9. European Committee for Standardization. EN 1992-1-1, Eurocode 2: Design of Concrete Structures—Part 1-1: General Rules and Rules for Buildings; European Committee for Standardization: Brussels, Belgium, 2014; p. 730. [Google Scholar]
  10. Lu, Z.; He, X.D.; Zhou, Y. Studies on damping behavior of vertically mixed structures with upper steel and lower concrete substructures. Struct. Des. Tall Spec. Build. 2017, 26. [Google Scholar] [CrossRef]
  11. Gioncu, V.; Petcu, D. Available Rotation Capacity of Wide-Flange Beams and Beam-Columns. Part 1. Theoretical Approaches. J. Constr. Steel Res. 1997, 43, 161–217. [Google Scholar] [CrossRef]
  12. Bossio, A.; Fabbrocino, F.; Lignola, G.P.; Prota, A.; Manfredi, G. Design Oriented Model for the Assessment of T-Shaped Beam-Column Joints in Reinforced Concrete Frames. Buildings 2017, 7, 118. [Google Scholar] [CrossRef] [Green Version]
  13. Bossio, A.; Fabbrocino, F.; Lignola, G.P.; Prota, A.; Manfredi, G. Simplified Model for Strengthening Design of Beam–Column Internal Joints in Reinforced Concrete Frames. Polymers 2015, 7, 1732–1754. [Google Scholar] [CrossRef]
  14. Santarsiero, G. FE Modelling of the Seismic Behavior of Wide Beam-Column Joints Strengthened with CFRP Systems. Buildings 2018, 8, 31. [Google Scholar] [CrossRef] [Green Version]
  15. Kabir, M.R.; Alam, M.S.; Said, A.M.; Ayad, A. Performance of Hybrid Reinforced Concrete Beam Column Joint: A Critical Review. Fibers 2016, 4, 13. [Google Scholar] [CrossRef] [Green Version]
  16. Bağcı, M. Neural Network Model for Moment-Curvature Relationship of Reinforced Concrete Sections. Math. Comput. Appl. 2010, 15, 66–78. [Google Scholar] [CrossRef]
  17. Montava, I.; Irles, R.; Pomares, J.C.; Gonzales, A. Experimental Study of Steel Reinforced Concrete (SRC) Joints. Appl. Sci. 2019, 9, 1528. [Google Scholar] [CrossRef] [Green Version]
  18. Montava, I.; Irles, R.; Segura, J.; Gadea, J.M.; Juliá, E. Numerical Simulation of Steel Reinforced Concrete (SRC) Joints. Metals 2019, 9, 131. [Google Scholar] [CrossRef] [Green Version]
  19. Lu, Z.; Yang, Y.L.; Lu, X.; Liu, C. Preliminary study on the damping effect of a lateral damping buffer under a debris flow load. Appl. Sci. 2017, 7, 201. [Google Scholar] [CrossRef] [Green Version]
  20. Lu, Z.; Chen, X.Y.; Zhang, D.C.; Dai, K.S. Experimental and analytical study on the performance of particle tuned mass dampers under seismic excitation. Earthq. Eng. Struct. Dyn. 2016, 46, 697–714. [Google Scholar] [CrossRef]
  21. Sun, Z.; Yang, Y.; Yan, W.; Wu, G.; He, X. Moment-Curvature Behaviors of Concrete Beams Singly Reinforced by Steel-FRP Composite Bars. Adv. Civ. Eng. 2017, 2017. [Google Scholar] [CrossRef] [Green Version]
  22. European Committee for Standardization. EN 1994 1-1, Eurocode 4: Design of Composite Steel and Concrete Structures; European Committee for Standardization: Brussels, Belgium, 1993. [Google Scholar]
  23. European Committee for Standardization. EN 1998, Eurocode 8: Design of Structures for Earthquake Resistance; European Committee for Standardization: Brussels, Belgium, 2004. [Google Scholar]
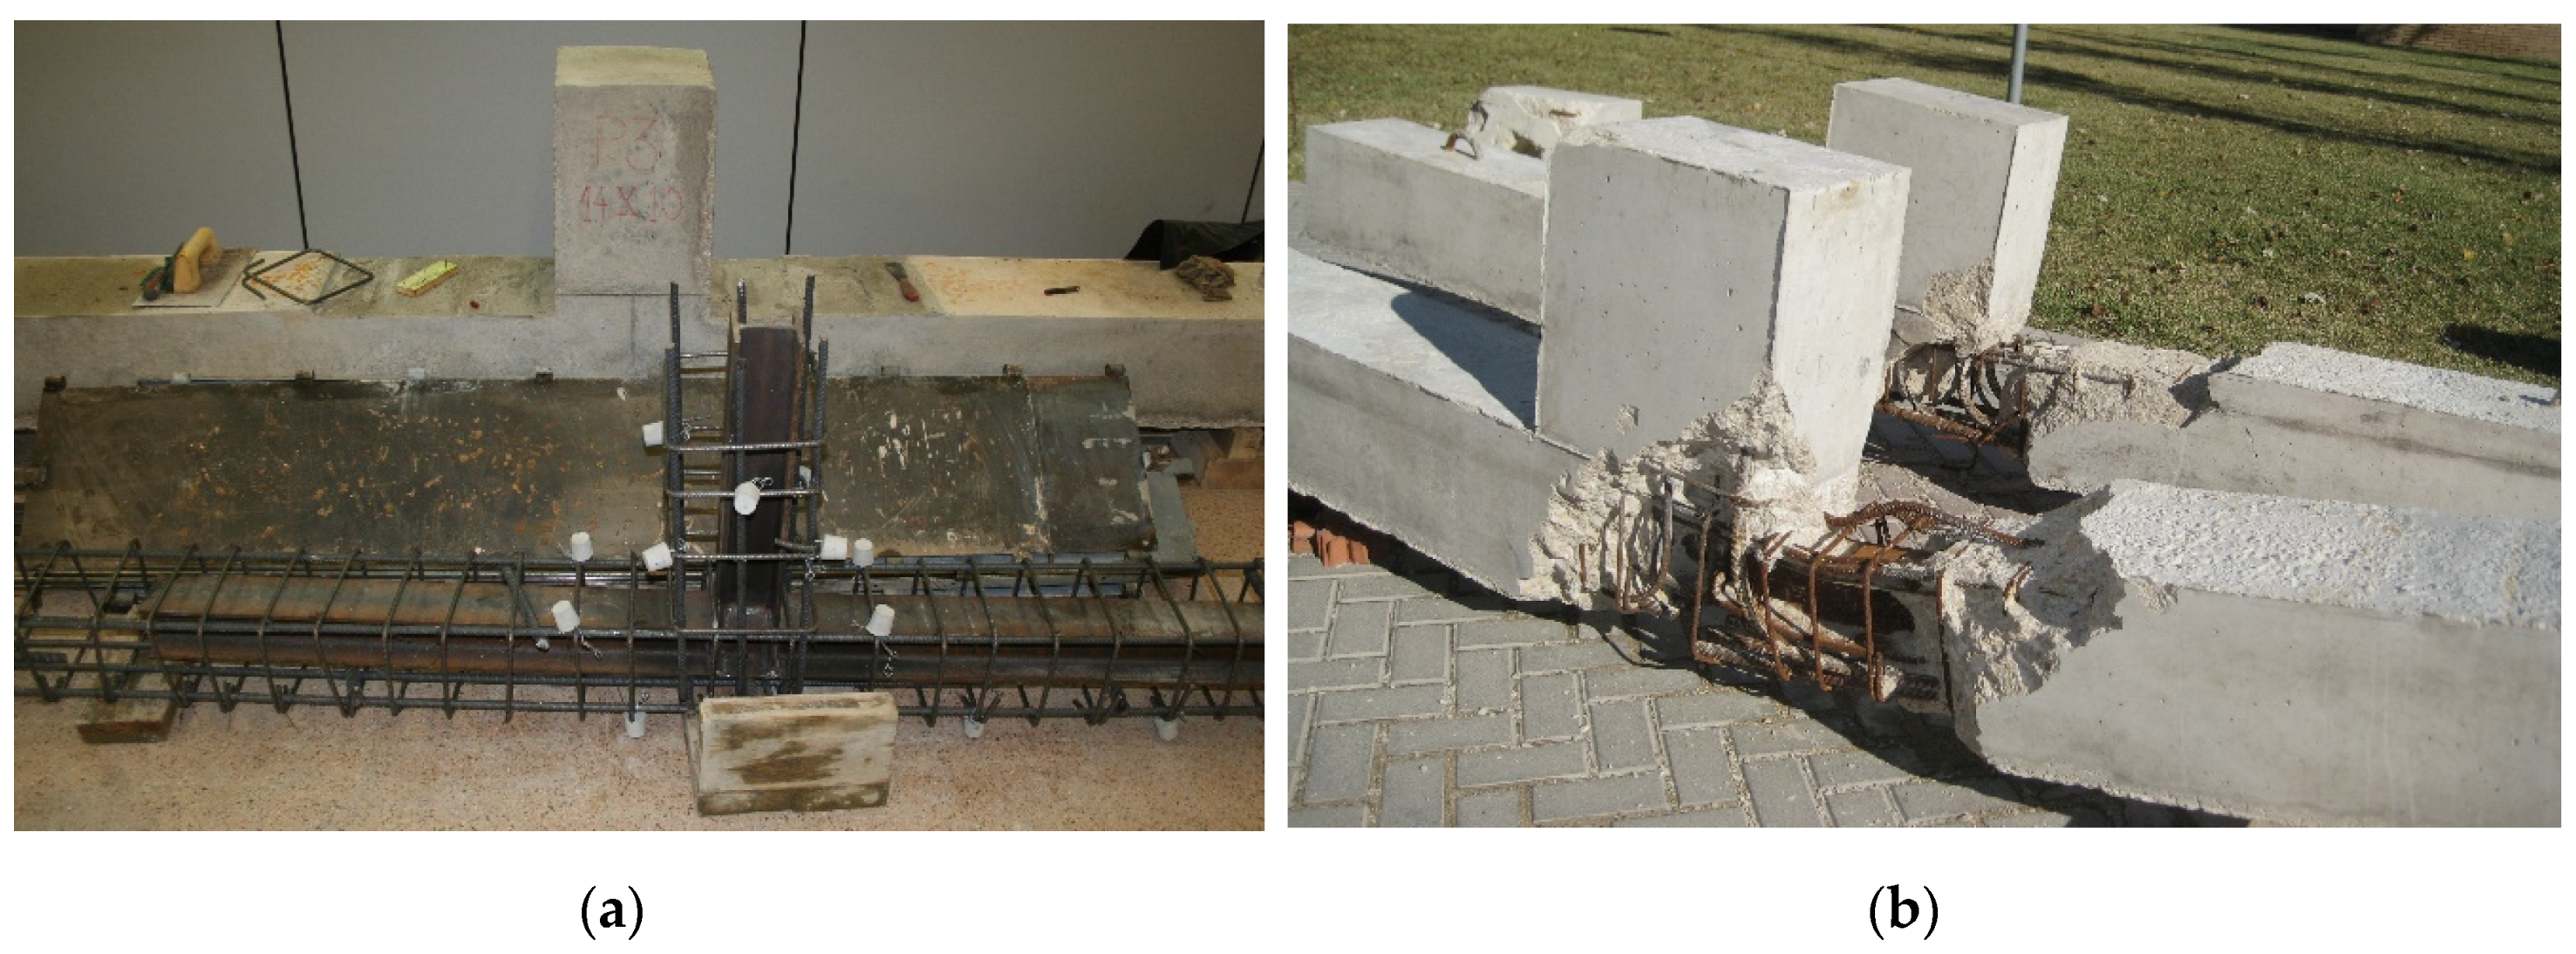
Figure 1. Prototypes P03 and P04 in the execution phase (A) and image of the tested prototypes P03 and P04 (B) [17].
Applsci 09 05533 g001
Figure 2. Tension state in different phases in a section of reinforced concrete with an embedded steel cross-section subject to simple bending.
Applsci 09 05533 g002
Figure 3. Beam elements’ non-linear behavior following a stress–strain relationship, matrix equation (Ansys help manual).
Applsci 09 05533 g003
Figure 4. Analysis of the curvature of different sections.
Applsci 09 05533 g004
Figure 5. The moment-curvature graph of P03, P04, and P05 included in the frame model.
Applsci 09 05533 g005
Figure 6. Vertical movement (m) of prototype P03 simulated according to the moment-curvature graph.
Applsci 09 05533 g006
Figure 7. Force–displacement graph of the P03 model showing the results of the experimental tests and the numerical modeling of frames from the moment-curvature graph.
Applsci 09 05533 g007
Figure 8. (a) Diagram of moments (N·m) and (b) curvatures (m−1) during the maximum displacement.
Applsci 09 05533 g008
Figure 9. Vertical movement (m) of prototype P04 simulated with the frame from the moment-curvature graph.
Applsci 09 05533 g009
Figure 10. (a) Diagram of moments (N·m) and (b) curvatures (m−1) during the maximum displacement.
Applsci 09 05533 g010
Figure 11. Force–displacement graph of model P04 showing the results from the experimental tests and the numerical model of frames from the moment-curvature graph.
Applsci 09 05533 g011
Figure 12. Vertical movement (m) of prototype P05 simulated from the moment-curvature graph.
Applsci 09 05533 g012
Figure 13. (a) Diagram of moments (N·m) and (b) curvatures (m−1) during the maximum displacement.
Applsci 09 05533 g013
Figure 14. Force–displacement graph of model P05 showing the results of the experimental tests and numerical model of frames from the moment-curvature graph.
Applsci 09 05533 g014
Figure 15. Frame model (N stands for node and E for element).
Applsci 09 05533 g015
Figure 16. Horizontal movement (m) of the simulated frame structure from the moment-curvature graph of frame A.
Applsci 09 05533 g016
Figure 17. Graph of the moments of the different elements in relation to the displacement in node 14.
Applsci 09 05533 g017
Figure 18. Diagram of the moments (N·m) in (a,c,e,g) and curvatures (m−1) in (b,d,f,h) in the different displacements of node 14: I (0 m), II (0.26 m), III (0.65 m), and IV (1.3 m).
Applsci 09 05533 g018aApplsci 09 05533 g018b
Figure 19. Horizontal movement (m) of the simulated frame structure from the moment-curvature graph of frame B.
Applsci 09 05533 g019
Figure 20. Graph of the moments in elements 1, 45, and 21 in relation to the displacement in node 14 of frame B.
Applsci 09 05533 g020
Figure 21. Diagram of the moments in (a,c,e,g) (N·m) and curvatures in (b,d,f,h) (m−1) during the different displacements of node 14: I (0 m), II (0.4 m), III (1 m), and IV (2 m).
Applsci 09 05533 g021aApplsci 09 05533 g021b
Figure 22. Horizontal movement (m) of the simulated frame structure from the moment-curvature graph of frame C.
Applsci 09 05533 g022
Figure 23. (a) Diagram of moments (N·m) and (b) curvatures (m−1) during the maximum displacement.
Applsci 09 05533 g023
Figure 24. Graph of the moments in elements 1 and 24 front the displacement in Node 14 of frame C.
Applsci 09 05533 g024
Figure 25. Horizontal movement (m) of the simulated frame structure from the moment-curvature graph of frame D.
Applsci 09 05533 g025
Figure 26. Graph of the load at Node 14 in relation to the displacement of the different frames.
Applsci 09 05533 g026
Table 1. Table summarizing the performed tests, RC: reinforced concrete, SRC: steel-reinforced concrete.
PrototypeTypologyConcrete Sections (mm × mm)Rebar ReinforcementCross-SectionsDistance between Supports (mm)
P03RC300 × 2504 ø 12-3300
P04SRC300 × 2504 ø 12HEB-1003300
P05RC300 × 2502 ø 16 + 2 ø 20-3300
Table 2. Table summarizing the performed analyses.
FrameTypologyConcrete SectionsRebar ReinforcementCross-Sections
ARC300 × 2504 ø 12NONE
BSRC300 × 2504 ø 12HEB-100 (FULL FRAME)
CRC300 × 2502 ø 16 + 2 ø 20NONE
DSRC + RC300 × 2504 ø 12HEB-100 (JOINT ONLY)
Table 3. Summary table of the performed tests.
Frame AFrame B Frame CFrame D
Displacement node 14 (m)1.321.32
Force node 14 (kN)75160160160
Absorbed energy from the horizontal load (kN·m)6028090280