Assessing Drivers’ Physiological Responses Using Consumer Grade Devices


Abstract
1. Introduction
1.1. Physiological Responses for Assessment of Driver State
- Electroencephalography (EEG),
- Electrocardiography (ECG),
- Photoplethysmography (PPG),
- Heart rate (HR),
- Galvanic skin response (GSR),
- Electromyography (EMG) and
- Eye tracking (pupil diameter—PD).
1.2. Devices Used to Measure Driver’s Physiological Responses
1.3. Contribution
- Can E4 and Faros be used for assessment of physiological signals in a driving environment?
- If so, can E4 and Faros differentiate between different levels of driving demand?
2. Materials and Methods
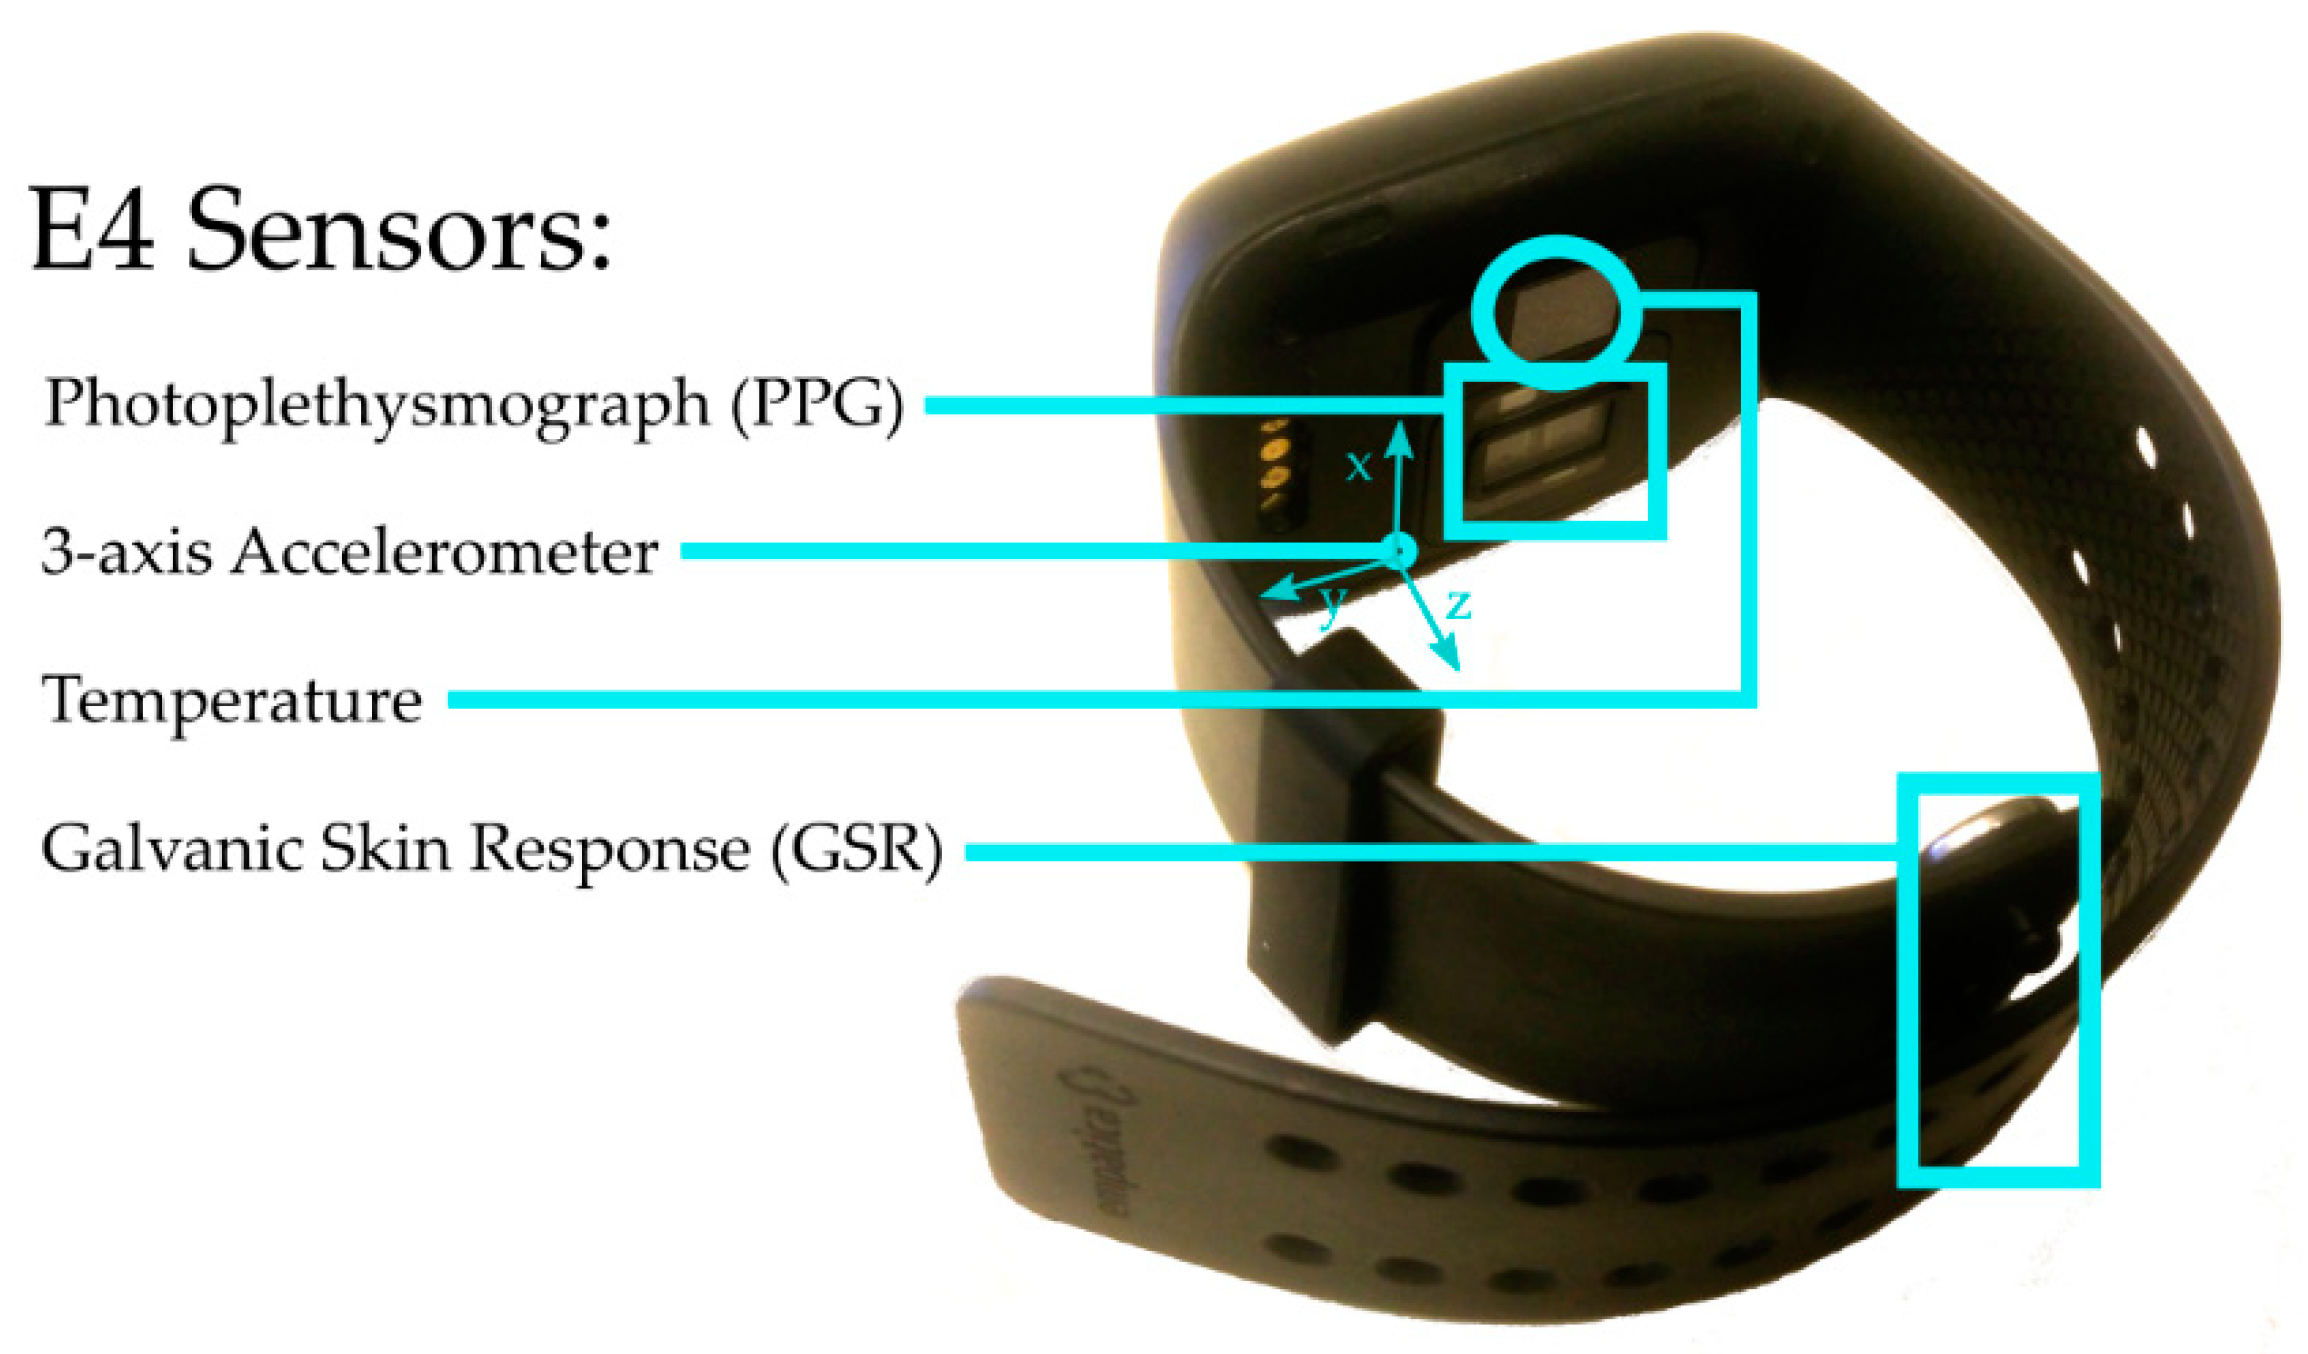
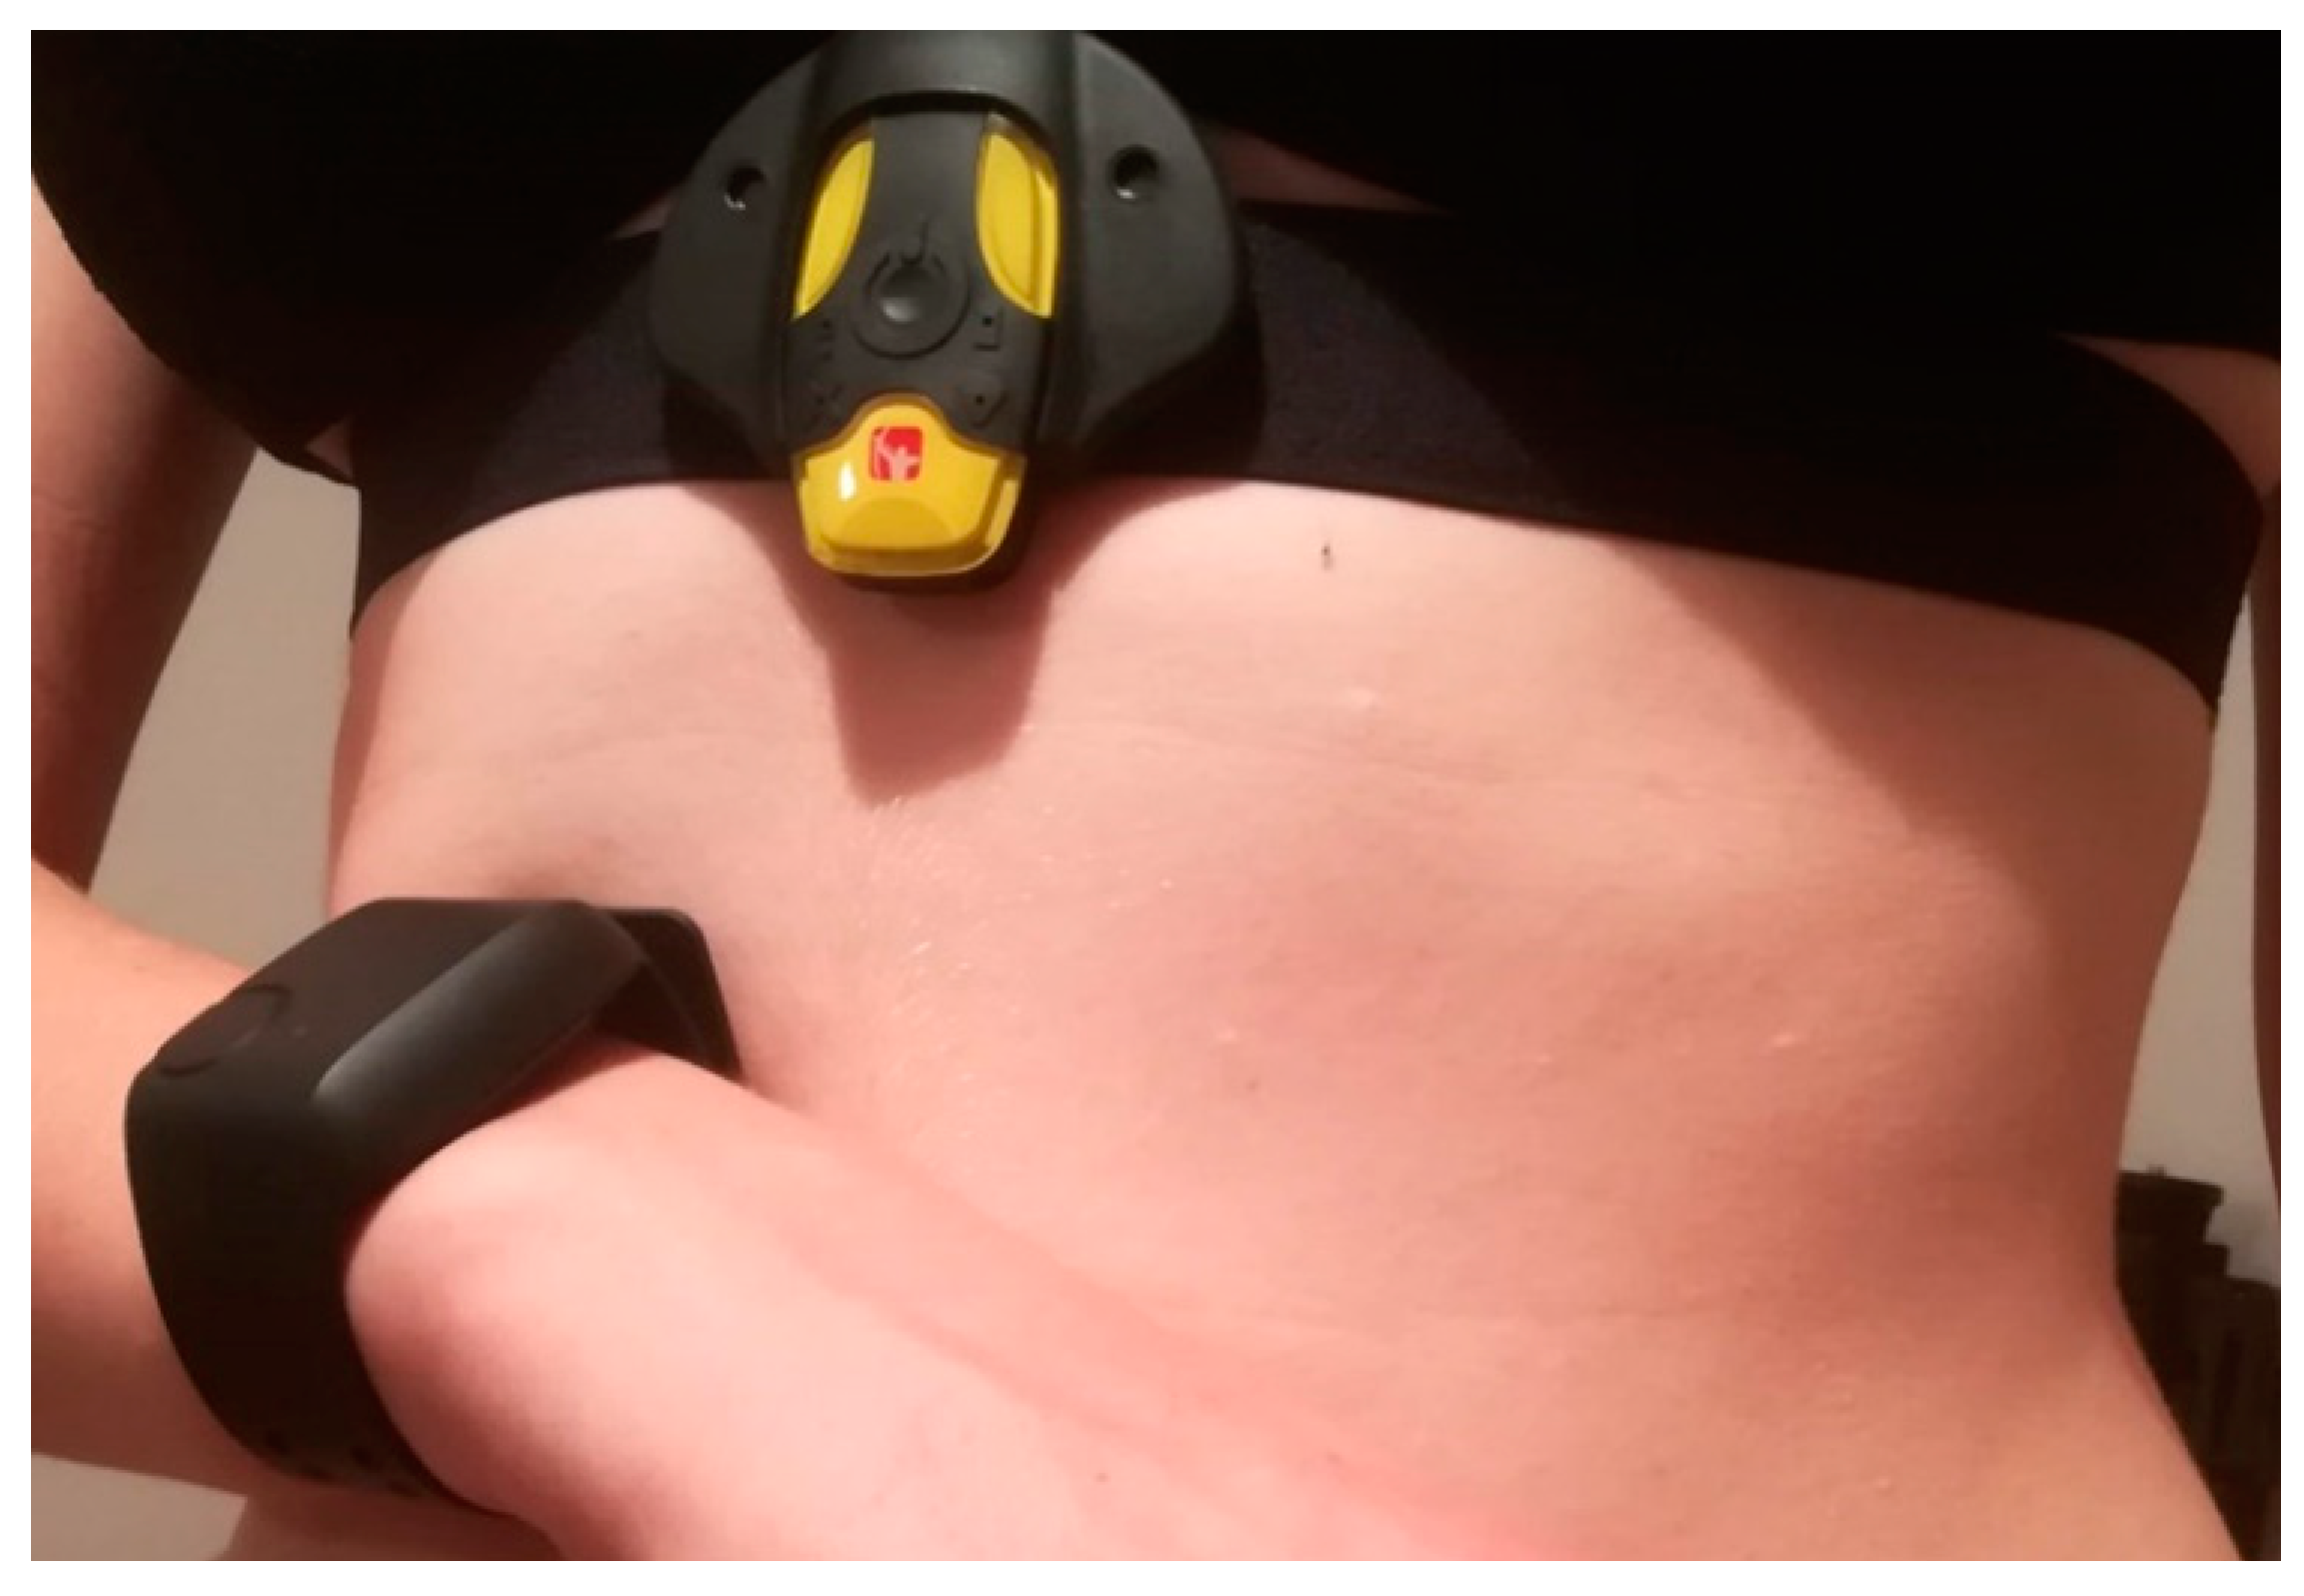
2.1. Empatica E4
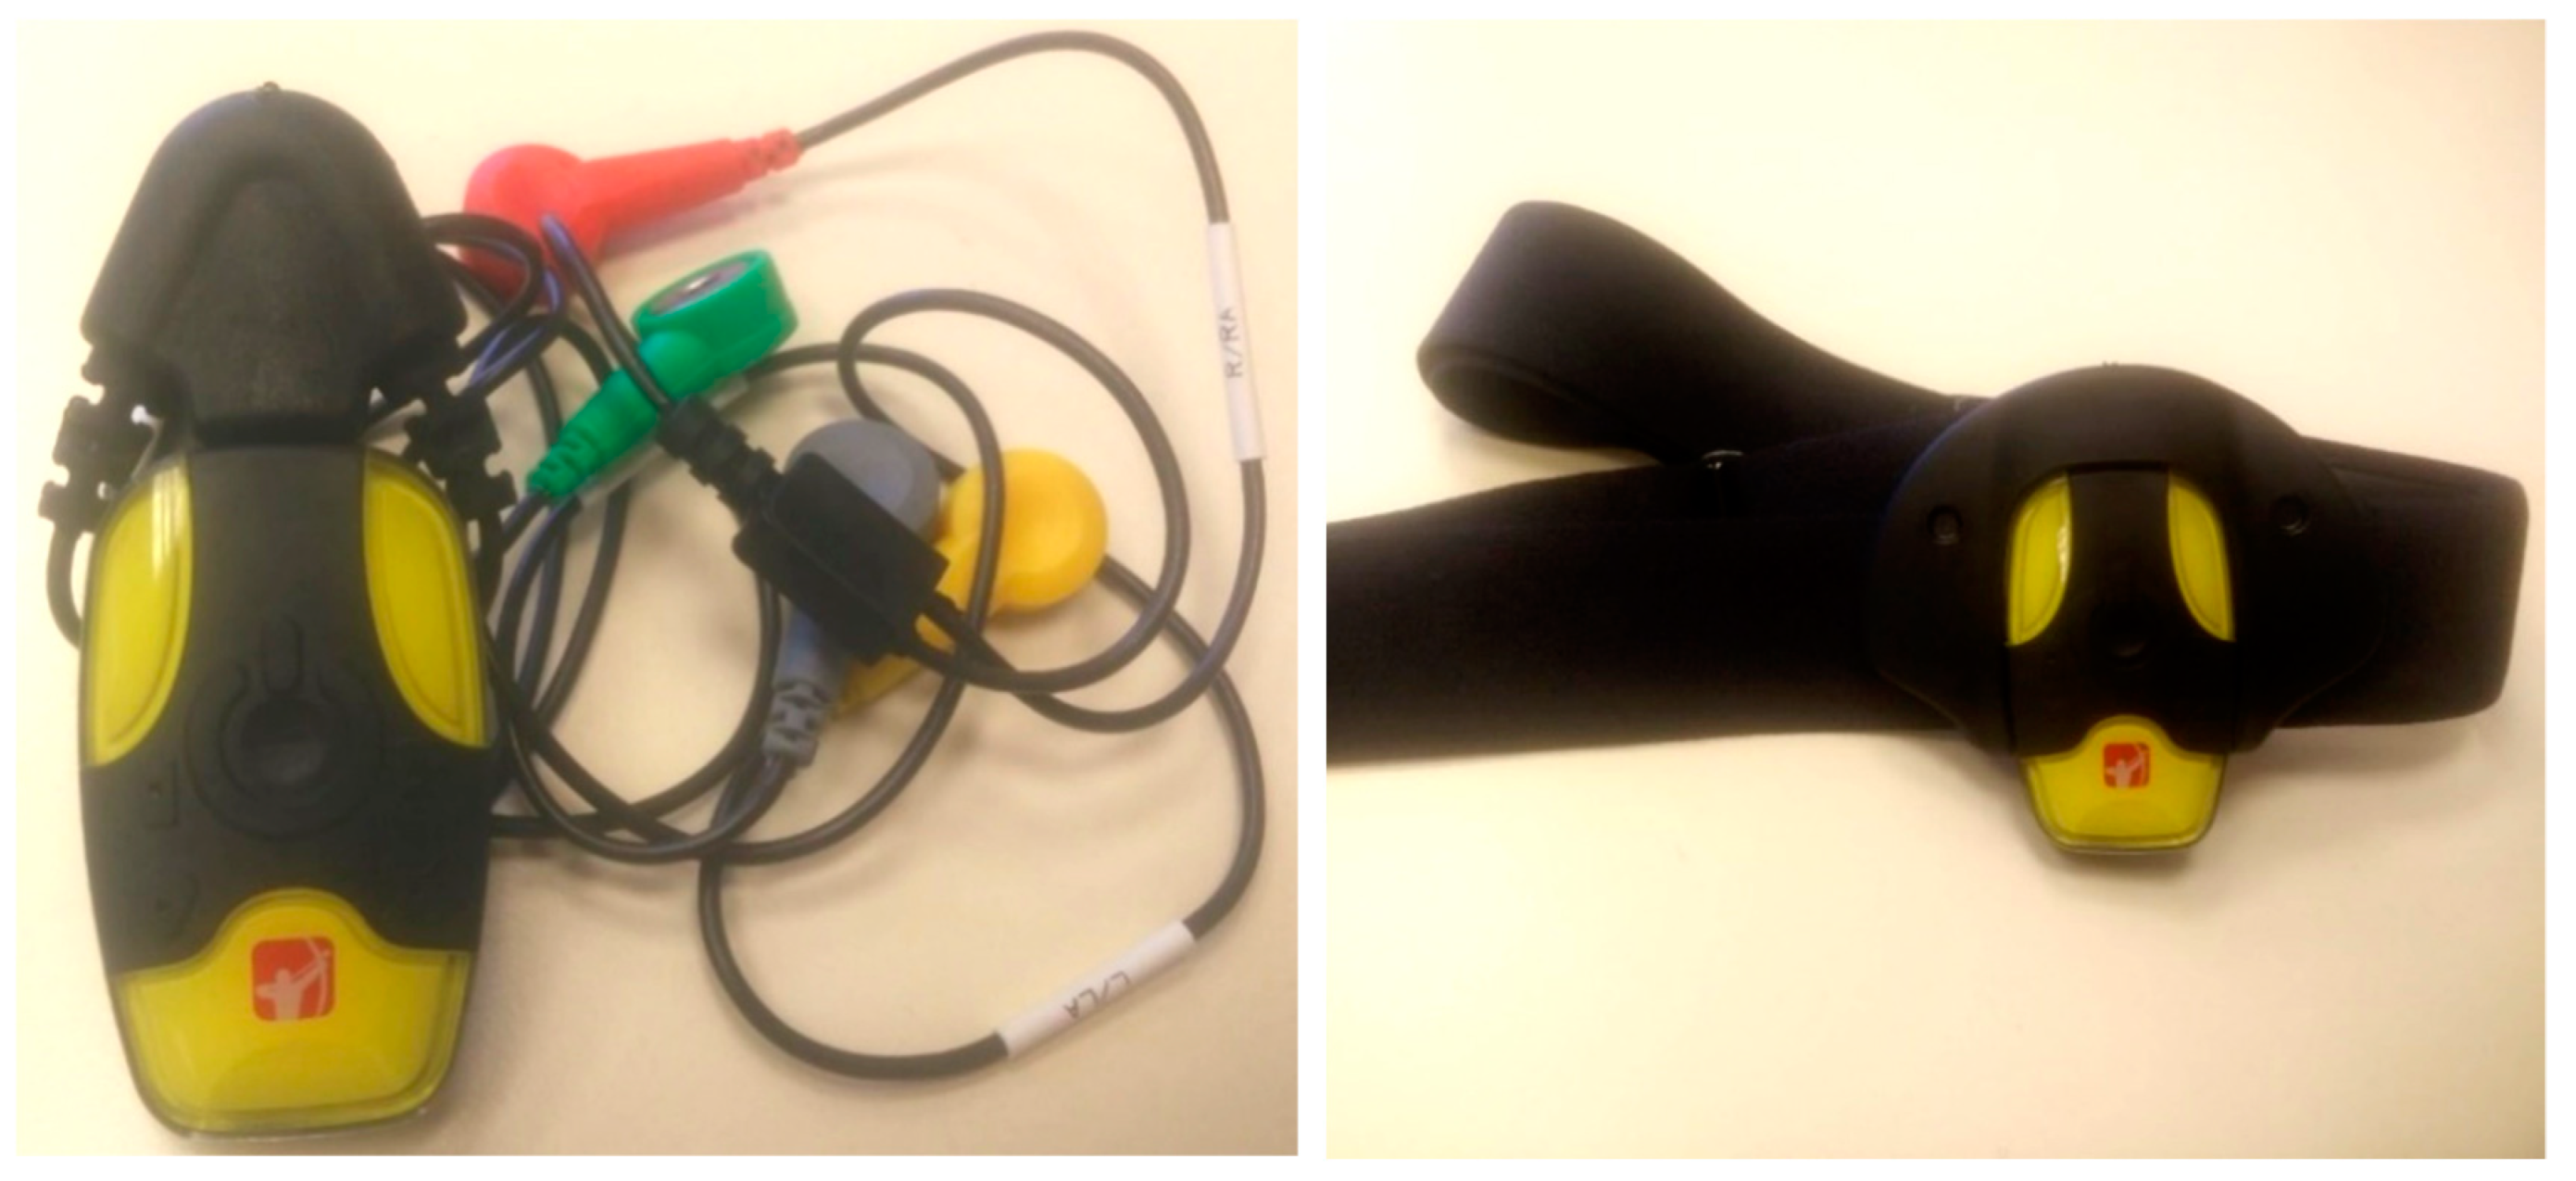
2.2. Bittium Faros 360
- Faros 90, which offers simple 1-channel ECG measurements,
- Faros 180, which offers 1-channel ECG measurements and is able to stream data via Bluetooth, and
- Faros 360, which enables 3-channels ECG measurements and is able to stream data via Bluetooth.
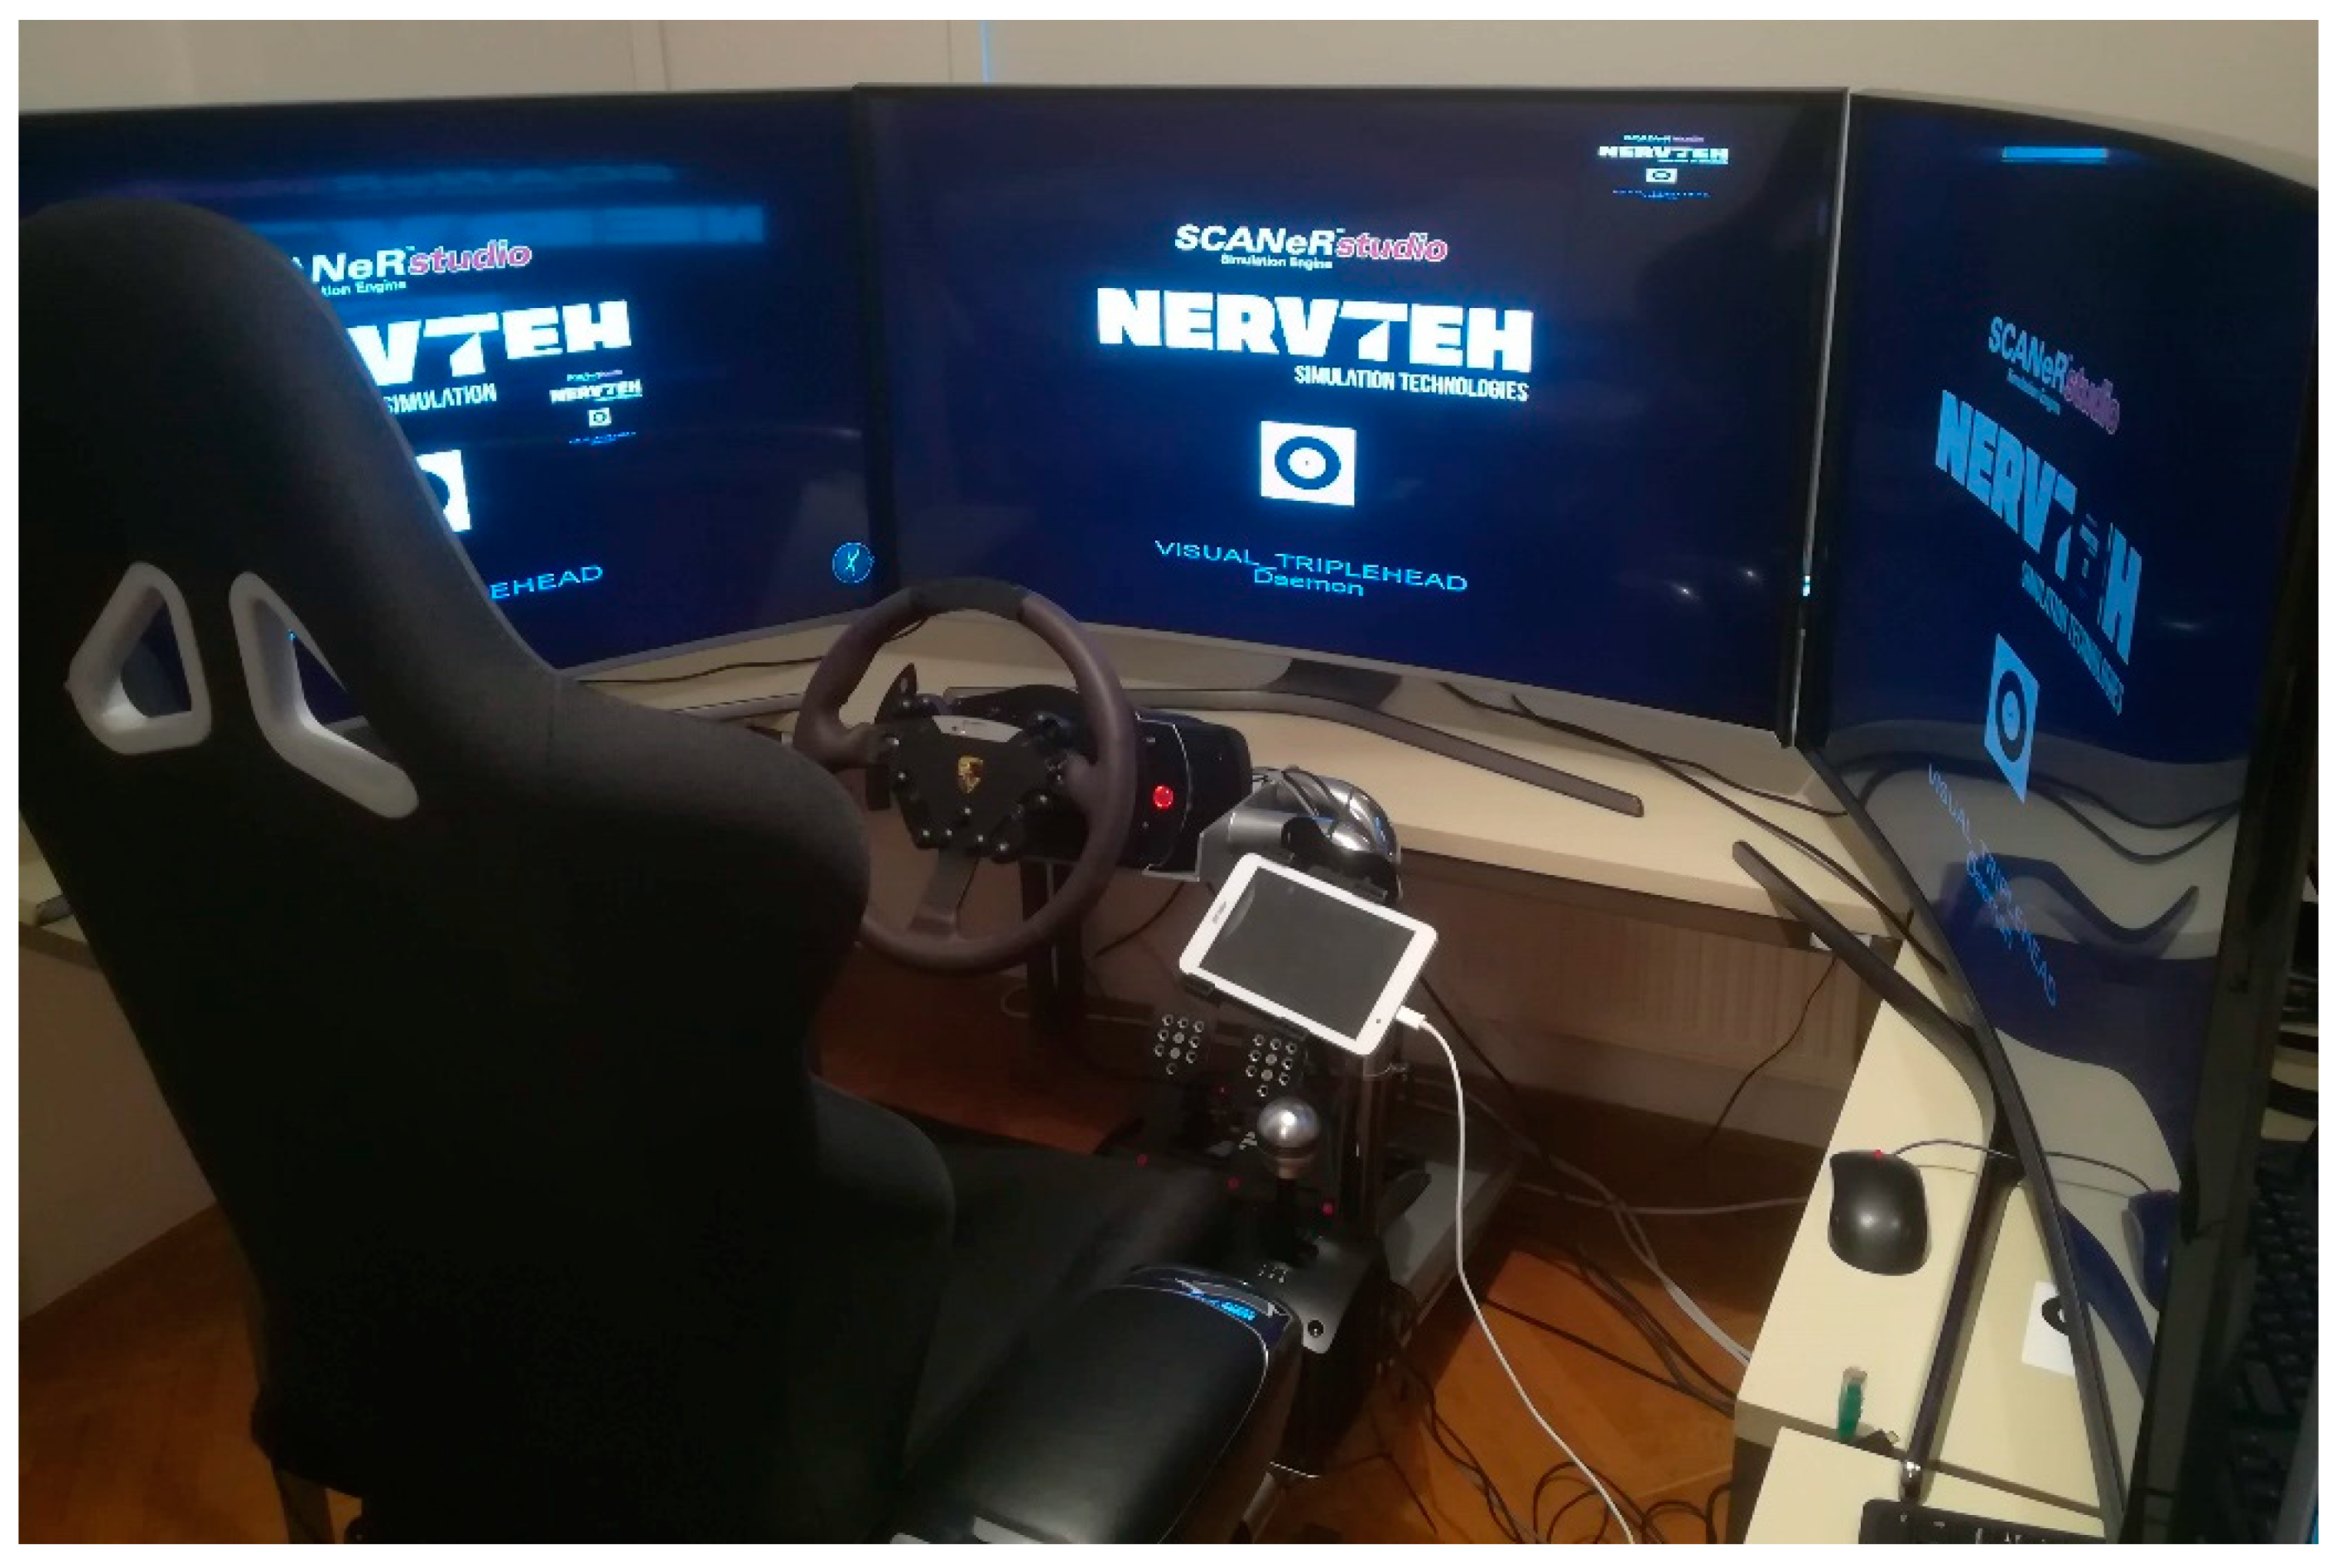
2.3. Nervtech Driving Simulator Overview
2.4. Technical Setup
2.5. User Study
2.5.1. Participants
2.5.2. Tasks
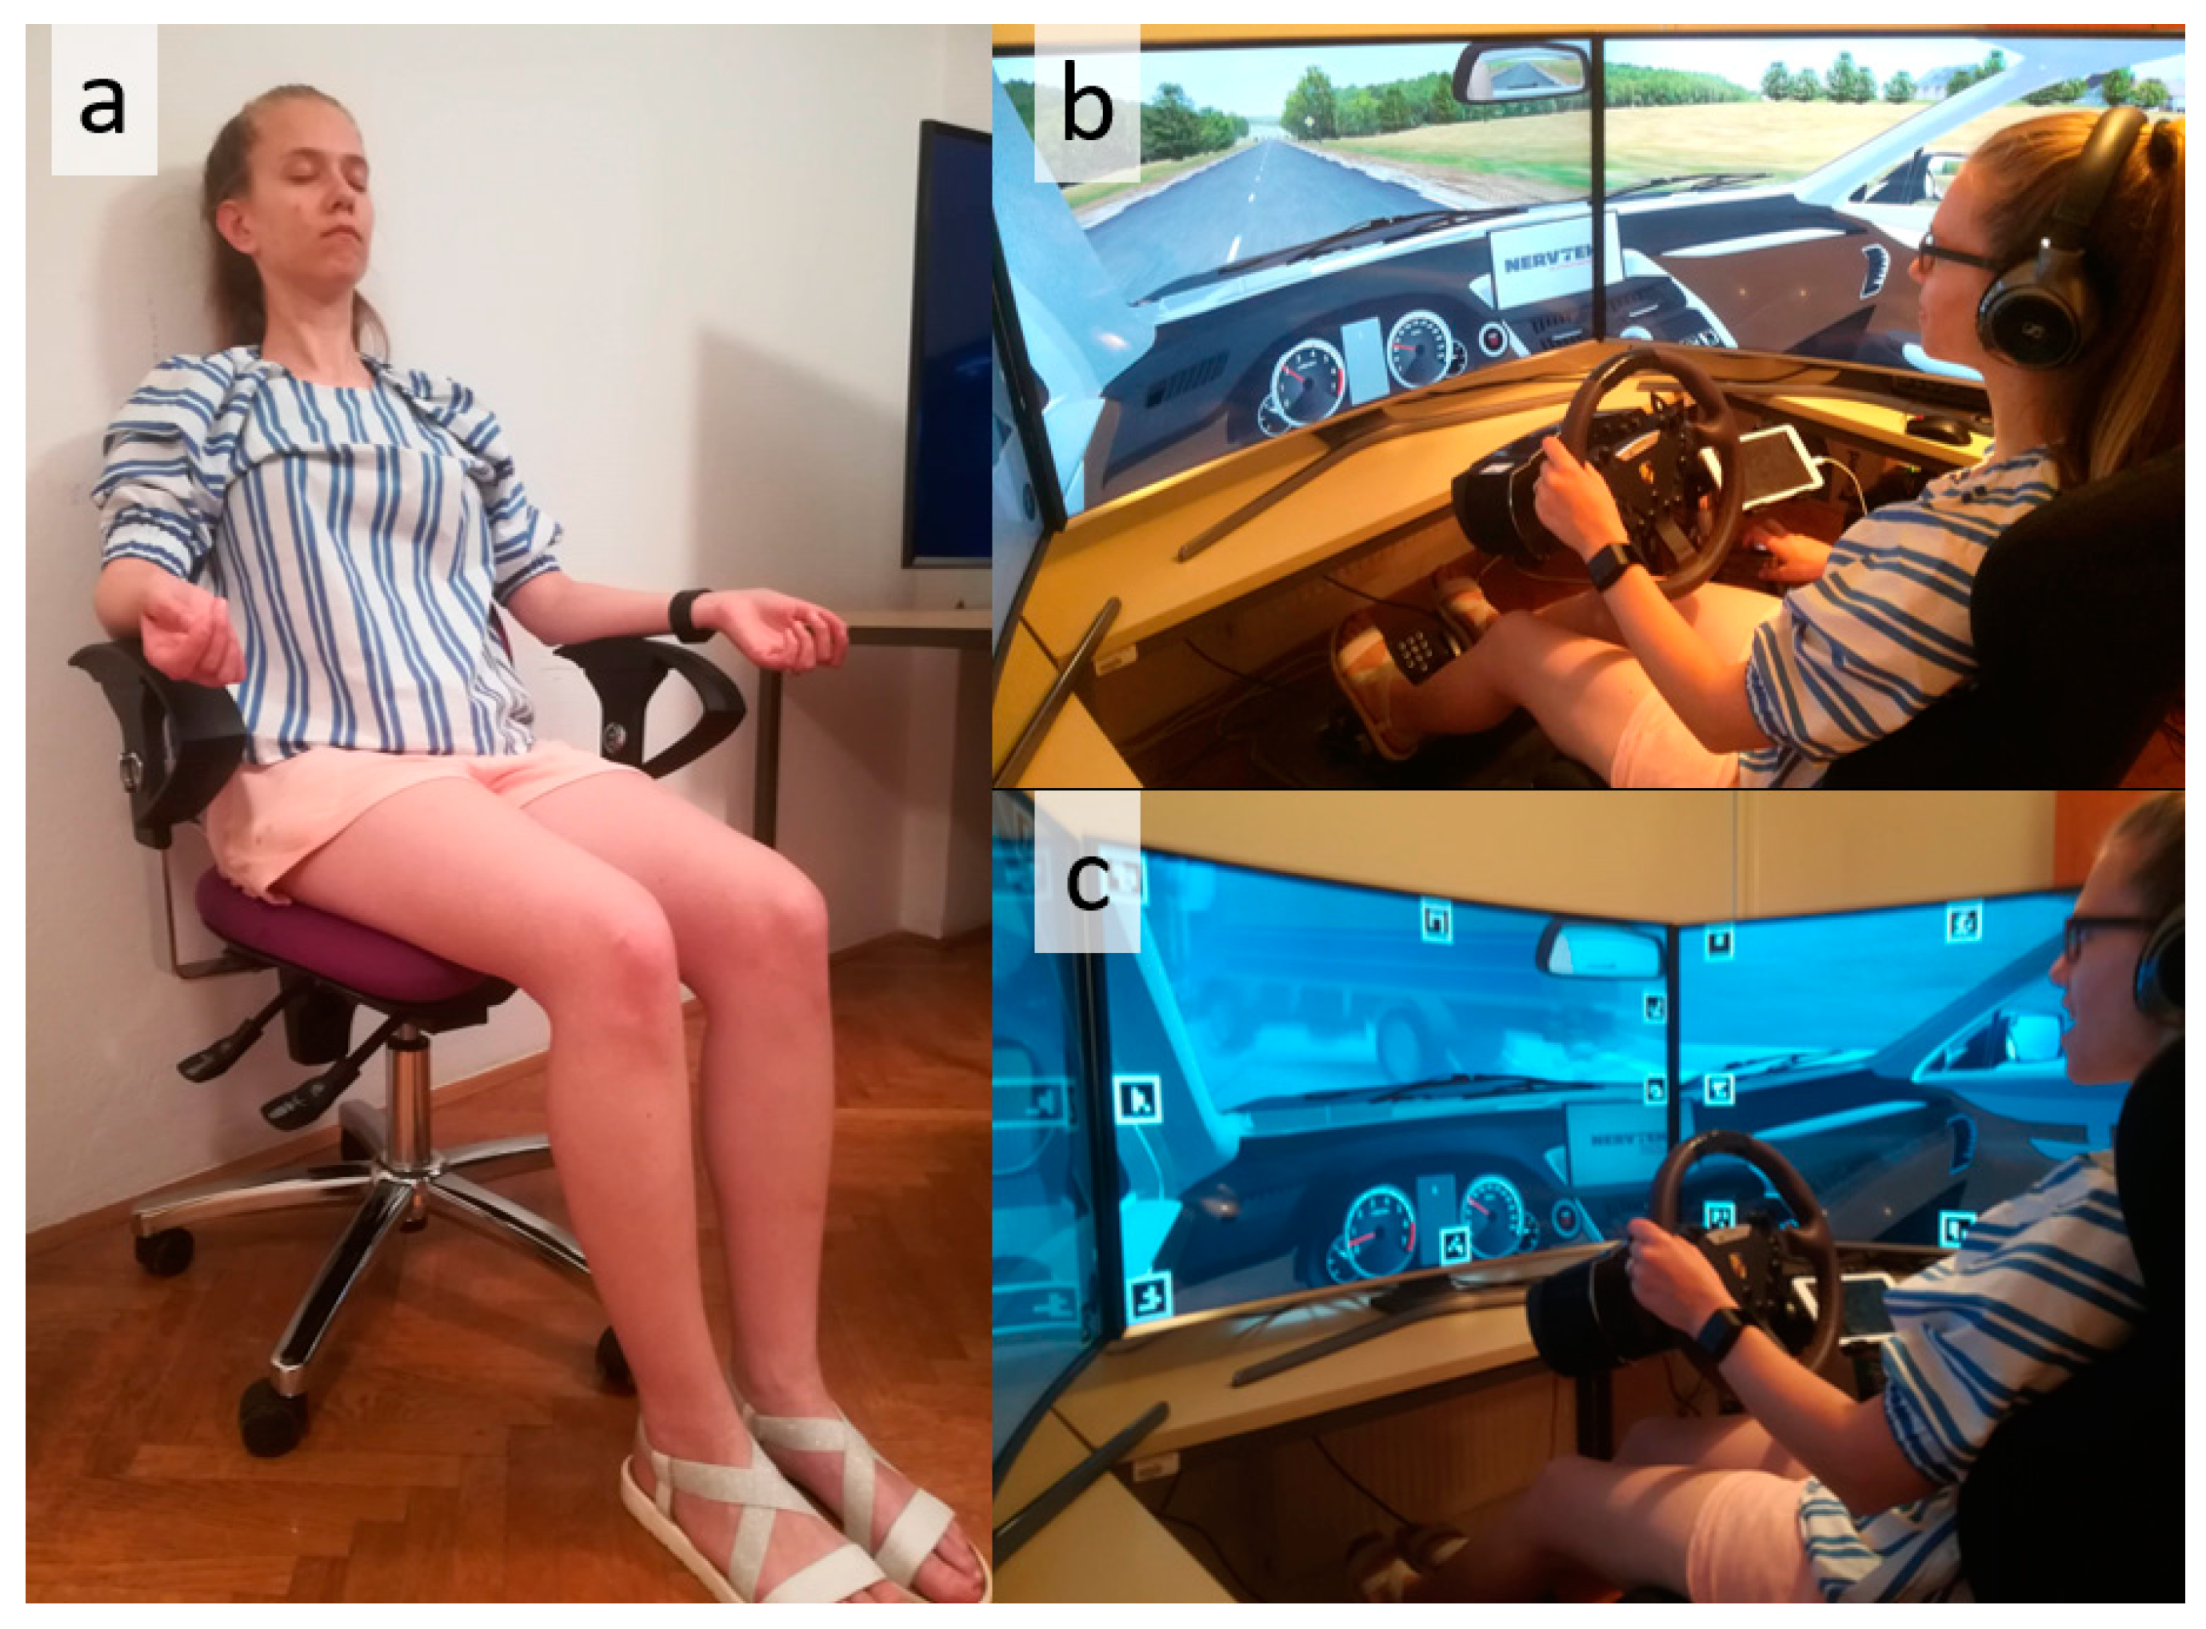
Phase 1: Baseline
Phase 2: Easy Driving
Phase 3: Demanding Driving
2.5.3. Variables
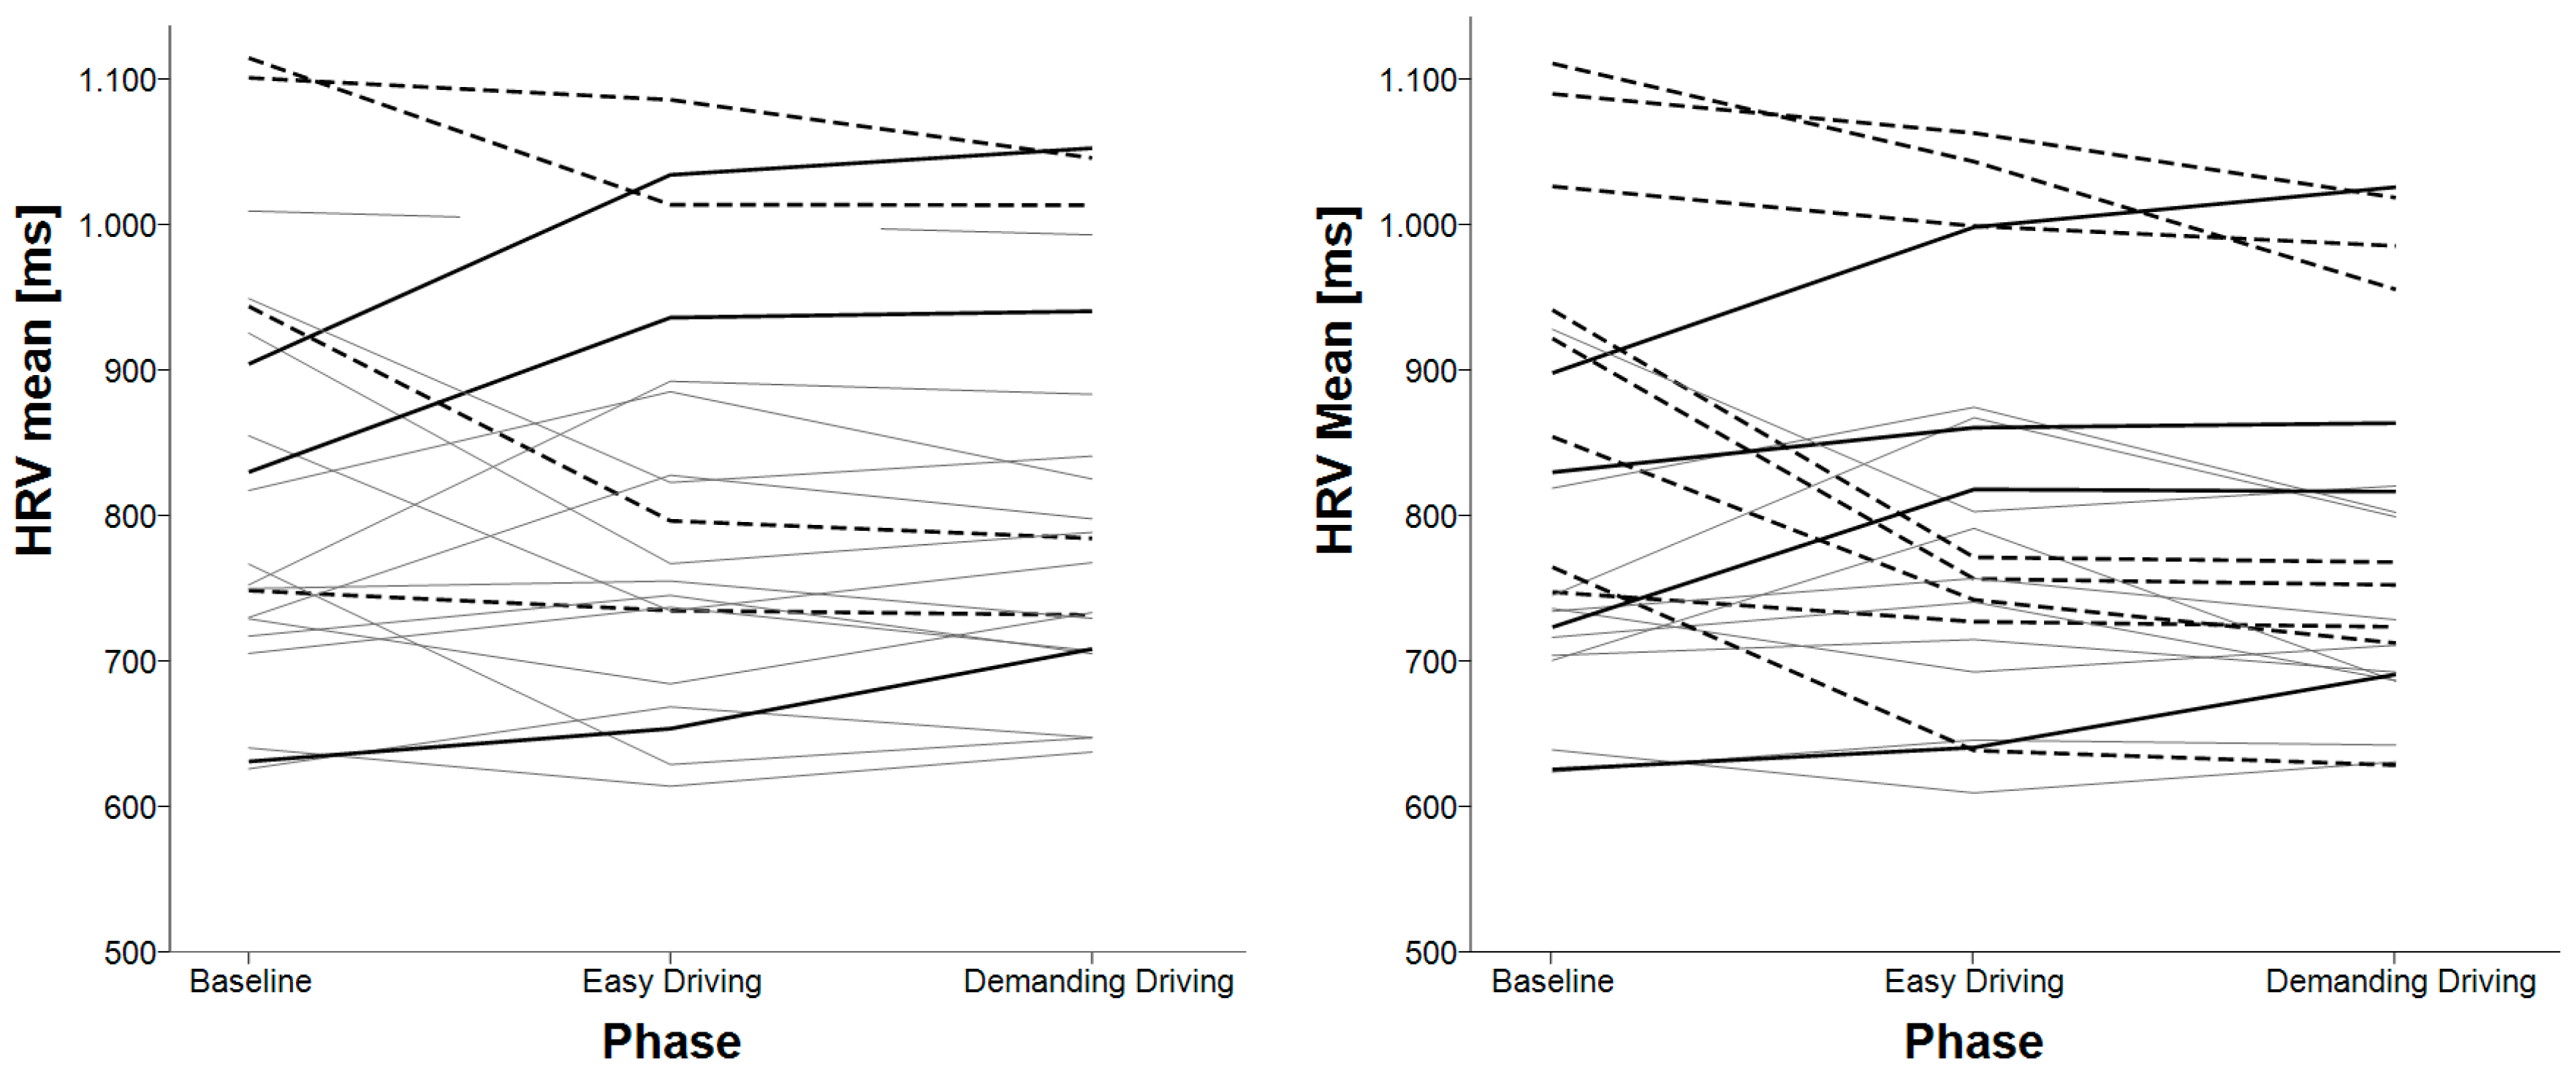
- Mean and median HRV,
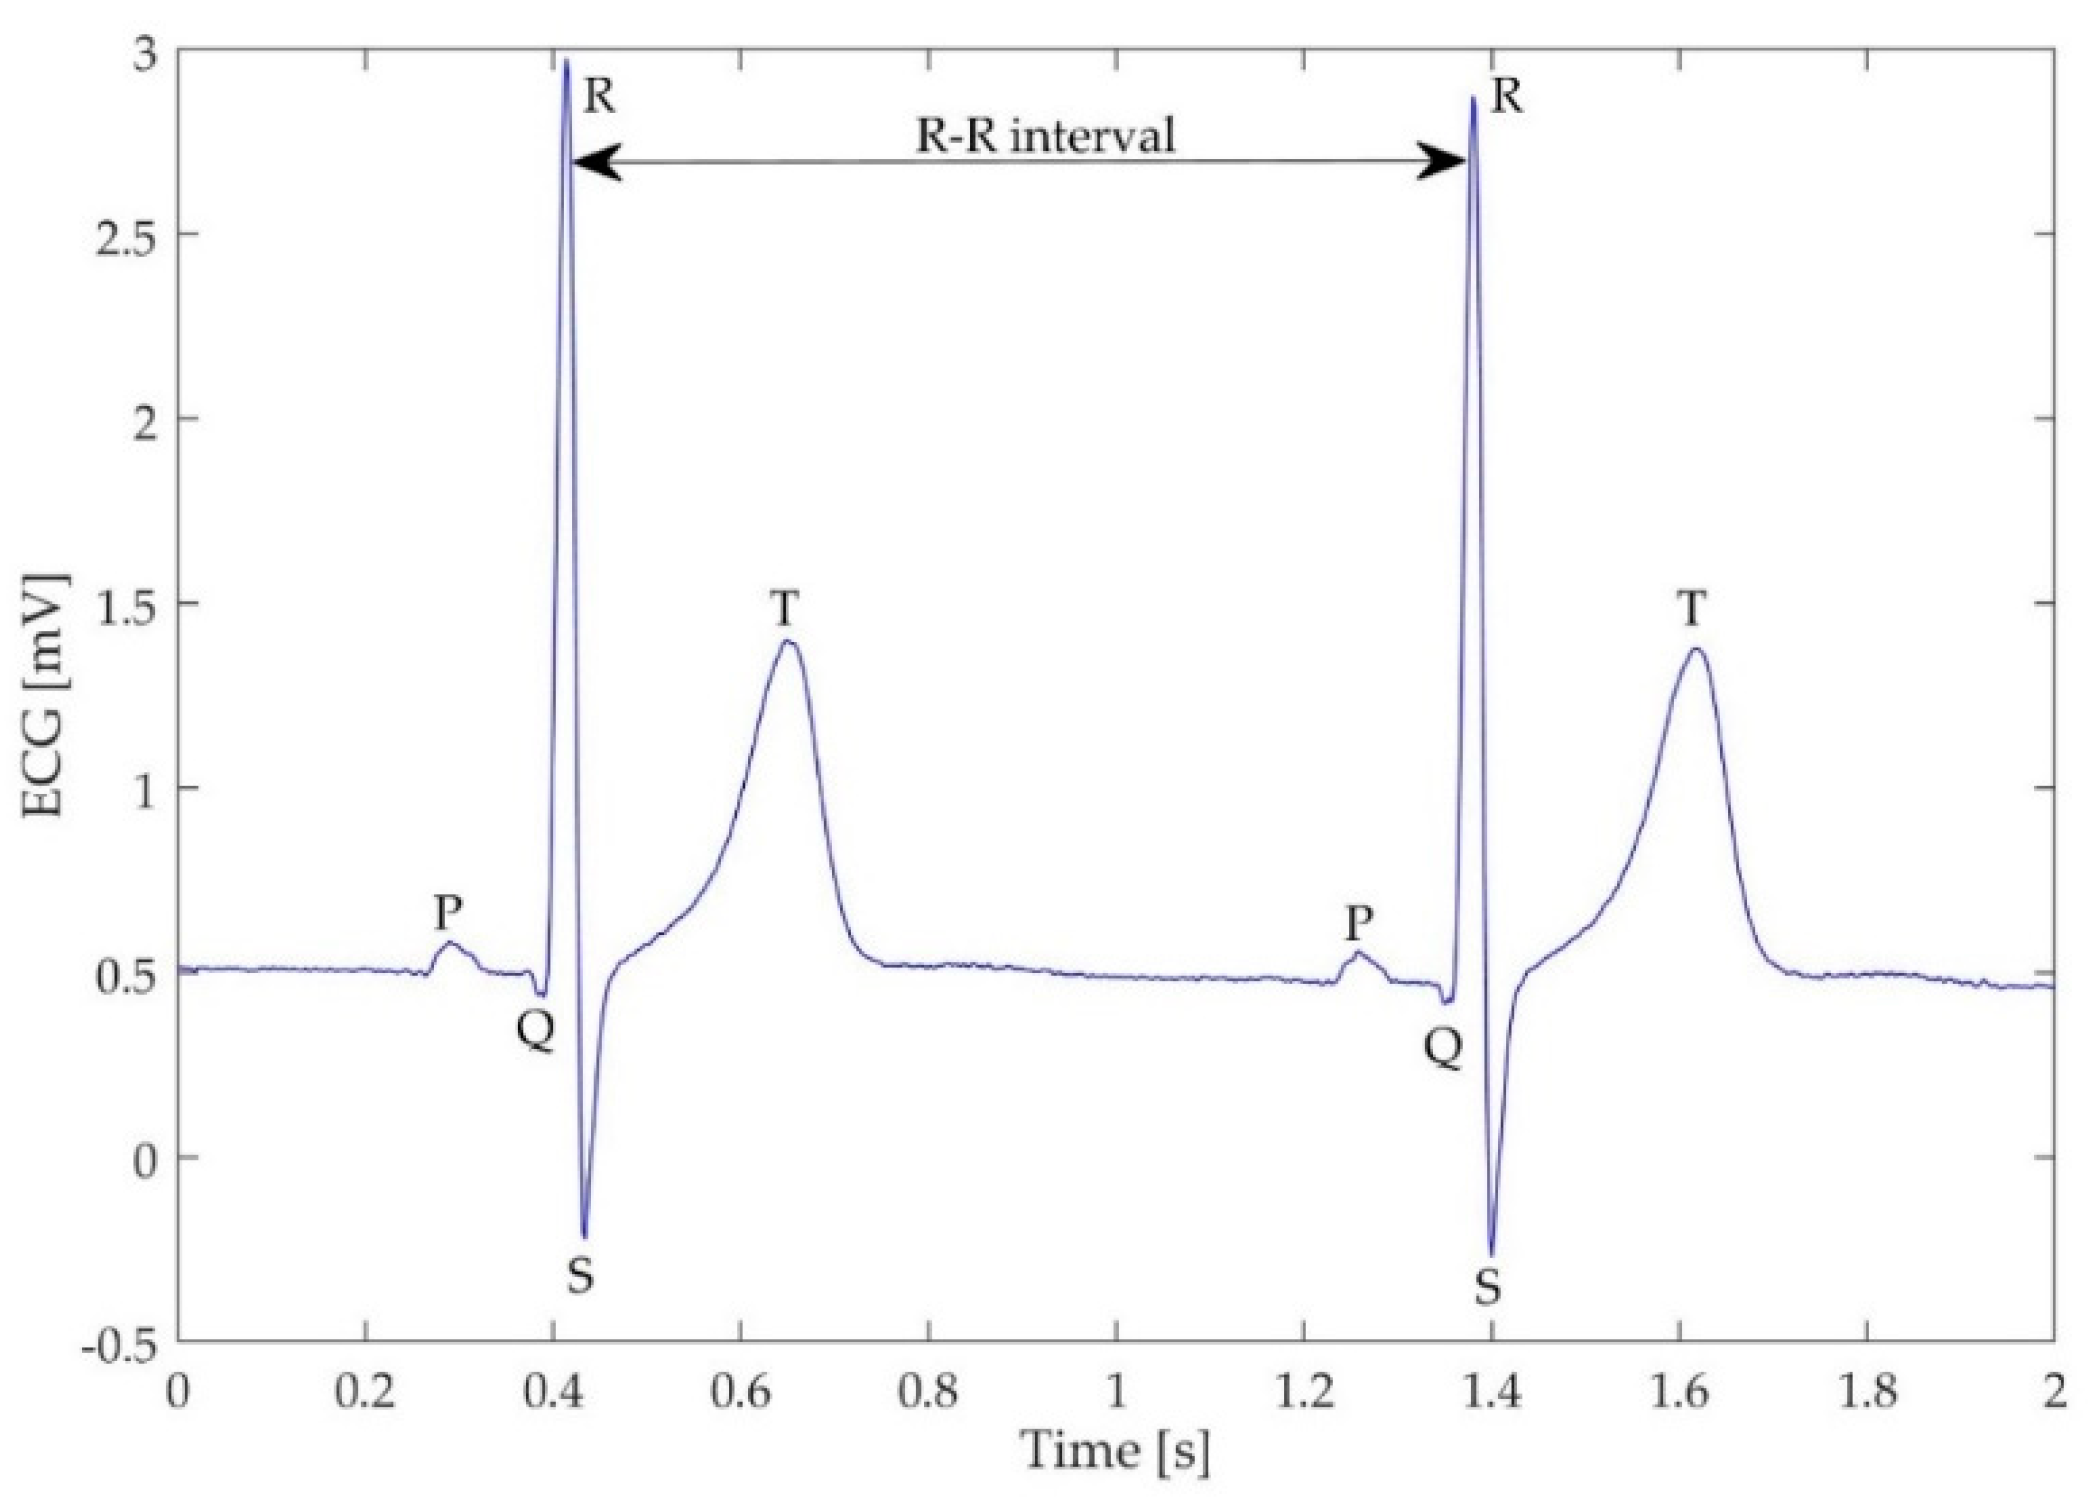
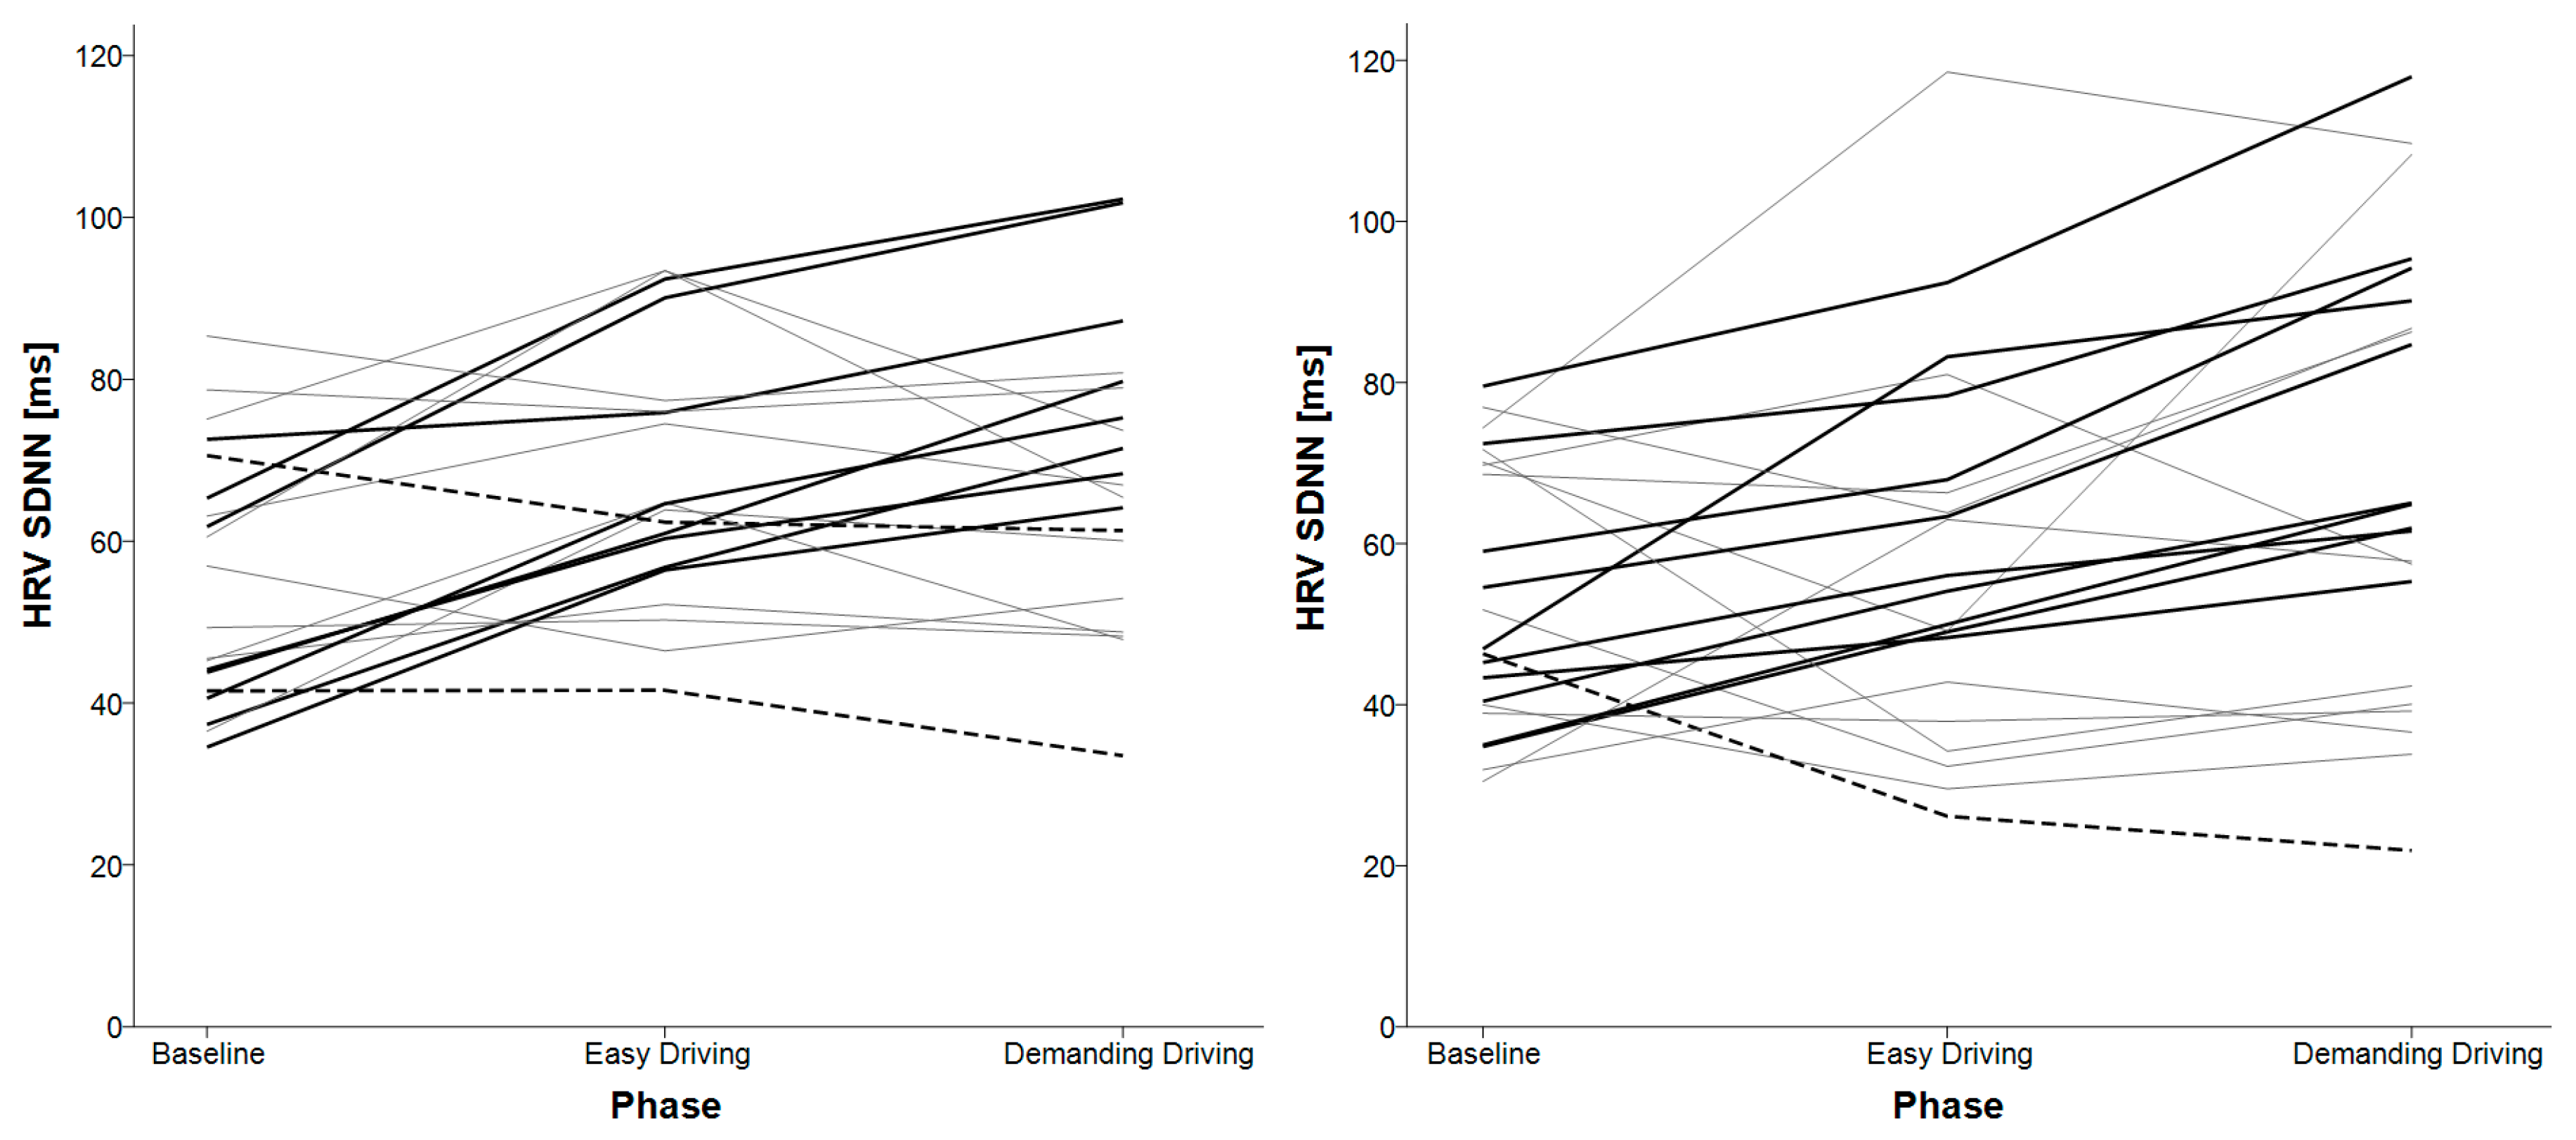
- HRV SDNN—standard deviation of the R–R intervals (also known as normal-to-normal or N–N intervals, Figure 3), which reflects cyclic components during the measurement,
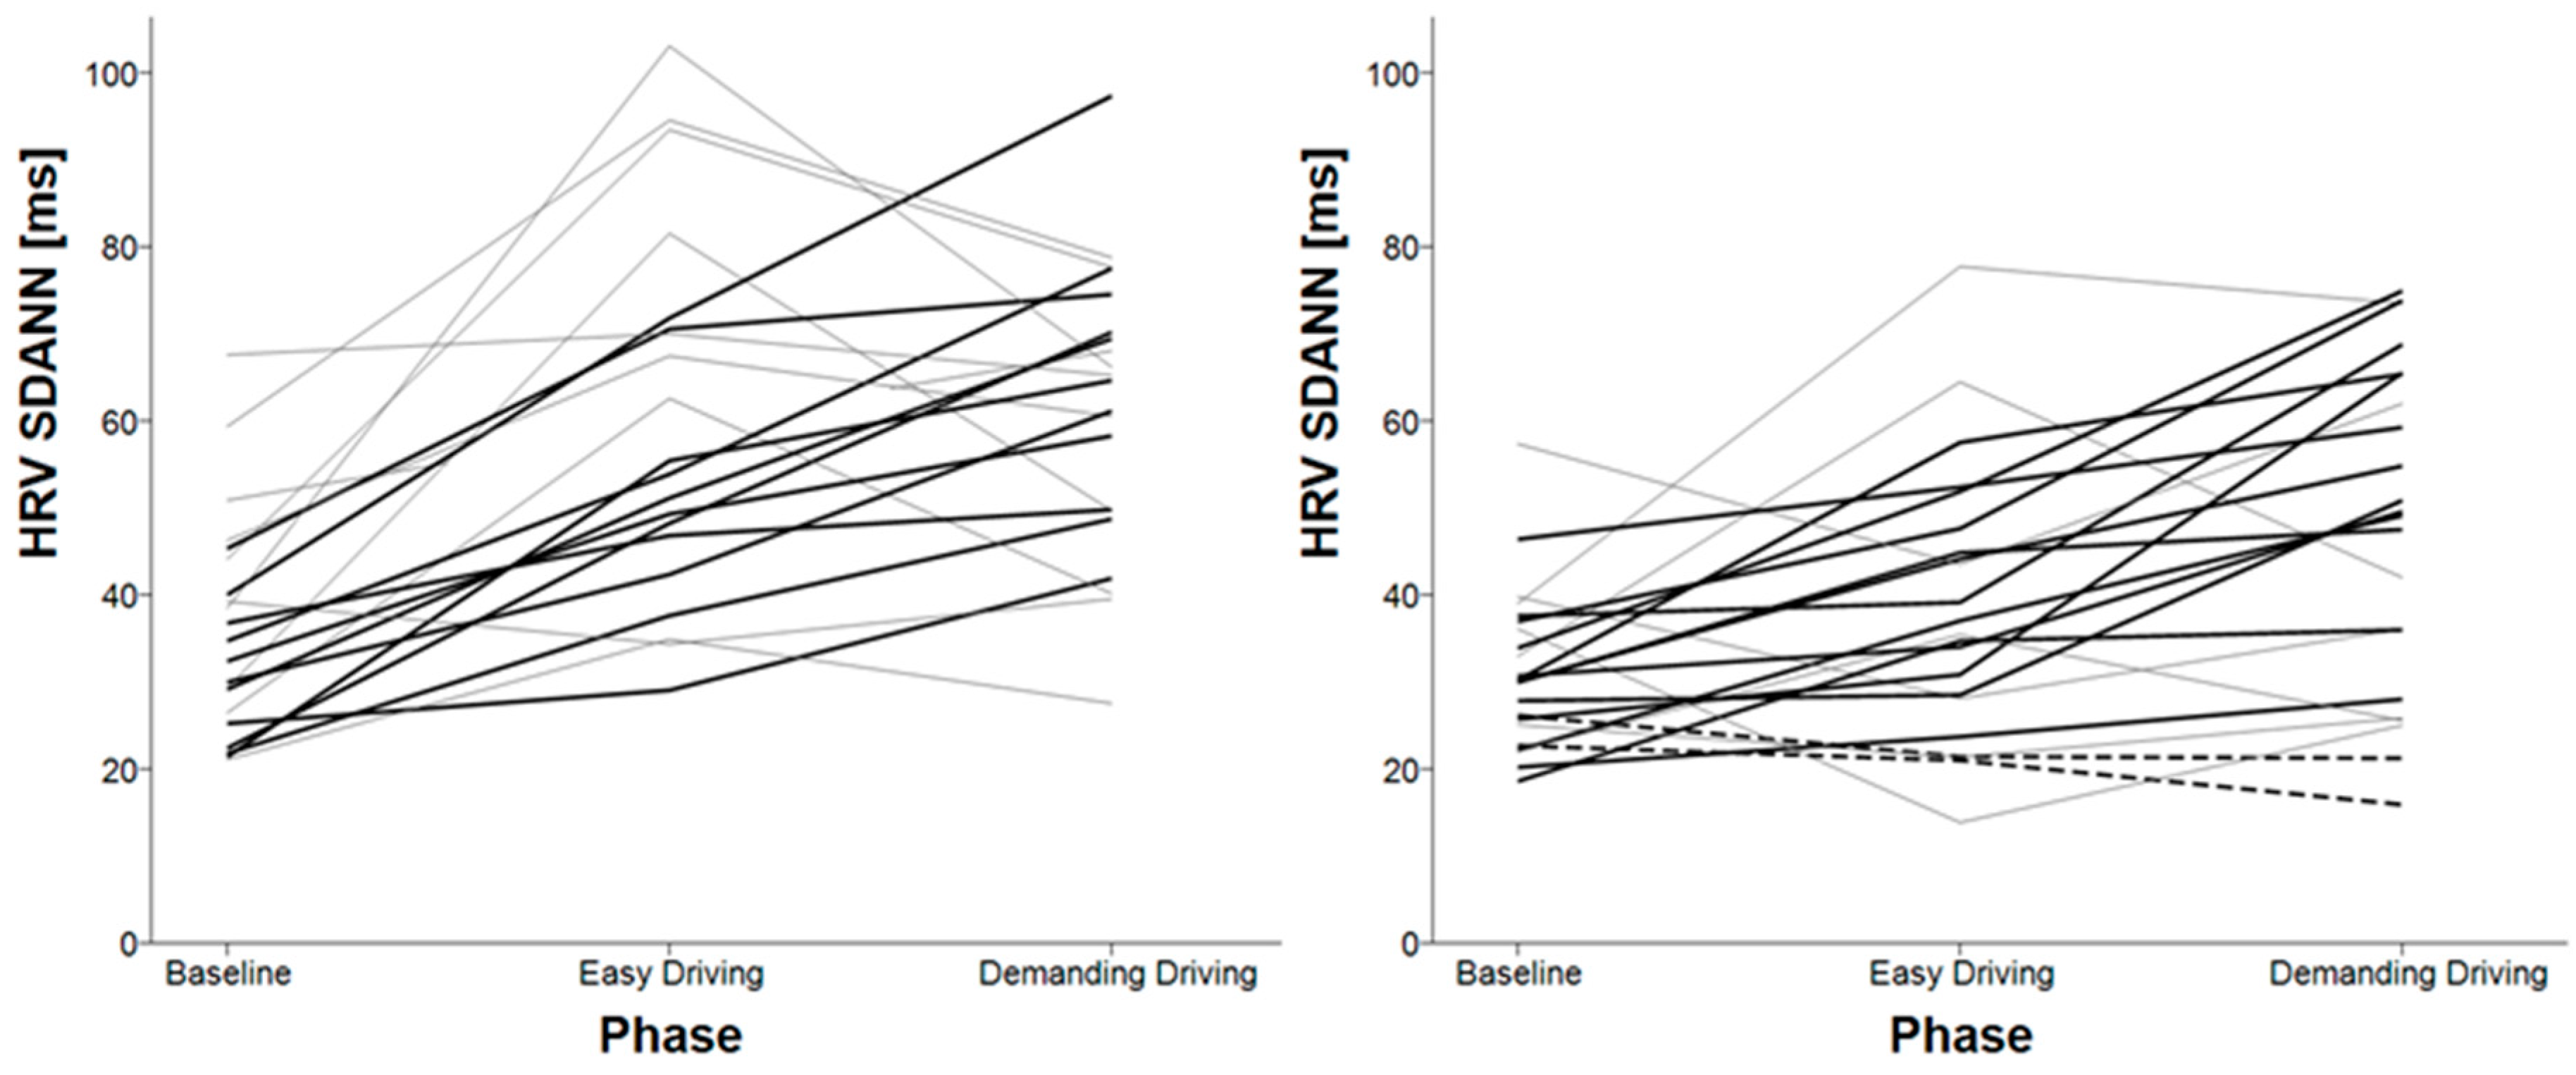
- HRV SDANN—standard deviation of the average R–R intervals over a shorter period (10 s), it reflects changes due to longer cycles,
- HRV SDNN index—mean of the standard deviations, calculated over a shorter period (10 s), it reflects changes due to shorter cycles,
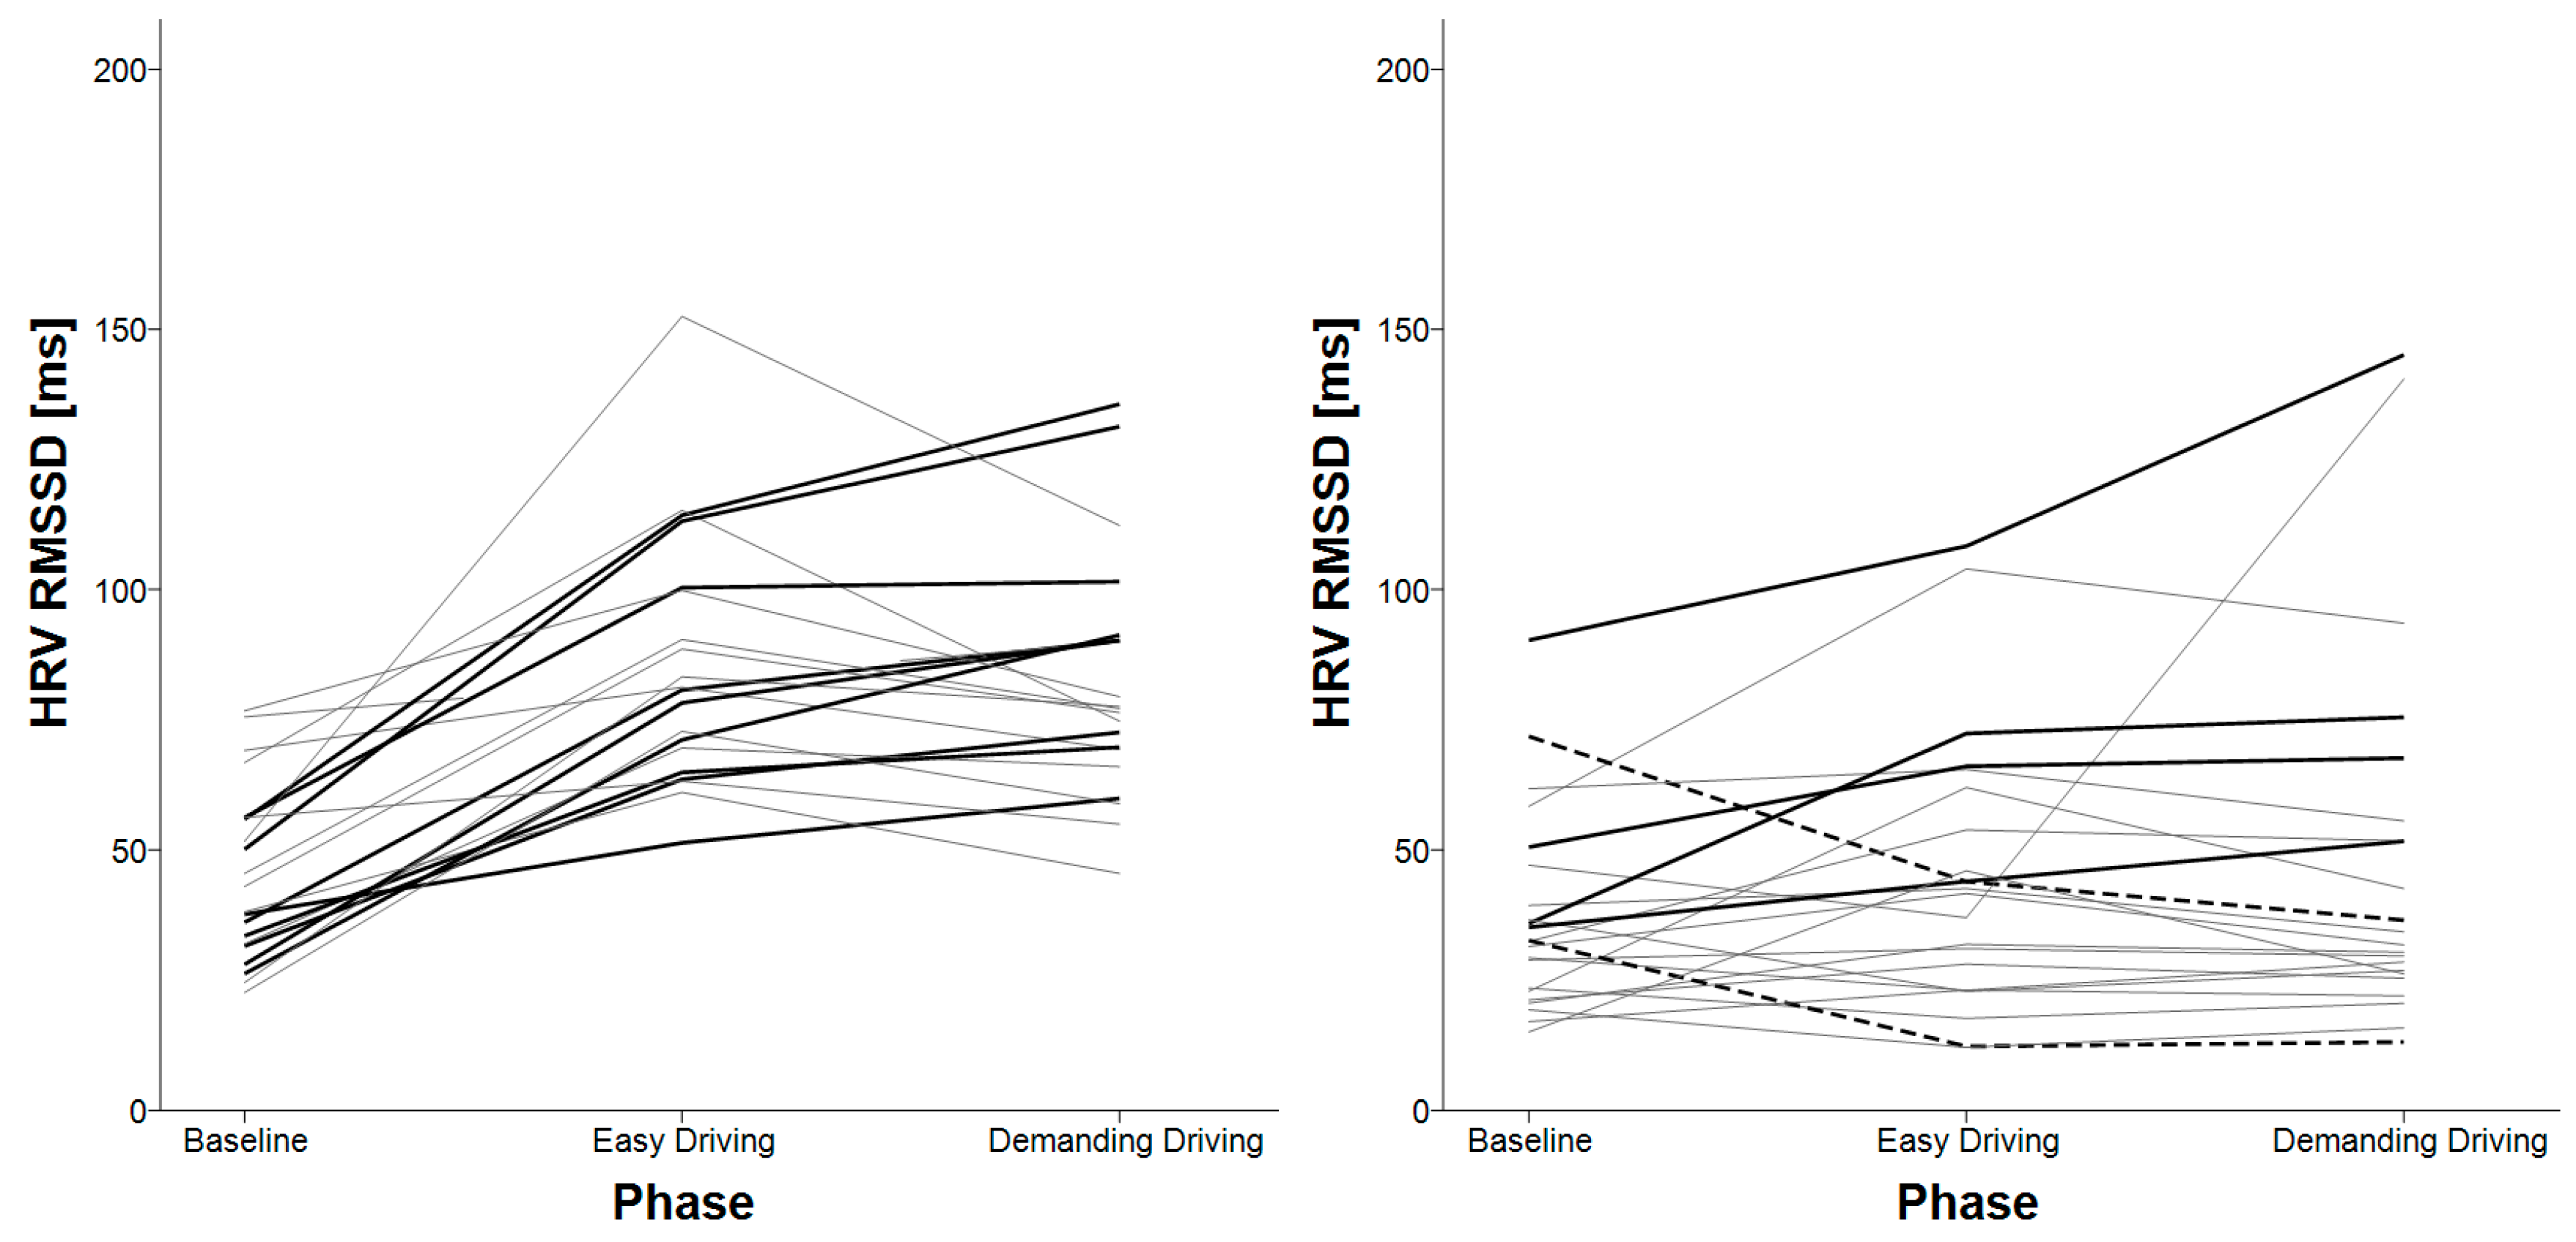
- HRV RMSSD—root mean square of successive differences, which reflects parasympathetic nerve system activity and is not affected by respiration process,
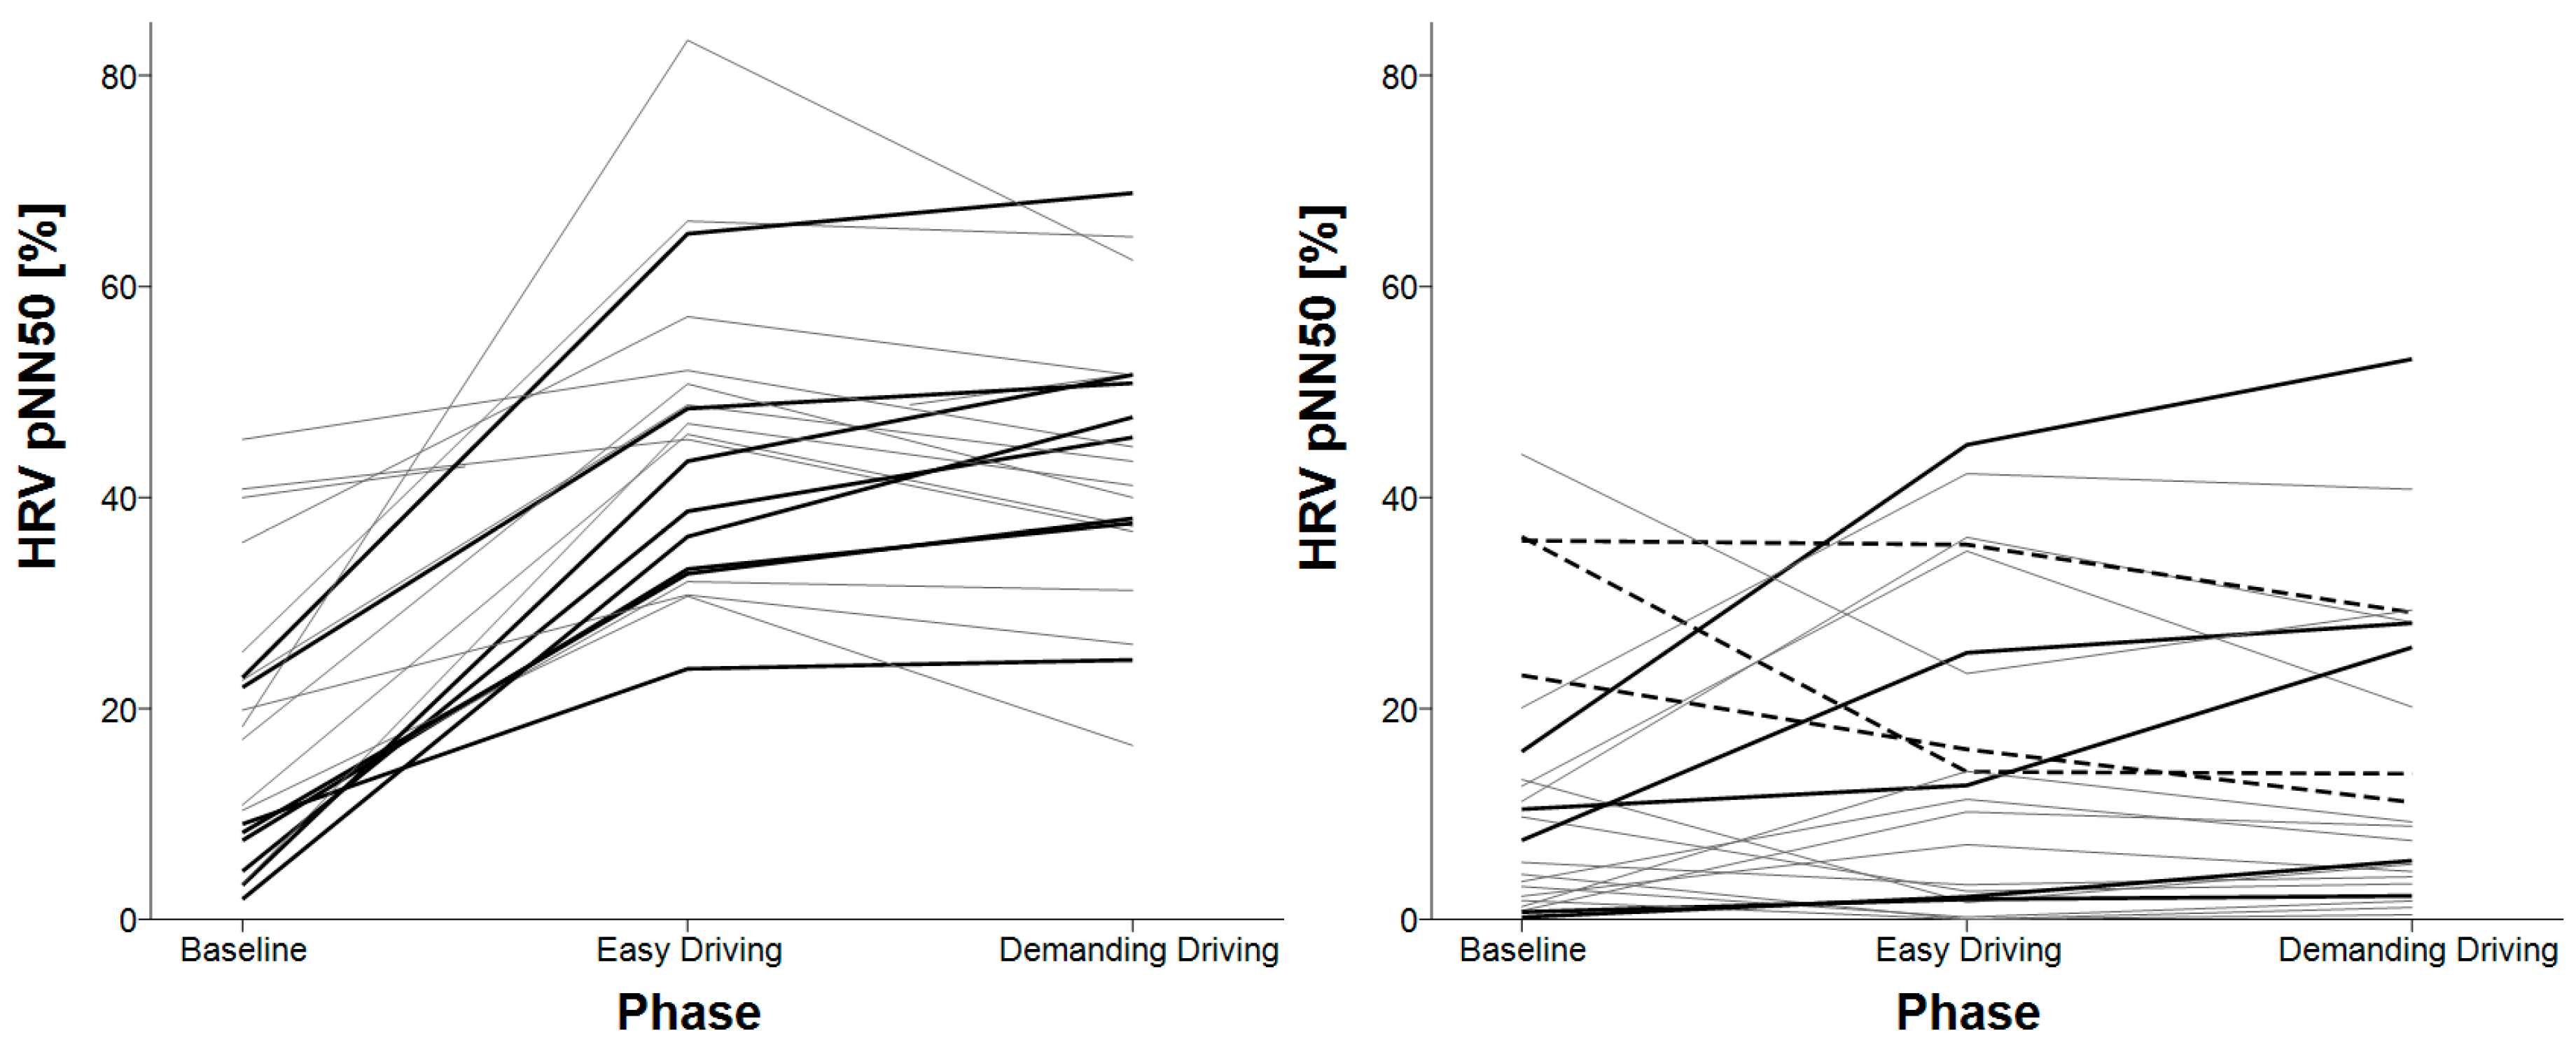
- HRV pNN50—the number of successive differences, greater than 50 ms, derived by the number of total N–N differences, should be highly correlated to RMSSD,
- Temperature mean and standard deviation.
2.5.4. Procedure
2.5.5. Statistical Analysis
3. Results
3.1. Mean Heart Rate Variability (HRV)
3.2. HRV SDNN
3.3. HRV Variables for Shorter Timeframes
3.4. HRV Successive Differences
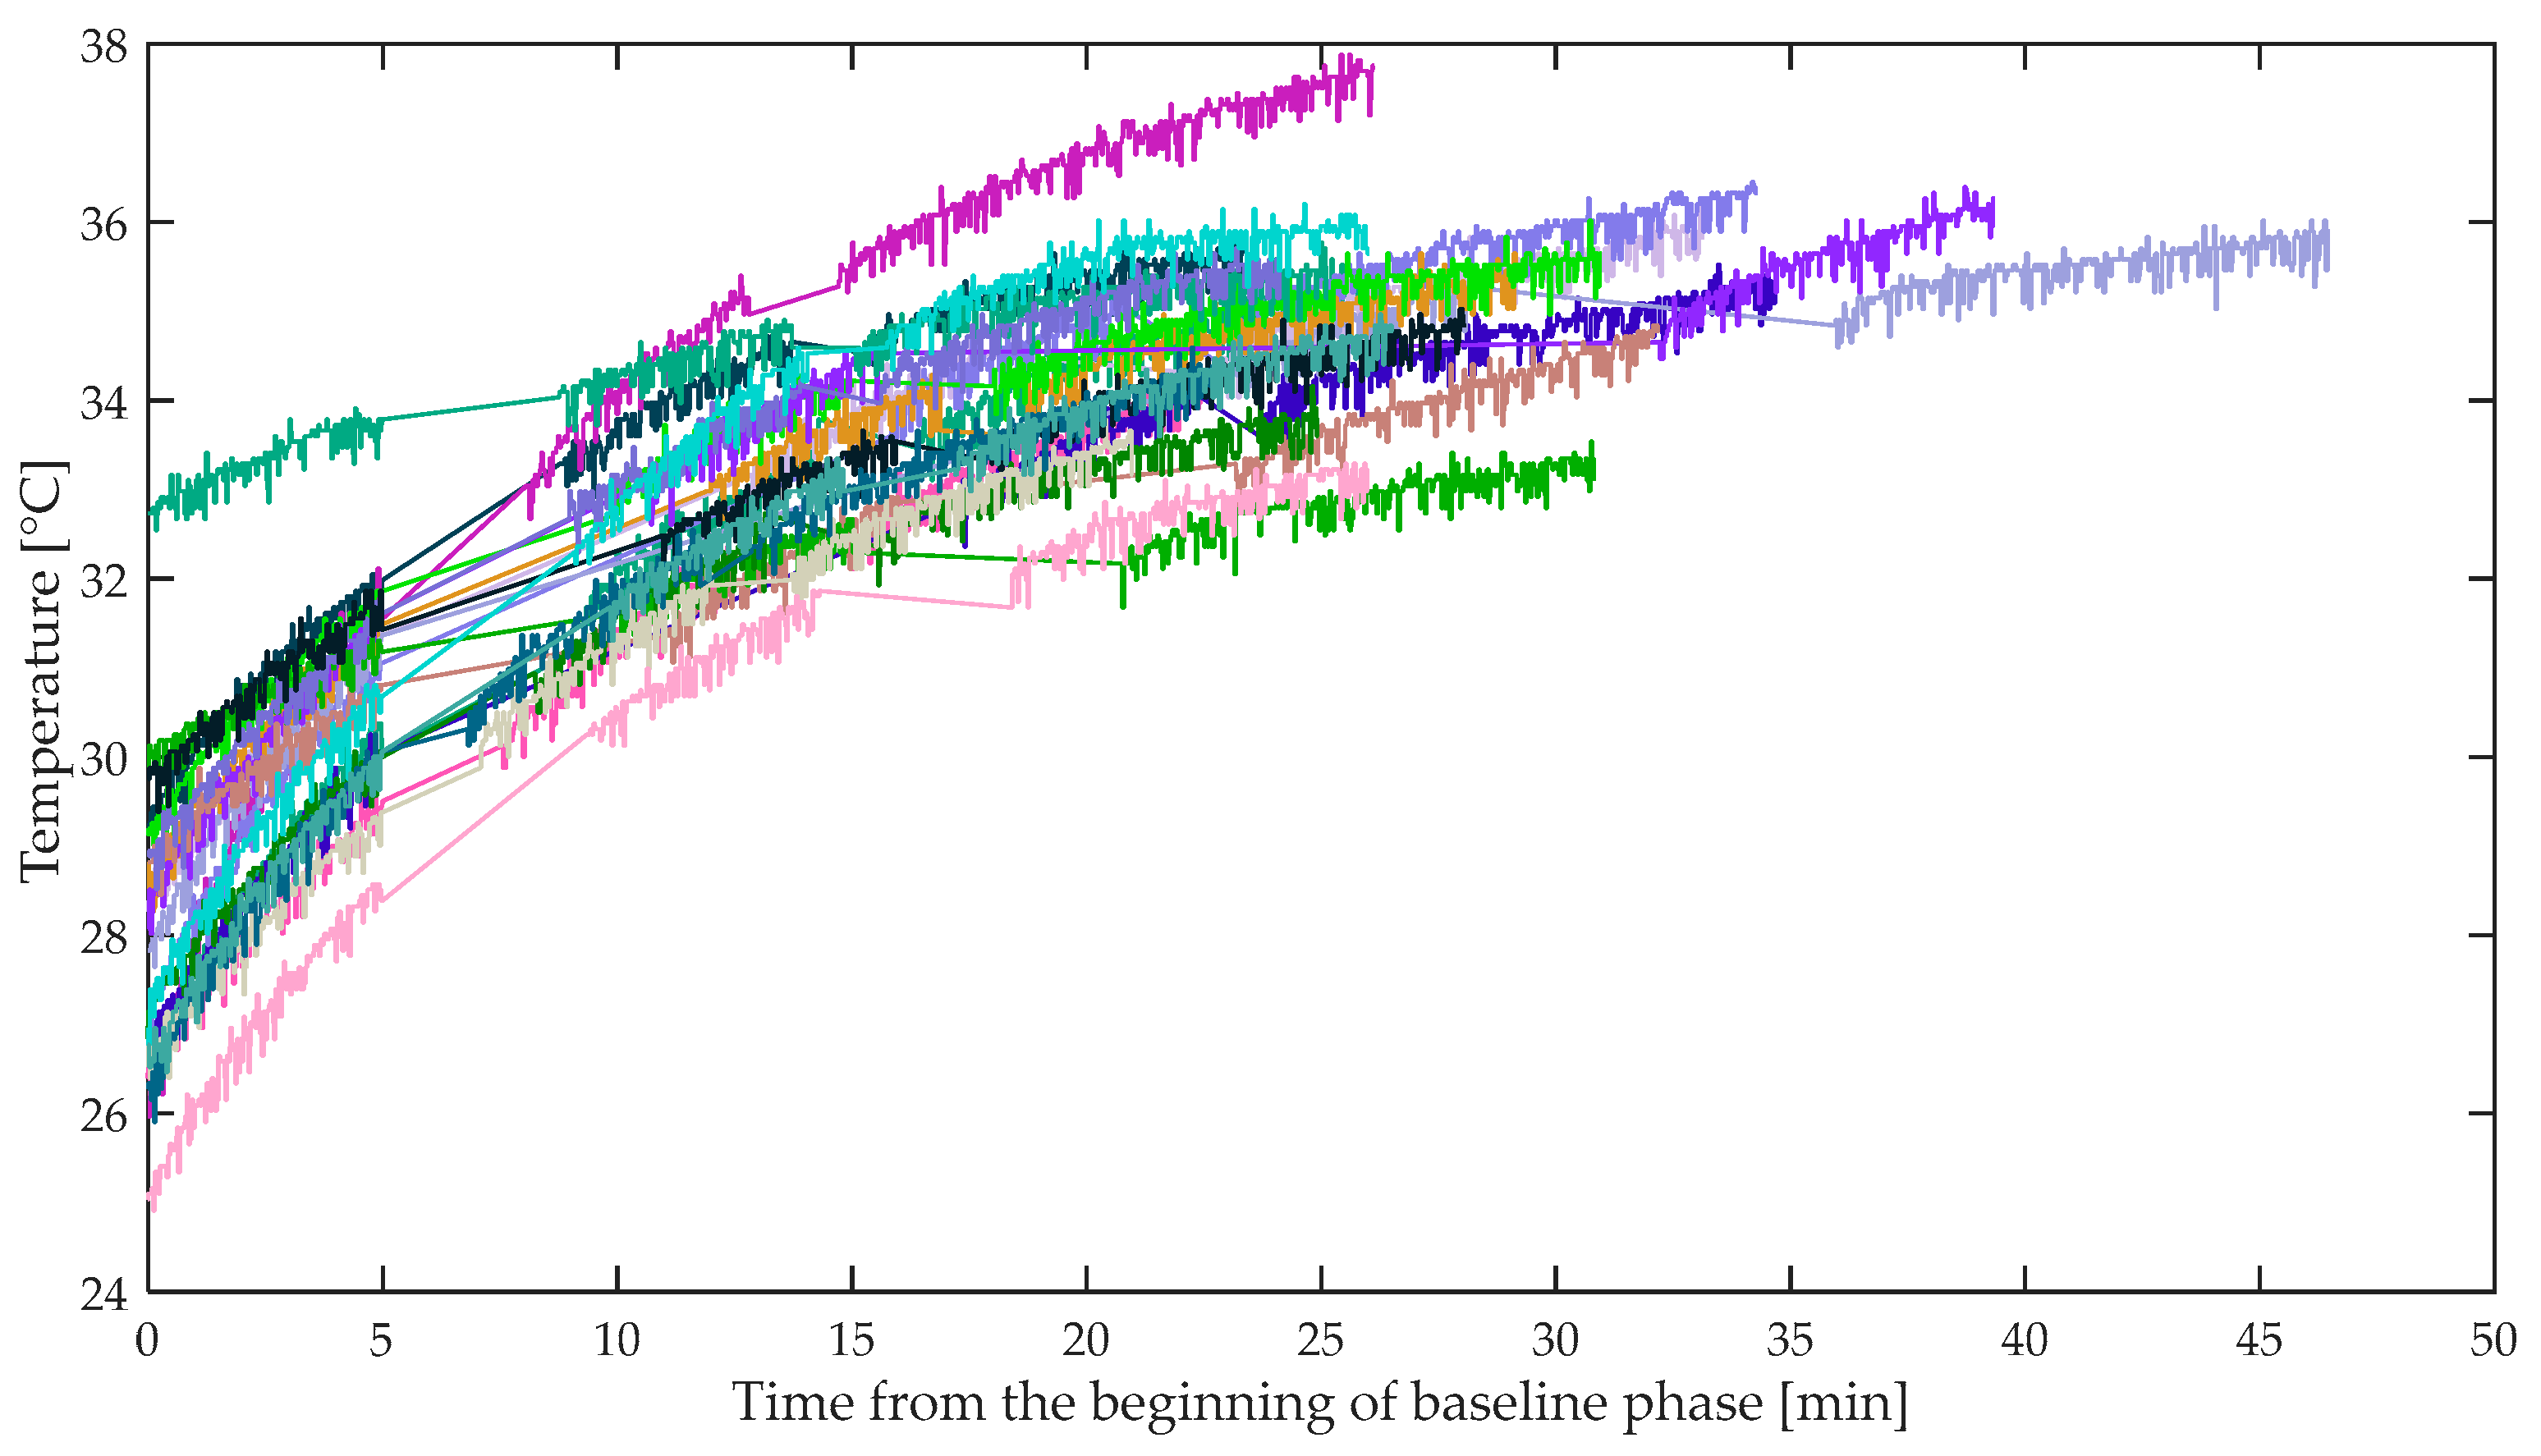
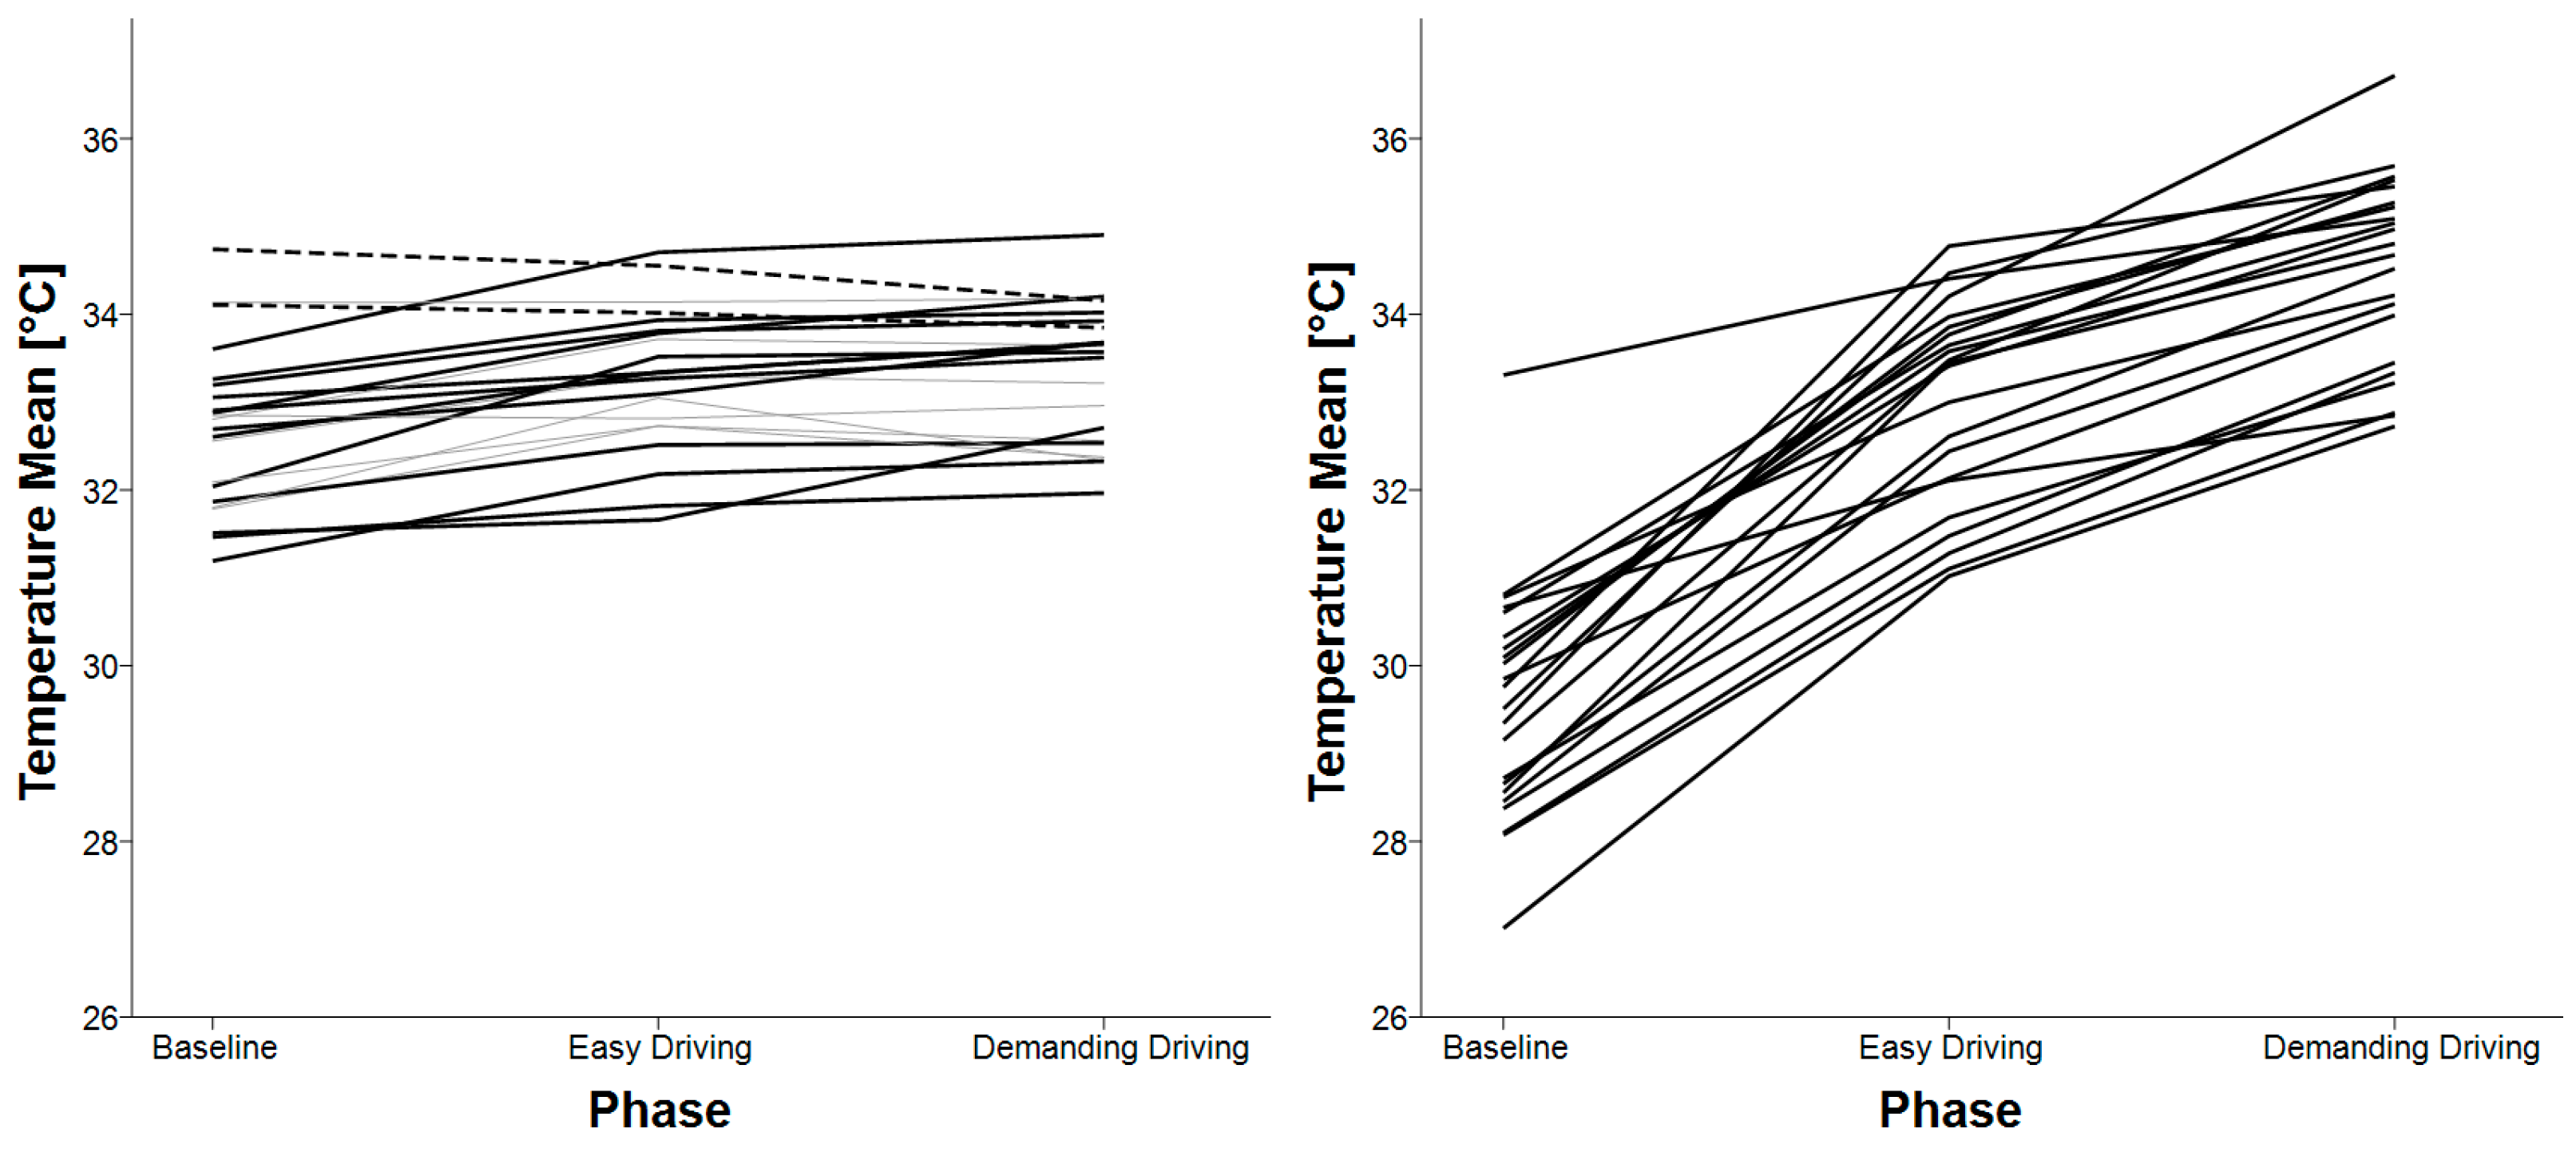
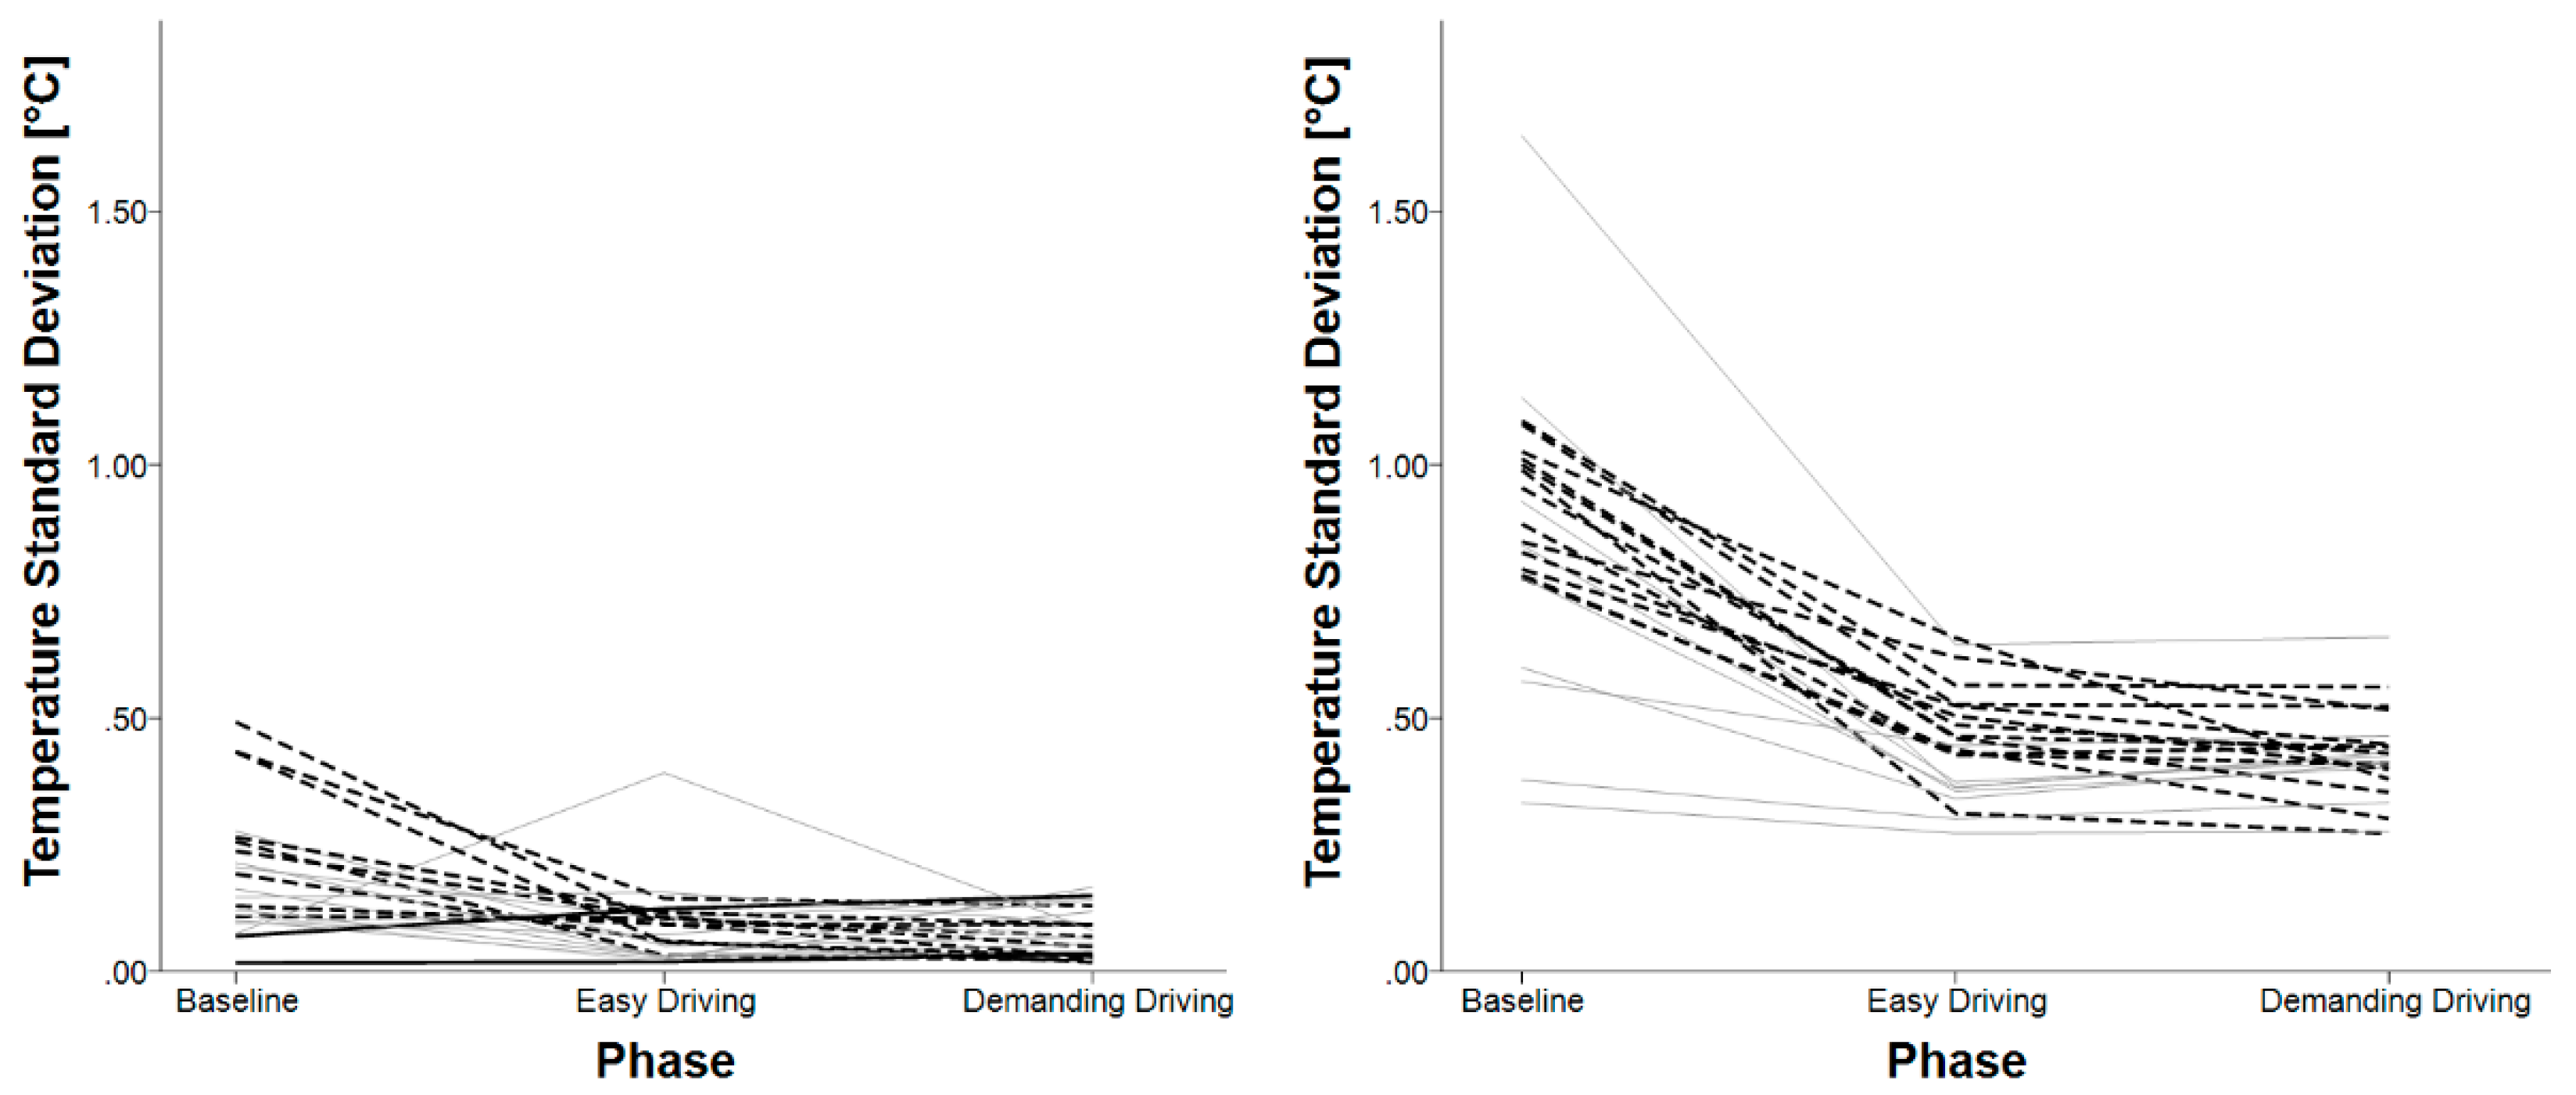
3.5. Skin Temperature
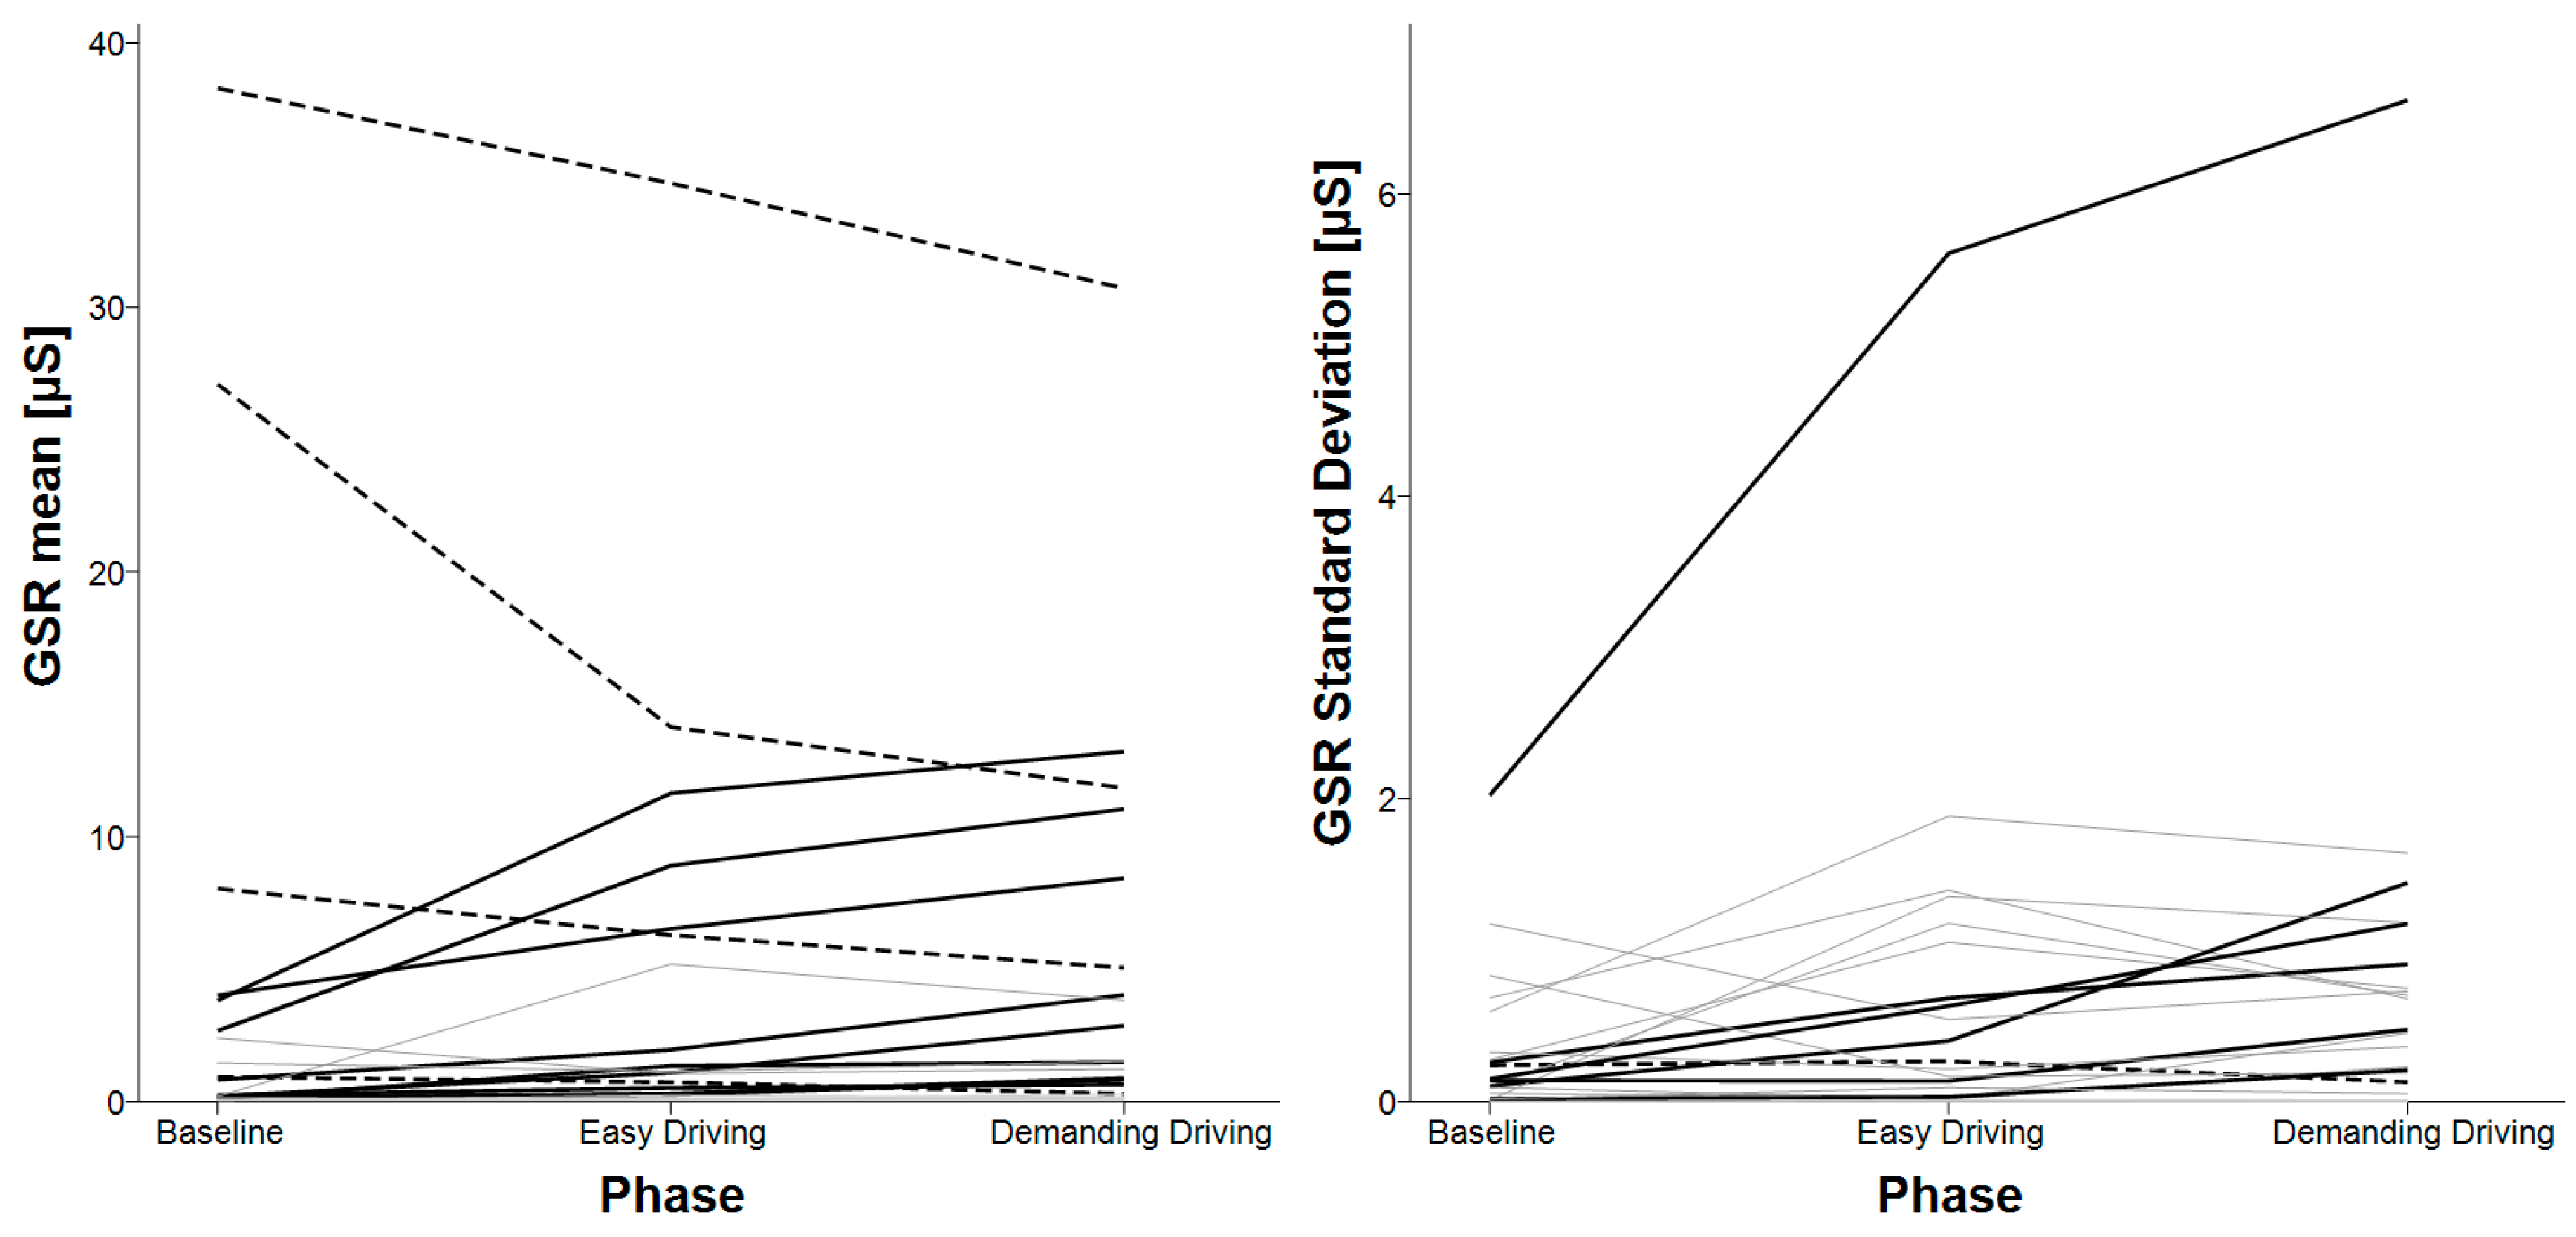
3.6. E4’s GSR
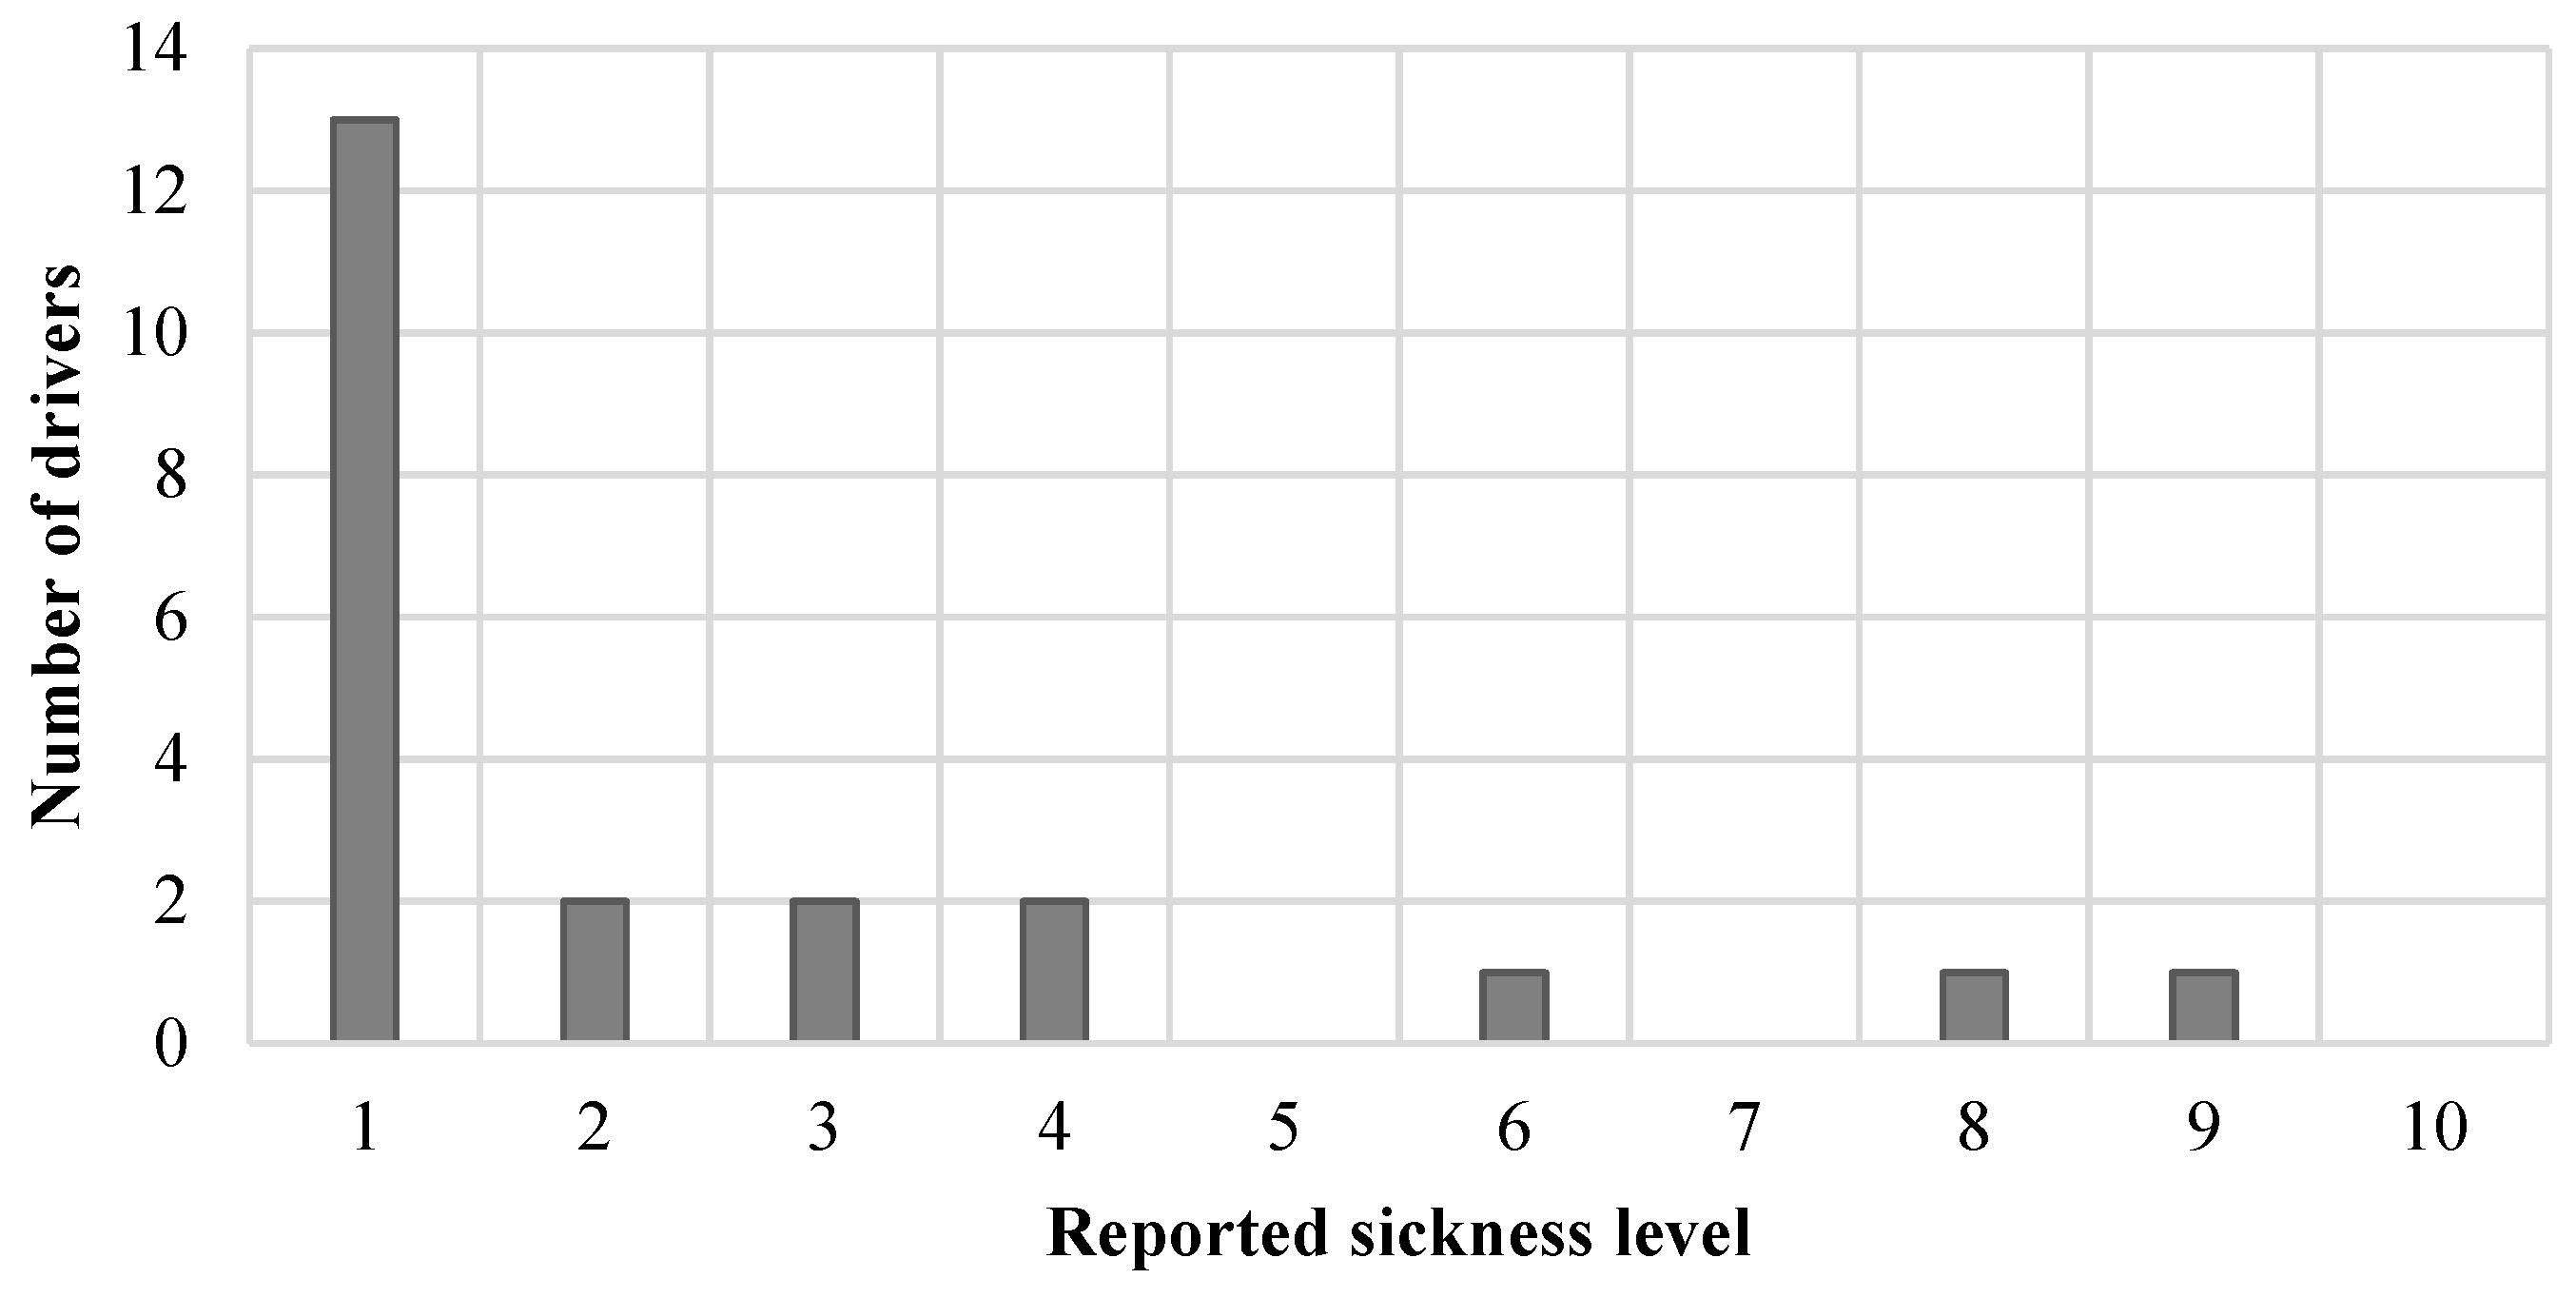
3.7. Sickness
4. Discussion and Conclusions
4.1. Photoplethysmography (PPG) Limitations
4.2. HRV Analysis
4.3. Skin Temperature Analysis
4.4. Galvanic Skin Response (GSR) Analysis
4.5. Driver Sickness
4.6. Conclusions
Author Contributions
Funding
Conflicts of Interest
References
- Petridou, E.; Moustaki, M. Human factors in the causation of road traffic crashes. Eur. J. Epidemiol. 2000, 16, 819–826. [Google Scholar] [CrossRef] [PubMed]
- Vitabile, S.; Paola, A.D.; Sorbello, F. Bright Pupil Detection in an Embedded, Real-Time Drowsiness Monitoring System. In Proceedings of the 2010 24th IEEE International Conference on Advanced Information Networking and Applications, Perth, Australia, 20–23 April 2010; pp. 661–668. [Google Scholar]
- Bergasa, L.M.; Nuevo, J.; Sotelo, M.A.; Barea, R.; Lopez, M.E. Real-time system for monitoring driver vigilance. IEEE Trans. Intell. Trans. Syst. 2006, 7, 63–77. [Google Scholar] [CrossRef]
- Lin, C.; Chen, Y.; Huang, T.; Chiu, T.; Ko, L.; Liang, S.; Hsieh, H.; Hsu, S.; Duann, J. Development of Wireless Brain Computer Interface With Embedded Multitask Scheduling and its Application on Real-Time Driver’s Drowsiness Detection and Warning. IEEE Trans. Biomed. Eng. 2008, 55, 1582–1591. [Google Scholar] [CrossRef] [PubMed]
- King, L.M.; Nguyen, H.T.; Lal, S.K.L. Early Driver Fatigue Detection from Electroencephalography Signals using Artificial Neural Networks. In Proceedings of the 2006 International Conference of the IEEE Engineering in Medicine and Biology Society, New York, NY, USA, 30 August–3 September 2006; pp. 2187–2190. [Google Scholar]
- Li, W.; He, Q.; Fan, X.; Fei, Z. Evaluation of driver fatigue on two channels of EEG data. Neurosci. Lett. 2012, 506, 235–239. [Google Scholar] [CrossRef]
- Eoh, H.J.; Chung, M.K.; Kim, S.-H. Electroencephalographic study of drowsiness in simulated driving with sleep deprivation. Int. J. Ind. Ergon. 2005, 35, 307–320. [Google Scholar] [CrossRef]
- Khushaba, R.N.; Kodagoda, S.; Lal, S.; Dissanayake, G. Driver Drowsiness Classification Using Fuzzy Wavelet-Packet-Based Feature-Extraction Algorithm. IEEE Trans. Biomed. Eng. 2011, 58, 121–131. [Google Scholar] [CrossRef]
- Giusti, A.; Zocchi, C.; Rovetta, A. A Noninvasive System for Evaluating Driver Vigilance Level Examining Both Physiological and Mechanical Data. IEEE Trans. Intell. Trans. Syst. 2009, 10, 127–134. [Google Scholar] [CrossRef]
- Lee, B.; Chung, W. Driver Alertness Monitoring Using Fusion of Facial Features and Bio-Signals. IEEE Sens. J. 2012, 12, 2416–2422. [Google Scholar] [CrossRef]
- Bundele, M.M.; Banerjee, R. Detection of Fatigue of Vehicular Driver Using Skin Conductance and Oximetry Pulse: A Neural Network Approach. In Proceedings of the 11th International Conference on Information Integration and Web-based Applications & Services, Kuala Lumpur, Malaysia, 14–16 December 2009; ACM: New York, NY, USA, 2009; pp. 739–744. [Google Scholar]
- Shin, H.; Jung, S.; Kim, J.; Chung, W. Real time car driver’s condition monitoring system. In Proceedings of the 2010 IEEE SENSORS, Kona, HI, USA, 1–4 November 2010; pp. 951–954. [Google Scholar]
- Jung, S.-J.; Shin, H.-S.; Chung, W.-Y. Driver fatigue and drowsiness monitoring system with embedded electrocardiogram sensor on steering wheel. IET Intell. Trans. Syst. 2014, 8, 43–50. [Google Scholar] [CrossRef]
- Matsuda, T.; Makikawa, M. ECG monitoring of a car driver using capacitively-coupled electrodes. In Proceedings of the 2008 30th Annual International Conference of the IEEE Engineering in Medicine and Biology Society, Vancouver, BC, Canada, 20–25 August 2008; pp. 1315–1318. [Google Scholar]
- Thum Chia Chieh; Mustafa, M.M.; Hussain, A.; Hendi, S.F.; Majlis, B.Y. Development of vehicle driver drowsiness detection system using electrooculogram (EOG). In Proceedings of the 2005 1st International Conference on Computers, Communications, Signal Processing with Special Track on Biomedical Engineering, Kuala Lumpur, Malaysia, 14–16 November 2005; pp. 165–168. [Google Scholar]
- Ma, Z.; Li, B.C.; Yan, Z. Wearable driver drowsiness detection using electrooculography signal. In Proceedings of the 2016 IEEE Topical Conference on Wireless Sensors and Sensor Networks (WiSNet), Austin, TX, USA, 24–27 January 2016; pp. 41–43. [Google Scholar]
- Shih, C.; Cheng, S. A driver’s physiological monitoring system based on photodiode sensor with reflective optics element. In Proceedings of the 2016 IEEE International Conference on Vehicular Electronics and Safety (ICVES), Beijing, China, 10–12 July 2016; pp. 1–4. [Google Scholar]
- Healey, J.; Seger, J.; Picard, R. Quantifying driver stress: Developing a system for collecting and processing bio-metric signals in natural situations. Biomed. Sci. Instrum. 1999, 35, 193–198. [Google Scholar]
- Healey, J.; Picard, R. SmartCar: Detecting driver stress. In Proceedings of the 15th International Conference on Pattern Recognition. ICPR-2000, Barcelona, Spain, 3–7 September 2000; Volume 4, pp. 218–221. [Google Scholar]
- Fairclough, S.H.; Spiridon, E. Cardiovascular and electrocortical markers of anger and motivation during a simulated driving task. Int. J. Psychophysiol. 2012, 84, 188–193. [Google Scholar] [CrossRef] [PubMed]
- Walter, M.; Eilebrecht, B.; Wartzek, T.; Leonhardt, S. The Smart Car Seat: Personalized Monitoring of Vital Signs in Automotive Applications. Personal Ubiquitous Comput. 2011, 15, 707–715. [Google Scholar] [CrossRef]
- Yang, C.; Wu, C.; Chou, C.; Yang, T. Vehicle driver’s ECG and sitting posture monitoring system. In Proceedings of the 2009 9th International Conference on Information Technology and Applications in Biomedicine, Larnaca, Cyprus, 4–7 November 2009; pp. 1–4. [Google Scholar]
- Balasubramanian, V.; Adalarasu, K. EMG-based analysis of change in muscle activity during simulated driving. J. Bodyw. Mov. Ther. 2007, 11, 151–158. [Google Scholar] [CrossRef]
- Reimer, B.; Mehler, B. The Effects of a Production Level “Voice-Command” Interface on Driver Behavior: Summary Findings on Reported Workload, Physiology, Visual Attention, and Driving Performance; MIT AgeLab White Paper No. 2013-18A: Cambridge, MA, USA, 2013. [Google Scholar]
- Son, J.; Oh, H.; Park, M. Identification of driver cognitive workload using support vector machines with driving performance, physiology and eye movement in a driving simulator. Int. J. Precis. Eng. Manuf. 2013, 14, 1321–1327. [Google Scholar] [CrossRef]
- Solovey, E.T.; Zec, M.; Garcia Perez, E.A.; Reimer, B.; Mehler, B. Classifying Driver Workload Using Physiological and Driving Performance Data: Two Field Studies. In Proceedings of the Proceedings of the SIGCHI Conference on Human Factors in Computing Systems, Toronto, ON, Canada, 26 April–1 May 2014; ACM: New York, NY, USA, 2014; pp. 4057–4066. [Google Scholar]
- Lee, H.B.; Kim, J.S.; Kim, Y.S.; Baek, H.J.; Ryu, M.S.; Park, K.S. The relationship between HRV parameters and stressful driving situation in the real road. In Proceedings of the 2007 6th International Special Topic Conference on Information Technology Applications in Biomedicine, Tokyo, Japan, 8–11 November 2007; pp. 198–200. [Google Scholar]
- Liu, Y.; Ji, X.; Hayama, R.; Mizuno, T. A novel estimating method for steering efficiency of the driver with electromyography signals. Chin. J. Mech. Eng. 2014, 27, 460–467. [Google Scholar] [CrossRef]
- Kim, I.-H.; Kim, J.-W.; Haufe, S.; Lee, S.-W. Detection of braking intention in diverse situations during simulated driving based on EEG feature combination. J. Neural Eng. 2014, 12, 016001. [Google Scholar] [CrossRef]
- ZEIER, H. Concurrent physiological activity of driver and passenger when driving with and without automatic transmission in heavy city traffic. Ergonomics 1979, 22, 799–810. [Google Scholar] [CrossRef]
- Brookhuis, K.A.; de Waard, D. Monitoring drivers’ mental workload in driving simulators using physiological measures. Accid. Anal. Prev. 2010, 42, 898–903. [Google Scholar] [CrossRef]
- Brookhuis, K.A.; Waard, D. de On the assessment of (mental) workload and other subjective qualifications. Ergonomics 2002, 45, 1026–1030. [Google Scholar] [CrossRef]
- Mulder, L.B.J.; de Waard, D.; Brookhuis, A.K. Estimating Mental Effort Using Heart Rate and Heart Rate Variability. Available online: https://www.taylorfrancis.com/ (accessed on 14 November 2019).
- Wang, J.; Gong, Y. Recognition of multiple drivers’ emotional state. In Proceedings of the 2008 19th International Conference on Pattern Recognition, Tampa, FL, USA, 8–11 December 2008; pp. 1–4. [Google Scholar]
- Calderó-Bardají, P.; Longfei, X.; Jaschke, S.; Reermann, J.; Mideska, K.G.; Schmidt, G.; Deuschl, G.; Muthuraman, M. Detection of steering direction using EEG recordings based on sample entropy and time-frequency analysis. In Proceedings of the 2016 38th Annual International Conference of the IEEE Engineering in Medicine and Biology Society (EMBC), Orlando, FL, USA, 16–20 August 2016; pp. 833–836. [Google Scholar]
- Biondi, F.N.; Lohani, M.; Hopman, R.; Mills, S.; Cooper, J.M.; Strayer, D.L. 80 MPH and out-of-the-loop: Effects of real-world semi-automated driving on driver workload and arousal. Proc. Hum. Factors Ergon. Soc. Annu. Meet. 2018, 62, 1878–1882. [Google Scholar] [CrossRef]
- Murase, T.; Oiwa, K.; Nozawa, A. Quantitative Evaluation of Attention to the Driving Environment During Automated Driving at Levels 3 using ERP: Evaluation of Psychophysiological State of Driver. IEEJ Trans. EIS 2018, 138, 1148–1153. [Google Scholar] [CrossRef]
- Radlmayr, J.; Weinbeer, V.; Löber, C.; Farid, M.; Bengler, K. How Automation Level and System Reliability Influence Driver Performance in a Cut-In Situation. In Proceedings of the Advances in Human Aspects of Transportation, Orlando, FL, USA, 21–25 July 2018; Stanton, N.A., Ed.; Springer International Publishing: Cham, Switzerland, 2018; pp. 684–694. [Google Scholar]
- Sevil, M.; Hajizadeh, I.; Samadi, S.; Feng, J.; Lazaro, C.; Frantz, N.; Yu, X.; Brandt, R.; Maloney, Z.; Cinar, A. Social and competition stress detection with wristband physiological signals. In Proceedings of the 2017 IEEE 14th International Conference on Wearable and Implantable Body Sensor Networks (BSN), Eindhoven, The Netherlands, 9–12 May 2017; pp. 39–42. [Google Scholar]
- Greene, S.; Thapliyal, H.; Caban-Holt, A. A Survey of Affective Computing for Stress Detection: Evaluating technologies in stress detection for better health. IEEE Consum. Electron. Mag. 2016, 5, 44–56. [Google Scholar] [CrossRef]
- Ollander, S.; Godin, C.; Campagne, A.; Charbonnier, S. A comparison of wearable and stationary sensors for stress detection. In Proceedings of the 2016 IEEE International Conference on Systems, Man, and Cybernetics (SMC), Budapest, Hungary, 9–12 October 2016; pp. 004362–004366. [Google Scholar]
- Kye, S.; Moon, J.; Lee, J.; Choi, I.; Cheon, D.; Lee, K. Multimodal Data Collection Framework for Mental Stress Monitoring. In Proceedings of the Proceedings of the 2017 ACM International Joint Conference on Pervasive and Ubiquitous Computing and Proceedings of the 2017 ACM International Symposium on Wearable Computers, Maui, HI, USA, 11–15 September 2017; ACM: New York, NY, USA, 2017; pp. 822–829. [Google Scholar]
- Kalimeri, K.; Saitis, C. Exploring Multimodal Biosignal Features for Stress Detection During Indoor Mobility. In Proceedings of the Proceedings of the 18th ACM International Conference on Multimodal Interaction, Tokyo, Japan, 12–16 November 2016; ACM: New York, NY, USA, 2016; pp. 53–60. [Google Scholar]
- Gouverneur, P.; Jaworek-Korjakowska, J.; Köping, L.; Shirahama, K.; Kleczek, P.; Grzegorzek, M. Classification of Physiological Data for Emotion Recognition. In Artificial Intelligence and Soft Computing; Rutkowski, L., Korytkowski, M., Scherer, R., Tadeusiewicz, R., Zadeh, L.A., Zurada, J.M., Eds.; Springer International Publishing: Cham, Switzerland, 2017; pp. 619–627. [Google Scholar]
- Park, J.; Jeong, H.; Park, J.; Lee, B.C. Relationships Between Cognitive Workload and Physiological Response Under Reliable and Unreliable Automation. In Proceedings of the Advances in Human Factors and Systems Interaction, Washington, DC, USA, 24–28 July 2019; Nunes, I.L., Ed.; Springer International Publishing: Cham, Switzerland, 2019; pp. 3–8. [Google Scholar]
- Kutt, K.; Nalepa, G.J.; Giżycka, B.; Jemiolo, P.; Adamczyk, M. BandReader—A Mobile Application for Data Acquisition from Wearable Devices in Affective Computing Experiments. In Proceedings of the 2018 11th International Conference on Human System Interaction (HSI), Gdansk, Poland, 4–6 July 2018; pp. 42–48. [Google Scholar]
- McCarthy, C.; Pradhan, N.; Redpath, C.; Adler, A. Validation of the Empatica E4 wristband. In Proceedings of the 2016 IEEE EMBS International Student Conference (ISC), Ottawa, ON, Canad, 29–31 May 2016; pp. 1–4. [Google Scholar]
- Corino, V.D.A.; Laureanti, R.; Ferranti, L.; Scarpini, G.; Lombardi, F.; Mainardi, L.T. Detection of atrial fibrillation episodes using a wristband device. Physiol. Meas. 2017, 38, 787–799. [Google Scholar] [CrossRef] [PubMed]
- Mainardi, L.; Ferranti, L.; Laureanti, R. Atrial Fibrillation detection in PPG signal recorded through a wristband device. Thesis, Politecnico di Milano, Milano, It, 2015. [Google Scholar]
- Alam, M.A.U.; Roy, N.; Holmes, S.; Gangopadhyay, A.; Galik, E. Automated Functional and Behavioral Health Assessment of Older Adults with Dementia. In Proceedings of the 2016 IEEE First International Conference on Connected Health: Applications, Systems and Engineering Technologies (CHASE), Washington, DC, USA, 27–29 June 2016; pp. 140–149. [Google Scholar]
- Bahrainian, S.A.; Crestani, F. Towards the Next Generation of Personal Assistants: Systems That Know When You Forget. In Proceedings of the ACM SIGIR International Conference on Theory of Information Retrieval, Amsterdam, The Netherlands, 1–4 October 2017; ACM: New York, NY, USA, 2017; pp. 169–176. [Google Scholar]
- Vandecasteele, K.; De Cooman, T.; Gu, Y.; Cleeren, E.; Claes, K.; Paesschen, W.V.; Huffel, S.V.; Hunyadi, B. Automated Epileptic Seizure Detection Based on Wearable ECG and PPG in a Hospital Environment. Sensors 2017, 17, 2338. [Google Scholar] [CrossRef] [PubMed]
- Marchiori, E.; Niforatos, E.; Preto, L. Measuring the Media Effects of a Tourism-Related Virtual Reality Experience Using Biophysical Data. In Proceedings of the Information and Communication Technologies in Tourism 2017, Rome, Italy, 24–26 January 2017; Schegg, R., Stangl, B., Eds.; Springer International Publishing: Cham, Switzerland, 2017; pp. 203–215. [Google Scholar]
- Cvetković, B.; Szeklicki, R.; Janko, V.; Lutomski, P.; Luštrek, M. Real-time activity monitoring with a wristband and a smartphone. Inf. Fusion 2018, 43, 77–93. [Google Scholar] [CrossRef]
- Hoecherl, J.; Schlegl, T.; Berlehner, T.; Kuhn, H.; Wrede, B. SmartWorkbench: Toward Adaptive and Transparent User Assistance in Industrial Human-Robot Applications. In Proceedings of the Proceedings of ISR 2016: 47st International Symposium on Robotics, Munich, Germany, 21–22 June 2016; pp. 1–8. [Google Scholar]
- Ragot, M.; Martin, N.; Em, S.; Pallamin, N.; Diverrez, J.-M. Emotion Recognition Using Physiological Signals: Laboratory vs. Wearable Sensors. In Proceedings of the Advances in Human Factors in Wearable Technologies and Game Design, Los Angeles, CA, USA, 17–21 July 2017; Ahram, T., Falcão, C., Eds.; Springer International Publishing: Cham, Switzerland, 2018; pp. 15–22. [Google Scholar]
- Salsone, M.; Vescio, B.; Fratto, A.; Sturniolo, M.; Arabia, G.; Gambardella, A.; Quattrone, A. Cardiac sympathetic index identifies patients with Parkinson’s disease and REM behavior disorder. Parkinsonism Relat. Disord. 2016, 26, 62–66. [Google Scholar] [CrossRef]
- Salsone, M.; Nistico’, R.; Vescio, B.; Novellino, F.; Morelli, M.; Lupo, A.; Arabia, G.; Quattrone, A. Heart rate variability in patients with essential tremor: A cross sectional study. Parkinsonism Relat. Disord. 2016, 33, 134–137. [Google Scholar] [CrossRef]
- Rajcani, J.; Solarikova, P.; Brezina, I. Effects of allergy and trait anxiety on heart rate variability: A naturalistic design study. Psychoneuroendocrinology 2017, 83, 40. [Google Scholar] [CrossRef]
- Kamp, M.R.; Thio, B.; De Jongh, F.; Driessen, J. Wearable Home-Monitoring in Asthmatic Children. In A60. Pediatric Allergy and Asthma, Proceedings of the American Thoracic Society 2018 International Conference Abstracts, San Diego, CA, 20 May 2018; American Thoracic Society: New York, NY, USA, 2018; p. A2028. [Google Scholar]
- Rapalis, A.; Petrėnas, A.; Šimaitytė, M.; Bailón, R.; Marozas, V. Towards pulse rate parametrization during free-living activities using smart wristband. Physiol. Meas. 2018, 39, 055007. [Google Scholar] [CrossRef]
- Mohapatra, P.; Premkumar, P.S.; Sivaprakasam, M. A Yellow-Orange Wavelength-Based Short-Term Heart Rate Variability Measurement Scheme for Wrist-Based Wearables. IEEE Trans. Instrum. Meas. 2018, 67, 1091–1101. [Google Scholar] [CrossRef]
- Vescio, B.; Salsone, M.; Gambardella, A.; Quattrone, A. Comparison between Electrocardiographic and Earlobe Pulse Photoplethysmographic Detection for Evaluating Heart Rate Variability in Healthy Subjects in Short- and Long-Term Recordings. Sensors 2018, 18, 844. [Google Scholar] [CrossRef]
- Drougard, N.; Roy, R.N.; Scannella, S.; Dehais, F.; Ponzoni Carvalho Chanel, C. Physiological Assessment of Engagement during HRI: Impact of Manual vs Automatic Mode. In Proceedings of the 2nd International Neuroergonomics Conference, Philadelphia, PA, USA, 27–29 June 2018; p. 0. [Google Scholar]
- Moshammer, H.; Panholzer, J.; Ulbing, L.; Udvarhelyi, E.; Ebenbauer, B.; Peter, S. Acute Effects of Air Pollution and Noise from Road Traffic in a Panel of Young Healthy Subjects. Proceedings 2018, 6, 10. [Google Scholar] [CrossRef]
- Simjanoska, M.; Gjoreski, M.; Gams, M.; Madevska Bogdanova, A. Non-Invasive Blood Pressure Estimation from ECG Using Machine Learning Techniques. Sensors 2018, 18, 1160. [Google Scholar] [CrossRef]
- Eggenberger, P.; MacRae, B.A.; Kemp, S.; Bürgisser, M.; Rossi, R.M.; Annaheim, S. Prediction of Core Body Temperature Based on Skin Temperature, Heat Flux, and Heart Rate Under Different Exercise and Clothing Conditions in the Heat in Young Adult Males. Front. Physiol. 2018, 9, 1790. [Google Scholar] [CrossRef] [PubMed]
- Alikhani, I.; Noponen, K.; Hautala, A.; Seppänen, T. Characterization and reduction of exercise-based motion influence on heart rate variability using accelerator signals and channel decoding in the time–frequency domain. Physiol. Meas. 2018, 39, 115002. [Google Scholar] [CrossRef]
- Hostettler, R.; Lumikari, T.; Palva, L.; Nieminen, T.; Särkkä, S. Motion Artifact Reduction in Ambulatory Electrocardiography Using Inertial Measurement Units and Kalman Filtering. In Proceedings of the 2018 21st International Conference on Information Fusion (FUSION), Cambridge, UK, 10–13 July 2018; pp. 1–8. [Google Scholar]
- Real-time Physiological Signals | E4 EDA/GSR Sensor. Available online: https://www.empatica.com/research/e4 (accessed on 23 May 2019).
- Bittium Faros. Available online: https:/www.bittium.com/medical/bittium-faros (accessed on 23 May 2019).
- Nervtech Simuation Technologies. Available online: https://www.nervtech.com (accessed on 29 April 2019).
- Allen, J. Photoplethysmography and its application in clinical physiological measurement. Physiol. Meas. 2007, 28, R1–R39. [Google Scholar] [CrossRef] [PubMed]
- E4 connect. Available online: https://www.empatica.com/connect/login.php (accessed on 23 May 2019).
- Bittium Faros 3.x Bluetooth Protocol. Version 2.0.0. 2018.
- Kinkade, R.G.; Wheaton, G.R. Training device design. In Hum. Eng. Guide Equip. Des.; John Wiley & Sons: Hoboken, NJ, USA, 1972; pp. 668–699. [Google Scholar]
- Hays, R.T. Simulator Fidelity: A Concept Paper; Army Research Inst for the Behavioral and Social Sciences: , Alexandria, Virginia, USA, 1980. [Google Scholar]
- Bluegiga BLED112 Bluetooth Smart Dongle—Silicon Labs. Available online: https://www.silabs.com/products/wireless/bluetooth/bluetooth-low-energy-modules/bled112-bluetooth-smart-dongle (accessed on 23 May 2019).
- Laborde, S.; Mosley, E.; Thayer, J.F. Heart Rate Variability and Cardiac Vagal Tone in Psychophysiological Research—Recommendations for Experiment Planning, Data Analysis, and Data Reporting. Front. Psychol. 2017, 8, 213. [Google Scholar] [CrossRef] [PubMed]
- Gruden, T. Uporaba komercialno dostopnih naprav za merjenje fizioloških signalov voznikov. Ph.D. Thesis, Univerza v Ljubljani, Fakulteta za elektrotehniko, Ljubljana, Slovenia, 2018. [Google Scholar]
- Quintana, D.S. Statistical considerations for reporting and planning heart rate variability case-control studies. Psychophysiology 2017, 54, 344–349. [Google Scholar] [CrossRef] [PubMed]
- Malik, M.; Bigger, J.T.; Camm, A.J.; Kleiger, R.E.; Malliani, A.; Moss, A.J.; Schwartz, P.J. Heart rate variabilityStandards of measurement, physiological interpretation, and clinical use. Eur. Heart J. 1996, 17, 354–381. [Google Scholar] [CrossRef]
- Schäfer, A.; Vagedes, J. How accurate is pulse rate variability as an estimate of heart rate variability? A review on studies comparing photoplethysmographic technology with an electrocardiogram. Int. J. Cardiol. 2013, 166, 15–29. [Google Scholar] [CrossRef] [PubMed]


| E4 | Faros 360 | |
|---|---|---|
| Mean and median HRV | X | X |
| HRV SDNN | baseline < easy driving baseline < demanding driving | easy driving < demanding driving baseline < demanding driving |
| HRV SDANN | baseline < easy driving baseline < demanding driving | easy driving < demanding driving baseline < demanding driving |
| HRV SDNN Index | X | X |
| HRV RMSSD | baseline < easy driving baseline < demanding driving | X |
| HRV pNN50 | baseline < easy driving baseline < demanding driving | X |
| Mean skin temperature | baseline < easy driving baseline < demanding driving | baseline < easy driving baseline < demanding driving easy driving < demanding driving |
| Standard deviation of skin temperature | baseline < easy driving baseline < demanding driving | baseline < easy driving baseline < demanding driving |
| Mean and standard deviation of GSR | baseline < demanding driving | N/A |
| SDANN | SDNN Index | |
|---|---|---|
| E4 | RMANOVA: F(2, 38) = 27.721, p < 0.001 | RMANOVA with Greenhouse-Geisser correction: F(1.586, 33.303) = 3.923, p = 0.0381 1 |
| Faros 360 | RMANOVA: F(2, 42) = 13.312, p < 0.001 | RMANOVA with Greenhouse-Geisser correction: F(1.398, 29.364) = 3.405, p = 0.062 |
| Skin Temperature Mean | Skin Temperature Standard Deviation | |
|---|---|---|
| E4 | RMANOVA: F(2, 42) = 29.313, p < 0.001 | Friedman’s nonparametric test: χ2(2) = 9.818, p = 0.007 |
| Faros 360 | RMANOVA with Greenhouse-Geisser correction: F(1.180, 24.786) = 279.574, p < 0.001 | RMANOVA with Greenhouse-Geisser correction: F(1.207, 25.350) = 78.100, p < 0.001 |
© 2019 by the authors. Licensee MDPI, Basel, Switzerland. This article is an open access article distributed under the terms and conditions of the Creative Commons Attribution (CC BY) license (http://creativecommons.org/licenses/by/4.0/).
Share and Cite
Gruden, T.; Stojmenova, K.; Sodnik, J.; Jakus, G. Assessing Drivers’ Physiological Responses Using Consumer Grade Devices. Appl. Sci. 2019, 9, 5353. https://doi.org/10.3390/app9245353
Gruden T, Stojmenova K, Sodnik J, Jakus G. Assessing Drivers’ Physiological Responses Using Consumer Grade Devices. Applied Sciences. 2019; 9(24):5353. https://doi.org/10.3390/app9245353
Chicago/Turabian StyleGruden, Timotej, Kristina Stojmenova, Jaka Sodnik, and Grega Jakus. 2019. "Assessing Drivers’ Physiological Responses Using Consumer Grade Devices" Applied Sciences 9, no. 24: 5353. https://doi.org/10.3390/app9245353
APA StyleGruden, T., Stojmenova, K., Sodnik, J., & Jakus, G. (2019). Assessing Drivers’ Physiological Responses Using Consumer Grade Devices. Applied Sciences, 9(24), 5353. https://doi.org/10.3390/app9245353