Article

Analysis of Methanol Gasoline by ATR-FT-IR Spectroscopy

1
College of Oujiang, Wenzhou University, Wenzhou 325035, China
2
College of Electrical & Electronic Engineering, Wenzhou University, Wenzhou 325035, China
3
Research and development department, Hangzhou Goodhere Biotechnology Co., Ltd., Hangzhou 311100, China
*
Author to whom correspondence should be addressed.
Appl. Sci. 2019, 9(24), 5336; https://doi.org/10.3390/app9245336
Submission received: 15 November 2019 / Revised: 2 December 2019 / Accepted: 4 December 2019 / Published: 6 December 2019
(This article belongs to the Section Optics and Lasers)

Abstract

:

Featured Application

The quality of methanol gasoline is important to internal combustion engines. Infrared spectroscopy technology shows its feasibility to qualitatively and quantitatively measure the quality of gasoline. Combined with the chemometrics, this technology can be used to determinate the adulteration category or fineness, providing the qualified gasoline for the market. Spectra analytical technology is a promising method in applying in the gasoline industry and speeding up the industrial application.

Abstract

Methanol gasoline blends are a more economical, and environmentally friendly fuels than gasoline alone, and are widely used in the transportation industry. The content of methanol in methanol gasoline plays an important role in ensuring the quality of gasoline. In some solutions, due to the shortage of energy and illegal profits, the problem of gasoline adulteration and its fineness, has received more and more attention, which would seriously affect the operating condition and service life of internal combustion engines. Therefore, it is very important to identify the correct level of gasoline. However, the traditional detection method is complex and time-consuming. To this end, the feasibility of using attenuated total reflectance Fourier transform infrared (ATR-FTIR) methods coupled with chemometrics methods were investigated to quantitatively and qualitatively analyze methanol gasoline. The qualitative analysis result of partial least squares discriminant analysis (PLS-DA) obtained 100% and 98.66% accuracy in the calibration set and the prediction set, respectively. As for quantitative analysis; two regression algorithms of partial least squares regression (PLSR) and the least square support vector machine (LS-SVM), as well as two variables selection methods of the successive projections algorithm (UVE) competitive adaptive reweighted sampling (CARS) and uninformative variable elimination (UVE) were combined to establish the quantitative model. By comparing the performance of the optimal models; the UVE-PLSR model performed best with a residual predictive deviation (RPD) value of 6.420. The qualitative and quantitative analysis results demonstrate the feasibility of using ATR-FTIR spectra to detect the methanol in methanol gasoline. It is believed that the promising IR spectra will be widely used in gasoline energy quality control in the further.

1. Introduction

Gasoline is one of the most widely used light petroleum products and a complex hydrocarbon mixture usually containing four to thirteen carbon atoms [1]. However, the rapid development of the transportation industry has led to a reduction in non-renewable oil resources and the increasingly serious atmospheric pollution problem [2]. To address this issue, it is necessary to find an environmentally, friendly, and economically viable alternative resource. Methanol gasoline as an excellent alternative fuel for engines, which has advantages such as high octane number, and good resistance to violent and clean burning [3]. Due to these excellent qualities and appropriate economic suitability, methanol gasoline can play an important role in addressing the issue of energy shortage and environmental pollution. Thus, it has been widely used in transportation, including motor vehicles and internal combustion engines [4]. According to the reports of the relevant literature, the adding ratio of methanol in methanol gasoline varies from 0%–80% [5] since methanol gasoline can be prepared by directly mixing gasoline and methanol. In addition, this provides an opportunity for some unscrupulous traders to sell high-methanol gasoline at a low methanol content of gasoline to earn illegal profits. Therefore, it is necessary to develop an accurate and rapid method to qualitatively and quantitatively analyze the methanol content in methanol gasoline.
There are numerous detection methods for determining methanol content in gasoline and the commonly used is gas chromatography (GC) or gas chromatography-mass spectrometer (GC-MS) [6]. Although these detection methods have high sensitivity and accuracy, they are time-consuming and complex, require toxic and hazardous reagents, and cannot meet the needs of online monitoring. The development and application of infrared (IR) spectroscopy technology provides a novel opportunity for rapid detection of methanol content in methanol gasoline [6]. As a rapid and non-destruction detection technology, IR spectroscopy technology has been applied in various subject fields, such as chemistry, agriculture, food quality and the environment. Moreover, there are several studies using near infrared spectra to analyze gasoline products and obtain good qualitative and quantitative detection results [6,7,8,9]. However, most of these studies use near infrared (NIR) spectroscopy to perform classification research [10,11], and just a few works focus on the content of methanol in the gasoline [12]. Thus, more explorations should be researched, and the feasibility of IR spectroscopy should be attempted to qualitatively and quantitatively measure the methanol gasoline.
Due to IR spectroscopy having the special information of molecular profiles, attributes correspond certain ones to functional groups of molecule. Thus, the feasibility of IR spectroscopy for rapidly detecting methanol in methanol gasoline was investigated. In this study, firstly, the dataset was explored using unsupervised principal component analysis (PCA), then qualitative and quantitative supervised models, including partial least squares discriminant analysis (PLS-DA), partial least square regression (PLSR) and least squared support vector machine (LS-SVM), were carried out to detect the methanol percentage in methanol gasoline. Concerned with the problem of too many variables in the stage of building the regression models, two classic variables selection algorithms (i.e., uninformative variables elimination (UVE), and competitive adaptive reweighted sampling (CARS)) were also applied to select the optimal variables. Finally, the performance of all regression models were systemically compared to identify the best prediction model for methanol percentage in methanol gasoline.
To assess the feasibility of IR spectroscopy for detecting the methanol percentage in methanol gasoline, attenuated total reflectance Fourier transform infrared (ATR-FTIR) spectroscopy coupled with several multivariate calibration models, and variables selection methods for qualitative and quantitative analyzing methanol were used to investigate. Based on above introduction and planning, it can be seen that the main objective is to qualitatively and quantitatively detect methanol using the IR spectra. To be specific, there are several sub-subjects: (1) collecting and analyzing the spectral data of gasoline and methanol gasoline; (2) qualitatively classifying the gasoline and methanol gasoline; (3) selecting the optimal variables for regression model; (4) establishing the quantitatively detection model for methanol based on full variables and the optimal variables; (5) identifying the best detection model by comparing all model’s performance.

2. Materials and Methods

2.1. Sample Preparation

In this study, 95# Gasoline was chosen as the research object. Different brands of gasoline were purchased from Wenzhou gasoline stations (Wenzhou City, Zhejiang Province, China). Analytical-grade methanol reagent (Product No. M116122, purity > 99.9%) was purchased from Aladdin Reagent and used without any further treatments. To obtain the methanol gasoline, 95# gasoline samples were mixed with methanol according to a serial of volume ratios. A total of 16 gasoline samples varied six kinds of brands were collected. Volume ratios of methanol to gasoline were matched with the range of 0% to 30%.

2.2. Collection of ATR-FTIR Spectra

Attenuated total reflectance Fourier transform infrared (ATR-FTIR) spectra was collected from the range of 4000 cm−1 to 600 cm−1 with the resolution of 4 cm−1 using the VERTEX 70 spectrometer (Bruker Optics Inc., Ettlingen, Germany), coupled with an attenuated total reflection (ATR) accessory (Pike Technologies, Germany). Then, the spectral signals were digitalized with 2 cm−1 intervals in the Fourier transform. The repeat scan number was set to 16 times, and the displayed curve was the averaged spectrum, which was obtained using OMINIC software (Version 6.5, Bruker, Inc.). Notably, each sample was updated through the cuvette (10 mm) and six times were measured repeatedly. Therefore, a total of six spectra were collected for further modeling analysis.

2.3. Multivariate Data Analysis

2.3.1. Principal Component Analysis

Before establishing the multivariate calibration model, the data dimension reduction method, and the principal component analysis (PCA), it was suggested to explore the dataset structure. The main idea of PCA is that a set of variables that may be related to each other is transformed into a set of linear uncorrelated variables called the principal component by way of orthogonal transformation. This transforms high-dimensional data into low-dimensional data, which facilitates analysis and visualization of data [13]. It has been widely used in environment [14,15] and food [16,17,18] analytical fields, in terms of similarity clustering of samples, and the dimensional reduction of spectral data.

2.3.2. Classification for Adulteration Category

When the classification was considered, partial least squares discriminant analysis (PLS-DA) was employed to create the classification model. Similar to partial least squares regression (PLSR), the main principle of PLS-DA was also to extract several latent variables (LVs), which have the maximum covariance with the dependent variables from original data. With the help of optimal LVs, the PLS-DA classification model was established to predict the response of each sample. Finally, the category identification of each sample was completed based on the threshold determined by Bayesian theory. As a classic classification algorithm, much literature can be referred [19,20].

2.3.3. Regression for Adulteration Content

Two regression models, including partial least squares regression (PLSR) and least square support vector machine (LS-SVM), were employed to establish the quantitative model and compare their predictive capacity. PLSR, as a classic linear regression model, projects the independent variable onto a set of orthogonal factors, which were called latent variables (LVs). Then, the quantitative relationship between the dependent and the independent variables was created using the several number of LVs [21,22].
On the contrary, the nonlinear regression model LS-SVM was also considered to establish a comparison model. The principle of SVM is to map the original dataset from a low dimensional space into the high-dimensional space through non-linear functions and construct a hyperplane. So that the linear indivisible problem between datasets in the conventional space is transformed into a constrained quadratic programming problem, and the global optimal solution of the problem is obtained using Lagrange multiplier methods. Notably, the non-linear radial basis function (RBF) kernel was used most in this study [23].

2.3.4. Variables Selection for Significant Information

To simplify the calculation process and improve the performance of regression model, two commonly used variable selection methods, including CARS [24] and UVE [25], were considered to select a few optimal variables. The principle of CARS is based on the “survival of the fittest” of Darwin’s theory of evolution. Each spectral point is regarded as individual and to remove the weighting-less individuals. These spectral variables with small absolute coefficients in the PLSR model were eliminated, and the remaining variables were used to construct a model with cross validation. In each run, the root mean squared error of cross validation (RMSECV) of each model was recorded to compare the performance. Furthermore, the model with the lowest RMSECV was chosen as the optimal subset of spectral variables [26].
UVE is a classic variable selection method and which is developed based on PLSR method. In the calculation process of UVE, an artificial random variable matrix was appended to the spectral matrix, and their maximum stability value was calculated. Therefore, UVE can select these variables whose stability values are larger than the stability threshold [27]. More detailed information about CARS and UVE can be found in the previous literature [28].

2.3.5. Evaluation of the Model’s Performance

When finishing the multivariate calibration models, several evaluation indices were considered to assess the performance of the calibration model. As for the regression model, the root mean square error of calibration (RMSEC) and prediction (RMSEP), coefficients of determination of calibration (Rc2) and prediction (Rp2), residual predictive deviation (RPD), and the absolute difference between RMSEC and RMSEP (ABS) were considered to evaluate the performance of the regression model. Specifically, an excellent regression model usually has the high value of Rc2, Rp2, RPD, and the smaller value of RMSEC, RMSEP and ABS [29].
For the PLS-DA classification model, the accuracy was used to evaluate the performance of PLS-DA classifier. Additionally, a sample distribution map will be used to more intuitively display the results of the classification. Notably, all calculation in this study were performed in the MATLAB 2015b environment (The Math Works, Natick, USA).

3. Result and Discussion

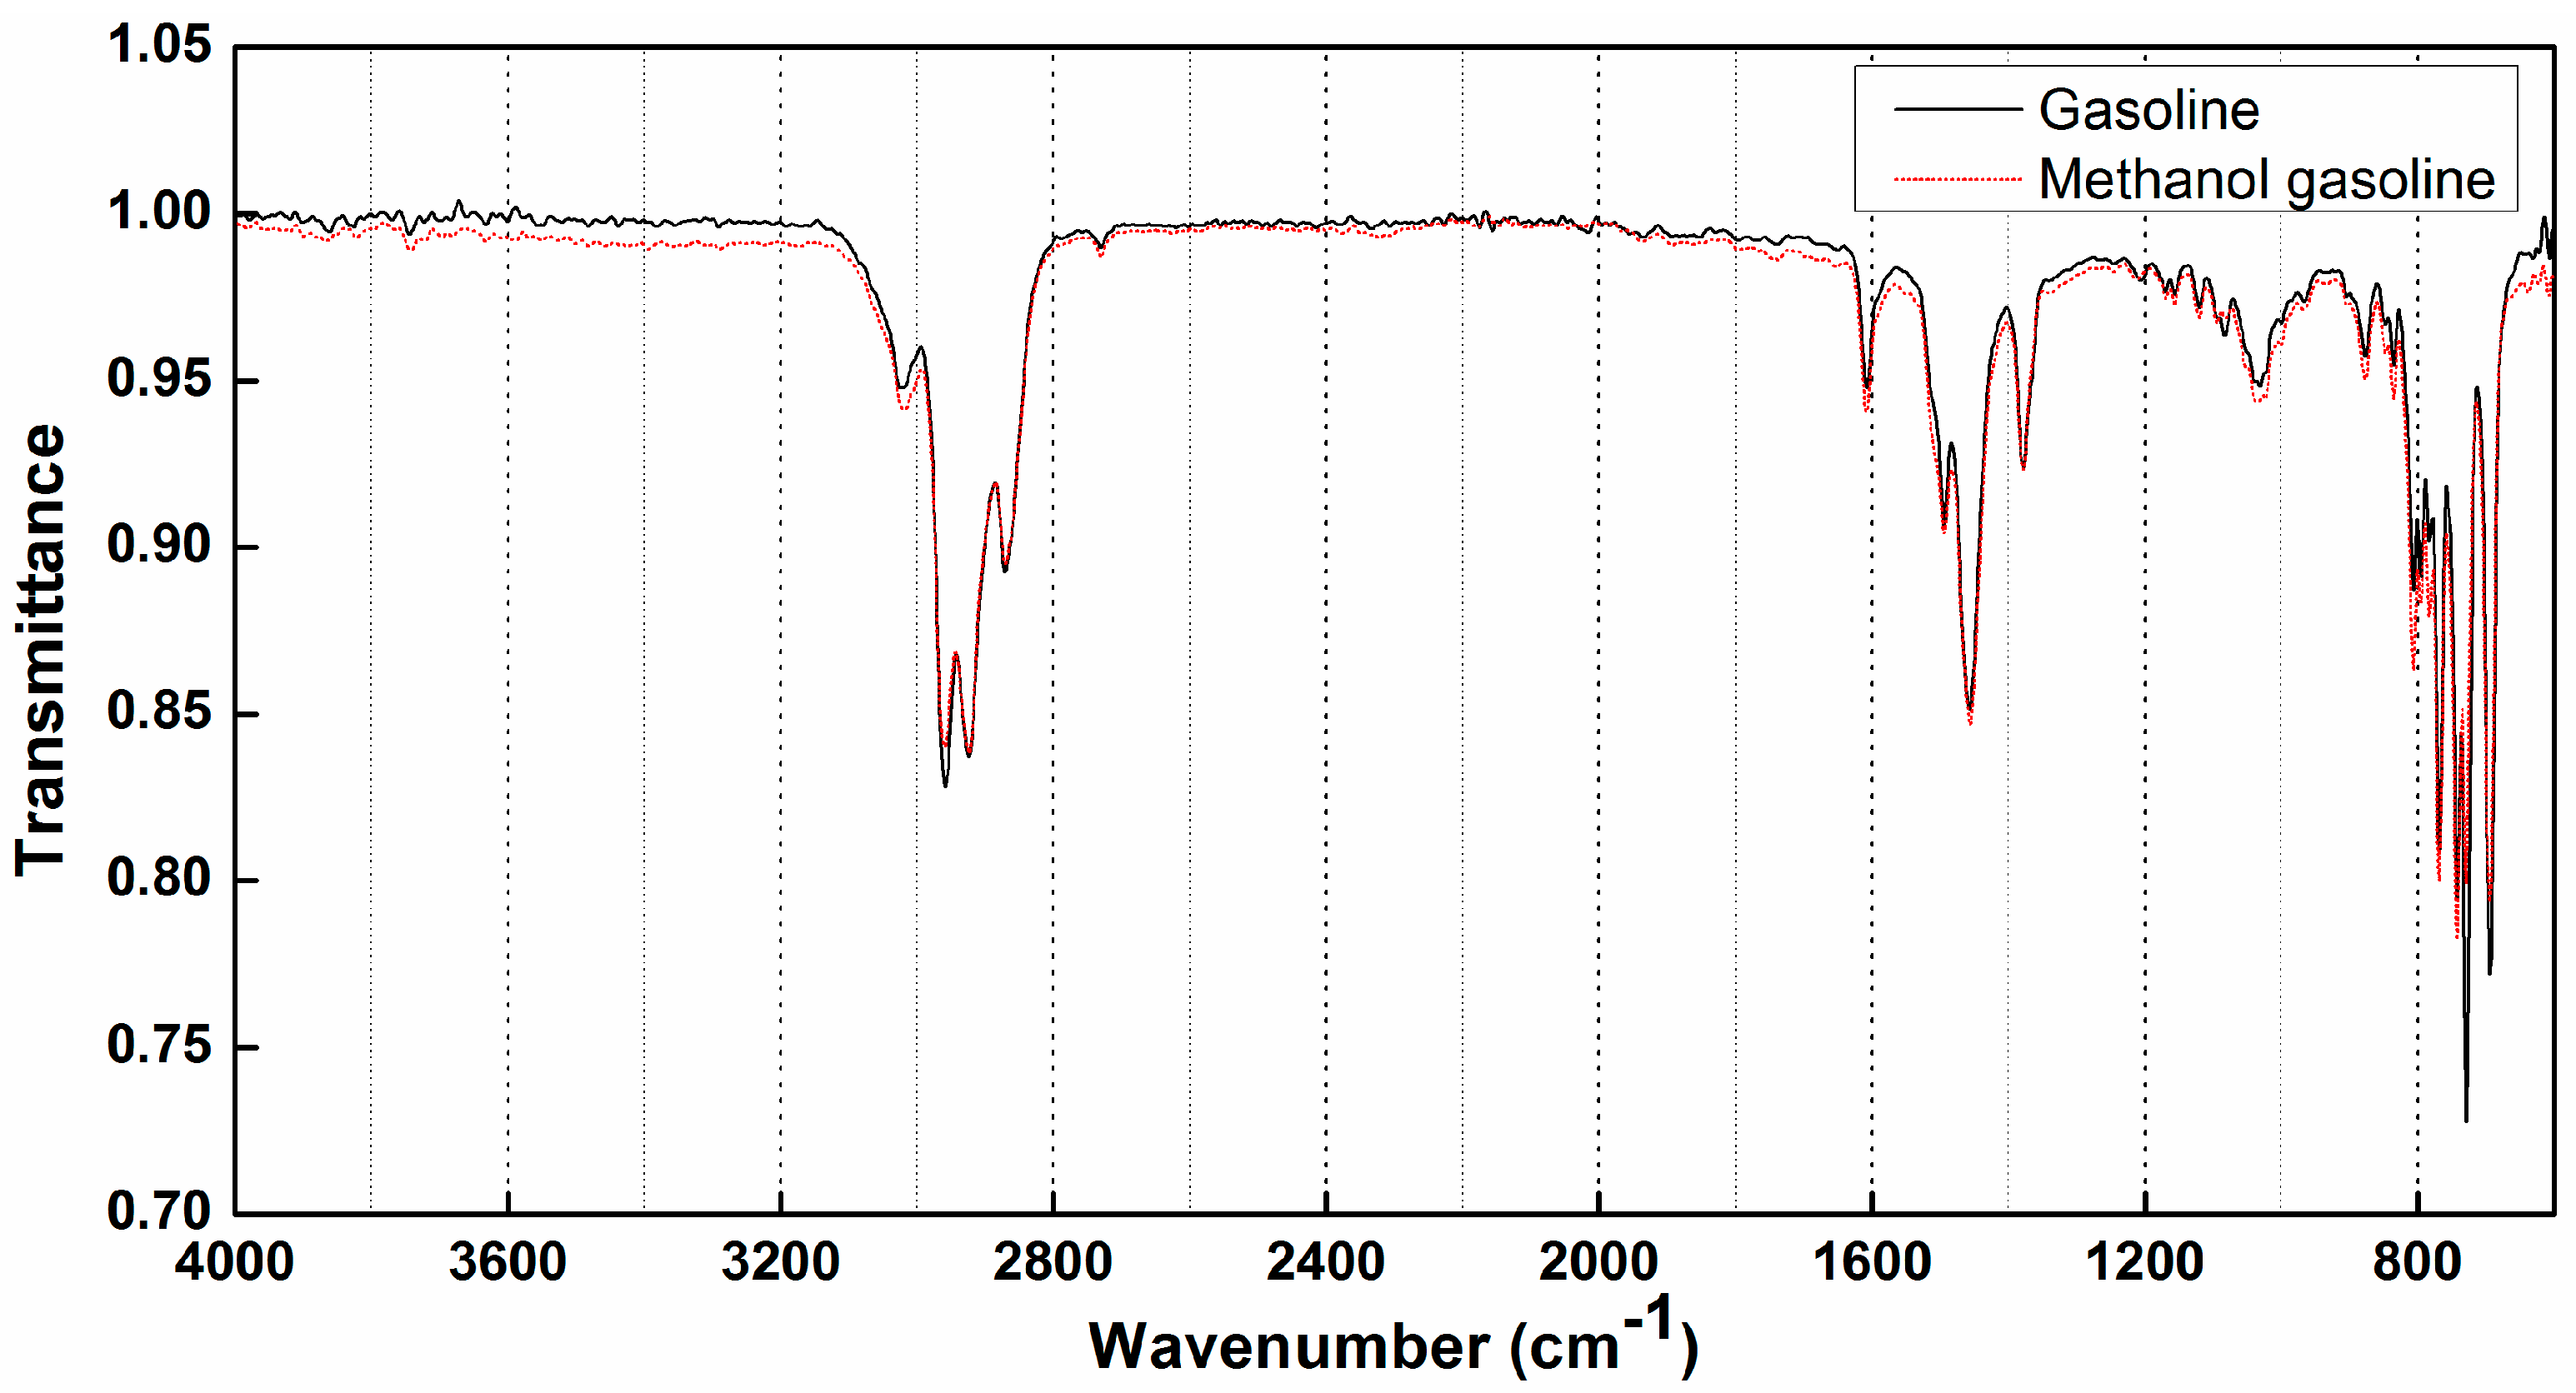
3.1. Analysis of ATR-FTIR Spectral Feature of Gasoline

To clearly show the difference between gasoline and methanol gasoline, the average spectral profile of gasoline and methanol gasoline was used to plot the spectra. Figure 1 presents the averages spectral profile of gasoline and methanol gasoline in the range of 4000–600 cm−1. It can be found there are three main absorption peaks in the range of 2800–3000 cm−1, 1600–1300 cm−1, and 900–600 cm−1. The absorption peak of 2800–3000 cm−1 corresponds to the C-H stretching of alkenes and alkenes, 1600–1300 cm−1 corresponds to C–H stretching of aromatic ring and C-H bend of alkanes, and 900–600 cm−1 is from the C–H out of bend of alkenes and aromatic rings adulterated with these noises possibly from instrument or impurities, respectively [9,30,31]. Obviously, the spectral range of 900–600 cm−1 has a lower ratio of signals to noises (RSN), and this region would be discarded in further analysis of spectral information. Other regions with conspicuous features will be explored. Nevertheless, it was difficult to quantitatively and qualitatively analyze the methanol in methanol gasoline only with eye-visible differences on the differences among 96 spectra. Therefore, it is essential to adopt the chemometric methods to further mine the information contained in the spectral data for further analyzing the spectral data.

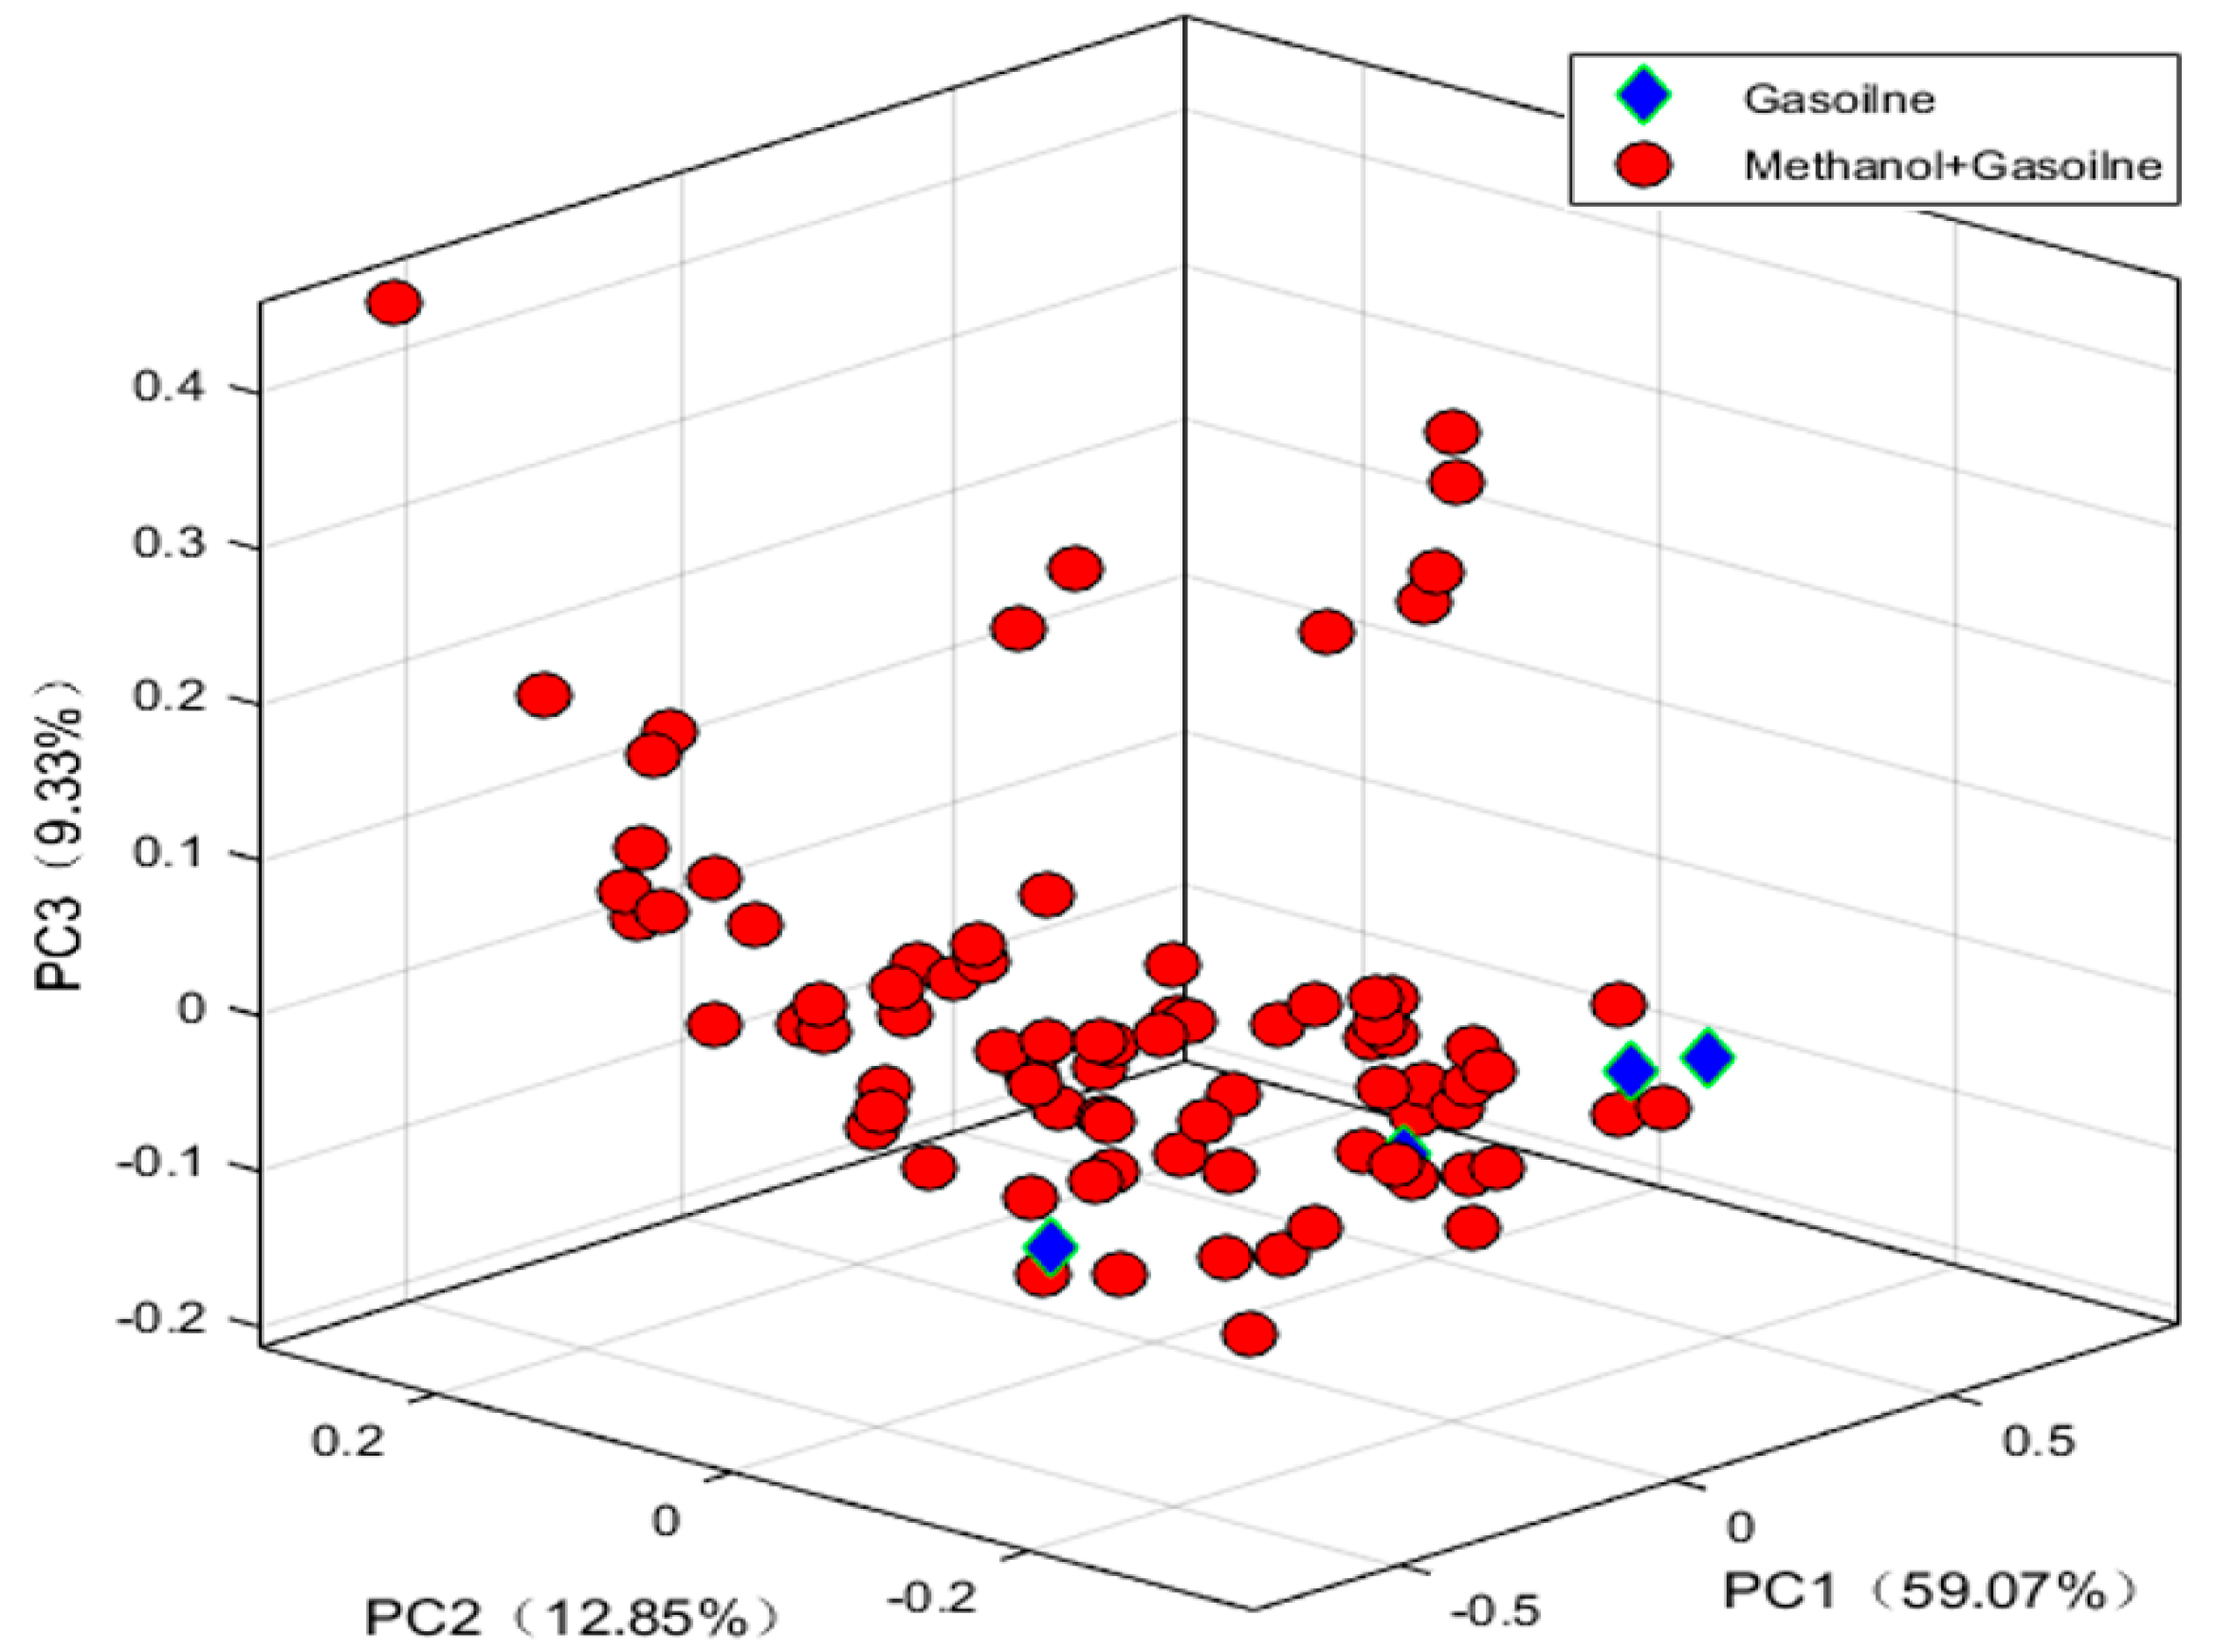
3.2. Exploratory Analysis

After obtaining the IR spectral data, it is recommended to conduct a preliminary exploratory analysis of the data structure. As a powerful unsupervised analysis method, PCA was used in the present work to visualize distribution of samples in score plot prior to qualitatively and quantitatively analyzing the methanol in methanol gasoline.
After the reduction of data dimensionality by the PCA process, the top three principal components (PCs) were scattered in three dimensional map, and the distribution of the corresponding samples are shown in Figure 2. In this scatter, the variance of top three PCs explained 59.07%, 12.85% and 9.33% of the original spectral information, respectively, and a total of 81.26% interpretation rate was accumulated in those top three PCs. However, distribution of six gasoline and 90 methanol gasoline samples were overlapped in the above 3D plot, which showed that the difference between methanol and methanol gasoline was too small to accurately distinguish these two class samples of methanol and methanol gasoline. To solve this problem, a supervised classification method will be applied in the next analysis.

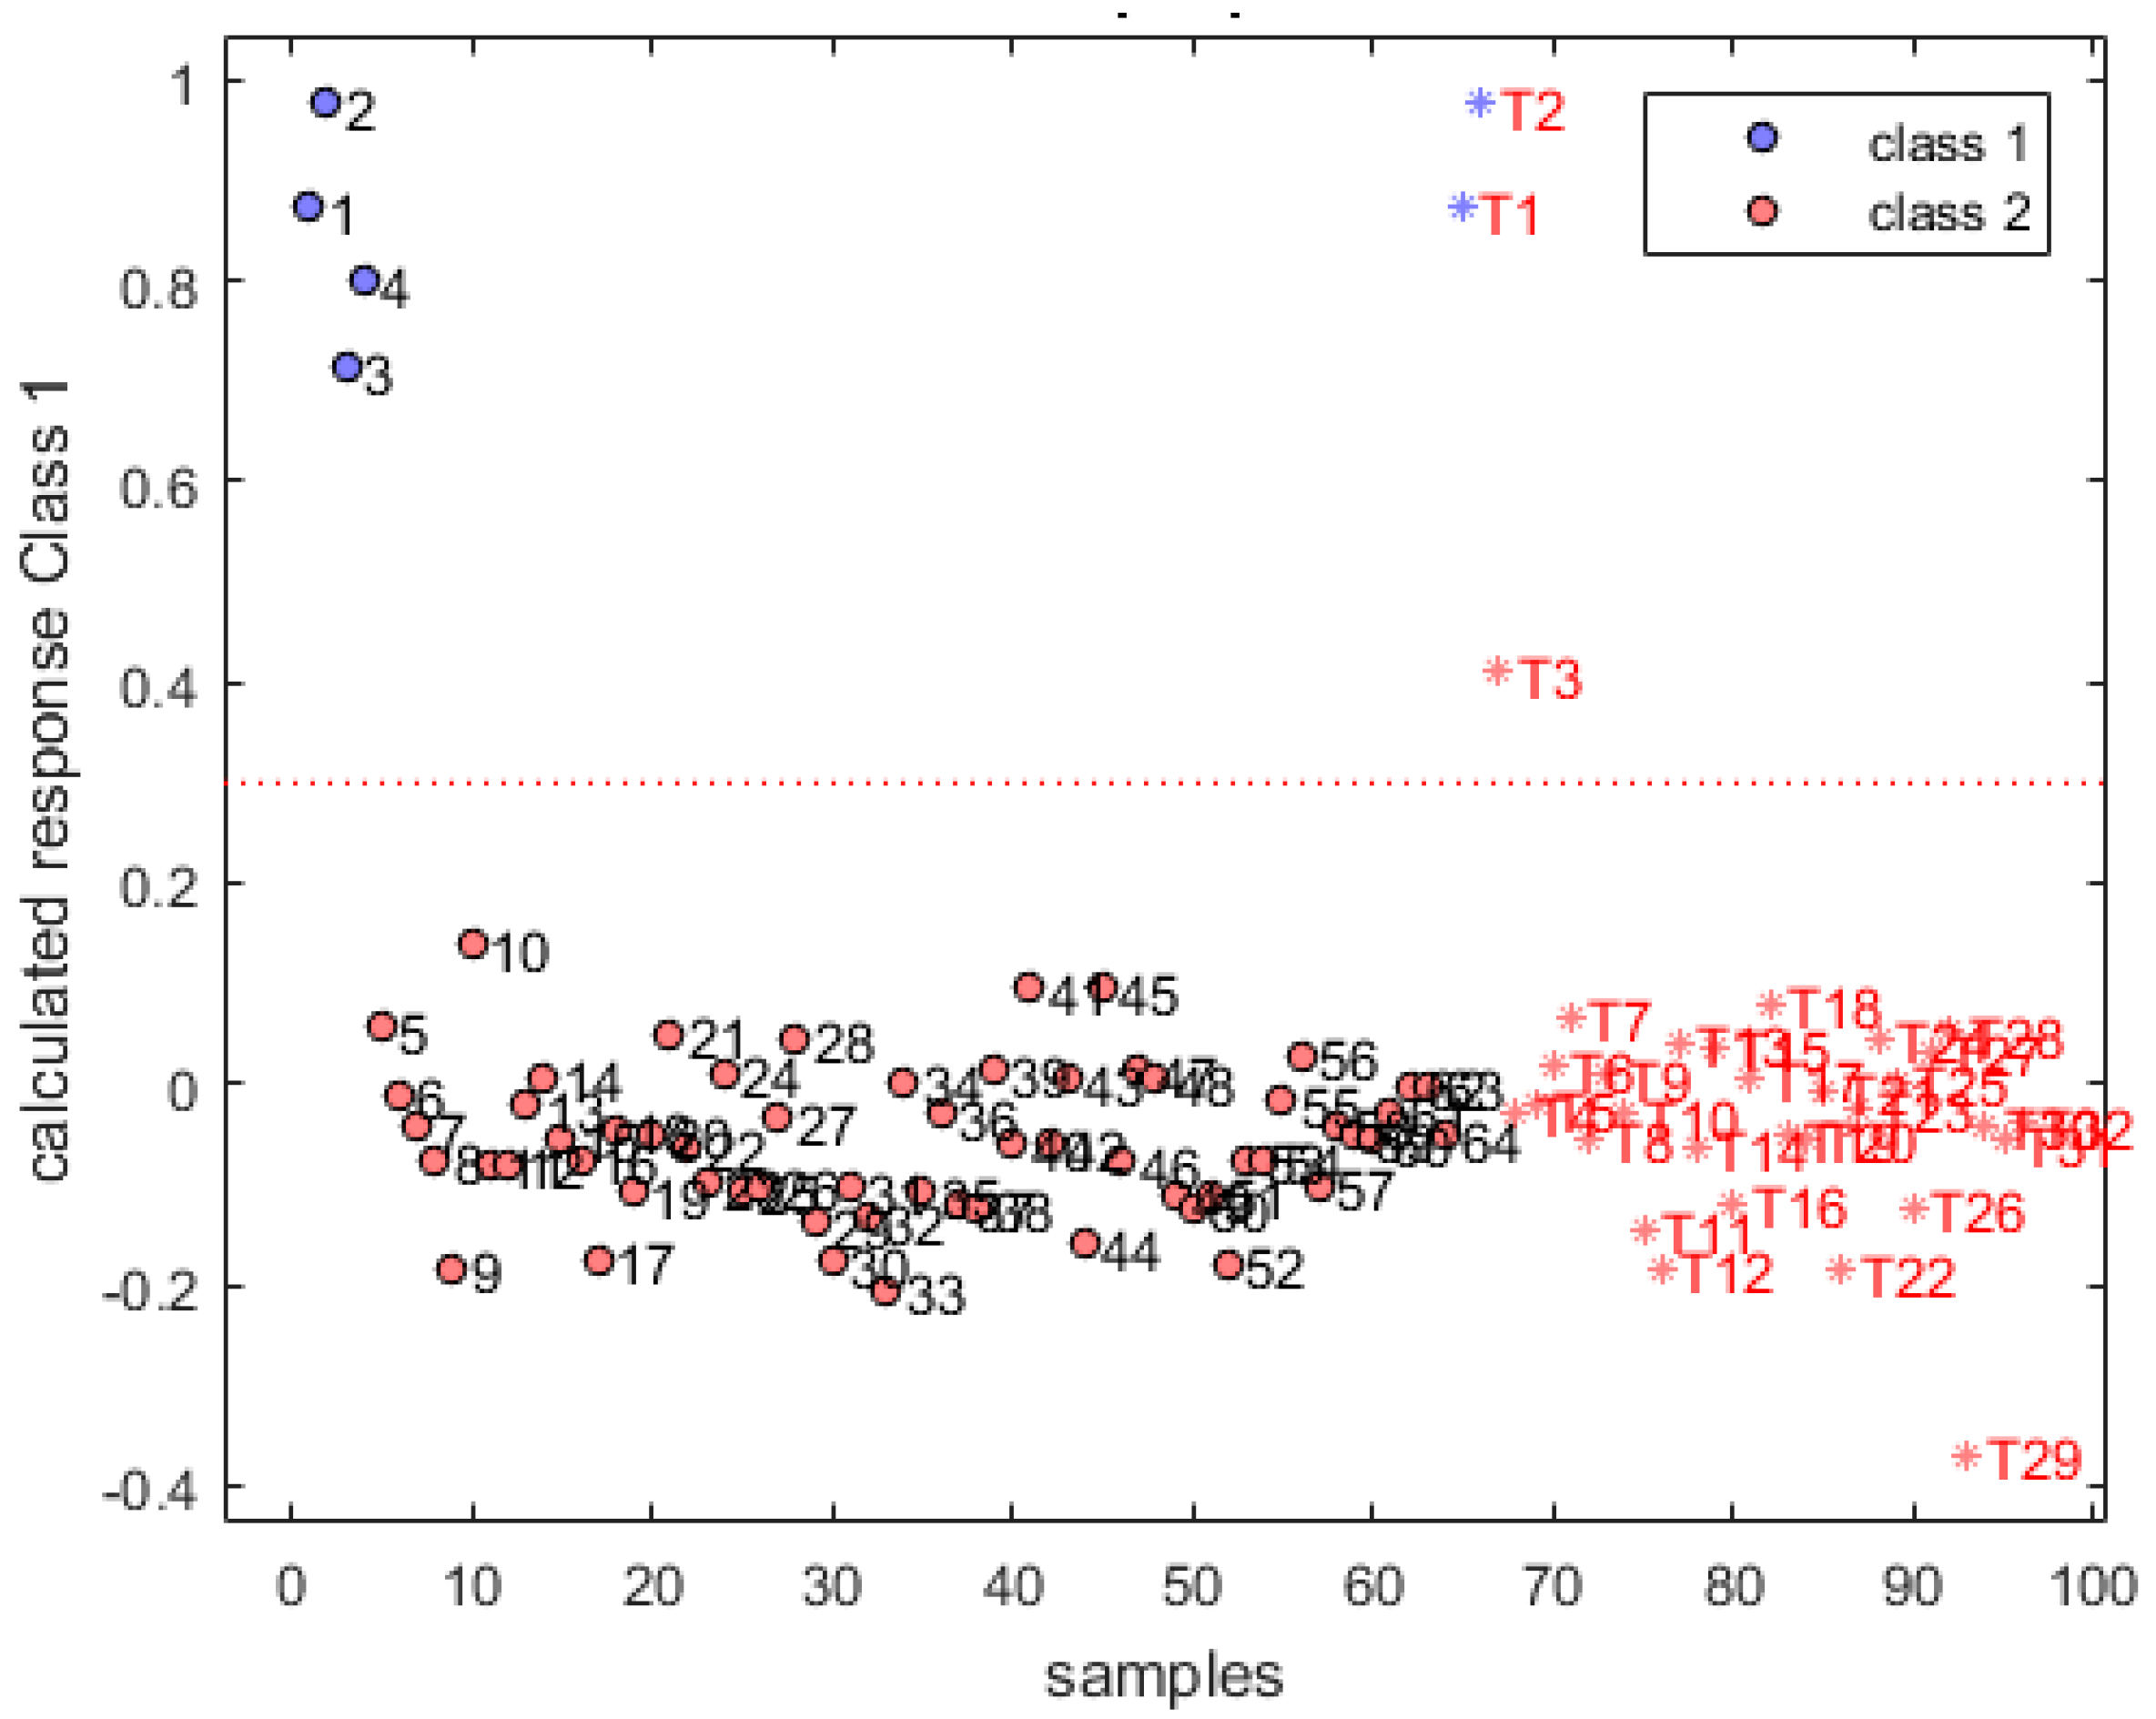
3.3. Qualitative Analysis of Gasoline

Based on the analysis in Section 3.2, it is difficult to accurately distinguish the methanol and methanol gasoline sample by unsupervised PCA. Thus, to qualitatively analyze these two class samples, a supervised classification algorithm PLS-DA was performed to establish the classification model. Prior to the establishment of PLS-DA, samples in each category were randomly divided into calibration sets and prediction sets with the ratio of 2:1, respectively, and then merged. Consequently, there are 64 and 32 samples in calibration and prediction set. Then PLS-DA was created based on calibration set and the remaining 32 samples were predicted using the established classification model. Notably, the number of LVs for PLS-DA model was 8 by performing 10 fold cross-validation on the calibration set.
To more concisely present the calculated result, the plot between the sample and the calculated response was plotted and thus the classification result was shown in Figure 3. Obviously, the PLS-DA classifier performed well for calibration set that all samples were accurately classified. Therefore, the accuracy for calibration set was 100%. When the classification result of prediction set was considered, a sample T3 belonging to methanol gasoline class was misclassified as methanol sample but two sample of methanol were all accurately classified. As for the reason, T3 is a methanol gasoline sample with 2% methanol in gasoline, where may lead to the misclassification due to low methanol content. Nevertheless, the classification accuracy of prediction was 96.88% (32/33) on the basis of the classification result of prediction set. Given the above analysis comprehensively, it can be concluded that supervised classification model of PLS-DA can accurately classify the methanol and the methanol gasoline sample.

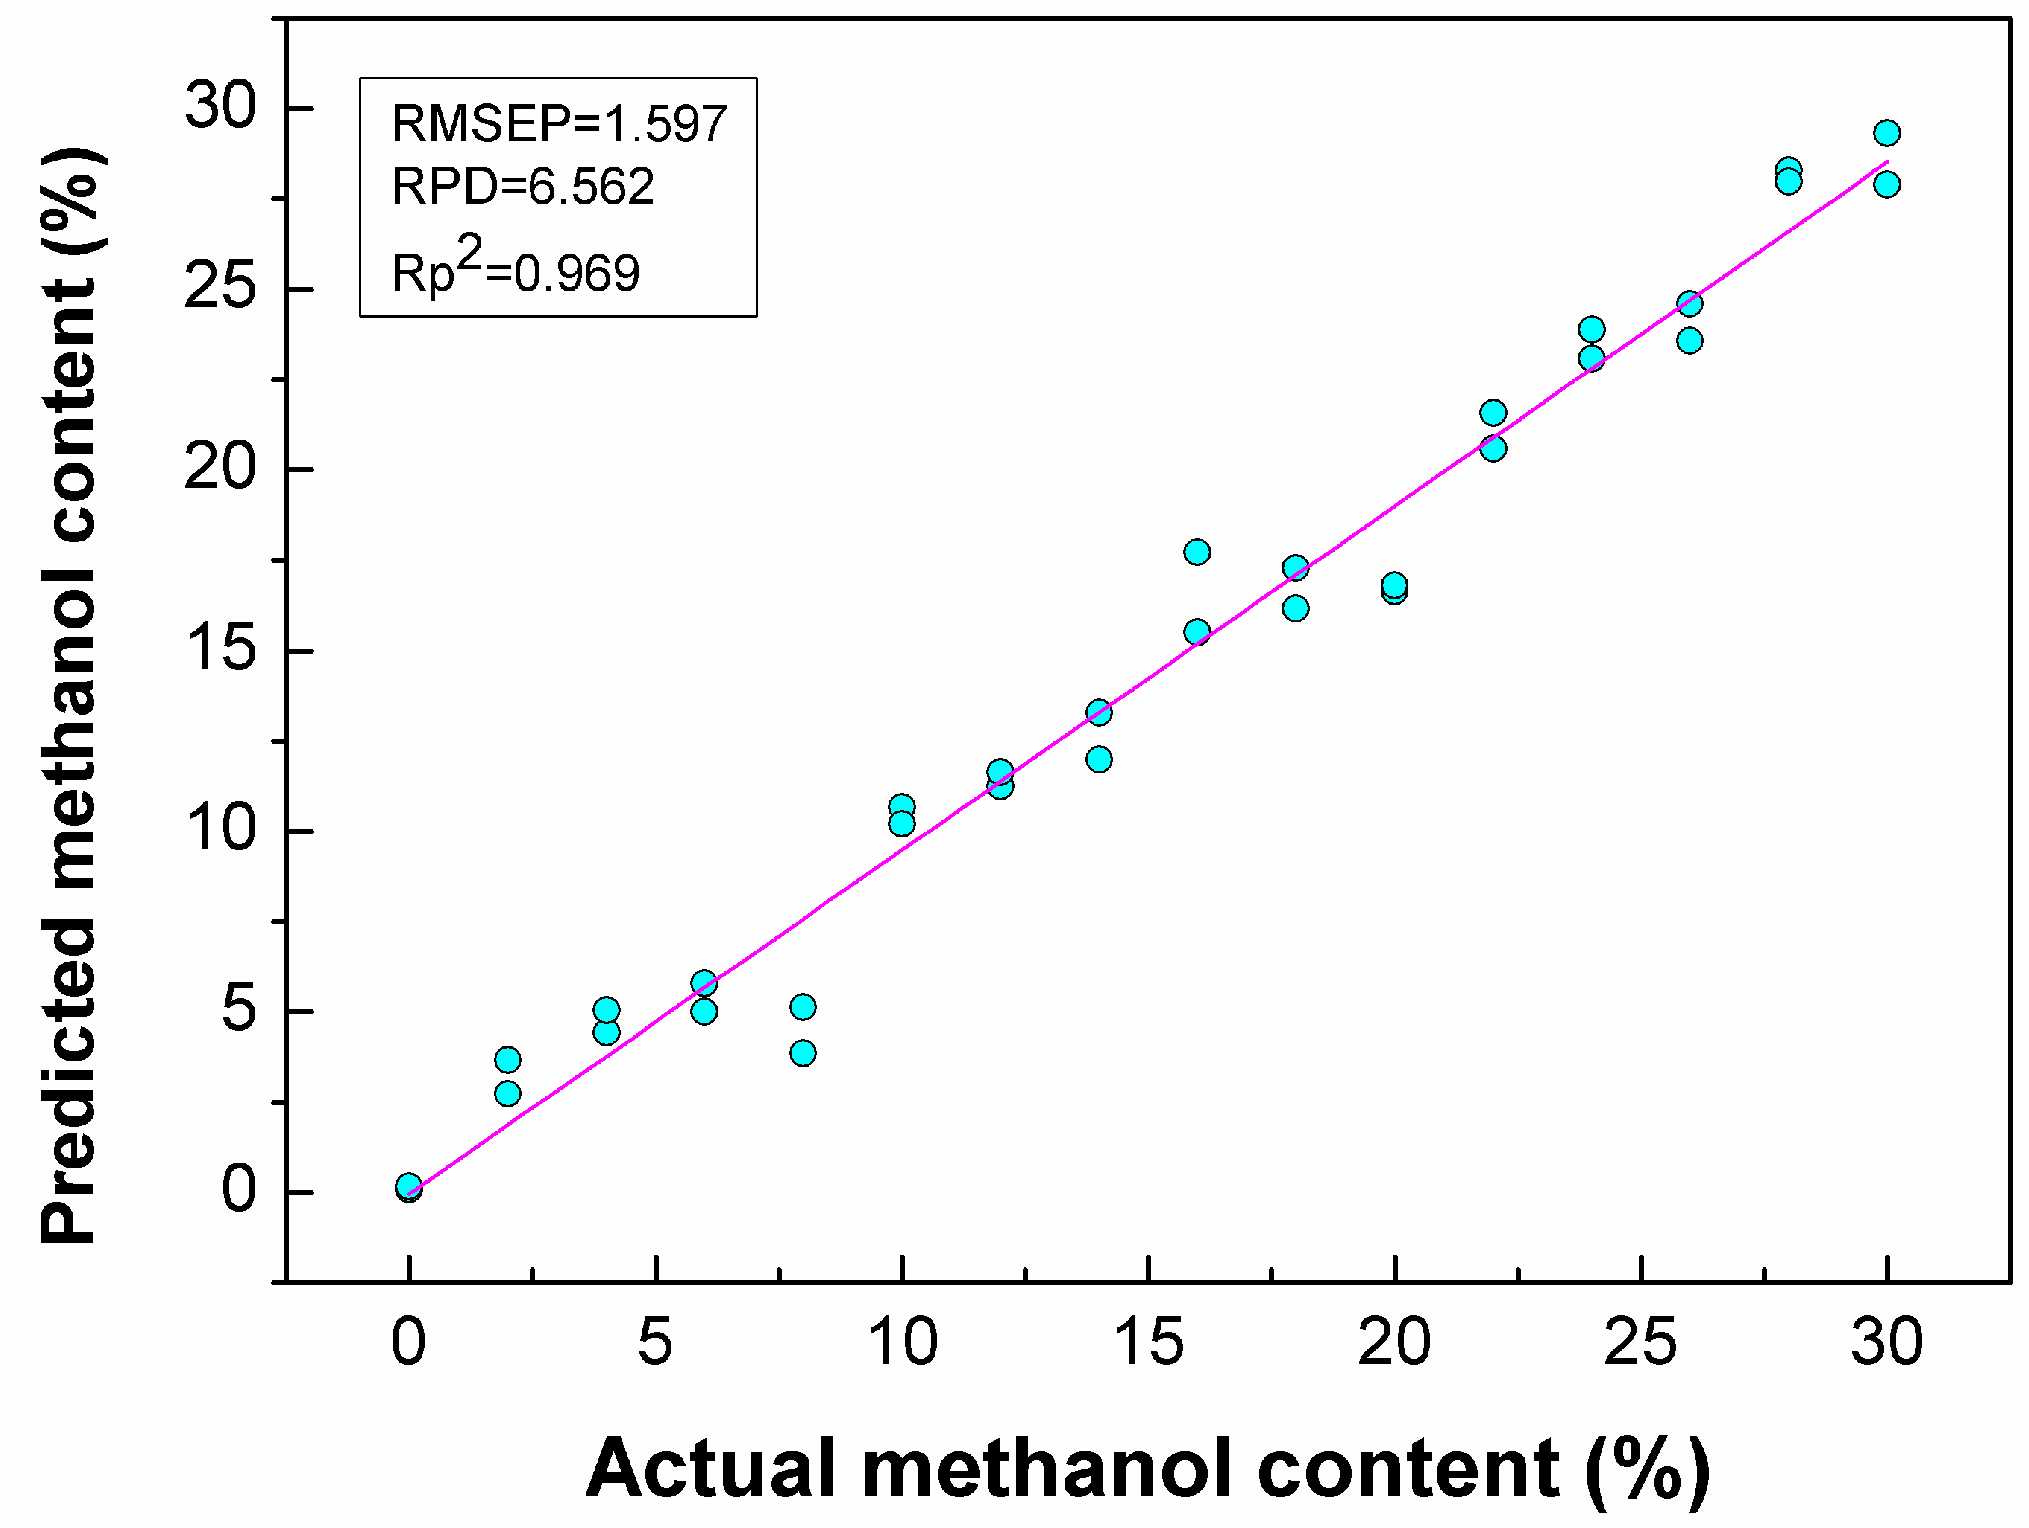
3.4. Quantitative Analysis of Methanol in Gasoline

To quantitatively analyze the methanol content in methanol gasoline, two regression methods of PLSR and LS-SVM were applied to build the quantitatively analysis model. There are a total of 1762 variables in the ATR-FTIR spectral data. Firstly, PLSR and LS-SVM were established to predict methanol content based on the full spectral variables. Furthermore, the calculated results are shown in Table 1, and it can be seen that all the R2p values were higher than 0.96 for PLSR or LS-SVM prediction models, which means that it is feasible to quantitatively analyze the methanol content in methanol gasoline using ATR-FTIR spectral data. In addition, it can be found that there is no significant difference between PLSR and the LS-SVM model for methanol prediction when the performances of PLSR and LS-SVM were compared. When the robustness of models was considered, it can be found that the value of RMSEC is larger than that of RMSEP (1.658 > 0.405 and 1.661 > 0.395), which means that these two regression models of PLSR and LS-SVM have a slight overfitting. This may be caused by the reasons of too many variables and an unbalanced distribution of samples in the calibration model [32]. In general, the regression model for predicting methanol content in methanol gasoline is acceptable and accurate.
Although the prediction model achieved high accuracy, there are too many useless and uninformative input variables that will result in the decline in model accuracy and robustness. To eliminate these unrelated variables and improve the performance of the prediction model, two variables selection method of CARS and UVE were conducted to identity the optimal variables [33]. Then the PLSR and LS-SVM regression models were developed and the corresponding calculated results were presented in Table 1. It can be found that the number of variables was reduced to only 0.027% (48/1762) of the total variables for CARS. Based on these selected variables, the simpler PLSR and LS-SVM models were built. As shown in Table 1, the prediction performance of CARS-PLSR and CARS-LS-SVM model was improved slightly in comparison with PLSR and LS-SVM model based on the full variables. When the UVE was considered, it can be found that UVE-PLSR and UVE-LS-SVM have the R2p value of 0.972 and 0.964, respectively. As shown in Figure 4, scatter plots of the actual values versus the predicted values in prediction set are well distributed along the diagonal line by UVE-PLS model, indicating a good performance of the predictive capability. Additionally, the stability of the prediction model has become more stable after performing UVE, and the ABS value decreased from 1.253 to 0.847. Therefore, UVE is a more suitable variable selection method than CARS in improving the performance of predicting the methanol content in gasoline by ATR-FT-IR spectroscopy.

3.5. Discussion

In this paper, the feasibility of using ATR-FTIR spectra combined with multivariate model for predicting the methanol content in methanol gasoline was investigated. According to the assessment criteria [34], a model with an RPD value in the range of 2.5~3, can obtain a good prediction result. If the RPD value of a model is larger than three, it means the excellent prediction performance can be achieved. Based on the above criteria and calculated result in Table 1, the full variables and UVE regression model have the RPD value larger than three. Therefore, an excellent prediction result for methanol content in methanol gasoline can be achieved using the full variables model and the UVE regression model. Furthermore, it can also be concluded that it is feasible to qualitatively and quantitatively analyze the methanol content in methanol gasoline.
To get the best regression model, two quantitatively multivariate models of PLSR and LS-SVM and two classic variables selection methods were carried out and combined to establish the more accurate prediction model. All results from the six prediction model were presented in Table 1, and two conclusions can be drawn through comprehensive comparisons among these six models. The first one is that the PLSR model has better prediction performance than the LS-SVM model. This conclusion is consistent with the Lambert–Beer law that is the basis of quantitative analysis of an infrared spectra. Therefore, the linear PLSR regression model is more suitable to quantitatively analyze the methanol content in methanol gasoline. Additionally, it can be found that the UVE not only can greatly reduce the variables number but also improve the accuracy and robustness. The other conclusion is that the variable selection method is a preferential choice to simplify the calculation and improve the performance of model. Generally speaking, UVE coupled with PLSR model is a better choice than others to quantitatively analyze the methanol content.
Methanol gasoline is a more environmentally friendly and economical energy source than gasoline. Qualitative and quantitative analysis plays an important in ensuring the quality of the methanol gasoline. To this end, ATR-FTIR spectra and chemometrics were used to nondestructively determine the methanol content. Furthermore, the corresponding excellent result shows that it is feasible to quantitative analyze using ATR-FTIR technology. Compared with traditional methods, ATR-FTIR has shown its speed, accuracy and online detectability. Although an excellent prediction result for the detection of methanol content was obtained, there are many works needed to be done. In the future, more samples and more types of gasoline need to be considered in calibration model. More powerful chemometric methods and cheaper IR spectrometer need to be developed. Nevertheless, the result of this study indicates that using IR spectra to qualitative and quantitative methanol gasoline is feasible, which provides an alternative method to analyze and ensure the quality of gasoline for gas industry.

4. Conclusions

This study using ATR-FTIR technology investigated the feasibility to quantitatively and qualitatively detect the methanol in methanol gasoline. The calculated result demonstrated the accuracy and efficiency of IR spectra in quantitative and qualitative analysis of the methanol gasoline. As for the qualitative analysis, PLS-DA reached 100% and 96.88% accuracy for calibration and prediction set, respectively. When the quantitative analysis was considered, the PLSR and LS-SVM model, combined with UVE and CARS variables selection methods, were applied to establish the prediction model, and UVE-PLSR obtained the best prediction result with the RPD and ABS value of 6.420 and 0.847.
As a primary exploration using IR spectra to qualitatively and quantitatively the methanol in gasoline, the computed results show that it is feasible to nondestructive and rapid detect the methanol content. This research indicates that IR spectra is a promising analytical method in applying in the gasoline industry and more effort should be made to speed up industrial application.

Author Contributions

Data curation, Q.X. and L.M.; formal analysis, L.-m.Y. and X.C.; funding acquisition, L.-m.Y. and G.H.; investigation, Q.X.; methodology, L.-m.Y., L.M. and G.H.; software, L.M. and G.H.; supervision, L.-m.Y. and X.C.; writing—original draft, Q.X.; writing—review and editing, L.-m.Y.

Funding

This study was funded by National Natural Science Foundation of China (NO.51876145, NO.61705168), Zhejiang natural science foundation of China (NO. Q20F030059) Wenzhou bureau science & technology project of China (NO.S20170003, NO.G20190024).

Conflicts of Interest

The authors declare no conflicts of interest.

References

  1. Wiedemann, L.; d’Avila, L.; Azevedo, D. Adulteration detection of Brazilian gasoline samples by statistical analysis. Fuel 2005, 84, 467–473. [Google Scholar] [CrossRef]
  2. Song, M.; Zheng, W.; Wang, Z. Environmental efficiency and energy consumption of highway transportation systems in China. Int. J. Prod. Econ. 2016, 181, 441–449. [Google Scholar] [CrossRef]
  3. Valera, H.; Agarwal, A.K. Methanol as an Alternative Fuel for Diesel Engines; Methanol and the Alternate Fuel Economy; Springer: Berlin, Germany, 2019; pp. 9–33. [Google Scholar]
  4. Yilmaz, İ.; Taştan, M. Investigation of hydrogen addition to methanol-gasoline blends in an SI engine. IJHE 2018, 43, 20252–20261. [Google Scholar] [CrossRef]
  5. Liu, F.; Hua, Y.; Wu, H.; Lee, C.-F.; Shi, Z. Experimental and kinetic studies of soot formation in methanol-gasoline coflow diffusion flames. J. Energy Inst. 2017, 92, 38–50. [Google Scholar] [CrossRef]
  6. Khanmohammadi, M.; Garmarudi, A.B.; de la Guardia, M. Characterization of petroleum-based products by infrared spectroscopy and chemometrics. TrAC Trends Anal. Chem. 2012, 35, 135–149. [Google Scholar] [CrossRef]
  7. Teixeira, L.S.; Oliveira, F.S.; dos Santos, H.C.; Cordeiro, P.W.; Almeida, S.Q. Multivariate calibration in Fourier transform infrared spectrometry as a tool to detect adulterations in Brazilian gasoline. Fuel 2008, 87, 346–352. [Google Scholar] [CrossRef]
  8. Balabin, R.M.; Safieva, R.Z. Gasoline classification by source and type based on near infrared (NIR) spectroscopy data. Fuel 2008, 87, 1096–1101. [Google Scholar] [CrossRef]
  9. da Silva, M.P.F.; e Brito, L.R.; Honorato, F.A.; Paim, A.P.S.; Pasquini, C.; Pimentel, M.F. Classification of gasoline as with or without dispersant and detergent additives using infrared spectroscopy and multivariate classification. Fuel 2014, 116, 151–157. [Google Scholar] [CrossRef] [Green Version]
  10. Mabood, F.; Gilani, S.A.; Albroumi, M.; Alameri, S.; Al Nabhani, M.M.; Jabeen, F.; Hussain, J.; Al-Harrasi, A.; Boqué, R.; Farooq, S.; et al. Detection and estimation of Super premium 95 gasoline adulteration with Premium 91 gasoline using new NIR spectroscopy combined with multivariate methods. Fuel 2017, 197, 388–396. [Google Scholar] [CrossRef]
  11. Balabin, R.M.; Safieva, R.Z.; Lomakina, E.I. Gasoline classification using near infrared (NIR) spectroscopy data: Comparison of multivariate techniques. Anal. Chim. Acta 2010, 671, 27–35. [Google Scholar] [CrossRef]
  12. Kardamakis, A.A.; Pasadakis, N. Autoregressive modeling of near-IR spectra and MLR to predict RON values of gasolines. Fuel 2010, 89, 158–161. [Google Scholar] [CrossRef]
  13. Wold, S.; Esbensen, K.; Geladi, P. Principal component analysis. Chemom. Intell. Lab. Syst. 1987, 2, 37–52. [Google Scholar] [CrossRef]
  14. Orecchio, S.; Fiore, M.; Barreca, S.; Vara, G. Volatile profiles of emissions from different activities analyzed using canister samplers, and gas chromatography-mass spectrometry, (gc/ms) analysis: A case study. Int. J. Environ. Res. Public Health 2017, 142, 195. [Google Scholar] [CrossRef] [PubMed] [Green Version]
  15. Orecchio, S.; Bianchini, F.; Bonsignore, R.; Blandino, P.; Barreca, S.; Amorello, D. Profiles and sources of pahs in sediments from an open-pit mining area in the Peruvian andes. Polycycl. Aromat. Compd. 2016, 36, 429–451. [Google Scholar] [CrossRef]
  16. Amorello, D.; Orecchio, S.; Pace, A.; Barreca, S. Discrimination of almonds (prunus dulcis) geographical origin by minerals and fatty acids profiling. Nat. Prod. Lett. 2016, 3018, 2107–2110. [Google Scholar] [CrossRef]
  17. Chen, X.; Ding, H.; Yuan, L.M.; Cai, J.R.; Chen, X.; Lin, Y. New approach of simultaneous, multi-perspective imaging for quantitative assessment of the compactness of grape bunches. Aust. J. Grape Wine Res. 2018, 244, 413–420. [Google Scholar] [CrossRef]
  18. Kutsanedzie, F.Y.H.; Chen, Q.S.; Hassan, M.M.; Yang, M.; Sun, H.; Rahman, M.H. Near infrared system coupled chemometric algorithms for enumeration of total fungi count in cocoa beans neat solution. Food Chem. 2018, 240, 231–238. [Google Scholar] [CrossRef]
  19. Lee, L.C.; Liong, C.-Y.; Jemain, A.A. Partial least squares-discriminant analysis (PLS-DA) for classification of high-dimensional (HD) data: A review of contemporary practice strategies and knowledge gaps. Analyst 2018, 143, 3526–3539. [Google Scholar] [CrossRef]
  20. Ballabio, D.; Consonni, V. Classification tools in chemistry. Part 1: Linear models. PLS-DA. Anal. Methods 2013, 5, 3790–3798. [Google Scholar] [CrossRef]
  21. Geladi, P.; Kowalski, B.R. Partial least-squares regression: A tutorial. Anal. Chim. Acta 1986, 185, 1–17. [Google Scholar] [CrossRef]
  22. Höskuldsson, A. PLS regression methods. J. Chemom. 1988, 2, 211–228. [Google Scholar] [CrossRef]
  23. Huang, L.; Meng, L.; Zhu, N.; Wu, D. A primary study on forecasting the days before decay of peach fruit using near-infrared spectroscopy and electronic nose techniques. Postharvest Biol. Technol. 2017, 133, 104–112. [Google Scholar] [CrossRef]
  24. Li, H.; Liang, Y.; Xu, Q.; Cao, D. Key wavelengths screening using competitive adaptive reweighted sampling method for multivariate calibration. Anal. Chim. Acta 2009, 648, 77–84. [Google Scholar] [CrossRef]
  25. Cai, W.; Li, Y.; Shao, X. A variable selection method based on uninformative variable elimination for multivariate calibration of near-infrared spectra. Chemom. Intell. Lab. Syst. 2008, 90, 188–194. [Google Scholar] [CrossRef]
  26. Ye, S.; Wang, D.; Min, S. Successive projections algorithm combined with uninformative variable elimination for spectral variable selection. Chemom. Intell. Lab. Syst. 2008, 91, 194–199. [Google Scholar] [CrossRef]
  27. Mehmood, T.; Liland, K.H.; Snipen, L.; Sæbø, S. A review of variable selection methods in partial least squares regression. Chemom. Intell. Lab. Syst. 2012, 118, 62–69. [Google Scholar] [CrossRef]
  28. Zhu, N.; Nie, Y.; Wu, D.; He, Y.; Chen, K. Feasibility study on quantitative pixel-level visualization of internal quality at different cross sections inside postharvest loquat fruit. Food Anal. Meth. 2017, 10, 287–297. [Google Scholar] [CrossRef]
  29. Huang, L.; Zhou, Y.; Meng, L.; Wu, D.; He, Y. Comparison of different CCD detectors and chemometrics for predicting total anthocyanin content and antioxidant activity of mulberry fruit using visible and near infrared hyperspectral imaging technique. Food Chem. 2017, 224, 1–10. [Google Scholar] [CrossRef]
  30. Corsetti, S.; Zehentbauer, F.M.; McGloin, D.; Kiefer, J. Characterization of gasoline/ethanol blends by infrared and excess infrared spectroscopy. Fuel 2015, 141, 136–142. [Google Scholar] [CrossRef] [Green Version]
  31. Noor, P.; Khanmohammadi, M.; Roozbehani, B.; Yaripour, F.; Garmarudi, A.B. Determination of reaction parameters in methanol to gasoline (MTG) process using infrared spectroscopy and chemometrics. J. Clean. Prod. 2018, 196, 1273–1281. [Google Scholar] [CrossRef]
  32. Li, H.D.; Liang, Y.Z.; Xu, Q.S.; Cao, D.S. Model population analysis for variable selection. J. Chemom. 2010, 24, 418–423. [Google Scholar] [CrossRef]
  33. Wu, D.; Shi, H.; He, Y.; Yu, X.; Bao, Y. Potential of hyperspectral imaging and multivariate analysis for rapid and non-invasive detection of gelatin adulteration in prawn. J. Food Eng. 2013, 119, 680–686. [Google Scholar] [CrossRef]
  34. Mouazen, A.M.; Al-Walaan, N. Glucose adulteration in Saudi honey with visible and near infrared spectroscopy. Int. J. Food Prop. 2014, 17, 2263–2274. [Google Scholar] [CrossRef] [Green Version]
Figure 1. Average spectral profile of gasoline and methanol gasoline.
Applsci 09 05336 g001
Figure 2. Top three-dimensional plots of principal component analysis (PCA) maps for gasoline and gasoline with added methanol.
Applsci 09 05336 g002
Figure 3. Classification result of partial least squares discriminant analysis (PLS-DA) with 8 latent variables (LVs).
Applsci 09 05336 g003
Figure 4. Scatter plot of actual values versus predicted values in the prediction set by successive projections algorithm- partial least square (UVE-PLS) model.
Applsci 09 05336 g004
Table 1. Quantitative analysis results of methanol content in gasoline based on multivariate model.
ModelVariable Selection Number of VariablesLVsCalibration SetPrediction Set
R2cRMSECR2pRMSEPRPDABS
PLSR/1762150.9980.4050.9681.6586.1241.253
LS-SVM/1762/0.9980.3950.9681.6615.8861.266
PLSRCARS48110.970.4260.9691.5976.5631.171
LS-SVMCARS48/0.9980.4040.9681.6366.3731.232
PLSRUVE479100.9940.6990.9721.5456.4200.847
LS-SVMUVE479/0.9980.3950.9641.7425.5551.347
Note: PLSR: partial least squared regression; LS-SVM: least square-support vector machine; CARS: competitive adaptive reweighted sampling; UVE: uninformative variable elimination; LVs: latent variables; R2: determination coefficient; RMSE: root mean squared errors; RPD: residual predictive deviation; ABS: the absolute difference between RMSEC and RMSEP.

