1. Introduction
Currently, the world is still highly dependent on fossil fuels. The fact that climate change and global warming are happening is hard to deny. The consequences are becoming increasingly devastating and humanity is to blame. One of these consequences is directly noticeable, as the rise in sea level can be estimated every year, and it does not stop increasing. In Spain, this rise can be estimated between 3 and 5 mm a year, although this value is not uniform along the whole coastline. The prediction for the first half of the 21st century forecasts a sea level rise of more than 3 cm in the Cantabrian coast, between 15 and 20 cm in the Mediterranean Sea and 10 in the Gulf of Cadiz, South West of Spain, in the Atlantic Ocean [
1]. It should also be highlighted that numerous parts of the planet have become richer and more powerful due to the intensive use of the reserves of fossil energy, increasing the amount of greenhouse gas emissions, without taking into account the environmental risks, the pollution and the biodegradation.
For this reason, energy sources must be combined by eliminating the use of coal and oil and encouraging the use of other energies. The development of renewable energies is the key to achieving this purpose since they represent an inexhaustible energy source. Furthermore, they lead to a much smaller environmental impact. The main objective is how to make them more competitive and attractive in a way effective.
Among all the new sources of existing renewable energies, wave energy is one of the most promising, based on the idea of extracting energy from waves and turning it into electricity. It presents many advantages over other types of energies: it is a predictable resource, it counts with a high capacity of electric power production, it has an acceptable capacity factor and it makes a less visual impact. Furthermore, current wave energy facilities do not need any external source to get started; wave power is enough for it to start working.
This leads to the necessity of applying an integral model for the design of this type of facilities, namely the purpose of the model to achieve technical, economical and environmental viability, all within a sustainable development framework [
2]. Part of this sustainable development also leads to a correct design and planification of the future infrastructures in order that they could be adapted to the future progress of technology.
Despite all of these advantages, the exploitation of wave energy is still in its infancy in every field of the marine energies, in which great efforts must be done. The uncertainties in the design of almost of technology is justified by the “limited” field experience and in the review of the existing standards and recommendations nowadays [
3]. The main reason is due to the pending technological challenges. Although the future of that resource offers many possibilities in coastal regions with a high energy maritime climate, the intense research being carried out will lead to the maximum efficiency in the coming years.
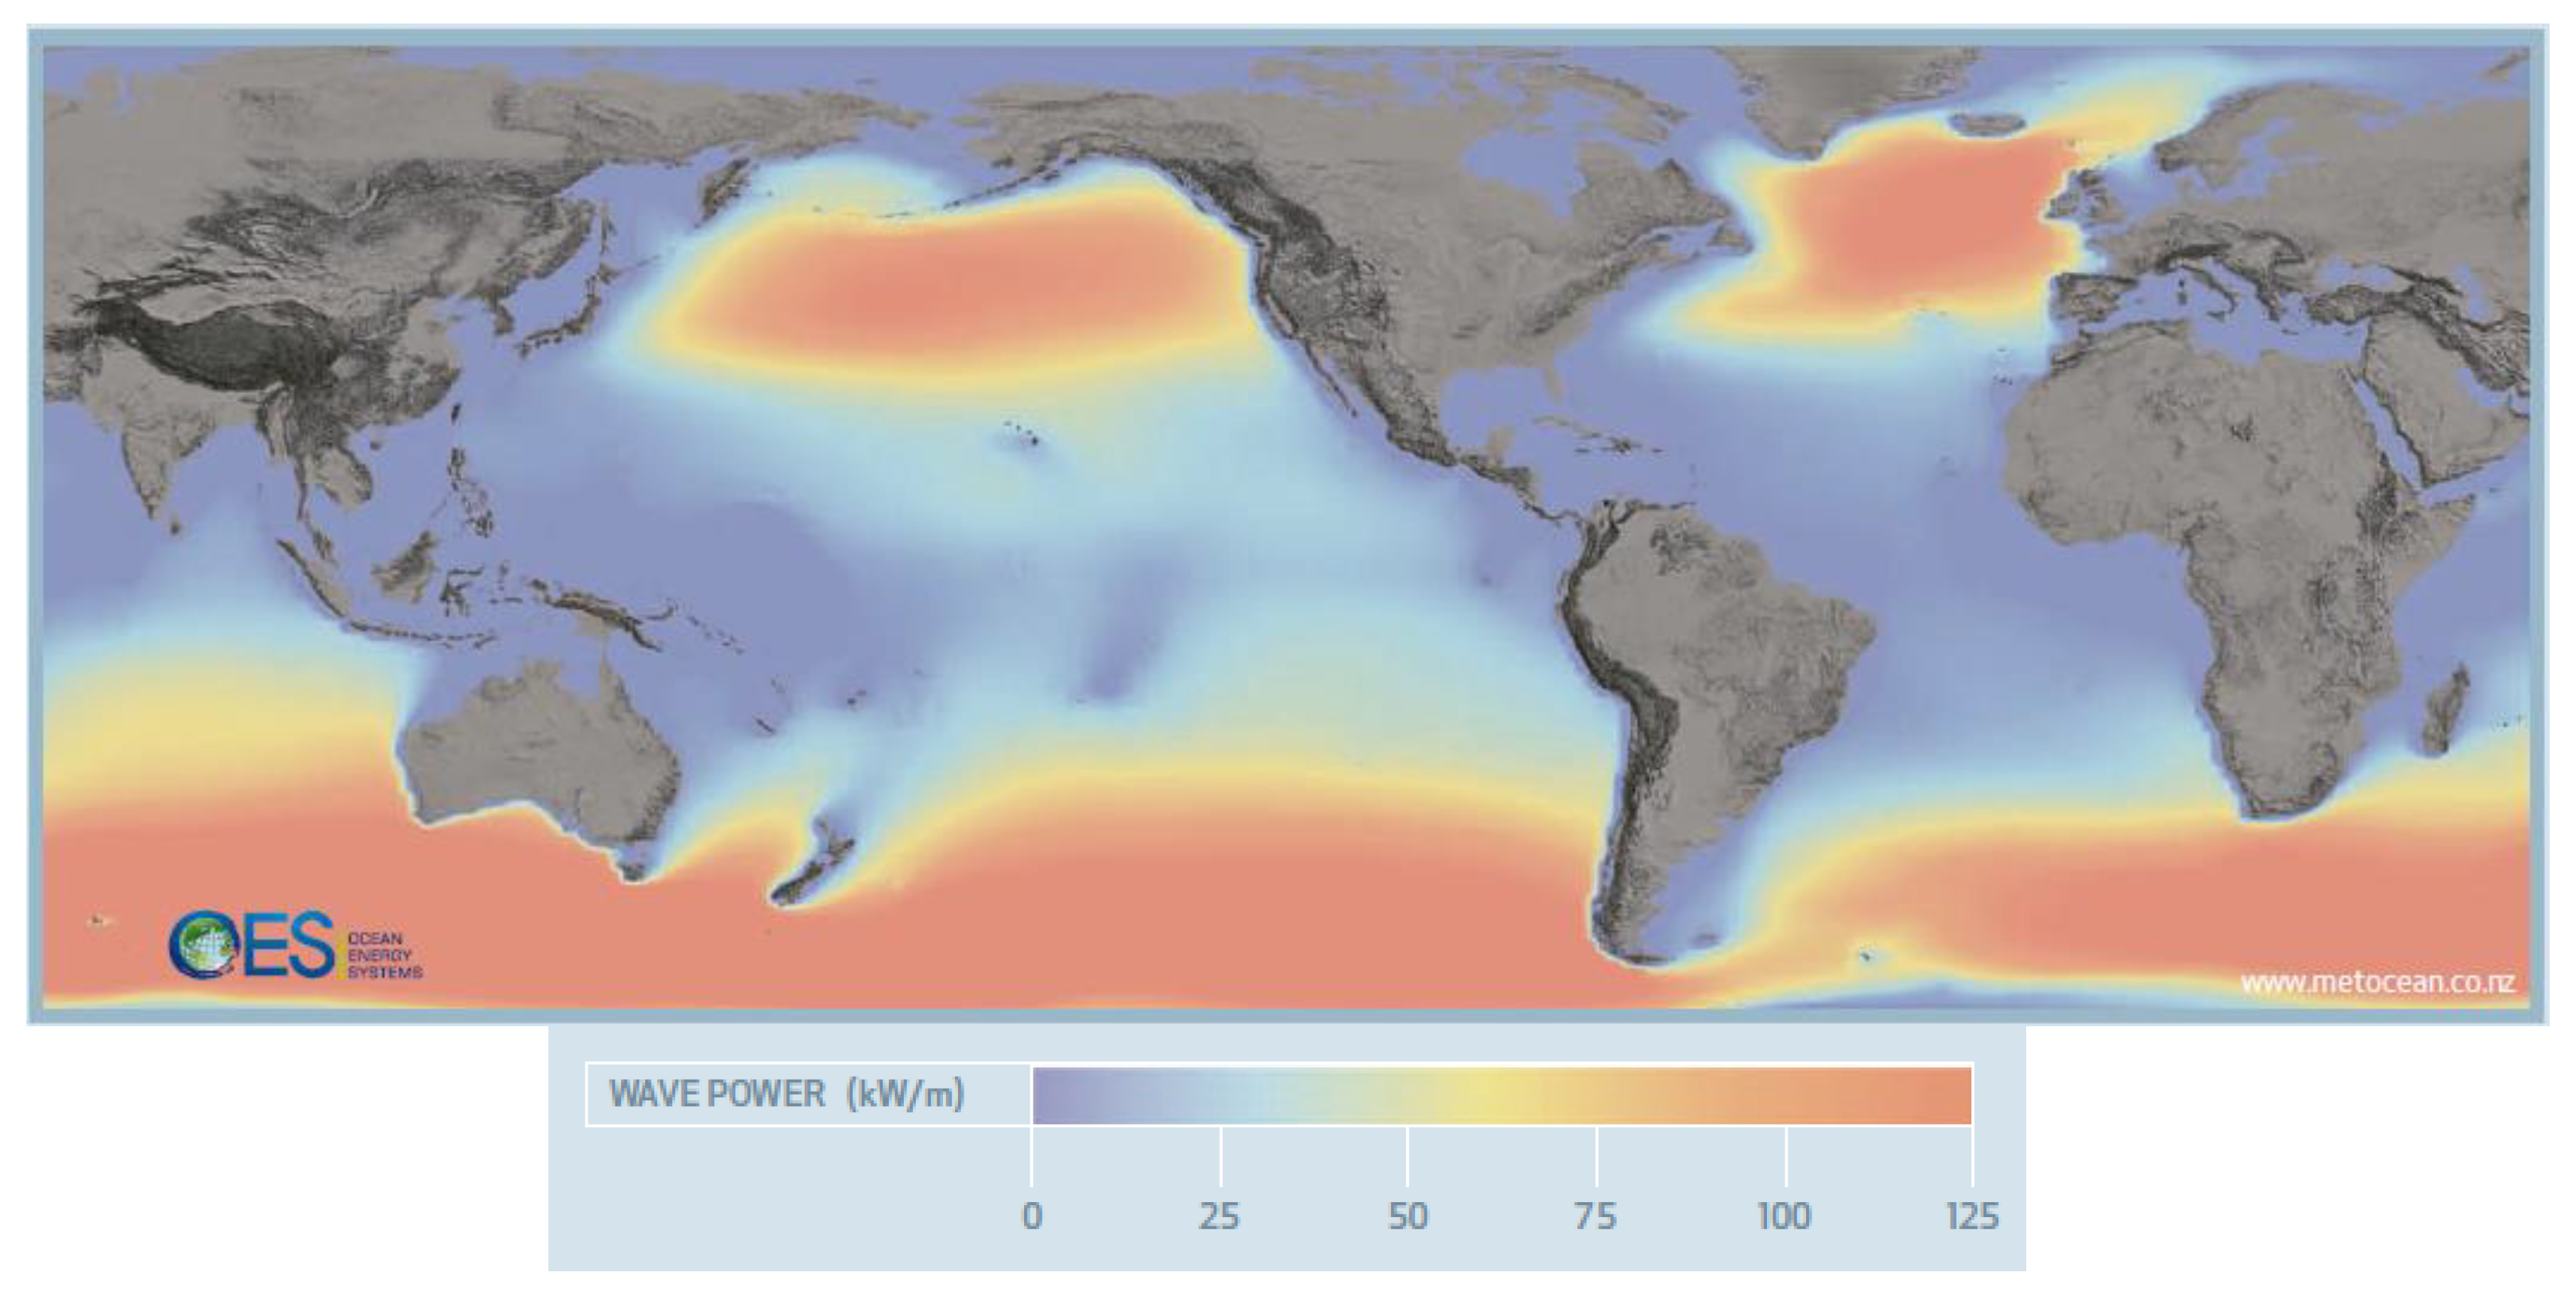
The privileged geographical situation of the Iberian Peninsula, with the west and north coast lapped by the Atlantic Ocean, make it the ideal place to take advantage of the great wave energy potential as numerous studies have shown (see
Figure 1). The “
Atlas del potencial del recurso de la energía de las olas en el litoral español” (in English: “Atlas of wave energy resource in the Spanish coast”) report, written by the “
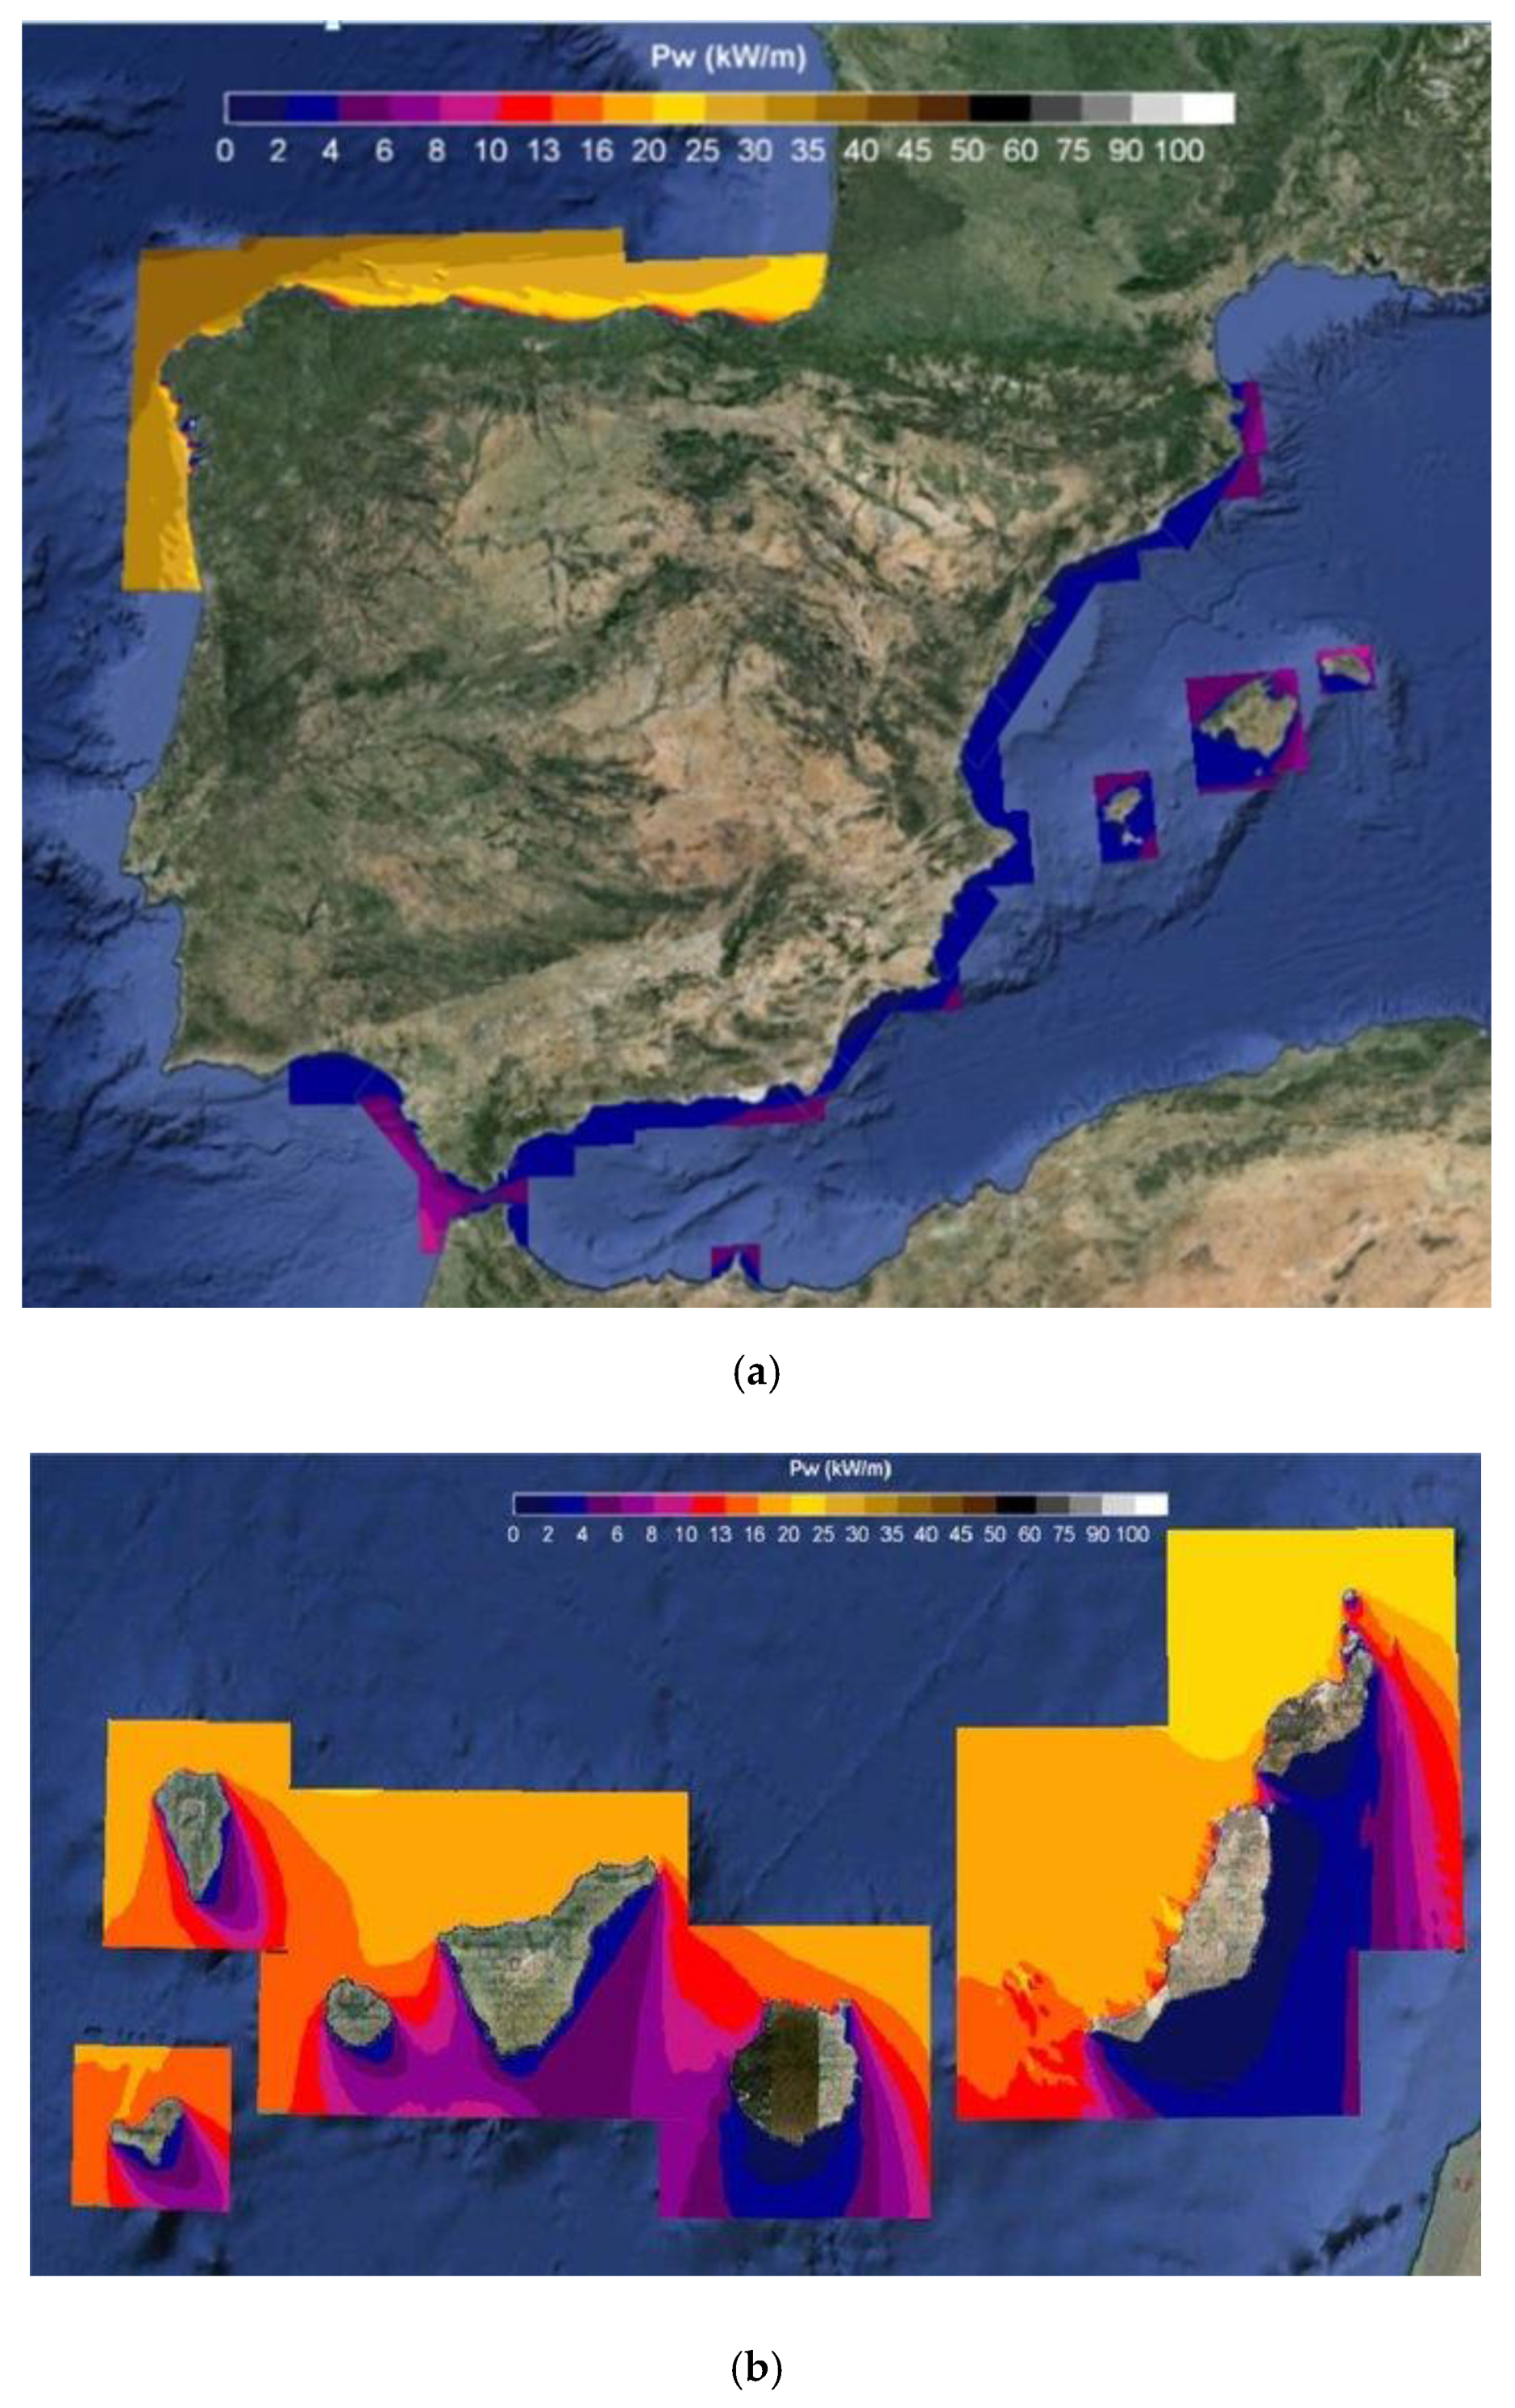
Instituto para la Diversificación y Ahorro de la Energía” (in English: “Institute for Diversification and Energy Saving”), confirmed those results. It showed that the north coast of Spain (Galicia, Asturias, and Basque Country) is the area with the greatest potential, with 13 kW/m during the summer period and 70 kW/m during the winter (see
Figure 2). In addition, the most interesting areas for harnessing the wave resource power are the Galician coast, as it represents the area with the greatest potential in Spain, with maximum values above 35 kW/m, and the Cantabrian coast, with an average of maximum values around 30 kW/m [
4,
5].
Given the previously described situation, the construction of a wave facility in the north coast of Spain is proposed, taking advantage of the wave energy converters that are currently available on the market and best addresses the coastal needs and characteristics. On the other hand, it is possible to take advantage of existing maritime structures to install devices for harnessing renewable energies. The north coastal facade in Spain has some of the great breakwaters built in the country [
9]. The research included in the present paper analyzes the way of using existing breakwaters not only for the shelter of the vessels in their typically port function, but also as the main structure to incorporate wave energy converters.
The analysis is focused on one of the biggest important breakwaters in that coastal facade: Punta Langosteira (Outer Port of A Coruña), Dique Torres (Port el Musel, Gijón), Dique Norte (Port el Musel, Gijón) and Punta Lucero (Port of Bilbao). In this way, it is possible to strengthen the image of the “Green Port” in the Spanish port system. To make the decision of the most suitable location, different aspects are considered, such as the point provided with the highest energy potential, the constructive viability, the fact of not being an obstacle for the maneuverability of vessels approaching the port and being built in a temporary window of one year.
Therefore, the objective of the research included in the present manuscript is the location analysis for the installation of a wave power plant in the notorious dikes on the north coast of Spain, studying aspects as significant as the energy potential of location, the feasibility of the construction process and the economic viability of the construction project. To achieve that, the content of the paper is as follows: (a) Methods, (b) Alternatives description, (c) Design basis, (d) Hydraulic and energetic behavior, (e) Structural behavior, (f) Constructive viability, (g) Evaluation of alternatives, (h) Economic viability and (i) Conclusions.
2. Methods
The main aim of this paper is to show how some of the chosen wave energy devices really function on the different proposed locations in the North of Spain and to investigate if its construction and installation are possible, considering the adverse climatic condition and the economic viability.
First of all, it is necessary to collect the most relevant available data that influence works of this nature, such as the geometric dimensions of the breakwaters and a market research of the wave energy technology that can be appropriate in the existing breakwaters. An analysis of the wave energy resource at the study points is the next step taken to quantitatively determine not only the energy available in each point, but also the production of energy obtained by the device, as well as the capacity factor. Based on that, the most optimal location in each breakwater is selected.
According to an energy consumption estimation in each port, the length of the wave energy facility is determined. This methodology strengthens the image of the “Green Port” and complies with the Environmental Sustainability Reports of the corresponding Port Authorities.
Given the lack of device designing methodology, a research analysis is carried out to adapt the structural calculations and to check the ultimate and service design conditions. Thus, the geometric definition of the devices in the locations could be obtained.
Once the structural stability is guaranteed, the constructive viability of each alternative is studied so that the condition of having the construction works only during one year is fulfilled.
Last but not least, a multicriteria analysis has been developed considering all the previous aspects.
3. Alternatives Description
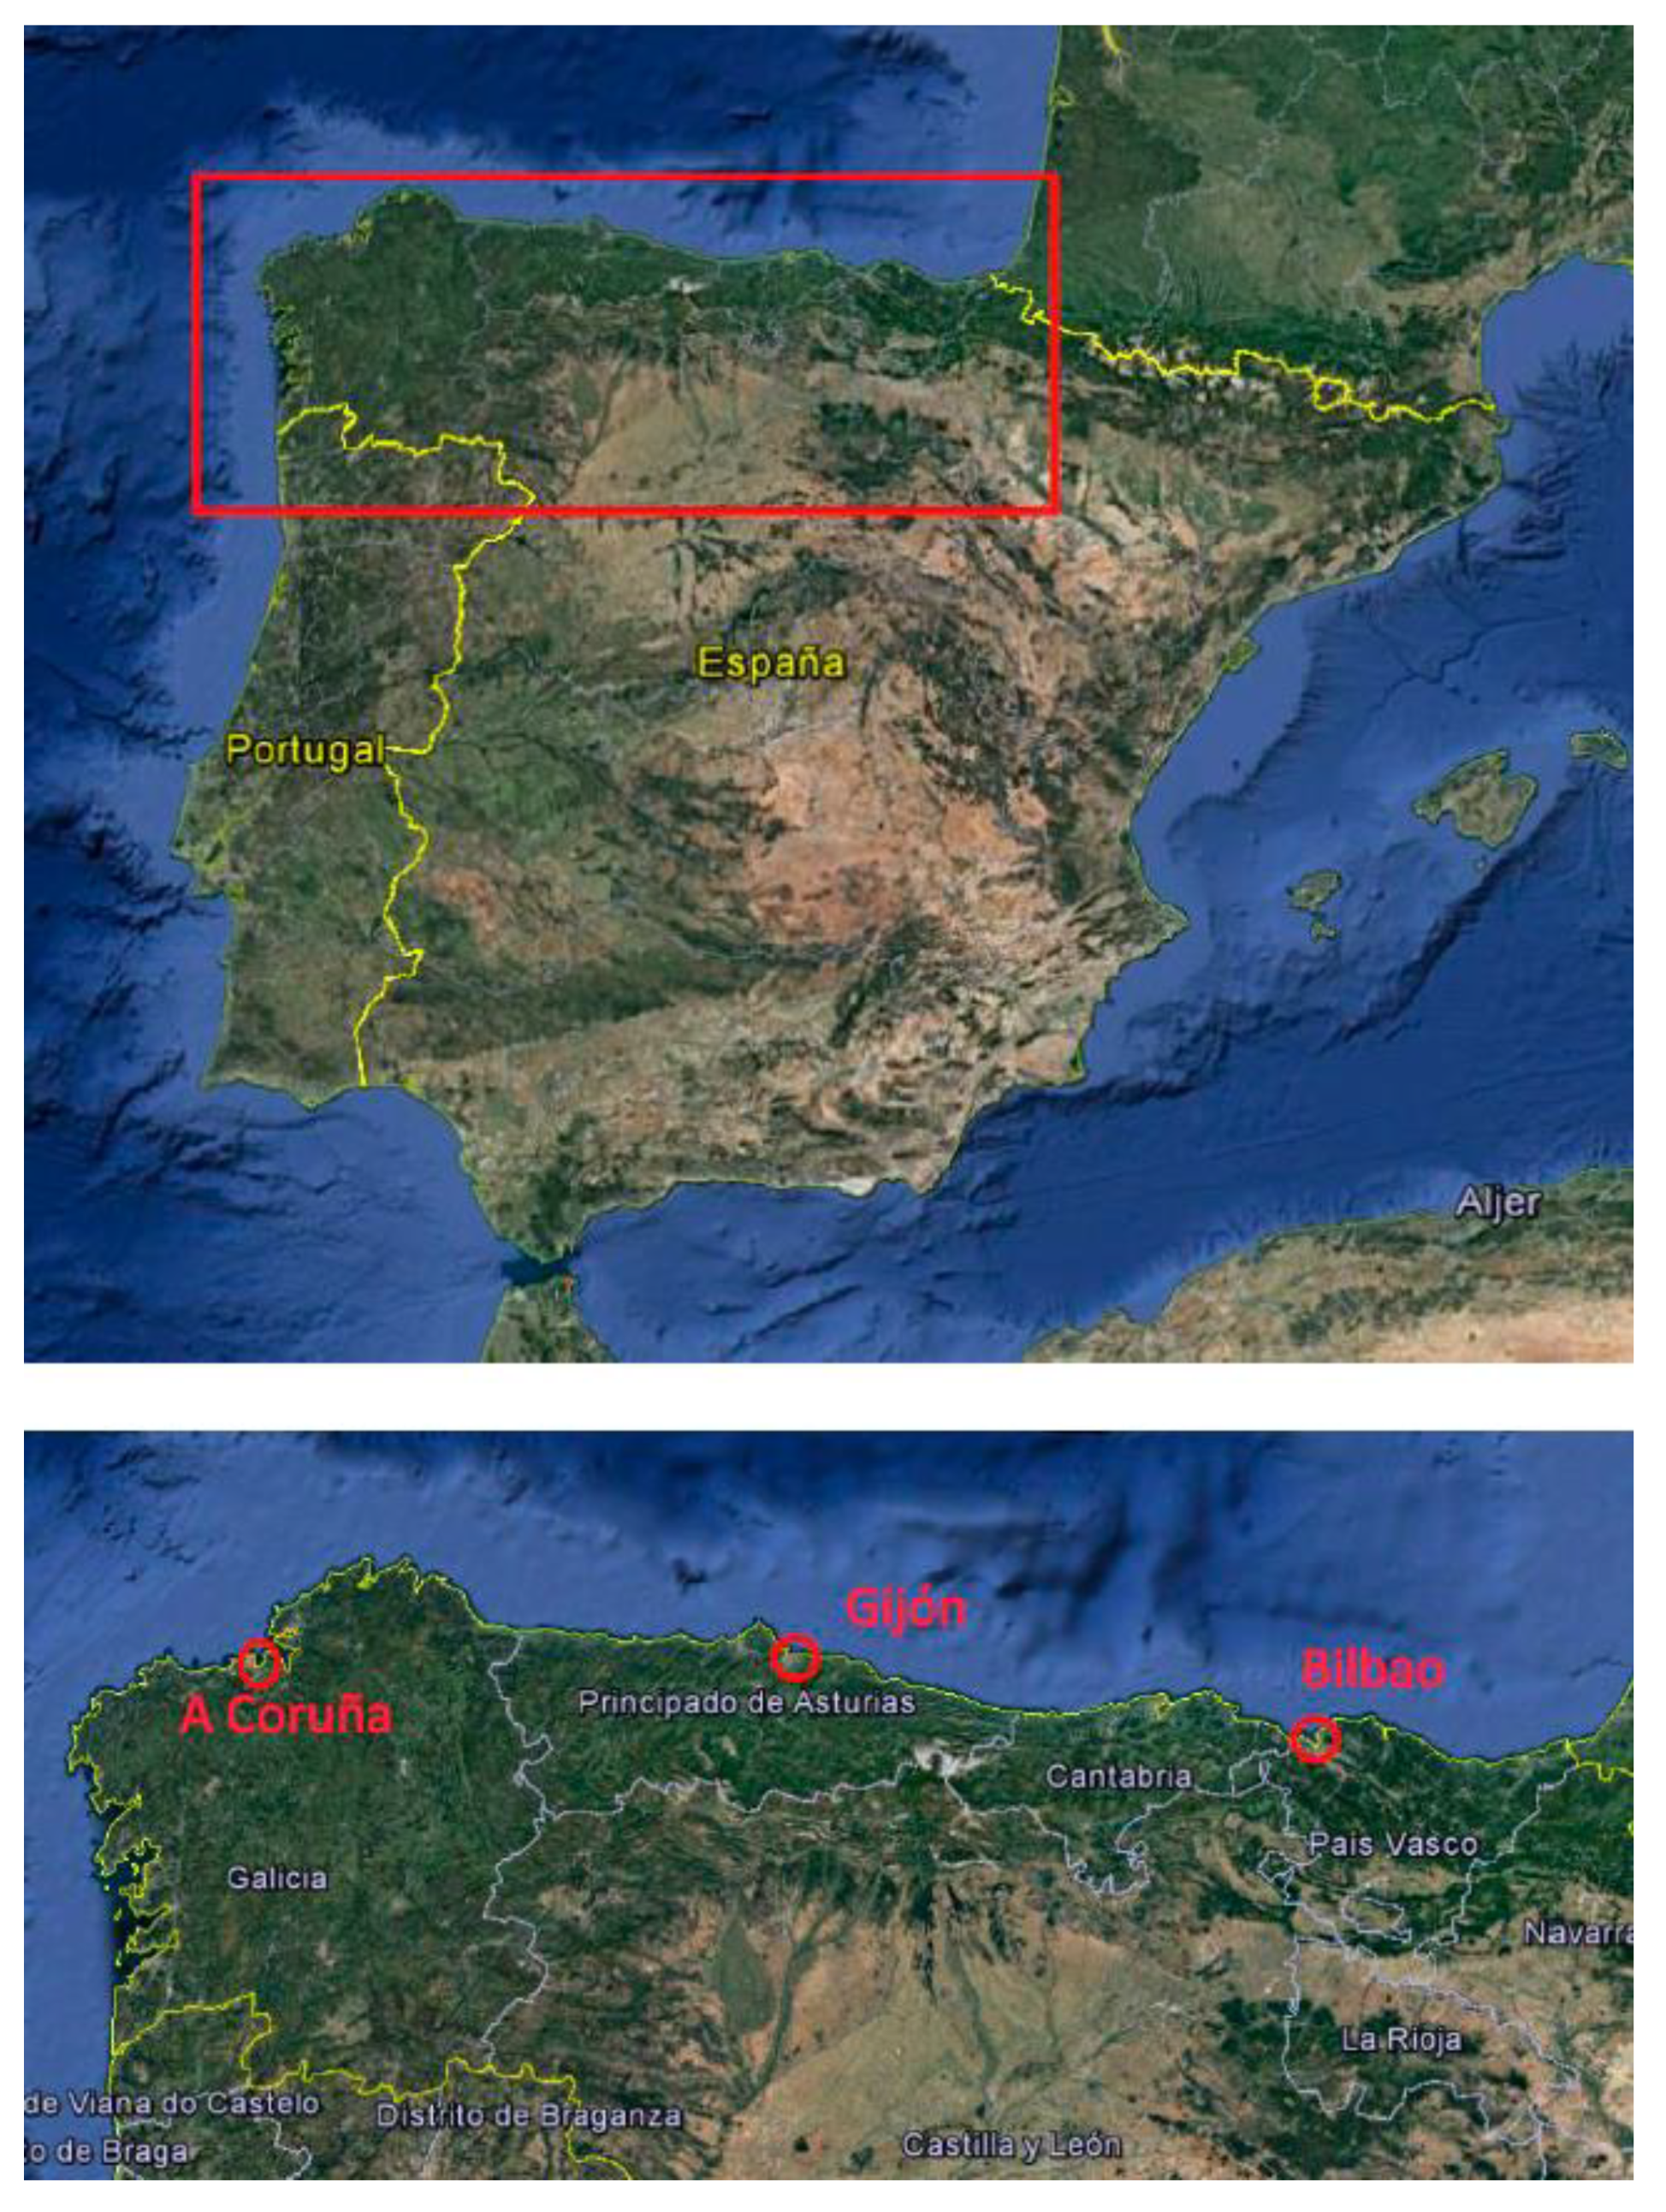
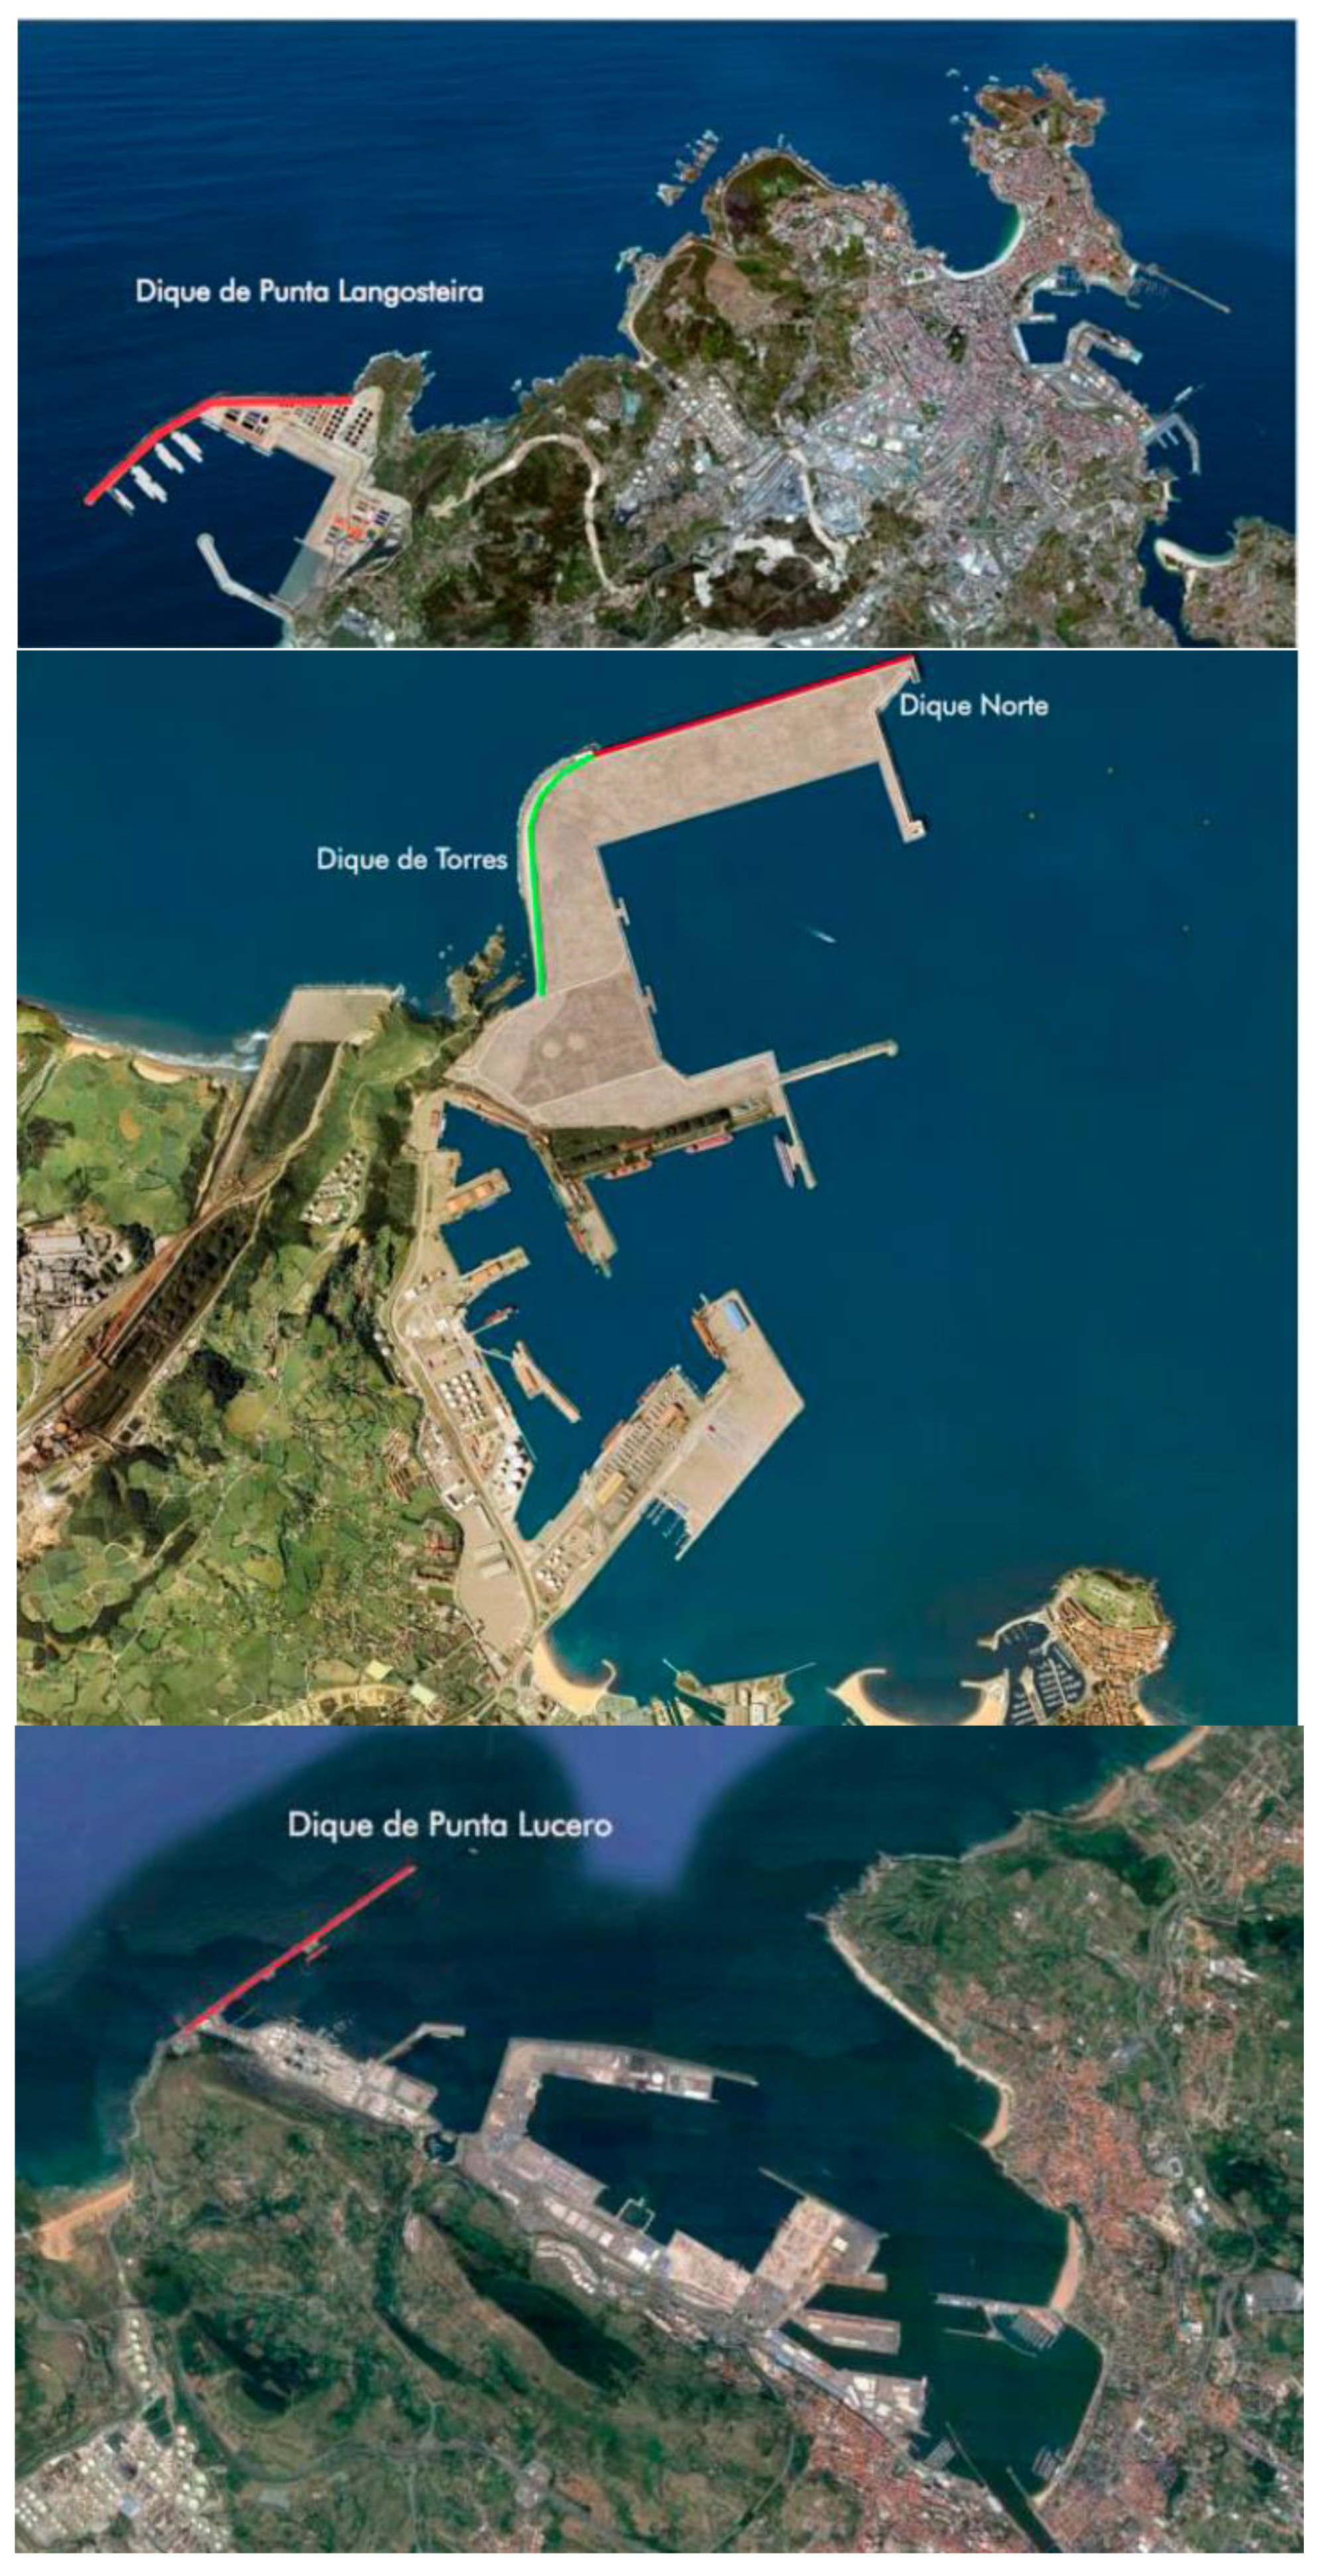
Punta Langosteira breakwater is located in the new facilities of the Outer A Coruña Port (Galicia), between Punta Langosteira (east) and Punta de Pelón (west), which is placed 7 km southwest from the town center of A Coruña. The Torres and North breakwaters were built as a part of the extension of Gijón port (Asturias). Torres breakwater starts from the end of the Torres Cape (hence its name), entering the sea and ending at the North breakwater (leaving to the west the aforementioned Cape). Punta Lucero breakwater is in the area of the Bilbao port (Biscay, Basque Country), closing the entire maritime area called Exterior Abra.
Figure 3 shows the location of the three ports and
Figure 4 shows the location of the breakwaters of this study.
4. Design Basis
The first step is to know the existing conditions in three locations, considering the most relevant data for the study. That includes: section drawings and characteristics of the breakwaters where the wave energy converters will be installed, bathymetry, geology and geotechnics, seismicity, metocean conditions as waves and tides, etc.
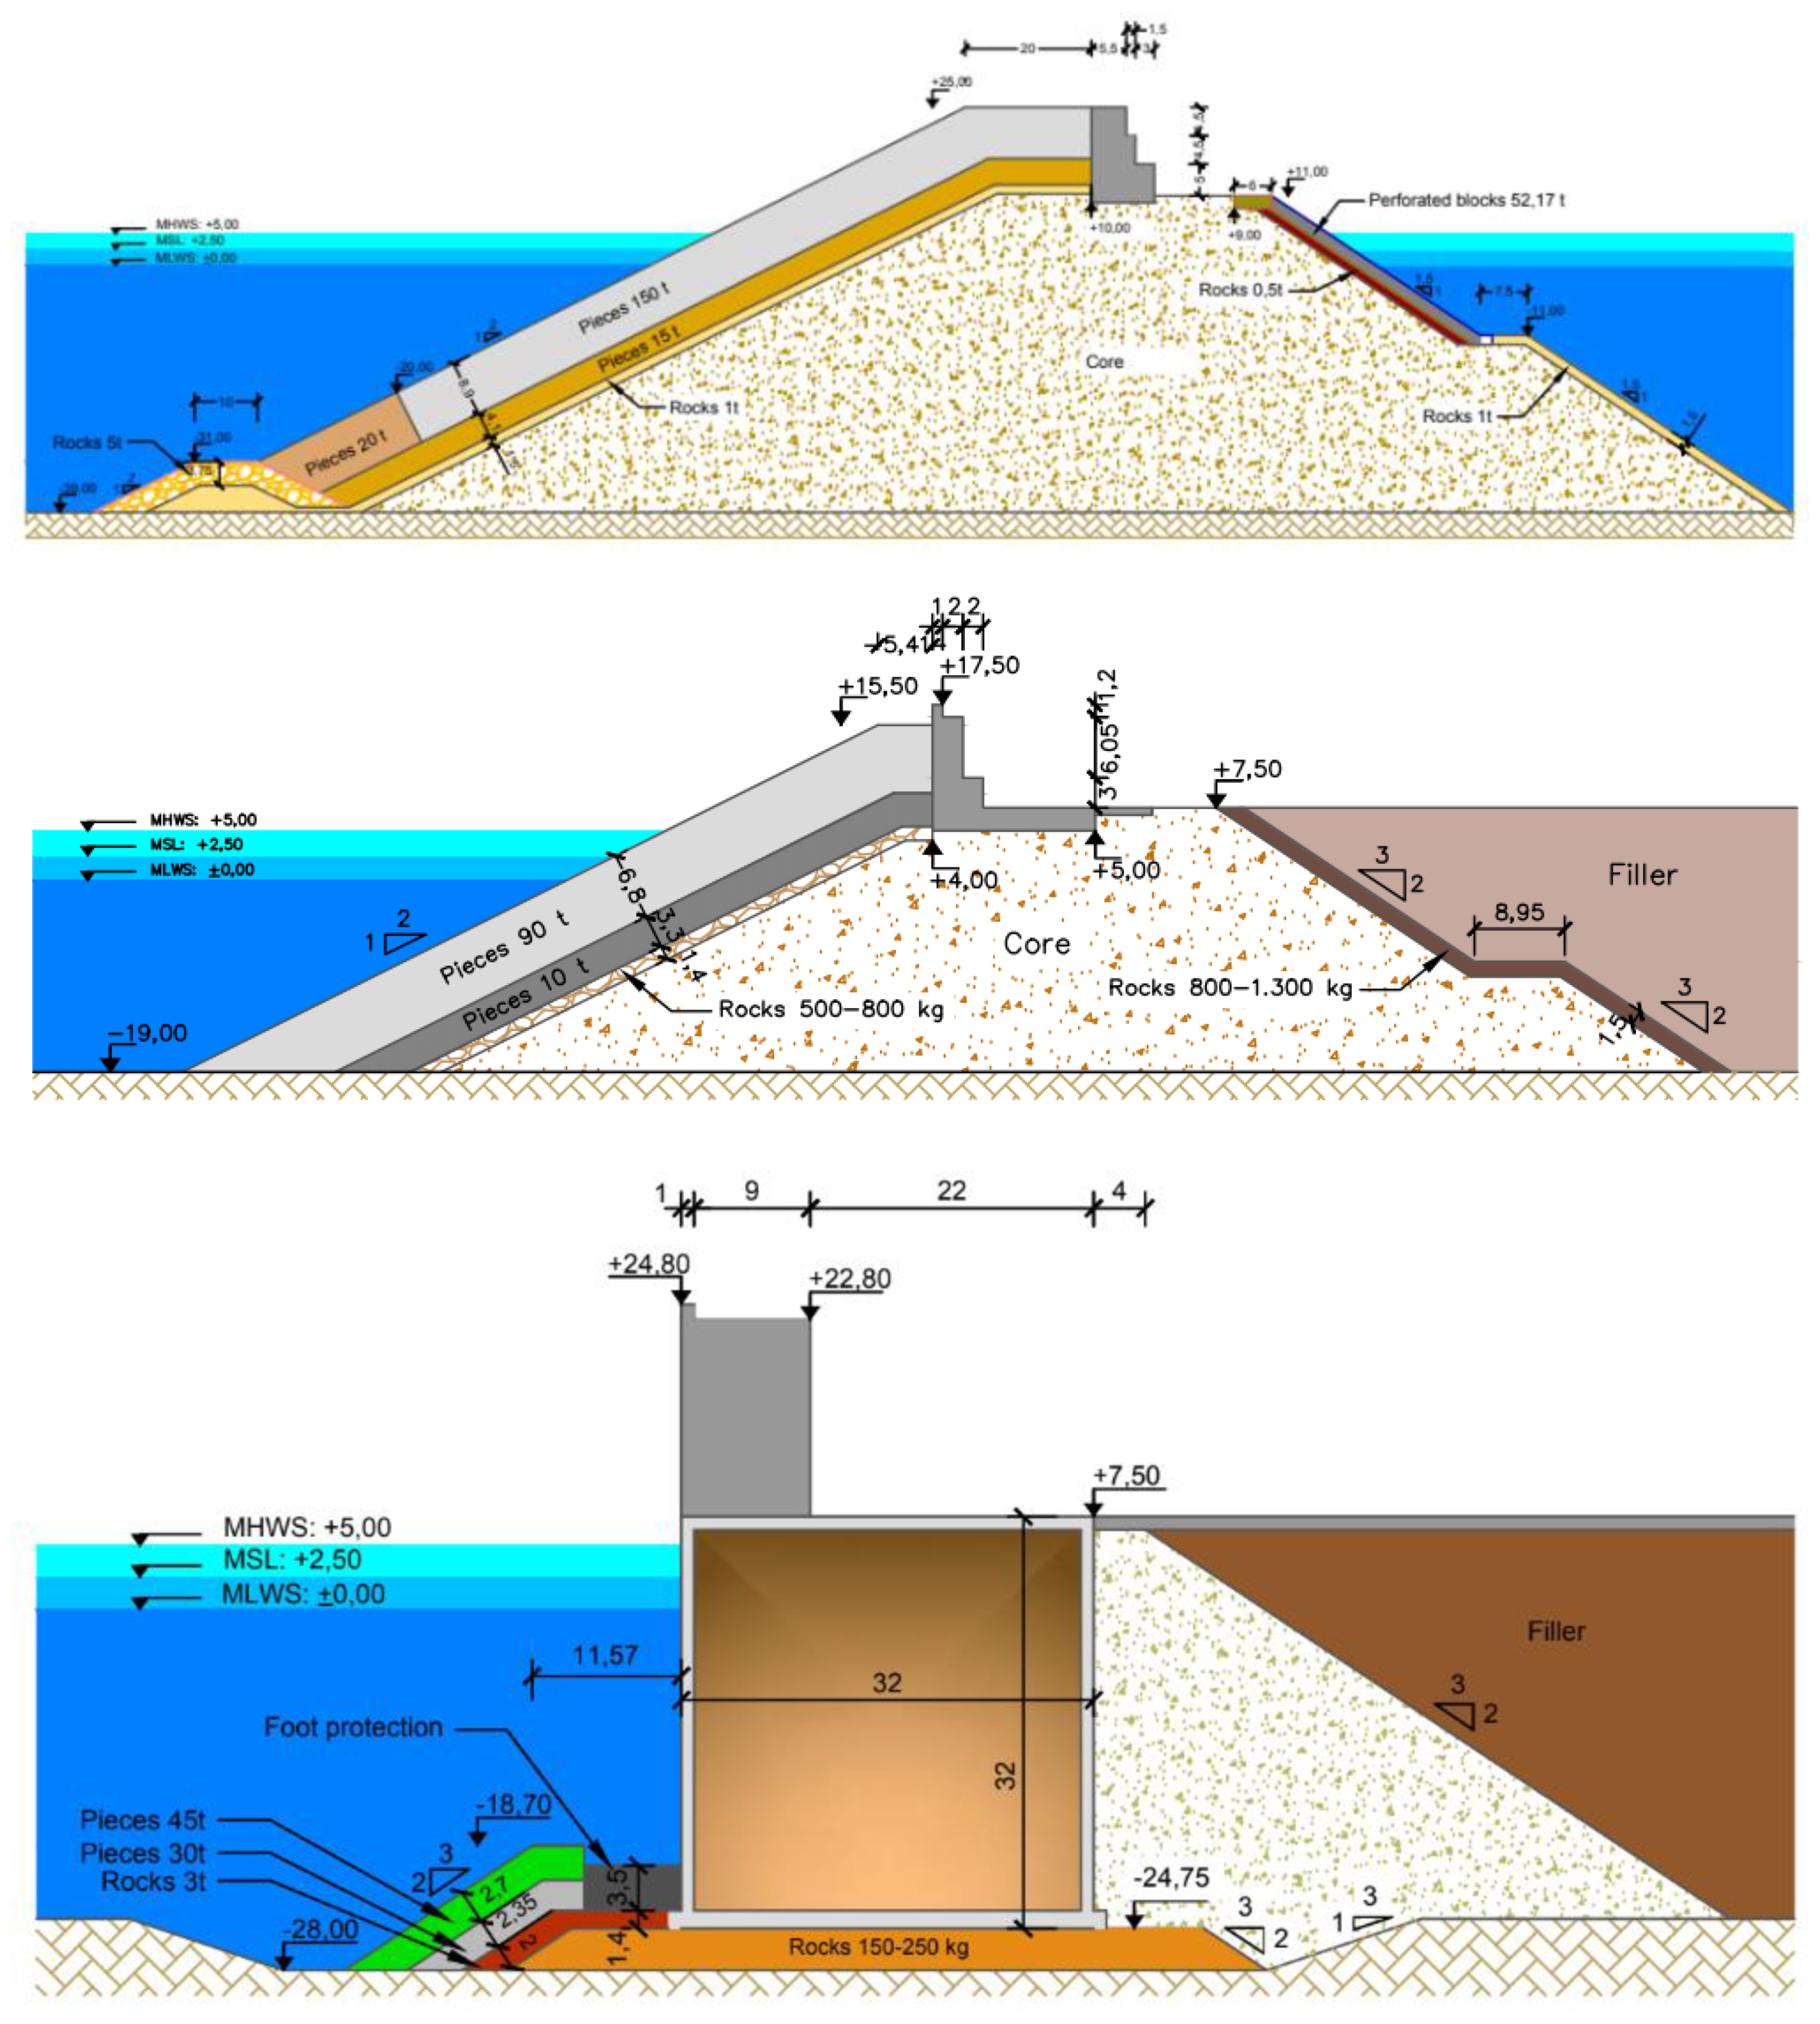
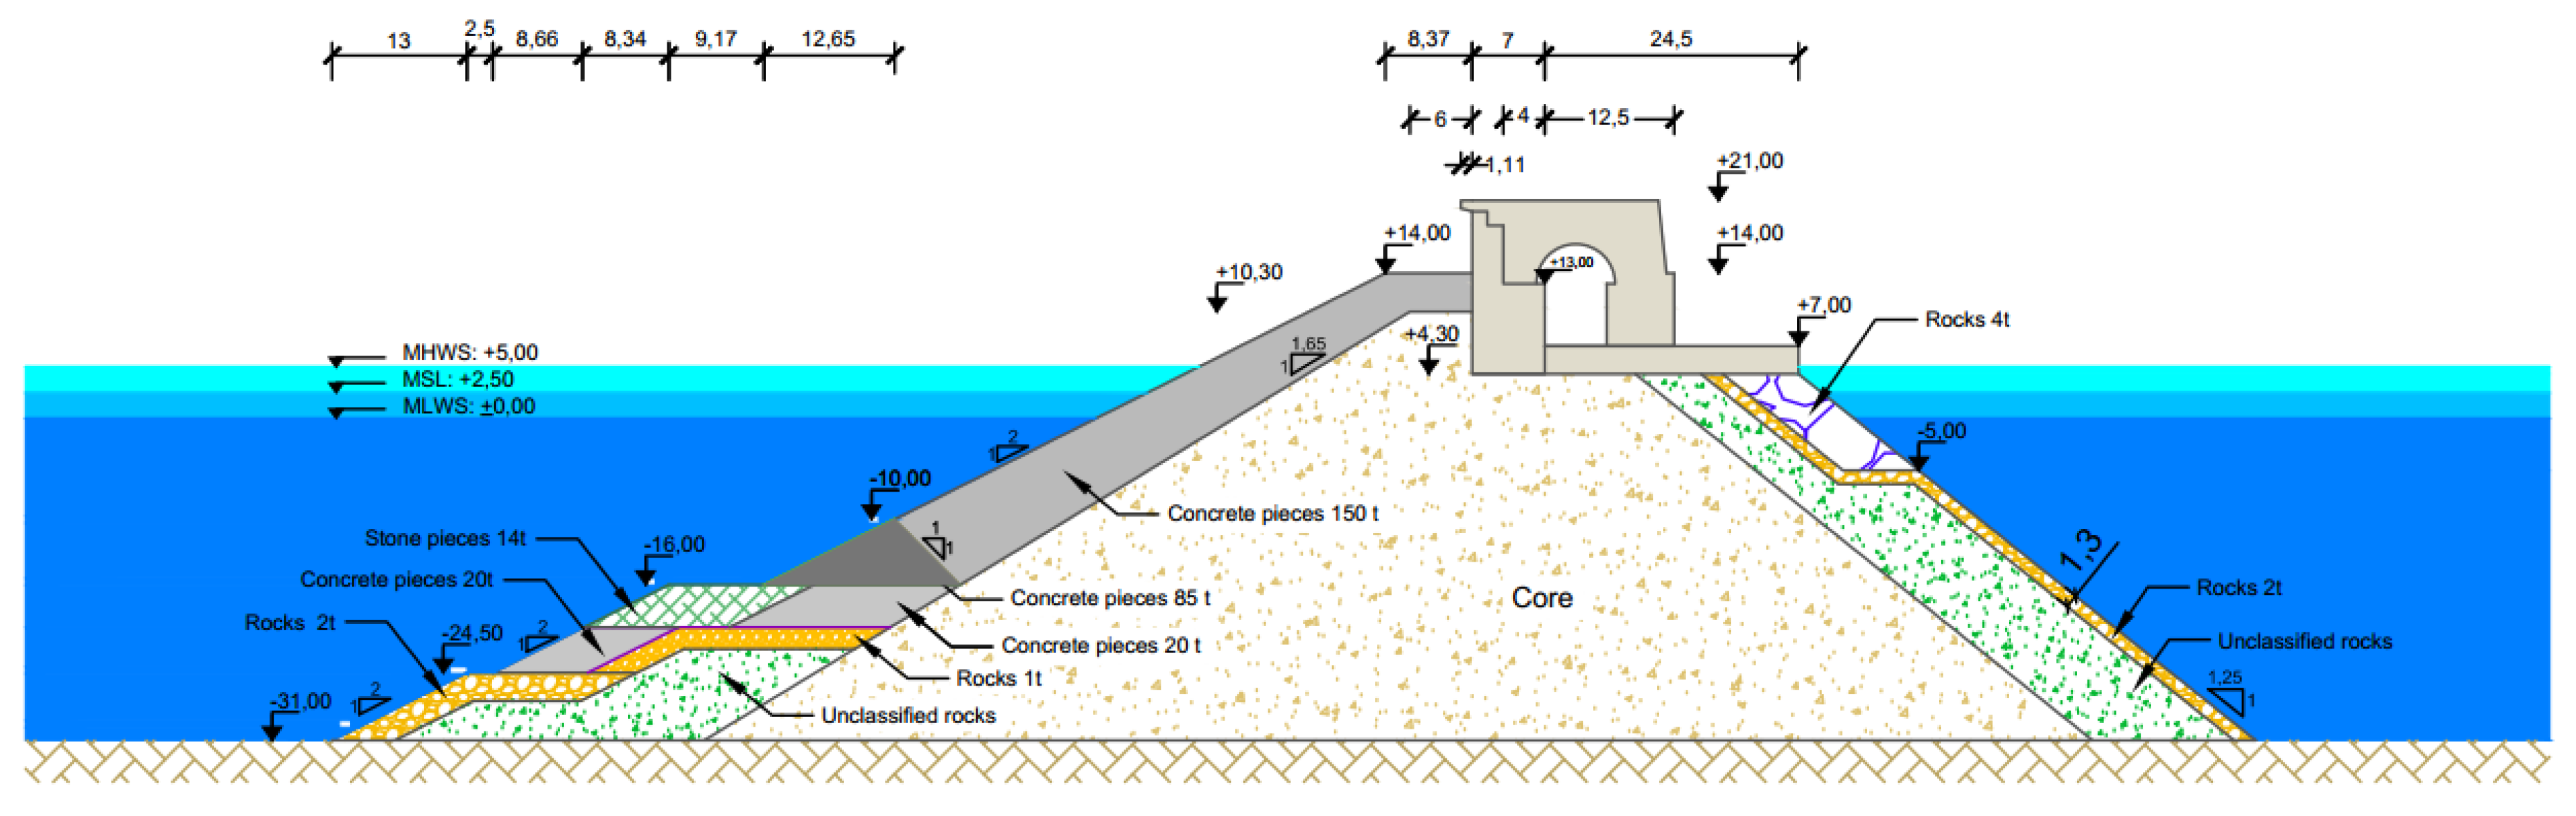
As can be seen in
Figure 5, Punta Langosteira is a rubble mound breakwater with concrete blocks in the armor layer around 150 tons [
9], with the top of the non-overtopping crown wall at +25.00 m. Torres is a rubble mound breakwater with concrete pieces in the armor layer around 90 tons, with the top of the non-overtopping crown wall at +17.50 m. Norte is a vertical breakwater with 32 × 52 × 32 m caissons, with the top of the crown wall at the same height as Torres breakwater. Punta Lucero is a rubble mound breakwater with concrete blocks in the armor layer around 150 tons, with the top of the non-overtopping crown wall at +21.00 m [
10]. The rest of characteristics of the four breakwaters can be seen in
Table 1.
Regarding the water depths in the breakwaters, it is 39 m in Punta Langosteira, 22 m in Torres, 30 m in Norte and 33 m in Punta Lucero. In terms of geology and geotechnics, Punta Langosteira is in a granitic terrain, with a density of 2.6 t/m3, compressive strength of 10,000 t/m2 and deformation modulus of 20,000 MPa; Torres and Norte is a in a quartzite soil, with a density of 2.6 t/m3, compressive strength of 10,000 t/m2 and deformation modulus of 20,000 MPa; Punta Lucero is in a soil composed of sand above a cayuela rock (limestone type), with a density of 2.4 t/m3, compressive strength of 5000 t/m2 and deformation modulus of 10,000 MPa.
Seismic analysis has been carried out according to the NCSE02 (Spanish Seismic Building Code 2002). The North coastal façade presents a seismic acceleration lower than 0.04 g (g is gravity acceleration) (see
Figure 6). According to that Technical Standard, normal or special seismic considerations have to be taken into account in the structural design when seismic acceleration is higher than 0.04 g. Concluding, the basis seismic acceleration is low, and therefore, that aspect can be considered out of the design.
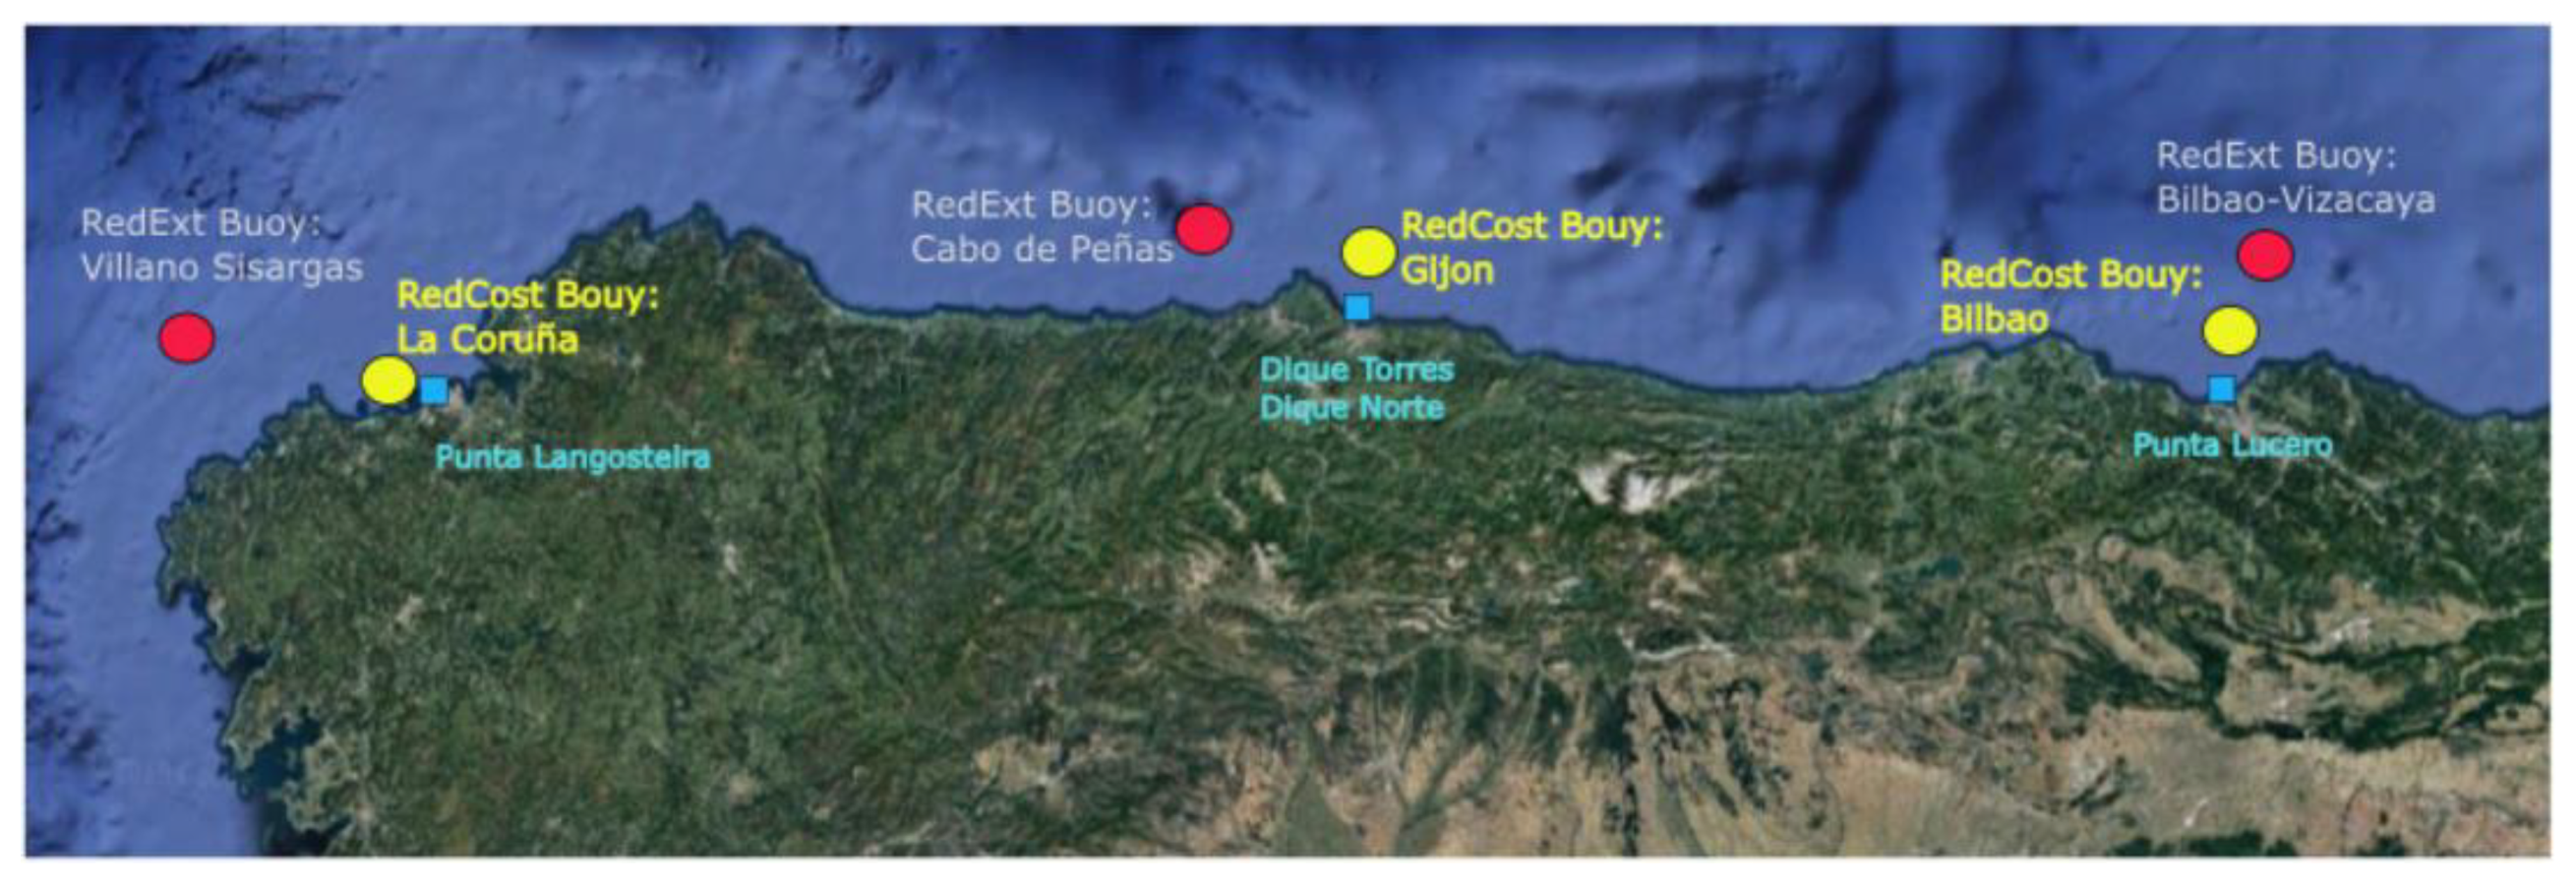
Meteocean conditions are key parameters that have an influence on the development of the energy resource analysis and on the design of the structural facilities. Thus, it is essential to consider the average and extreme regime of waves, as the first one is needed for the energy analysis, and the second one for the structural design. Three Spanish State Port buoys in deep water (REDEXT buoys) and shallow water (REDCOT buoys) have been used for the meteocean analysis: (1) A Coruña port: Villano Sisargas REDEXT buoy (depth: 386 m, installation date in 1998) [
11] and La Coruña REDCOST buoy (depth 50 m, installation date in 1982); (2) Gijon port: Cabo de Peñas REDEXT buoy (depth 615 m, installation date in 1997) [
12], and Gijón REDCOST buoy (depth 54 m, installation date in 2001); (3) Bilbao port: Bilbao-Vizcaya buoy (depth 600 m, installation date in 1990) [
13], and Bilbao REDCOST buoy (depth 50 m, installation date in 2004). REDEXT buoys are located in deep waters, with h/L > 1/2, where h is the water depth in the buoy and L is the wave length. REDCOST are located in transitional waters, with 1/20 < h/L < 1/2 (see
Figure 7).
Regarding the extreme regime, Punta Langosteira counts with significant wave height 15 m, period wave period 20 s and medium wave period 16 s; Torres and Norte have significant wave height 9.5 m, period wave period 18 s and medium wave period 14.75 s; Punta Lucero counts with significant wave height 12.5 m, period wave period 18 s and medium wave period 13.85 s. Tides are semidiurnal, with ranges around 5 m in the three ports.
5. Hydraulic and Energetic Behavior
Extensive investigation on wave energy converters that convert wave power into electricity is required to improve competitiveness of wave energy, one of the most promising renewable energy resources [
14].
To study the hydraulic-energetic behavior, the first step is to select the types of wave energy converters that best suit the needs of the project. Given the high interest of harnessing wave energy, there are more than a hundred patents for wave energy converters [
15]. However, only 20 of these devices have become prototypes in scale since, in general, the necessary maturity level had not been reached until recently. To determine what technology is the most appropriate, an analysis was carried out based on the different classifications of existing wave energy converters.
Among those conditions, robust and fixed structures are being considered in this study, as it is necessary to look at their survival, taking into account the high aggressiveness of the wave climate where they will be installed, and consequently, their gradual degradation. It is important to keep in mind that the main objective is to achieve the maximum possible electricity output, taking advantage of opportunities that may arise in the use of the existing breakwaters for the installation of the devices. It is worth pointing out the importance of the devices in not impeding the traffic inside and outside the port water surface as well as in preventing the occupation of the seabed. Based on these facts, the OWC system (Oscillating Water Column) and SSG (Sea Slot-Cone Wave Energy Converter) are the ones that best adapt to these requirements (see
Figure 8). The OWC system seems successful because it can be constructed in the breakwater, it does not involve seabed invasion and it does not decrease functionality [
16]. Furthermore, it has few moving and emerging parts; thus implying a lower maintenance cost. The SSG System is also appropriate as it can be installed in the breakwater without impeding the regular port traffic. It is characterized by its robustness and low cost [
17].
By subjecting any structure to the action of the waves, it is subjected to incident energy. That wave energy can be reflected, absorbed or transmitted according to the physical characteristics of the obstacle (size, shape, material and permeability) as well as its location.
Taking into account that the wave energy converter is planned to be installed in the breakwater, it is essential to know the typology of the breakwater to determine the effectiveness of the device [
18,
19,
20]. In the case of rubble mound breakwaters, there are holes between the different pieces or the armor and the filters, which allow the entrance of the water, resulting in a transmission of energy through the different layers. There is also a process of small reflection, because it is a rock mass. In addition, there is a part of the energy that is dissipated or absorbed in the slope of the rubble mound breakwater. Thus, in that type of breakwater, the absorption is high, the transmission is average and the reflection is very low.
In the case of vertical breakwaters, as they are formed by concrete caissons, a reflection of the waves is produced when the wave impacts the structure, which means that the wave energy returns back to the sea in different directions. Absorption coefficient depends primarily on the porosity of concrete. Thus, the reflection is the most important phenomenon, while the transmission and the absorption are very low.
OWC devices have the same energy behavior as a vertical breakwater because they are caissons with a reflective wall, after which accumulates the column of oscillating water [
21]. Similarly, reflection of waves is the main process for SSGs and it can be claimed that they contribute to the correct functioning of the device.
The existence of some front plates in those structures responds to the need for great heights of waves run-up, which is resolved with higher slopes to favor wave breaks surging type that dissipate low amount of energy. However, high reflection rates could affect the stability of the structure, in case that it is placed on a sandy bottom, which will be avoided with adequate protection at the foot of the structure [
17].
Based on the needs of integrating both wave energy converters into a part of the breakwaters, it is proposed to use SSG only in the rubble mound breakwaters and OWC in both rubble mound and vertical breakwater, as shown in
Table 2.
In order to know the amount of energy that the wave energy converters are capable of generating, the availability of the wave energy resource in the study areas has been analyzed.
The wave energy converter must be coupled to a breakwater to improve its efficiency; as previously mentioned, the three most important breakwater of the Spanish North coast were selected.
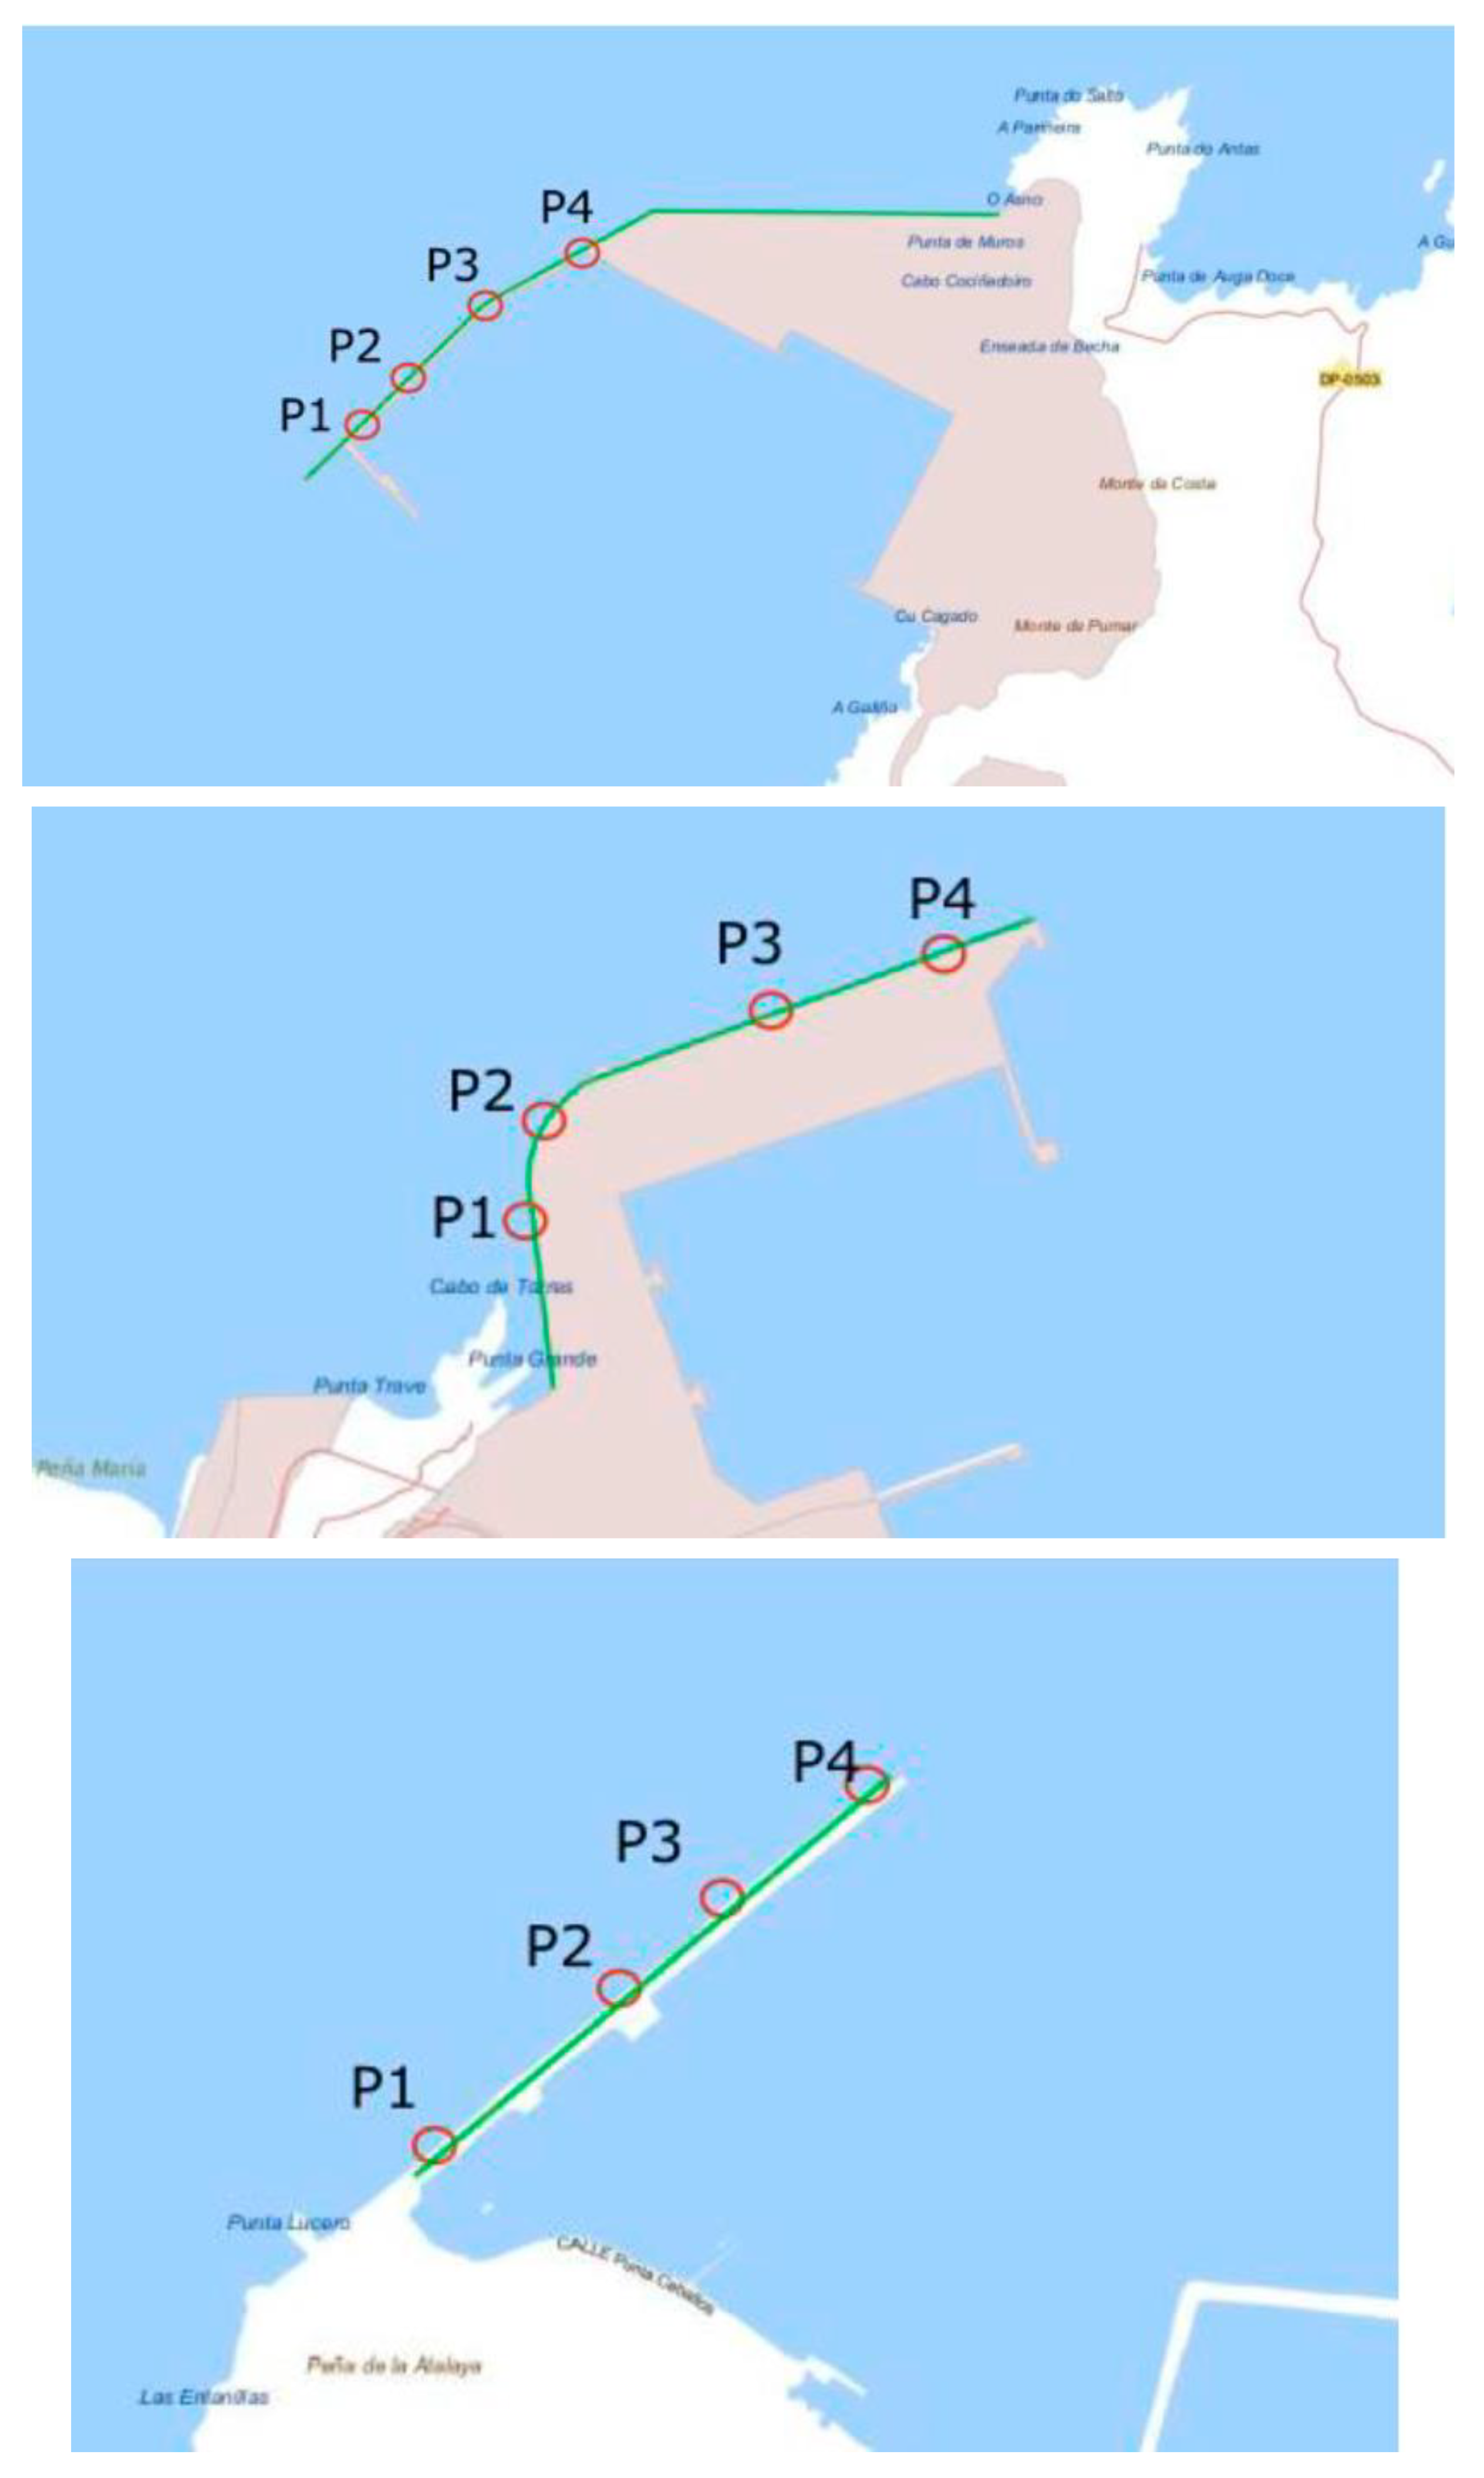
To select the optimal location of the device in the breakwater the following aspects were taken into account: (1) to avoid problems in the maneuverability of approaching ships to the port that may be affected by the reflection of the waves upon impact with the device that can affect navigation at the entrance and exit to the port; (2) to choose straight sections in the dike that have better orientation regarding to the predominant wave directions; (3) adequate depths that are not affected by irregularities in the bathymetry producing shoaling effects or breaks of waves.
In the three ports, four different points have been studied to make an energy assessment to be able to locate the facility in the place of maximum energy available (see
Figure 9 and
Table 3).
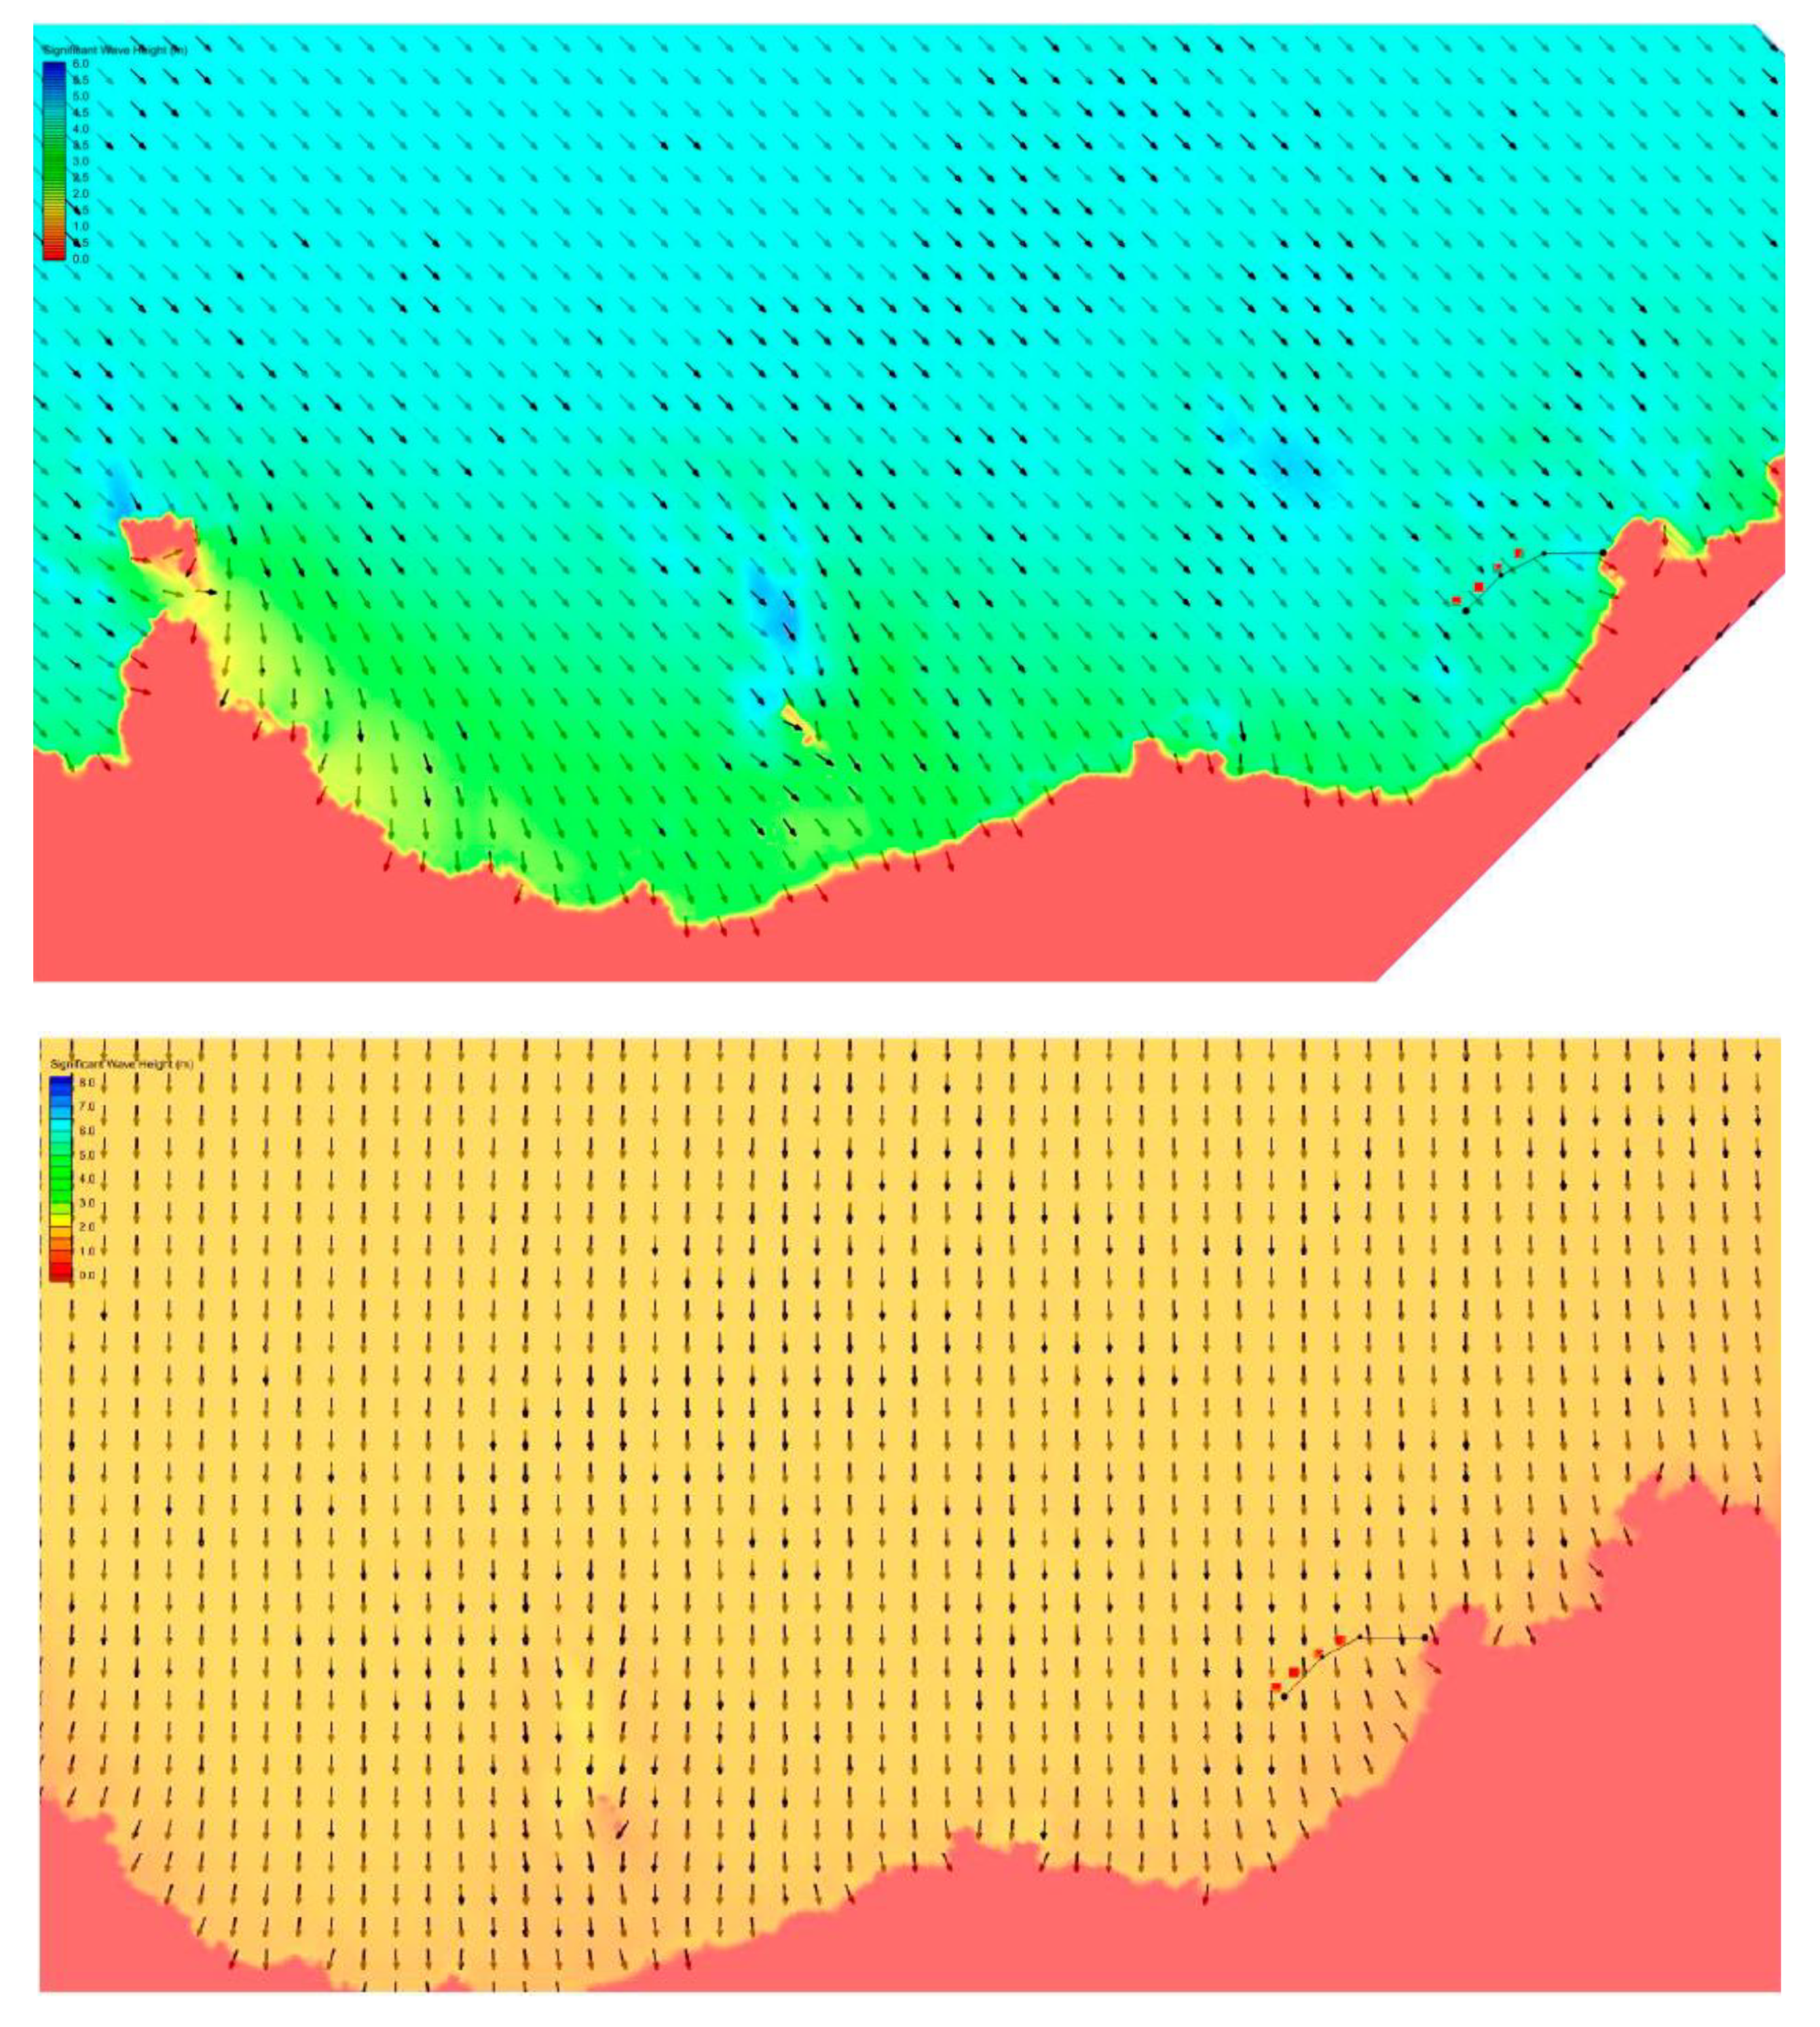
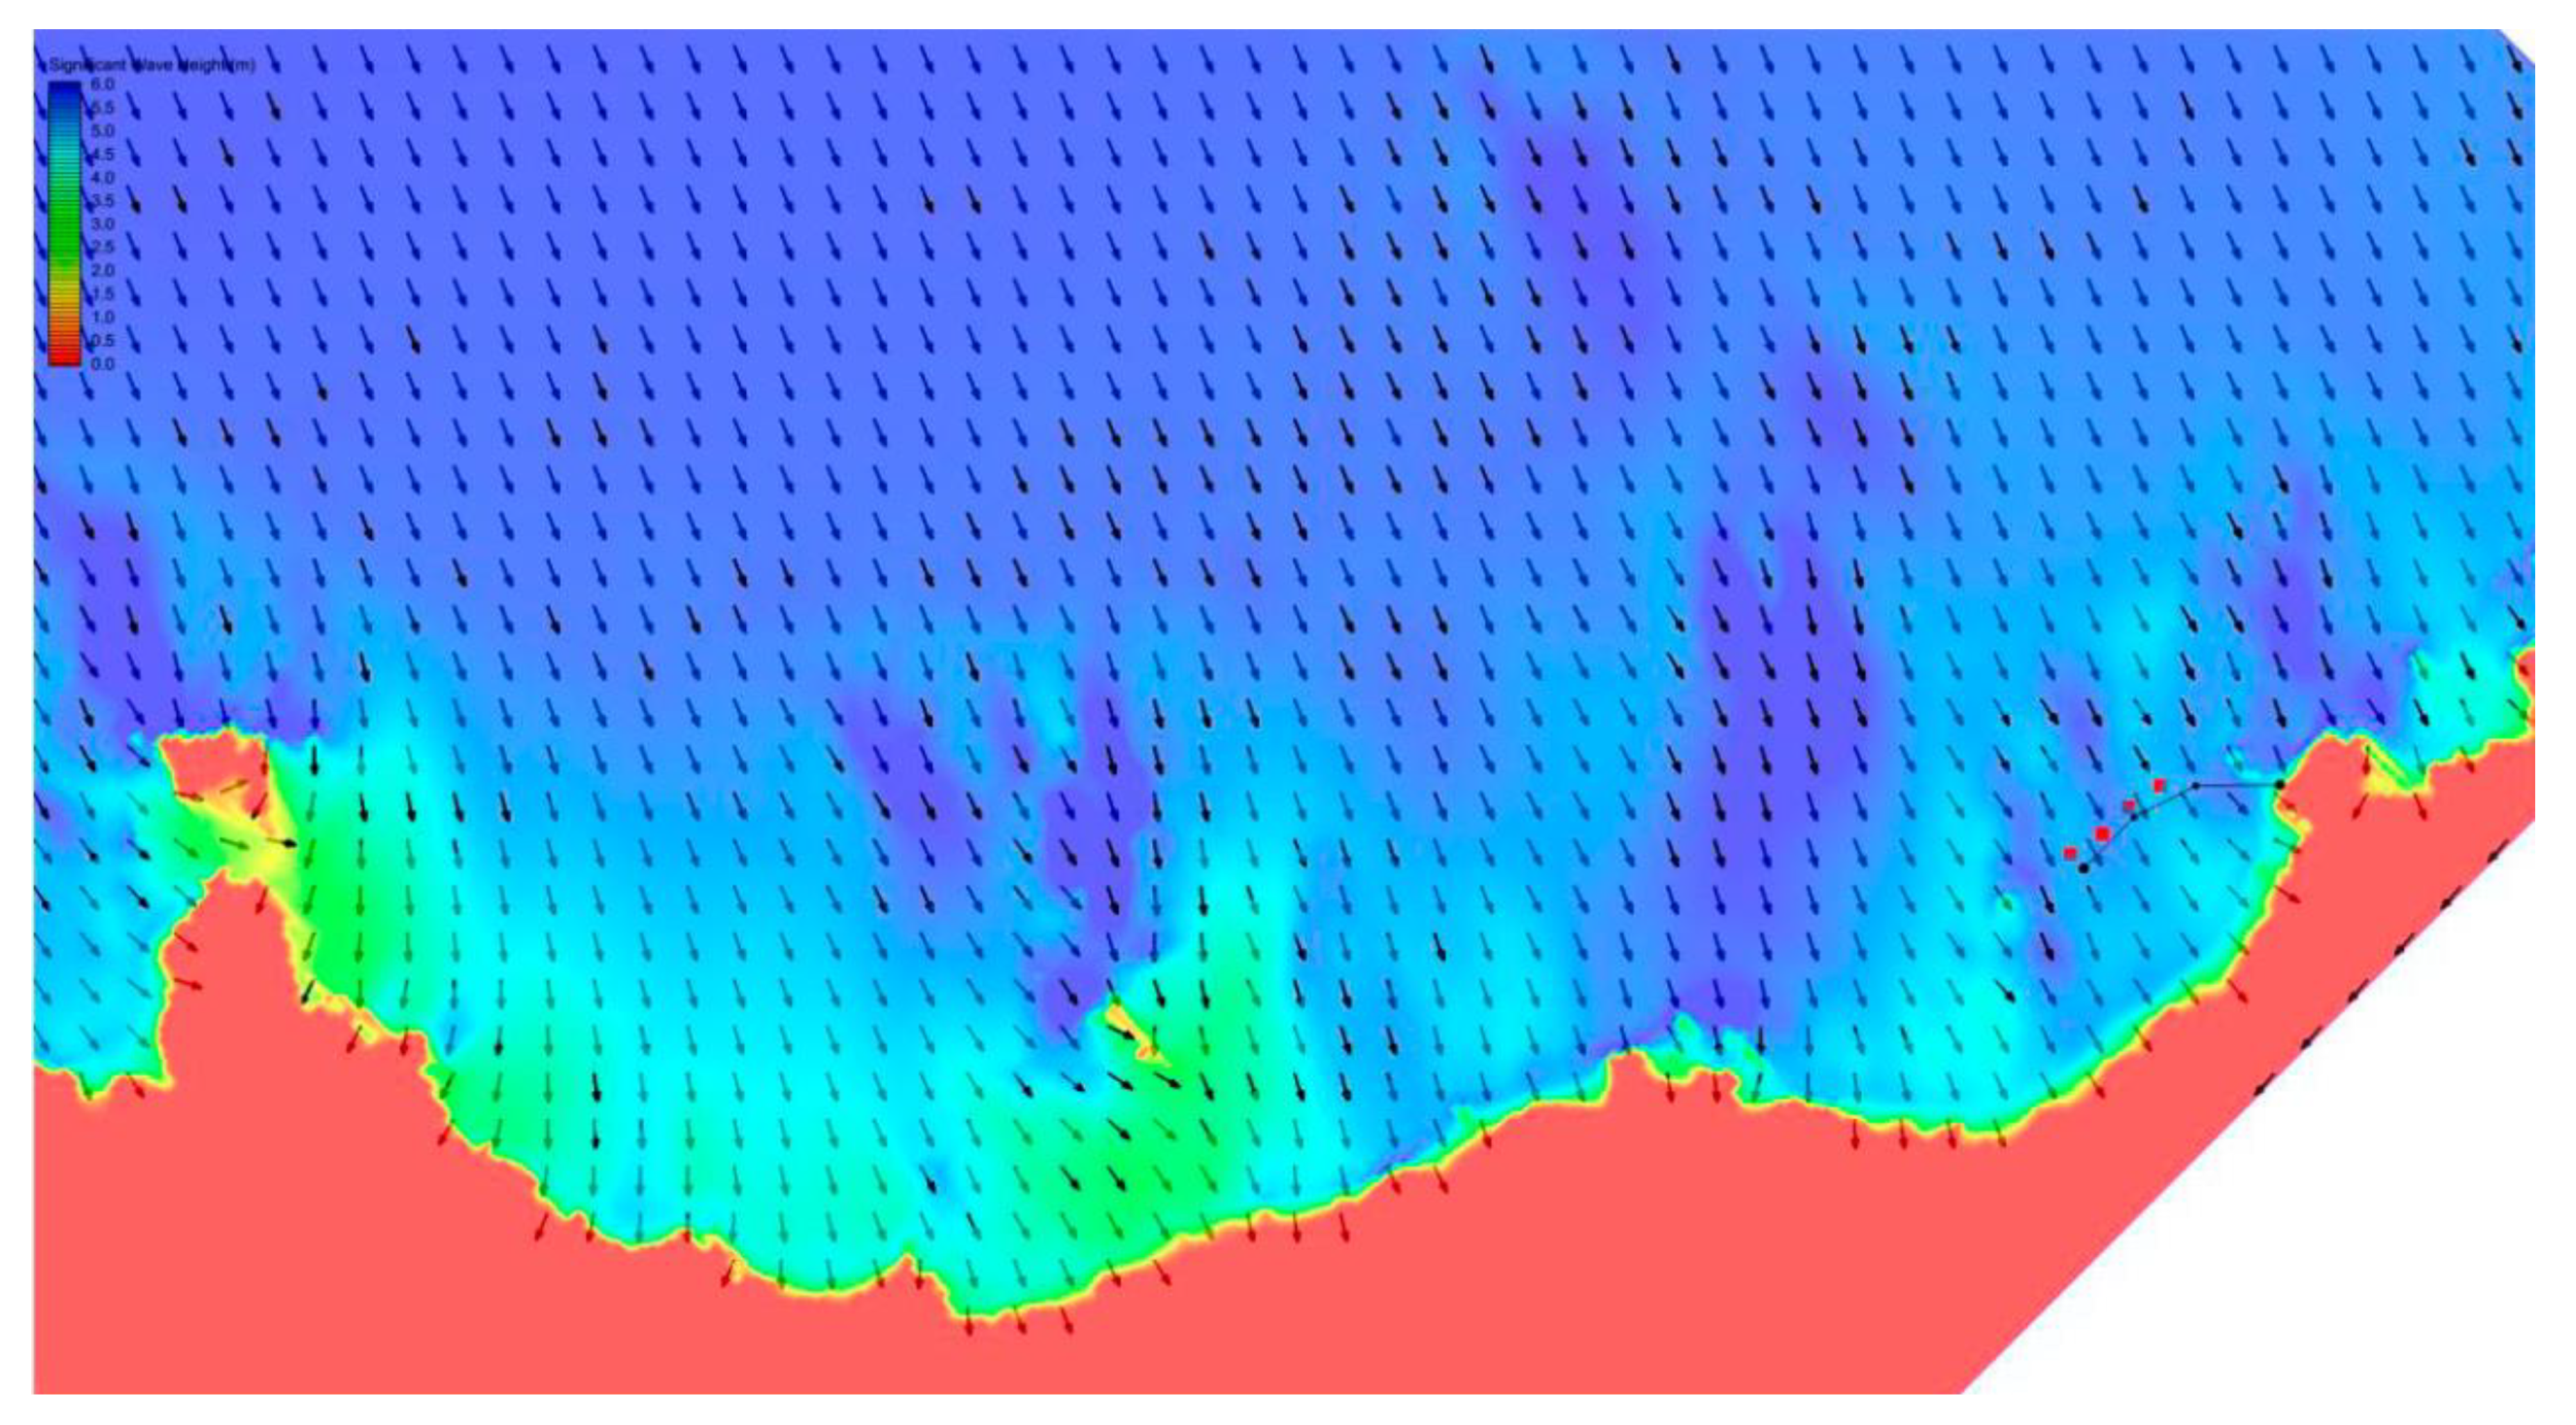
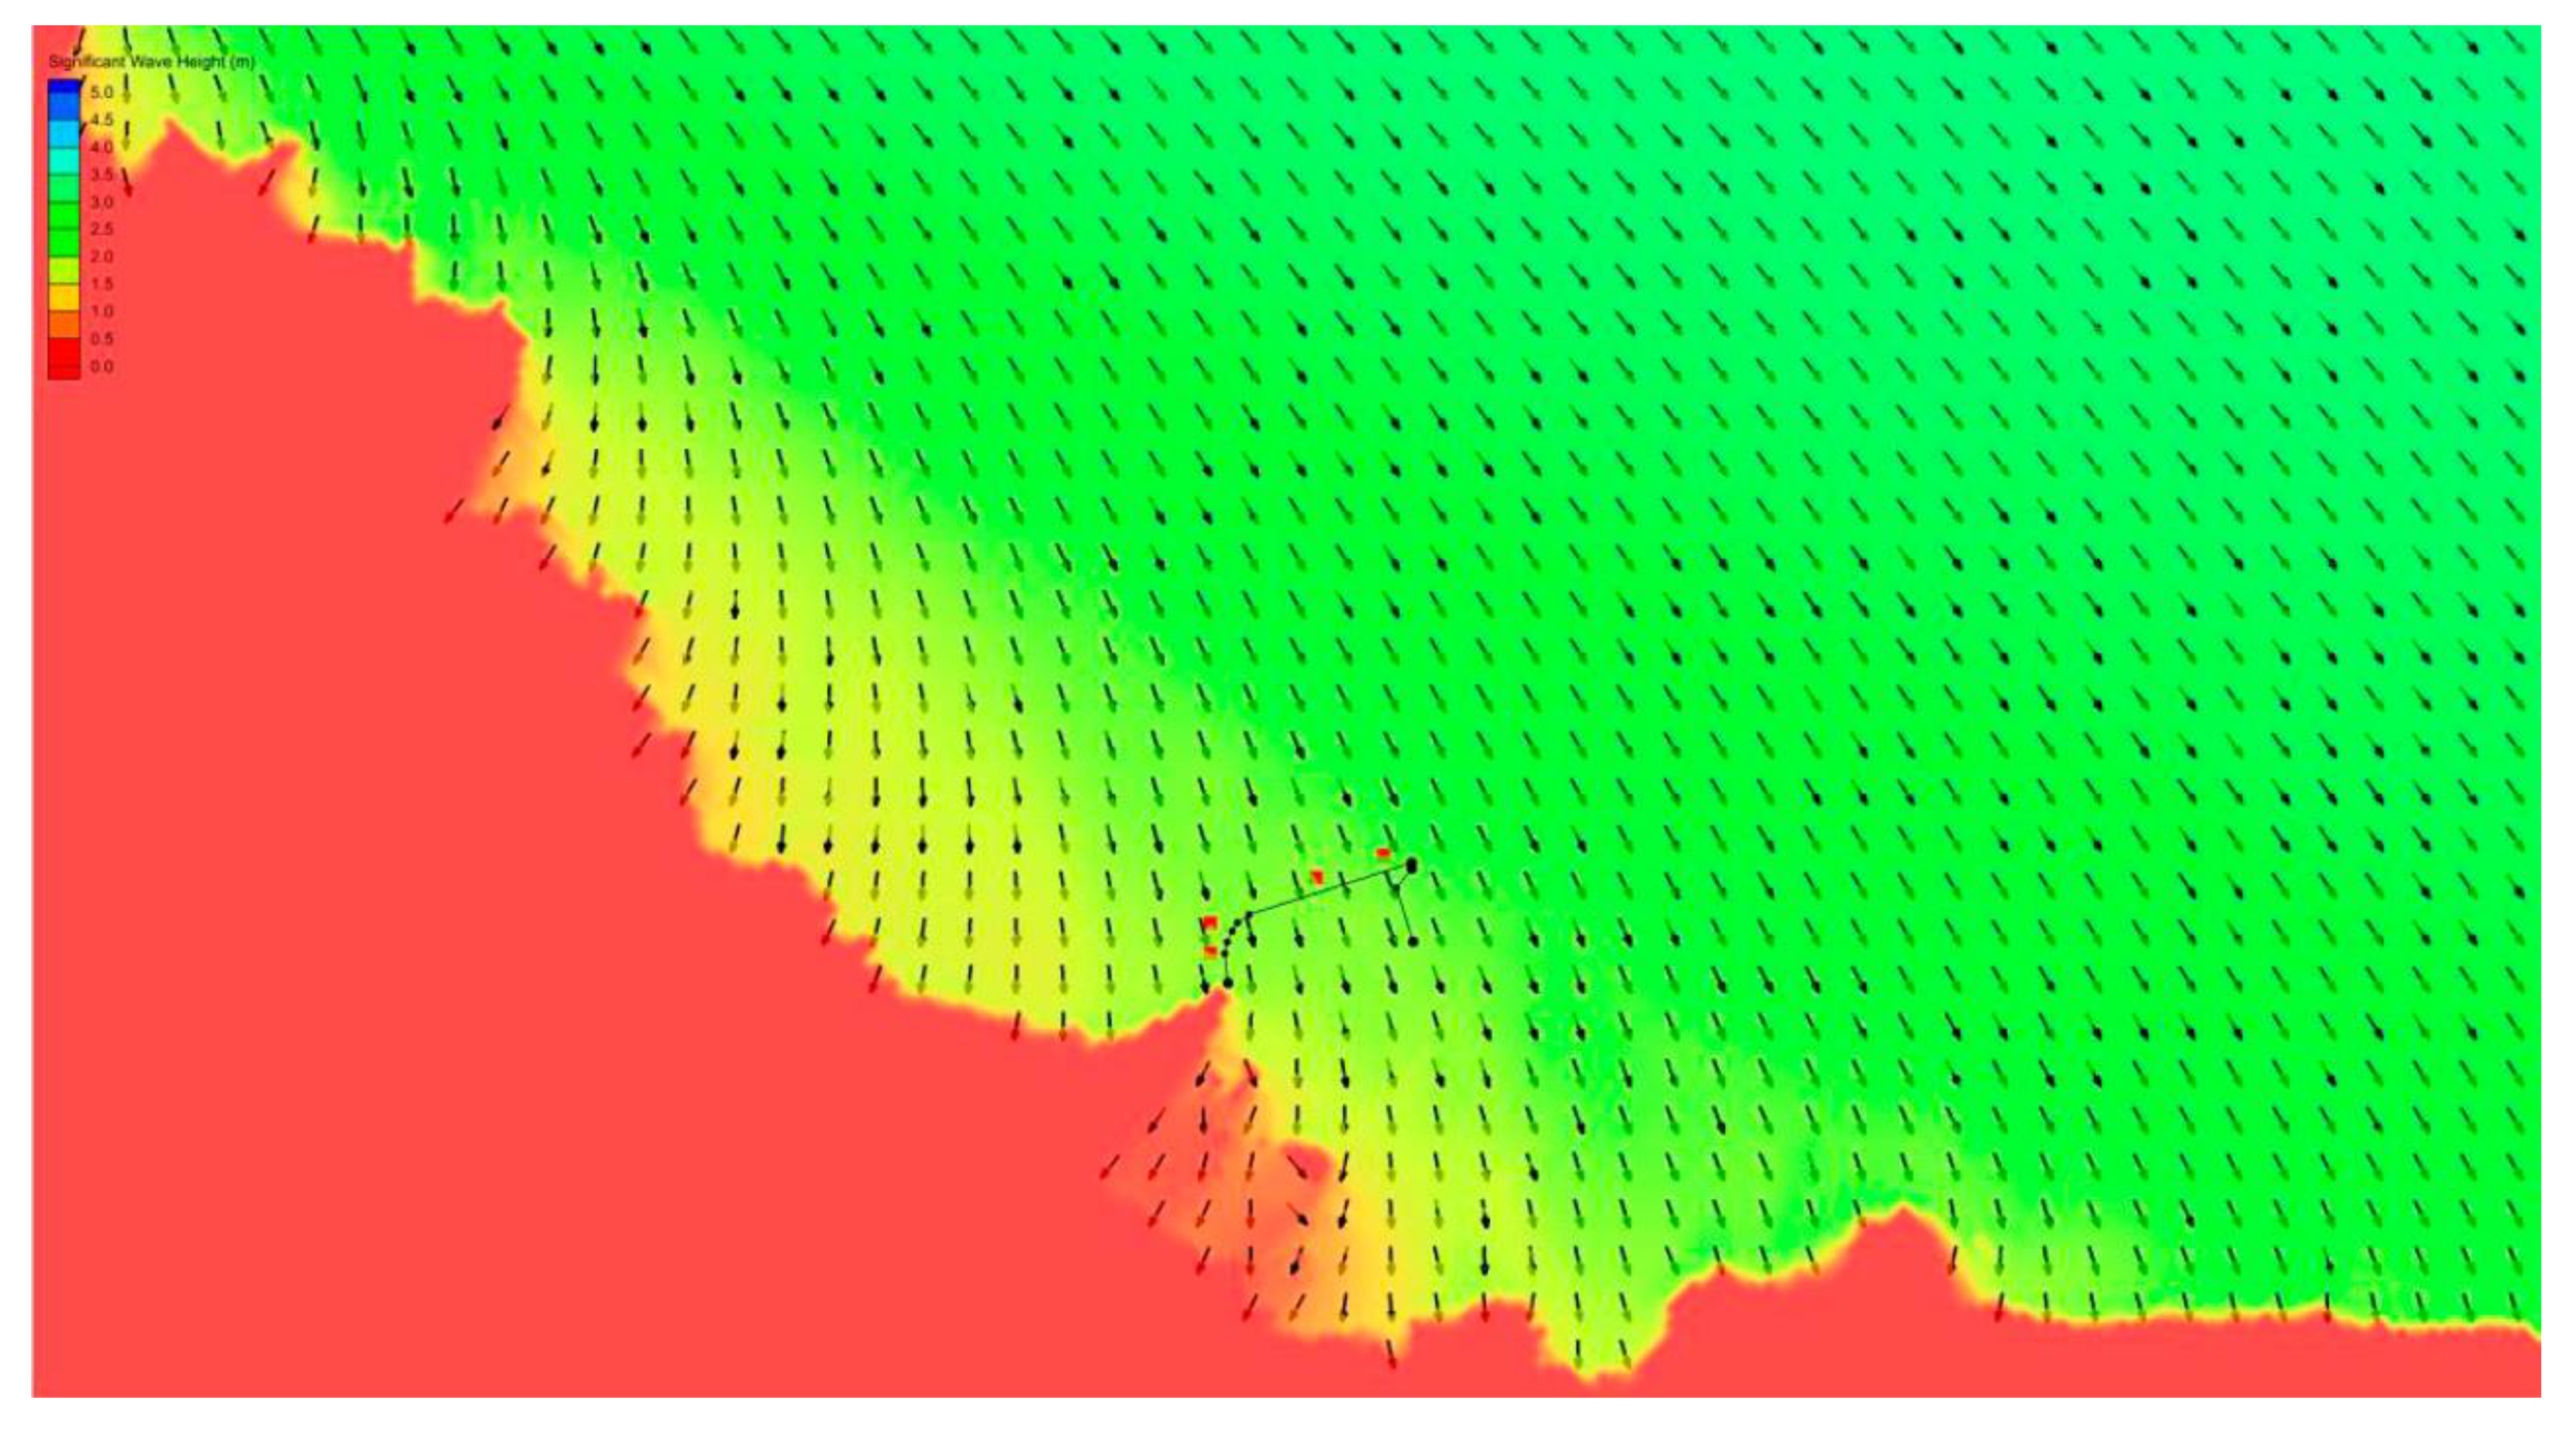
A characterization of the maritime climate at these points is required, and to do this, the CMS Wave software was used to carry out the wave propagation from deep waters (data from Puertos del Estado buoys) to objective points. In the last years, several research studies have been performed to assess and to improve the performance of the wave energy converters, using numerical simulations as the first step [
22].
CMS Wave was used in this study to make the propagation of the sea states from deep waters to shallow waters, as a propagation number model. It is a component of the Coastal Modeling System developed by the US Army Corps of Engineers Coastal and Hydraulics Laboratory. CMS-Wave is a two-dimensional wave spectral transformation model that employs a forward-marching, finite-difference method to solve the wave action conservation equation. It is a phase-averaged model, which neglects changes in the wave phase in calculating wave and other nearshore processes from the output wave information. CMS-Wave contains theoretically developed approximations for both wave diffraction and reflection and, therefore, is suitable for conducting wave simulations at coastal inlets. The model operates on a coastal half-plane, thus, primary waves can propagate only from the seaward boundary toward shore. If the seaward reflection option is activated, the model will also perform backward marching for seaward reflection after the forwarding-marching calculation is completed [
23]. For the energy assessment, the average wave regime was used, and wave propagations of different significant wave height(Hs)—peak wave period combinations (known as Hs-Tp) were carried out. Some criteria were followed for the numerical model: (1) the number of weather states must be limited to cover the wave energy contribution diagram as best as possible. Combinations of Hs-Tp and Hs-direction that together exceed the 80% occurrence were chosen; (2) the contribution of wave energy from each state of the sea must be between 5 and 25% of the total, while it must have a probability of occurrence of at least the 0.5% of the time; (3) for the estimation of the annual energy production, there is no need to include extremely small waves, even if they occur with frequency, or extremely large wave conditions. The latter generally rarely occur, as they will not contribute significantly to the annual energy production; this is due to its low contribution to the energy of low waves (characterized by a low probability of occurrence or low wave power level) and a marine energy converter has a performance reduction in wave undulating conditions predominant, since its size and performance are normally not optimized for them.
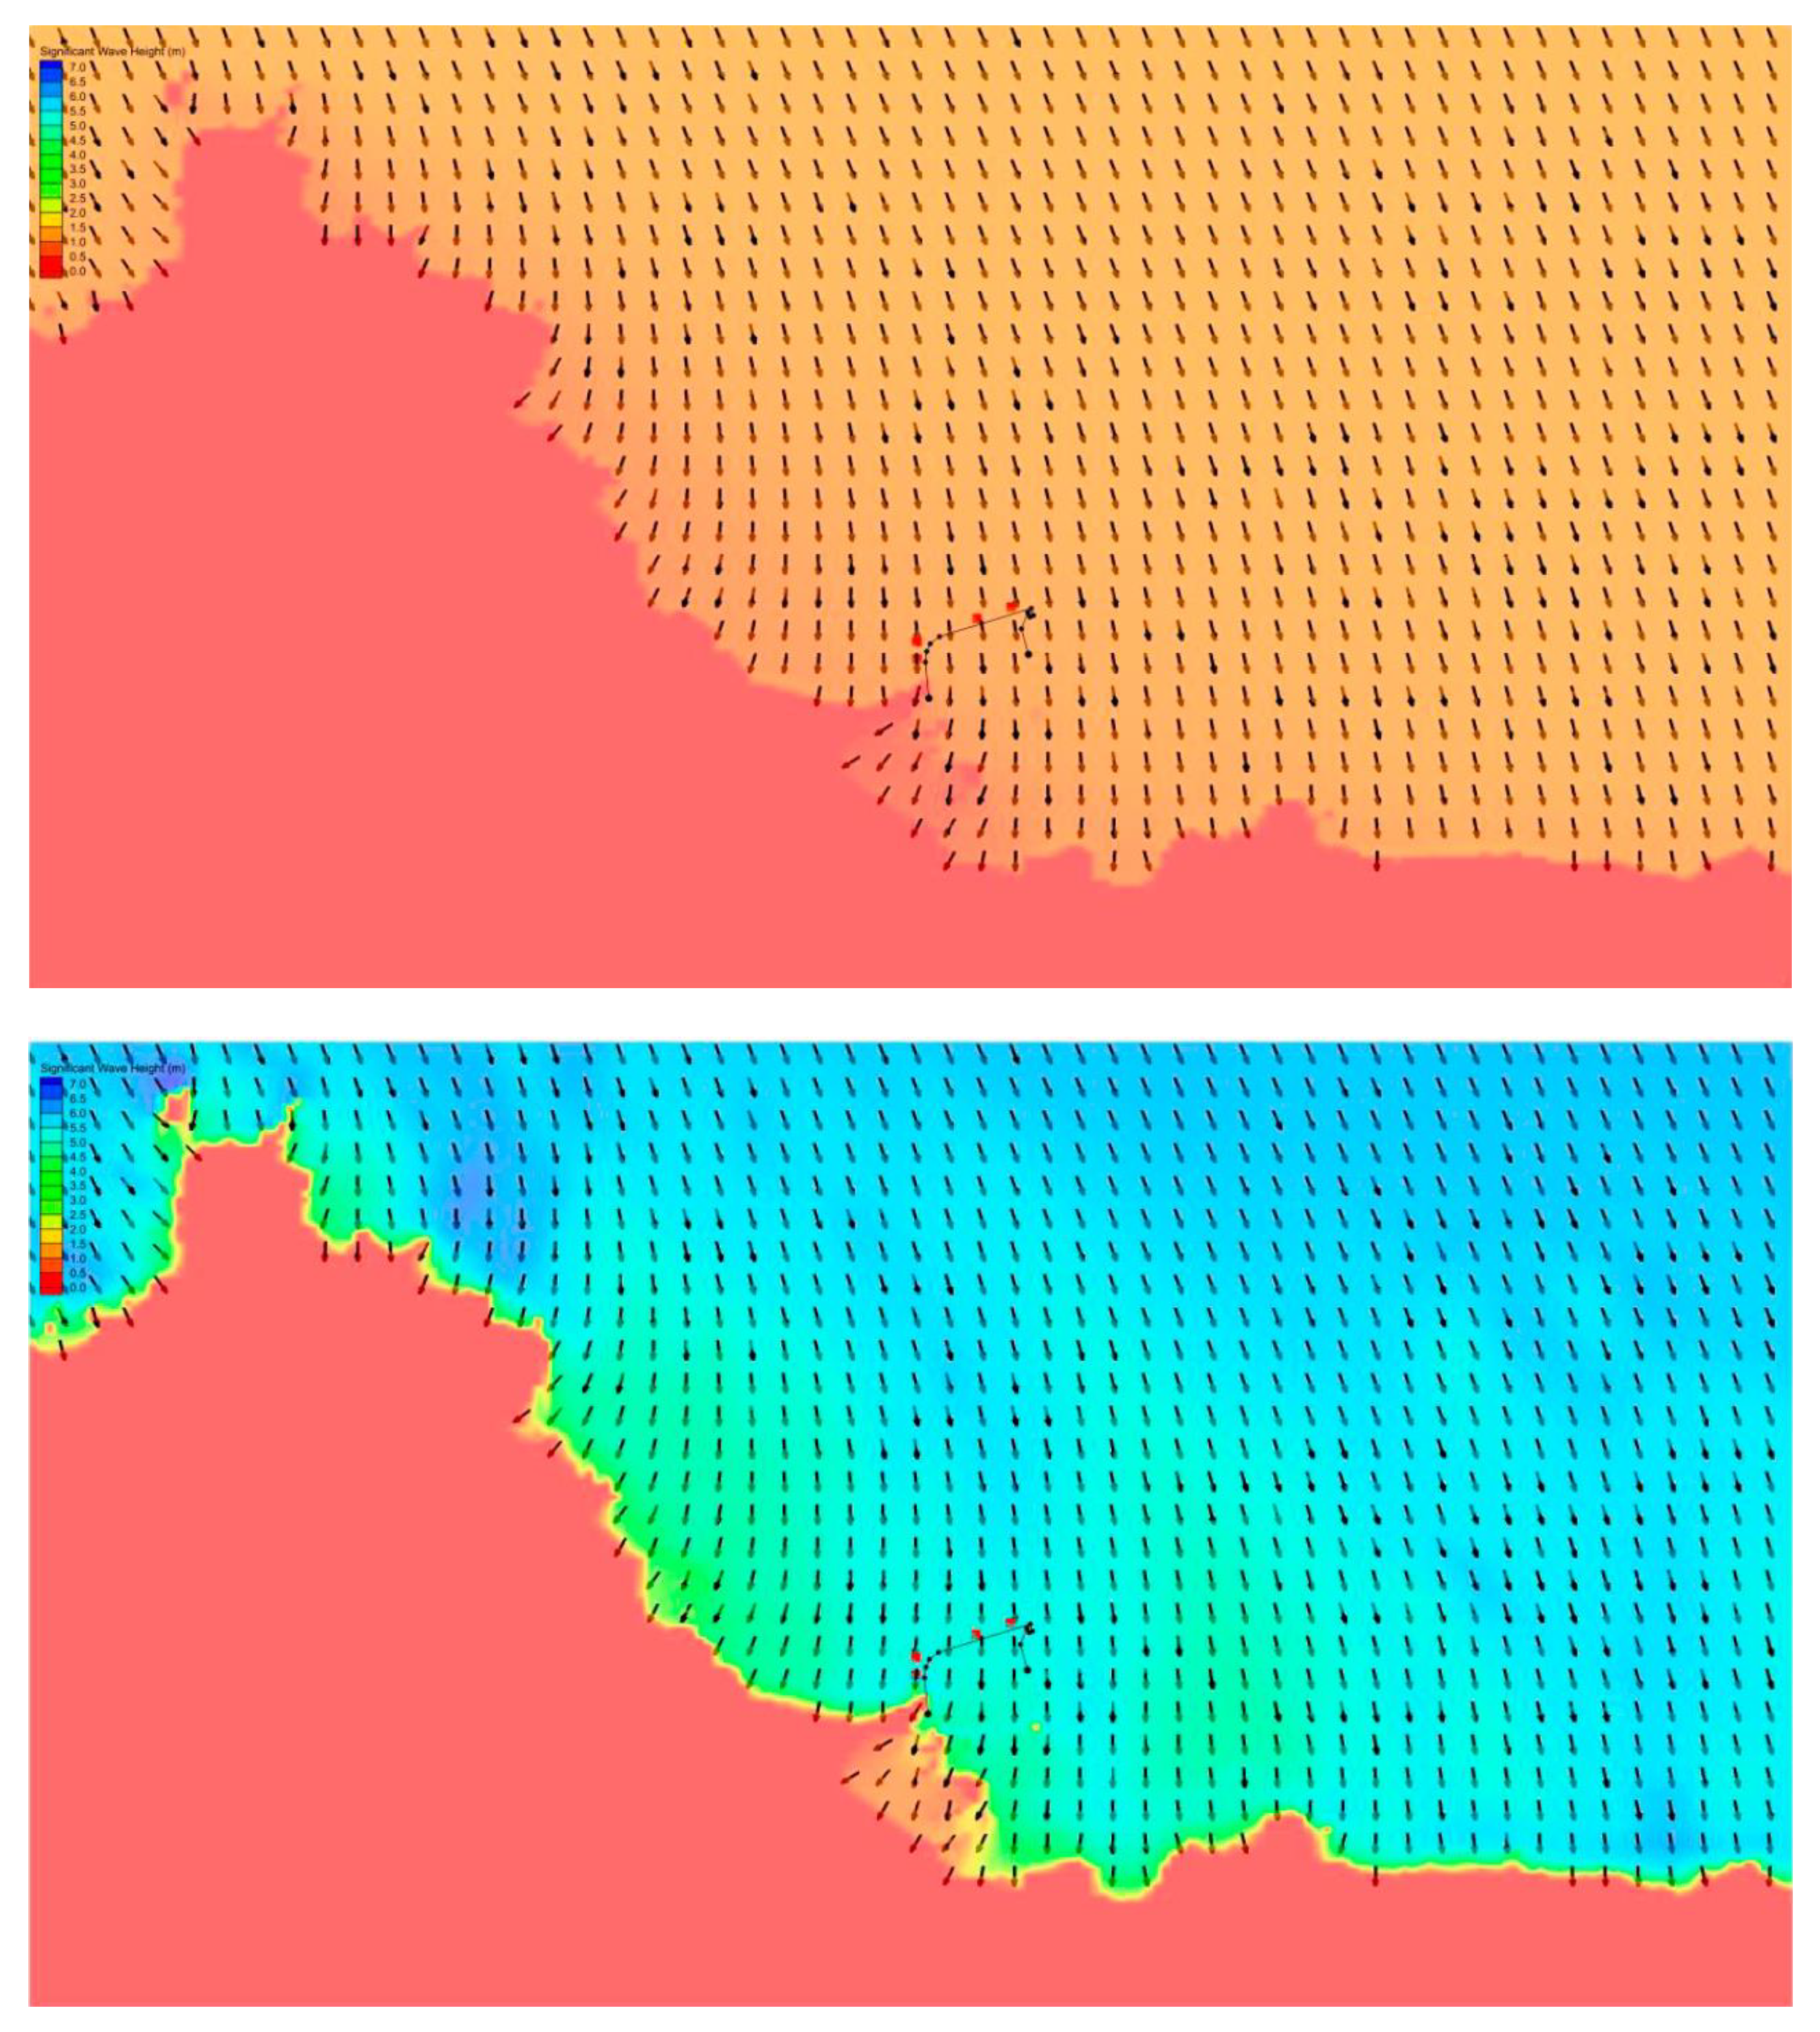
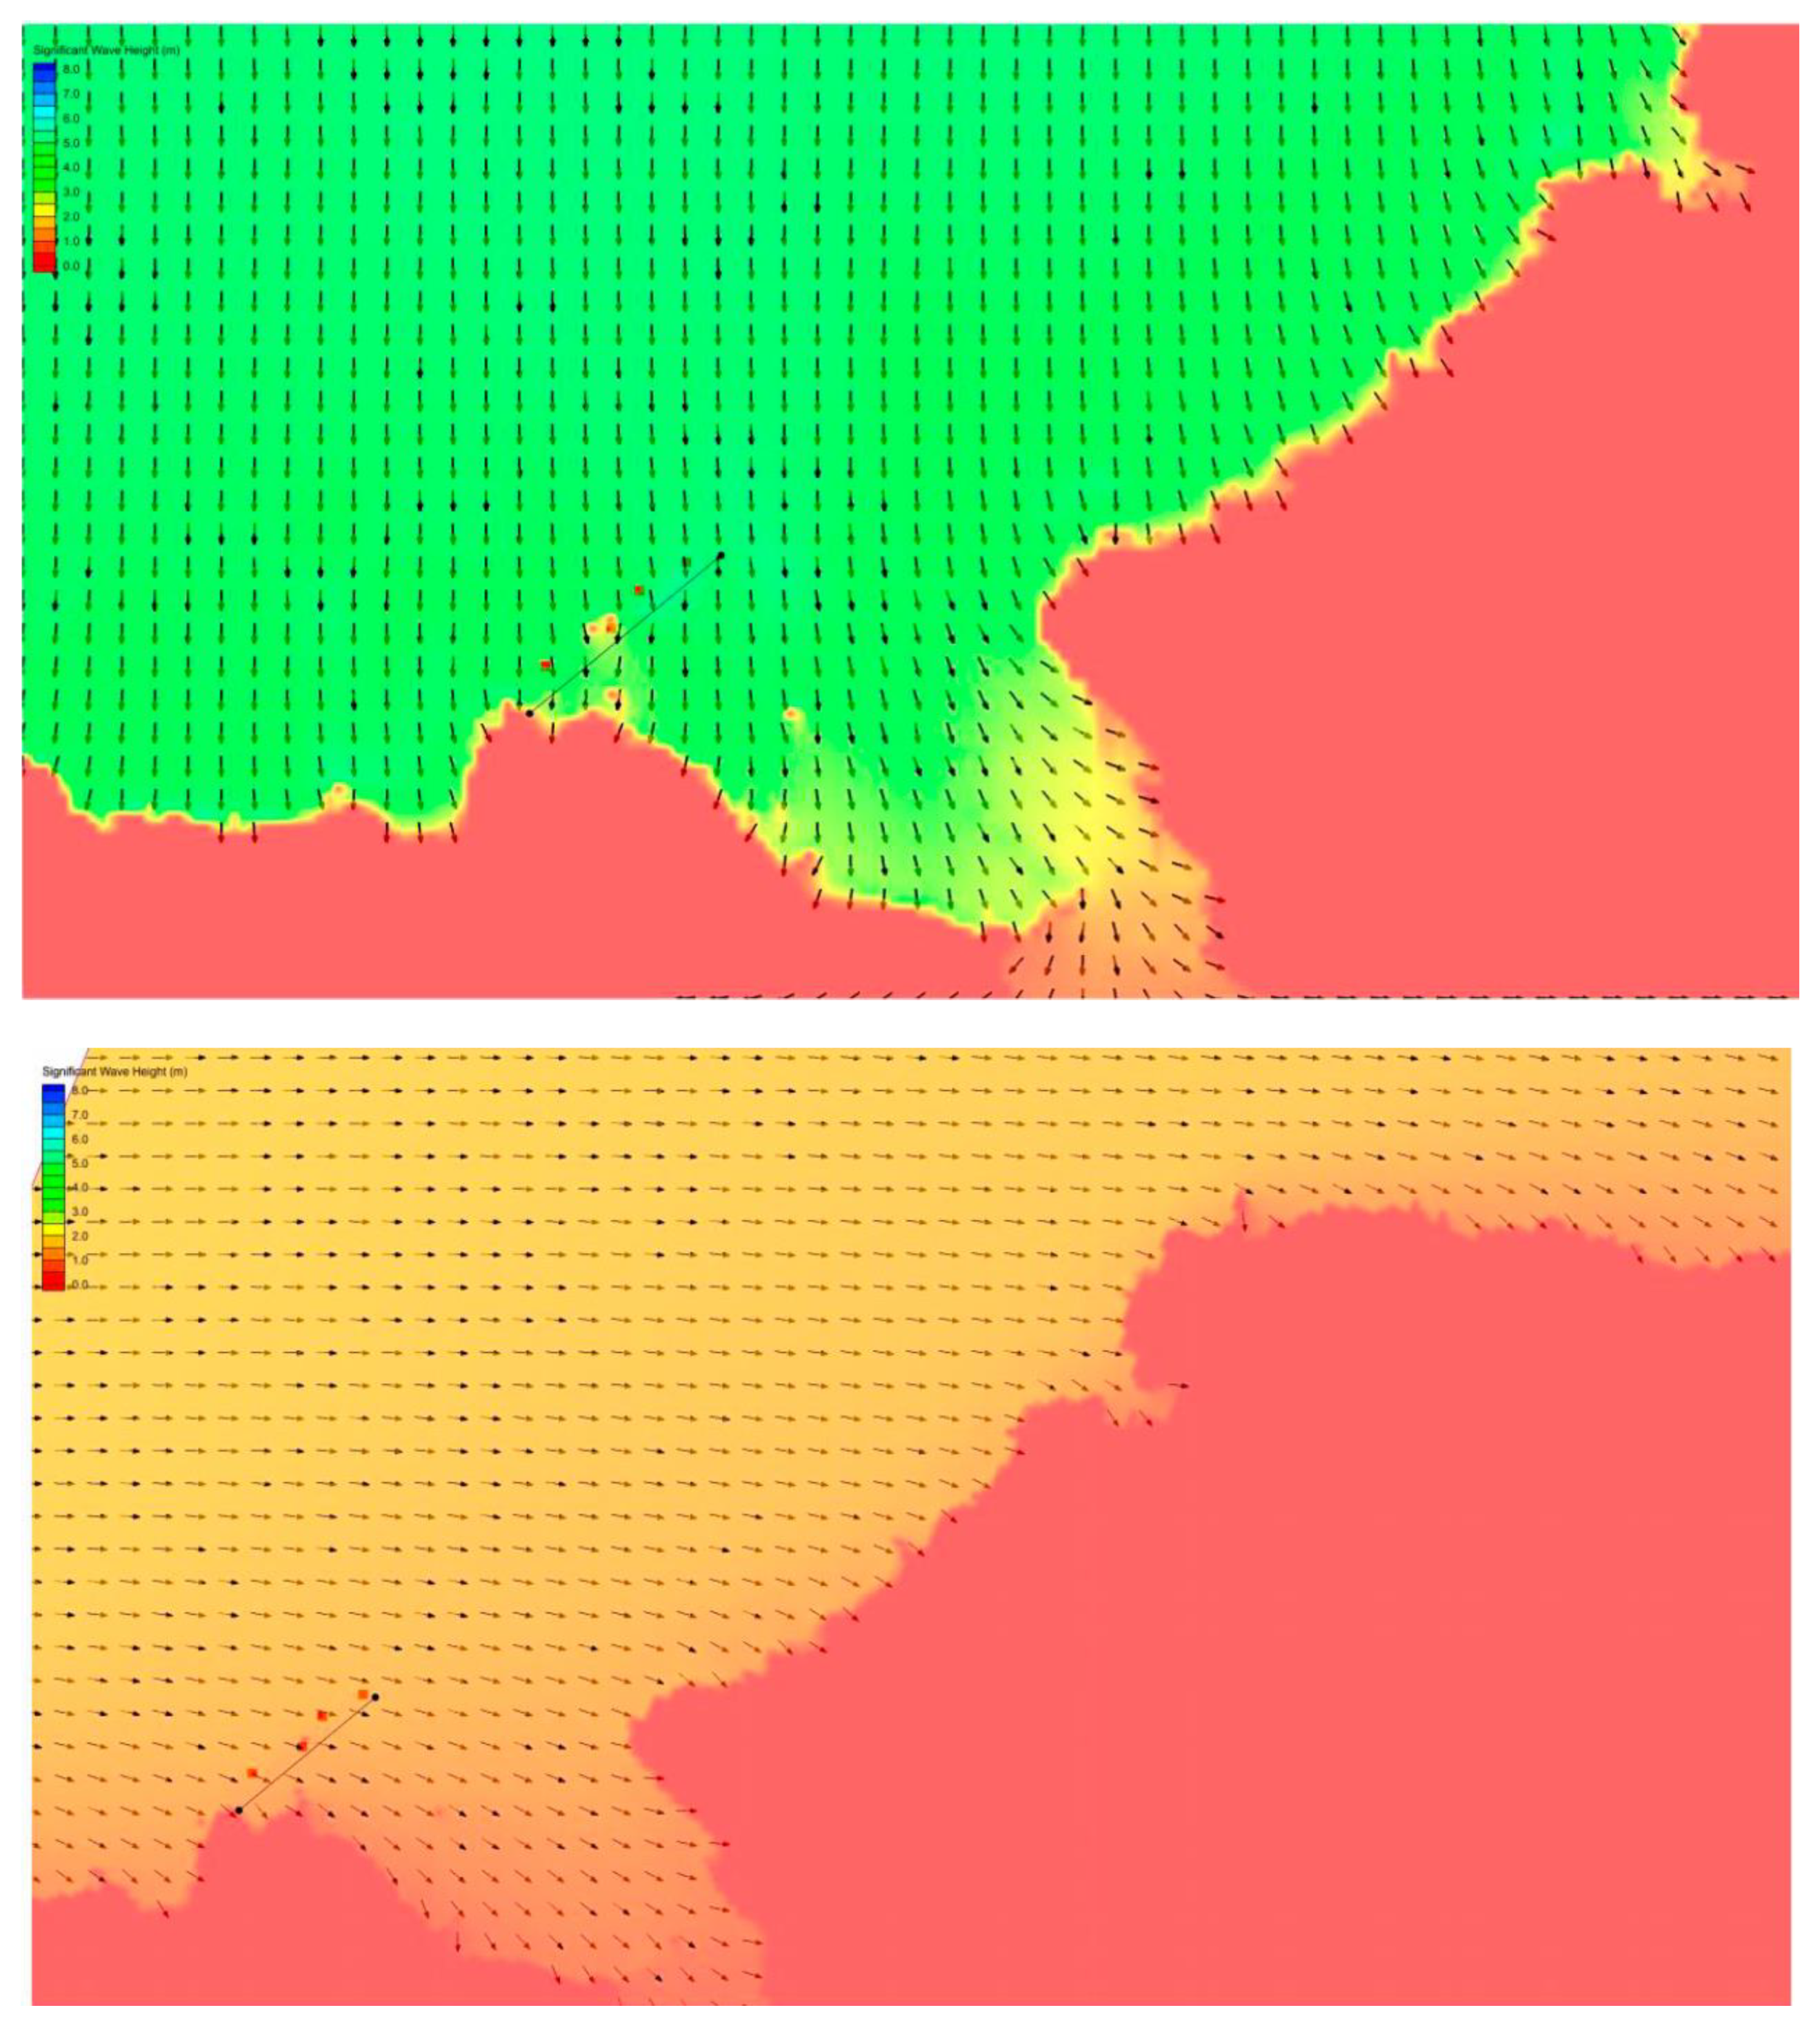
In order to create the numerical model, it is necessary to choose a series of propagation meshes in each breakwater case, covering all the way of the wave from deep waters to the objective points. The orientation of those meshes should concur with the main direction of the waves, being able to propagate in each mesh in other directions that are not positioned at an angle of more than 45° from the main direction in order to obtain reliable data in the propagation. For the study, only those directions of the waves that together represent a percentage of the time greater than 90% of the maritime climate in average regime were selected [
24,
25]. In
Figure 10,
Figure 11 and
Figure 12, different graphic results of the characterization of the maritime climate in the three study points are shown.
In addition, other variables must be taken into account in numerical wave propagation, as they are influential on the accuracy of the model. The bathymetric information, or the position of the point where wave data were gathered with respect to the position of the structure, needs to be designed [
26].
After propagation with the CMS Wave software, the maritime climate is obtained in all the proposed target points for each breakwater. Combining the available potential energy matrices (Pierson-Moskowitz spectrum) together with the characterization of the maritime climate at target points (frequency in hours of the different combinations of the Hs-Tp waves), the wave energy available at these points are obtained. In Punta Langosteira: 287,504 MWh/year in P1; 291,328 MWh/year in P2; 291,316 MWh/year in P3; 287,024 MWh/year in P4. In the Gijon port: 153,061 MWh/year in P1; 145,994 MWh/year in P2; 145,250 MWh/year in P3; 160,028 MWh/year in P4. In Punta Lucero: 230,382 MWh/year in P1; 249,758 MWh/year in P2; 260,334 MWh/year in P3; 277,243 MWh/year in P4.
The more energy efficient ones were chosen, where constructive aspects avoiding heads and changes of direction of the breakwaters were also considered; thus, the selected points were: P2 in Punta Langosteira, P1 in Torres, P3 in Norte and P3 in Punta Lucero. The characterization matrices of the annual waves in these points, obtained with CMS Wave, are shown in
Table 4,
Table 5,
Table 6 and
Table 7.
As the results reveal, while the highest energy points in the sites are those that are furthest from the coast, those that are located near the coast have the lowest energy potential. For this reason, the location of the different wave power plant is chosen where there is greater energy potential and where the installation is constructively feasible. It must be taken into account that the installation of the devices in the head and directions changes of the breakwaters are not the most convenient site, because major waves appear more frequently, which could put in danger the stability of the device.
To estimate the power output at a given site with the help of the converter of wave energy, the wave characterization matrix of the location was used (table Hs-Tp in hours) together with the power matrix of the WEC [
27,
28].
Apart from the incident wave height or wave frequency, there are other parameters that are highly influential in the process of capturing the wave energy, such as the power take off damping of the devices [
29]. However, this need to be proven as an experimental parameter, and has not been taken into account in this paper.
For the choice of the power matrix of the OWC [
25], the following matrix of power was obtained from a study for the installation of a plant in the port of A Guarda (Portugal) (see
Table 8).
In order to decide the power of the turbine to be used, studies were conducted for the OWC in A Guarda, where tests were carried out with turbines of 45, 100, 150 and 200 kW. However, for practical purposes, the existing plant in the Mutriku dike (Basque Country), which has 16 cameras, was also used. Each chamber has an 18.5 kW turbine of power, adding together at a total installed power of 296 kW. For this reason, it was decided to use 50 kW turbines for the OWC to be installed in the breakwaters.
The power matrix used for the SSG device [
30,
31] is shown in
Table 9. It was obtained from the Multi-Stage turbine, developed by the Norwegian company WAVEnergy AS [
17], which built the first SSG scale prototype on the island of Kvitsoy (Norway) and installed this turbine model. The power installed in an SSG device 10 m section is 155 kW.
It must be considered that the operation of the plant for the use of energy will have a certain performance due to the following losses generated on any device. The wake energy losses are 0% of the total since they are non-existent in both types of devices, as is a typical effect of wind farms. Electrical losses in the conversion of the energy captured by the device to the electric power, considering the primary and secondary conversion, are valued as assumptions according to the normal market criteria, between 4% of the total. Losses due to unavailability of the facility due to maintenance work, taking into account the preventive and the corrective, both of the civil structure and of electric machines, valued at 11% of the total, which is also considered as an assumption according to the experience in this type of maintenance. Therefore, the overall performance of the devices is 85%.
The annual energy production per module of each device and location was estimated crossing the wave characterization (hours obtained from the statistics of the wave action) and the power matrices of the devices [
32]. Based on the estimation of the energy consumption of the ports in 10 years, the length of the optimal facility is estimated to meet approximately that demand.
The energy resource used by a unit module of each marine energy converter is calculated in such a way that a SSG of 10 m in length, in which counts with 155 kW of power is considered in the studied locations, and with an OWC chamber of seven sub-chambers in Punta Langosteira and six sub-chambers in Norte and Punta Lucero. Each sub-camera has a turbine of 50 kW. Both net energy production and the capacity factor were calculated. The latter is defined as the ratio between the actual energy generated by the plant during an annual period and the energy generated if it had been working at full-load during that same period, according to the nominal values of the equipment. This rate is used as an index of the real use of the capacity of the facility in terms of time. Results are shown in
Table 10. They reveal that the installation of any of the devices would obtain a quantity of reasonable energy, although the installation of an SSG in the Torres breakwater is not the most convenient option. It is observed that the capacity factors of the OWC are close to those of the wind farm (20–40%) [
33], although the lowest ranges do not reach 2000 h per year. In the installation of SSG in any of the study points, the ranges are more widely extended, since the operation of this device depends more strongly on the maritime climate at the site.
Data were based on an evaluation of the historical evolution of annual electricity consumption in the period 2011–2015, just after the boom of the last economic crisis suffered in this century, collected from the “Sustainability Reports” of recent years made by the affected Port Authorities. Although the average growth rate in all cases during the mentioned period has been constantly decreasing, approximately 6% in these ports, as revealed in their Annual Reports about the traffic they serve, an exponential growth rate of 2% will be estimated to cover possible punctual peak-consumption. According to these Annual Reports, since 2015, where consumption was 1885 MWh/year in Outer Port of A Coruña, 3259 MWh/year in the Port of Gijon and 5407 MWh/year in the Port of Bilbao, it has been calculated that in 10 years, the final consumption will be 2392 MWh/year, 4134 MWh/year and 6858 MWh/year, respectively.
Considering these estimations, the first approach to design the OWC facility is based on an optimal plant that would approximately meet the whole demand. However, due to the dimensions of the modules of the caissons that are necessary to shelter the OWC devices, and the time required to anchor them, none of the lengths for the facility obtained seems reasonable for constructive reasons to satisfy the whole demand. Consequently, the final solution will lie in building plants of approximately 150 m, leading to the construction of three modules for it. In the case of Punta Langosteira, a demand of 85% would be covered, in Norte, it represents a reduction of 42% and in Punta Lucero, it descends to 18%.
In the case of the SSG facility, using modules of 10 m of length and 155 kW, eight modules will be necessary for Punta Langosteira and 38 modules for the rest of the cases. As there is no physical space to install a 380 m plant in the Torres dike and the temporary window for the removal of pieces from the mantle at a length of 380 m in the Punta Lucero dike, it is not viable. It is concluded that the central in all three cases, it is decided to provide a length of 100 m to the wave energy facilities, having 10 modules in each case and covering 110% of the demand in Punta Langosteira (getting self-efficient energetically) and 27% in the other two cases.
Energy production is estimated for each wave energy plant, as well as the number of module and the length of every alternative, which is included in
Table 11.
6. Structural Behavior
The structural calculations, which are needed to determine the dimensions of the OWC and guaranteed its stability, will be destined to the solution of advancing the rip-rap lower part of the existing breakwater to place a caisson with the OWC device integrated in it. In the case of the SSG, the solution will focus on the removal of a certain number of pieces from the armor along a specific length of the breakwater defined to place the SSG structure. Once its dimensions are calculated, it will be necessary to study its fitting in the rubble mound breakwater.
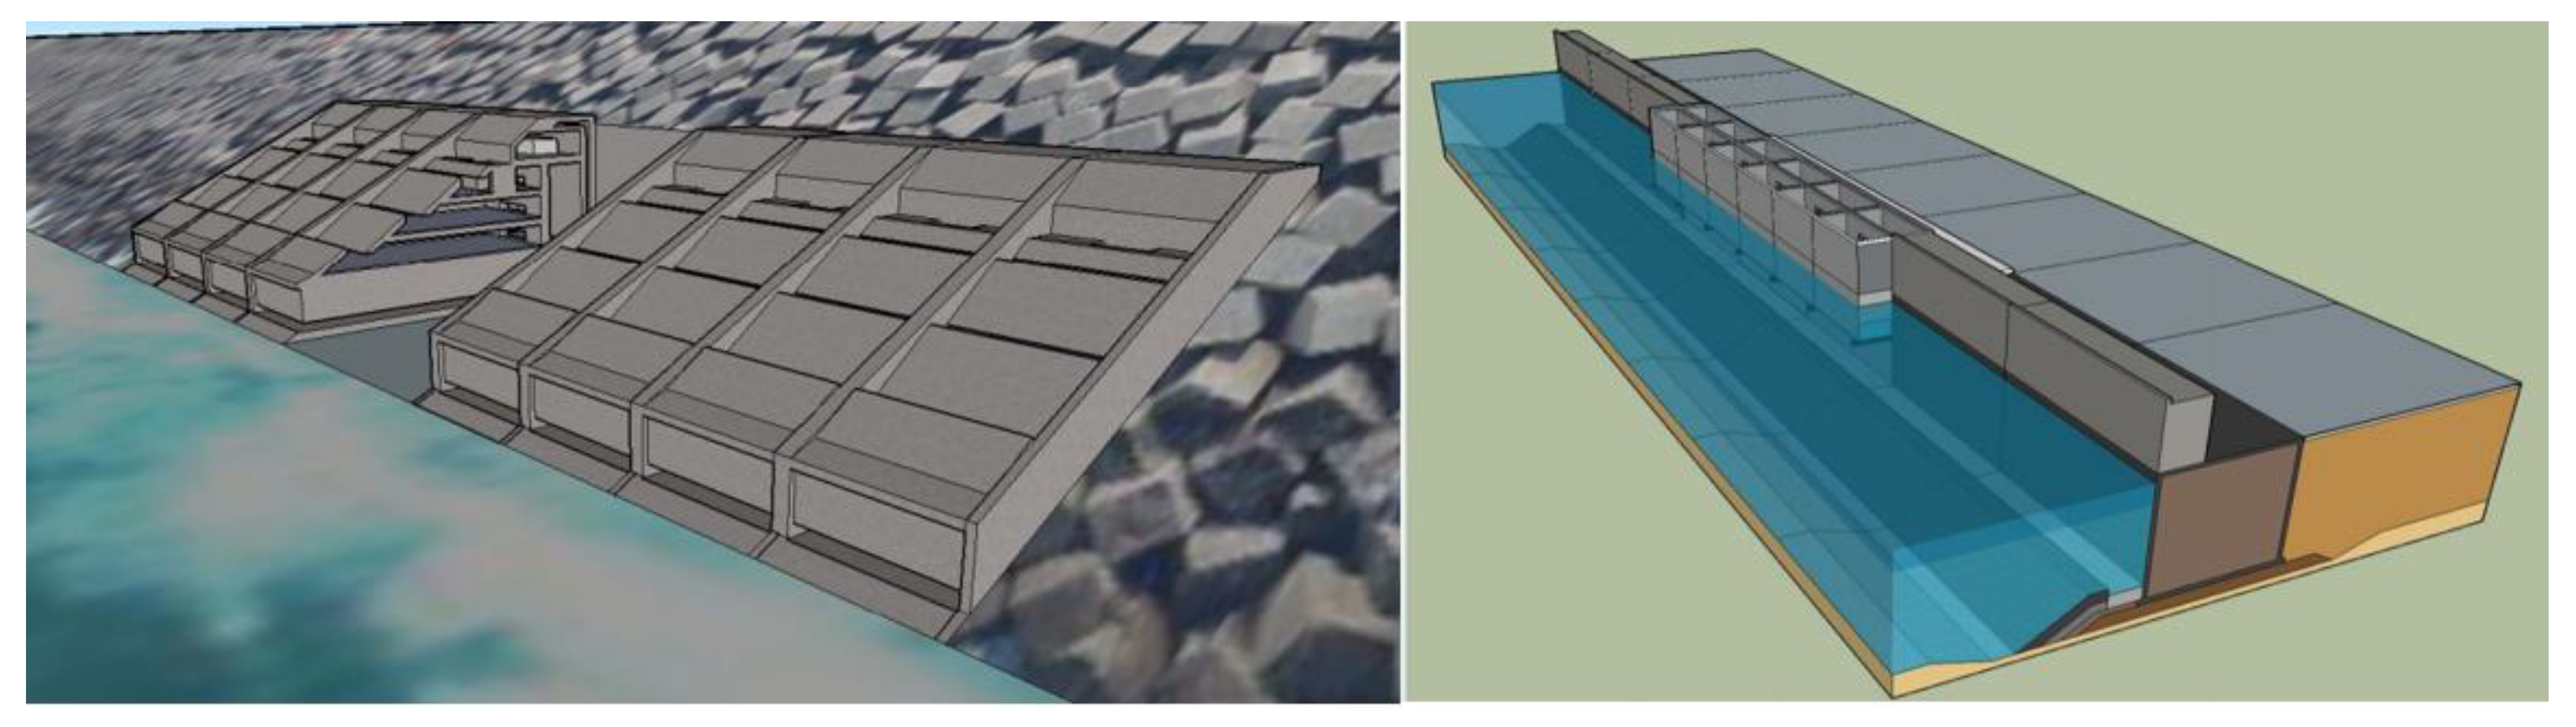
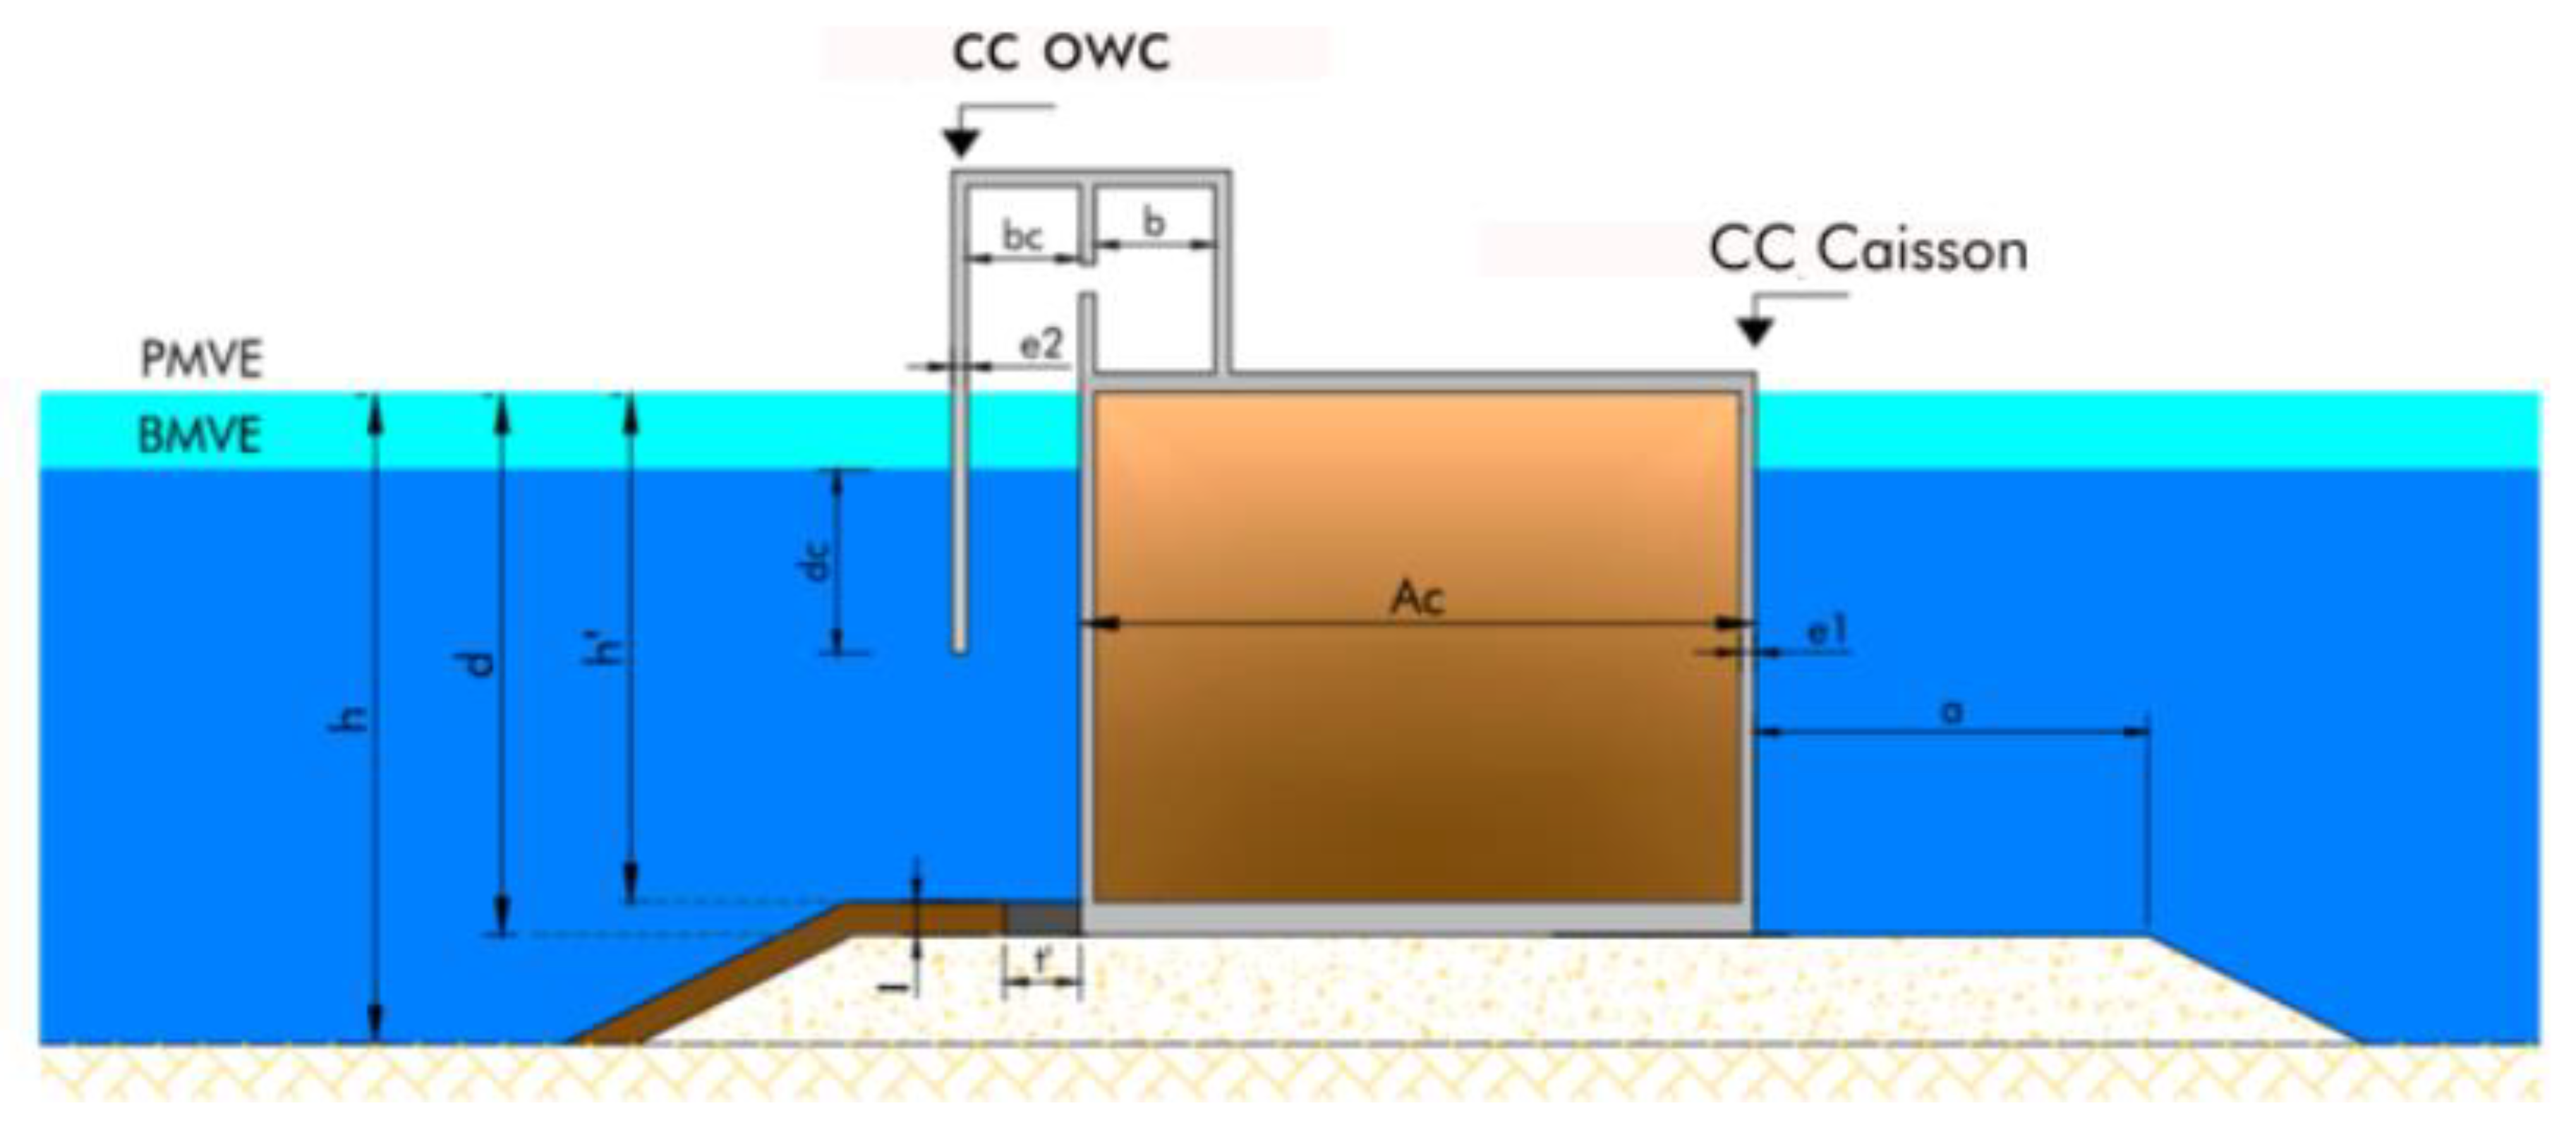
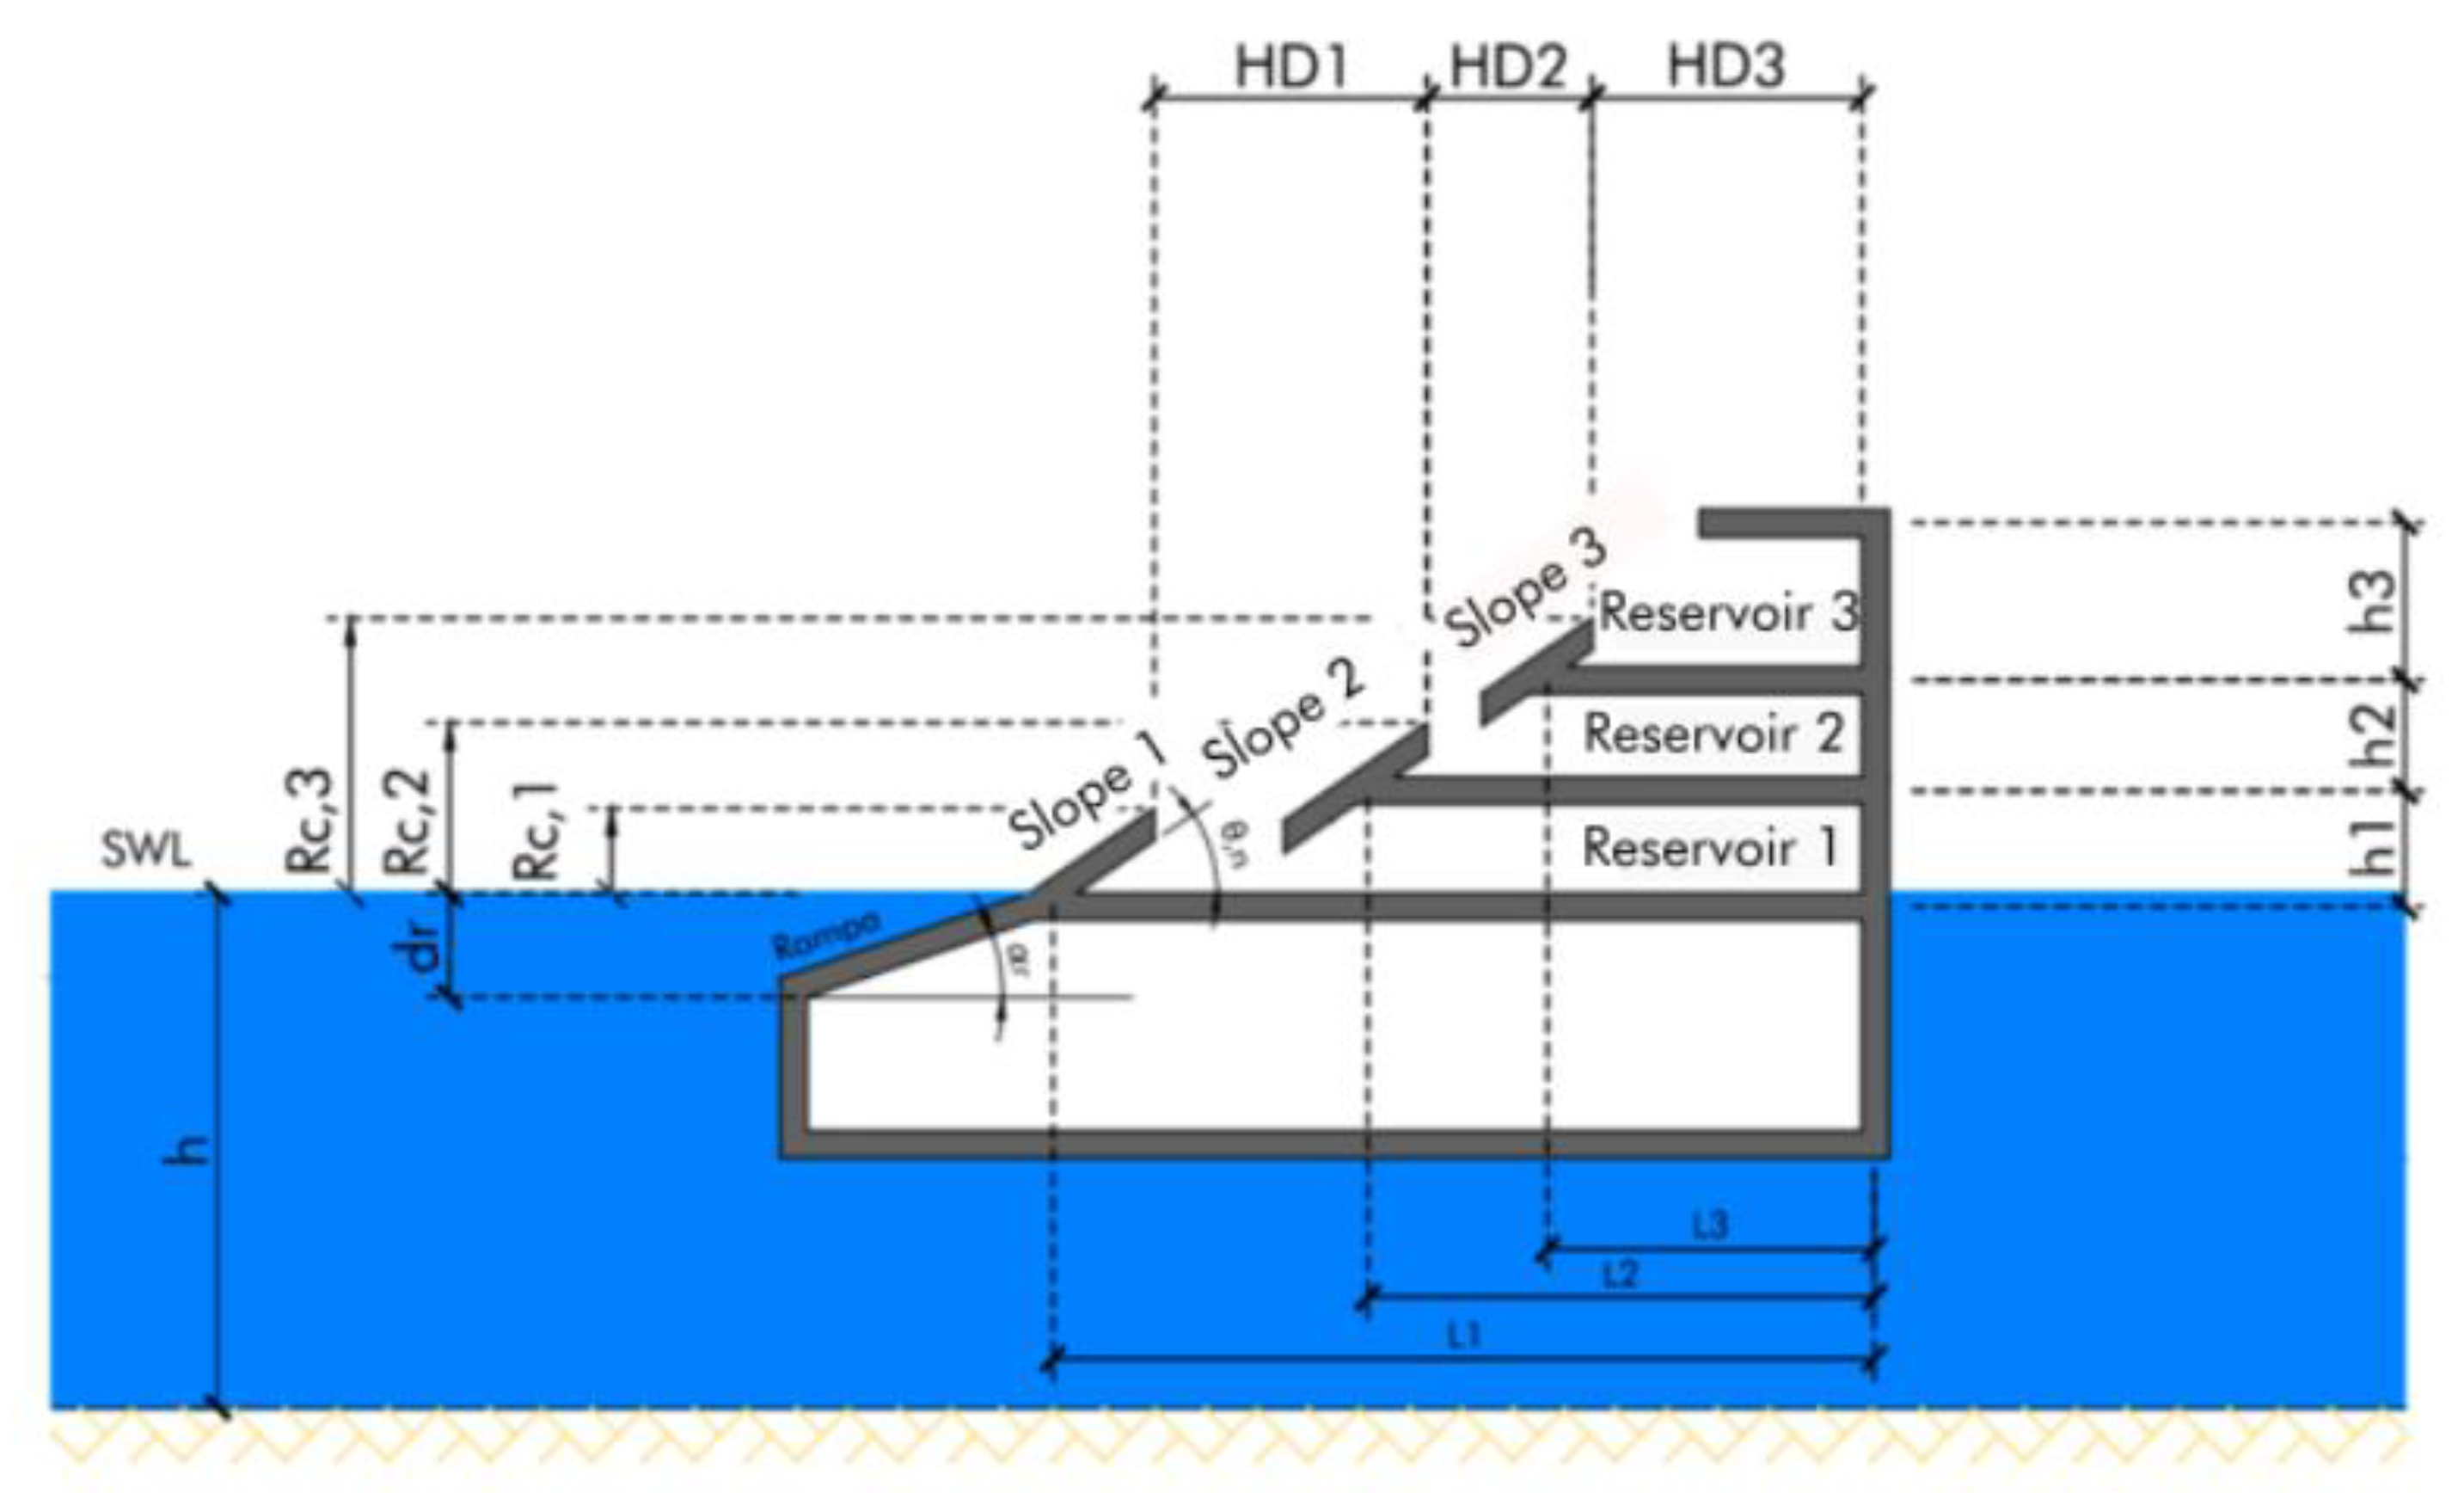
For the study of hydraulic dimensioning, the structural stability criteria (sliding, sinking, adequate reflection coefficients) as well as the hydraulic-energy performance criteria (amount of water to be turbined in the SSG) have been taken into account. After reviewing technical standards and reference documentation, solutions have been defined geometrically, as shown in
Figure 13 and
Figure 14.
It must be taken into account that in an OWC, there is a fixed hollow structure, which is opened to the sea below the water surface that traps air above the inner free-surface. Wave action alternately compresses and decompresses the trapped air which is forced to flow through a turbine coupled to a generator [
34]. The stability of this fixed wall has been considered as an impulse pressure that may break this concrete wall and damage the intern turbines. The impulsive wave force occurs when the incident wave height is comparable to the clearance between the still water level and the bottom of the super structure for non-breaking waves [
35].
In SSG, not only is it necessary to consider the pressure on the slopes, but it also affects the estimation of the volume of the different reservoirs that keep the water inside them. Thus, it is vital to calculate the length of the horizontal walls and the inclination of the slopes. These structural estimations must be also related to further investigation on the underlying mechanism and sensitivity related to the broadband energy harvesting of this device [
36].
7. Constructive Viability
One of the critical aspects in any civil infrastructure is the constructive viability, not only in terms of means but also in terms of the time available to do it. Since different alternatives are proposed on the north coast of Spain, it should not be forgotten that swell conditions can be very unfavorable, as it can cause unexpected stops during the development of the works. In practical terms, this could lead to significant delays. Consequently, time window is considered as one of the fundamental criteria to choose which of the locations is the most optimal from a construction point of view. It cannot be forgotten that this facility would be installed in existing breakwaters, so one of the most promising challenge is to dismantle a great part of the infrastructure and collocate the facility.
To determine this limit of temporary space, there are conditions considered as essential: the necessity of the winter stop according to the climate conditions as well as the compatibility of the operation of the work equipment with the conditions of the waves.
To decide whether it is necessary or not to stop working during the winter months, it is established with the following relationship, which is based on the wave height exceeded 12 h at a year (Hs12) referred to the medium regime as it is not an extreme situation but a borderline state of service: if Hs12 is less than 5 m, there will be no need to make the winter stop. If Hs12 is more than 7 m, it is mandatory to stop the civil construction. If Hs12 is found among the range of these values, it will depend on the climate conditions during the year of construction.
For the analytical estimation of this variable, Weibull parameters of the historical series are needed from the REDCOST buoys of the Coastal Network closest to the study points instead of using those from the REDEXT, as the first approach to reality. As a result, a 6.87 m of Hs12 in the Punta Langosteira area was obtained. Due to the great extent of storms that this zone is submitted to and considering the value of Hs12, it will be mandatory to make a stop from September to April to carry out repairs on all the infrastructure; thus, works at sea must be completed in four months. In the studied areas of Gijon and Bilbao, a value of 6.29 and 5.41 m are obtained, respectively. Although it might be tentative not to make a winter stop in order to take any risk, it could be accepted to start or finish the civil construction 15 days before the established window if climate conditions allow them in the mentioned periods.
On the other hand, not only is it necessary to consider the time to develop the different work phases (bench construction, sea drawers transport, anchor of caissons), but it also depends on the climatic conditions such as wave heights or gusts of wind. They have an important and huge impact on the maritime equipment to properly operate as it can make that machines stop from working. As an order of magnitude, the wave height compatibility with the operation of the machinery that would participate in this work covers a thin range from 0.5 to 2 m depending on the activity to develop. As a consequent, a studied period of time must be studied in which waves do not rise above a certain threshold, but remains below that threshold, so that the machinery works uninterruptedly and has no risk to stop working during the operation.
The phases to be carried out in the assembly of the central SSG, taking into account the constructive way of a mound breakwater [
37], are schematically summarized the following:
- -
Dismantling a small part of the concrete superstructure as close as possible to the work to accommodate the large boom crane that will remove the pieces of the breakwater for the installation of the SSG.
- -
Removal of the different elements of the resistant layers (armor, first filter, second filter) of the part where the dike will be installed. In this phase, it would be advisable to remove a small quantity of blocks from filler (although this layer is not resistant), which is necessary for the accommodation of the electrical gallery being therefore protected. Once the described materials are removed, they must be transported to the concrete esplanade, where they are collected in order be relocated after the installation of the device in next steps. However, for those that cannot be reused, as there is no physical space, it is necessary to make a correct waste management of these and take them to an appropriate landfill site.
- -
Placement of the different modules of the facility. This phase begins with the pumping of the submerged concrete when the maximum sea level is reached (this ensures that in every moment, it is completely submerged). After this, it will be needed to place the location of the module with the large boom crane until it is perfectly located. Finally, wires are installed, as they are used for the electricity transport form the generation to the module exit in its upper part.
- -
Construction of the precast concrete wiring gallery, over the filler part, from the module exit to the concrete superstructure, using a large crane.
- -
Pouring and placement of resistant elements previously removed, transported and collected on the esplanade. This placing is done layer by layer, monitoring that there is no damage appreciate in this pieces and the rest of the material.
- -
Concrete pouring of the superstructure, which has been previously dismantled, getting uniformity in the whole civil infrastructure by rolling formworks.
From all these tasks, the one that would highly limit the construction is the removal of the different elements of the resistant layers. This is because it takes 1 h to remove a piece from the armor if it is more than 90 tons. If the weight is less than this threshold, it takes 1 h to remove two pieces, instead. In addition, this task must be completed during the daytime (8 h per day), as the visibility at night to manage heavy maritime machinery is poor and place the workers at risk. From the breakwater drawings shown in
Figure 5 and considering a length of 100 m of the facility, it would take 227, 183 and 51 days in Punta Langosteira, Torres and Punta Lucero, respectively, to remove pieces from the armor and filter layer. This means that the SSG facility in Punta Langosteira and Torres would not be reasonable, while this would be an option in Punta Lucero.
As Norte is already built, the construction process will be different in comparison that would be carried out in Punta Langosteira and Punta Lucero, where it will be necessary to execute the facility in a similar way as a vertical breakwater. Therefore, there are different construction methods for the alternatives.
In the first case, it is proposed to build the OWC in two parts: the first corresponding to the part related to the submerged wall of the water column chamber (which would be formed by hollow caissons) and a second part corresponding to the air chamber of the OWC where the turbines are installed. Therefore, the phases that would make up the construction process are the following:
- -
Dismantling a part of the concrete superstructure where the OWC plant will be placed.
- -
Cutting several holes in rectangular shape of small dimensions in three of the existing vertical walls from caissons. The purpose is to place many beams (IPE profiles) in each of these holes, to ensure the stability of the civil construction.
- -
Placing the mentioned beams that will remain attached to the concrete by the application of a special epoxy resin with many applications under the sea.
- -
Manufacturing the special caissons on land and launching them.
- -
Transport of the caissons to the facility location by sea.
- -
Placing the caissons on the passing beams and tie them, taking advantage of at the site there is a semi-day tide (two high tides and two low tide a day)
- -
Installation of the OWC device in the air chamber.
The phases that would take most of the available temporary window are those corresponding to the dismantling of the concrete superstructure and the transport and colocation of the caissons. As orders of magnitude, the performance of the backhoes that would be used for the demolitions of the concrete superstructure depends on their power, comprising a range between 12–100 m3/h. Using two mid-high range equipment, the 24,000 m3 of shoulder, it could be dismantled in 3 weeks. It is possible to begin works in mid-May if the climatic conditions are favorable, since this machinery is not maritime and it is not strictly required to be used in the summer months.
On the other hand, the construction of an OWC in Punta Langosteira and Punta Lucero is similar to the construction of a vertical breakwater in which caissons are formed by reinforced concrete [
38]. The phases are as it follows:
- -
Dredging the natural terrain in case the terrain does not have enough bearing capacity or an improvement of the soil is necessary. Given that the bearing capacity in these areas is high, this phase will not be necessary.
- -
Placement of the foundation bench.
- -
Construction and transport of caissons, leaving a part of the armor in sight at the top of the element seen (in two of the cells) in order to place the OWC devices.
- -
Anchorage of the caissons before filling the cells and joints.
- -
Give an adequate protection mantle of the foundation bench.
- -
Placement of cameras and electrical installation (OWC).
As orders of magnitude, the performance of a powerful split barge for the discharge of rocks is 1500 m
3/day. Considering the high volume of this material in breakwater (see
Figure 5), more than one machine is required to finalize these tasks in 2 months.
The anchoring speed of the caissons is about 20 cm/h, and as the experience in maritime structures reveals, it will take one week of time to anchor each caisson and another two weeks to fill it. Based on this and the size of the caissons, it is estimated that from the transport of caissons and the placement of the rest of resistant elements would be completed in 10 weeks, leaving a margin of 2 weeks for inoperability and unforeseen conditions. In Punta Langosteira, this is considered unacceptable due to climatic issues, but in Punta Lucero, it would be possible to take this risk, as shown by the information regarded in the corresponding Buoys.
Consequently, it is concluded that the greatest difficulty that must be faced in the installation of wave energy converters in the study points, whatever the technology is used, OWC or SSG, is the constructive process. The main reason is not only because of the temporary restriction, as all the task must be done in less than a year, but also on the fact that maritime works must be carried out in the summer months. Due to this limitation, it is not possible to build a plant of greater length, because the fact that unprotected dikes (removal of the pieces that make up the armor and the filters layer or dismantling the concrete superstructure) may cause high damage on the existing infrastructure. Furthermore, from an economical and financial point of view of view, the temporary windows must be adequate so that the construction could be profitable Given this situation and considering the maritime conditions that the north coast of Spain presents, it is concluded that risks of delayed works are more likely in Punta Langosteira, since it is conditioned by major aggressive weather. Despite being a more energy efficient location, the solutions in these locations are not viable from the constructive point of view, leading this condition to invalidate these alternatives. In the cases of the port El Musel and Bilbao, the risk is lower in comparison with the previous breakwater, although there is still an acceptable hazard in both cases.
8. Evaluation of Alternatives
The selection of the most optimal and efficient alternative has been carried out using a multicriteria analysis tool. Energy, social, economic and constructive viability criteria have been proposed, with a weight of 40%, 15%, 10% and 30%, respectively, in the final decision. Within each of these criteria, each alternative will be measured with a numerical scale to know how appropriate the solution is. Solutions considered very bad obtain the minimum score (0) and those considered as optimal obtain the maximum score (10), as shown in
Table 12.
First of all, two relevant aspects are considered in the energy criteria: the net energy production, which has been considered per device unit in order to assess its efficiency in terms of generation, and the capacity factor as this index shows the real use of the facility over time reveals how production losses really affect to the plant (maintenance, energy transformation losses, among others).
Secondly, as these types of projects need to be accepted by society in order to not stand against the project and then halt all works, social criteria need to be considered. An incentive for society and politicians is to know if the production of the facility will cover all of its long-term consumption to be considered energy self-sufficient. This has been determined with the length of the control panel and the number of devices to be installed (see
Section 5).
Furthermore, an approximate economical estimation of each alternative has been developed, taking into account the cost of the materials used for each of them, including waste management and the wiring installation.
Regarding orders of magnitude,
Table 13 shows some of the prices that are considered, to estimate the initial investment. This economical approach is based on the market prices and special specifications for works contracts in maritime infrastructures in Spain. Given the amount of material to be managed as construction waste from either the removal of blocks removed from the main mantle or the dismantling of material form the concrete superstructure, the waste management will be valued at a percentage of 1.5% of the material execution budget, according to the experience in this type of construction.
Last but not least, the constructive viability depends on the temporary window of one year established as well as the probability of favorable climatic conditions. Due to the need of wave heights below a certain value for the compatibility of maritime equipment, it is qualitative valuated the risk of having unpleasant weather that can delay many of the constructive activities to be carried out.
In comparison, the SSG alternative in Punta Langosteira is totally ruled out because it is unfeasible from the construction point of view. However, it should be highlighted that it is the most efficient of all those raised from the energy point of view, although it is not enough reason to be developed. On the other hand, the SSG alternative for the Torres dike could also be ruled out due to the unfeasibility of the construction process; moreover, it also seems to not be attractive in terms of energy generation compared to the other SSG converters. In contrast, the SSG alternative in the Punta Lucero is viable from both energetic and constructive point of view energetic and constructive. However, it presents the economic problem of this alternative considering the high constructive investment and cost, considering additionally that it cannot meet the whole energy demand that the port will produce in a future.
The alternatives in OWC, in general, are not that attractive in power generation compared to the SSG. However, the investment to be made is considerable smaller because, for its construction, it is not necessary to dismantle, but rather, to build something new. The importance of the social aspect as OWC camera is more efficient in Punta Lucero. Nevertheless, as the energy consumption of this port is more than the other ones, a longer facility is needed, thus, the cost will increase. Otherwise, the fact that Norte is a vertical breakwater type implies that the process of its development, despite not of being the traditional construction way, it contains fewer phases where maritime machinery intervenes. This is vital so that the risk of meeting the construction deadline is less than the other two options.
9. Economic Viability
According to the results that have been obtained from the multicriteria analysis, it would be acceptable to choose Norte in OWC as the most profitable solution based on three aspects: technical, economic and environmental points of view.
Based on this, it might seem that this civil work will generate an environmental benefit of great magnitude, which will also be accompanied by an additional economic wealth at the time of selling the generated energy. However, one of the main problems that is presented in this project is that the works need initial investment to be carried out. If this initial investment is amortized by generating benefits during its useful life, it will be profitable. This is something that does not happen in all cases.
The economical approach will have the following characteristics:
- -
It will require an initial investment for its construction.
- -
It will demand for periodical maintenance and conservation costs/expenses for its maintenance and conservation.
- -
It will produce benefits from the sale of energy.
Once the three previous variables are known, it can be determined whether the construction project is profitable or not, based on the common profitability indicators, such as the net present value (NPV), the internal rate of return (IRR), the return period on investment (payback), the ratio cost-benefit or the ratio benefit-cost-investment (BCI).
Considering an investment of 16 million of euros (see
Table 3) and periodic costs for maintenance around a 3% of the material execution budget (common value for the maintenance of this type of infrastructures like the existing Mutriku Dike), these are considered as the costs of the project. For the benefits, if the current sale price of electricity is 0.15 €/kWh in the Spanish electricity market and the net production of the facility has been estimated in 1,726,971 kWh/year, the incomes will be valorated in 295,045.65 €/year.
After the appropriate calculations, the results show that this facility would not be profitable nowadays, as the NPV is valued in less than 10 million of euros, the IRR is negative, the payback would be 500 years, the ratio cost-benefit is less than one unit and the BCI is estimated to be 0.12.
To sum up, it would be necessary to produce at least more than one million euros in the sale of energy to make these indicators favorable for the project. More than an order of magnitude improvement in cost of energy [
39] will be needed to implement this technology. This increase could be possible if the length of the facility had been longer or the development of the OWC devices had not been yet in its infancy to harness the great potential of the sea. In addition, a solution of hybrid wind-wave systems is being developed, which are innovative solutions to combine the sustainable exploitation of multiple marine resources. The idea is to develop a hybrid system for monopile substructures, which are currently the prevailing type of substructure for offshore wind turbines, and more specifically to focus on the wave energy converter sub-system, which consists in an oscillating water column. [
40]. This could lead to an economical solution and increase the energy sales. It also offers other advantages, as it occupies less space and makes a minor impact on the environment.
10. Conclusions
On a global level, different stages of technical and commercial evolution associated with the installation of wave energy converters, which have slowed down in recent years by technological, environmental and financing barriers and obstacles, have been consolidated throughout the recent years.
The present study demonstrated the feasibility of generating electric power, by harnessing the energy of the waves on the north coast of Spain. There is a great energy potential of wave type in the analyzed sites, which is not yet exploited, as a consequence of the low degree of development of marine energy conversion technology.
Constant technical progress is essential to consolidate the growth of this sector; there needs to be a balance in the cost reduction of innovative technology, thus promoting its greater commercial viability, with an increase in its reliability, availability and performance.
From a constructive point of view, the aggressiveness of maritime climates and the need to integrate converting devices in existing civil infrastructures, which involves a circumstance not provided for in the original design of port works, introduces a degree of innovation that increases the complexity of the process of construction.
The optimal solution of wave power plant in any of the locations, provided with any of the technology developed, even when responding to the requirements of energy efficiency, hydraulic, of structural and constructive type, is not profitable today from a financial point of view.
Within the framework of climate and energy public policies, wave energy has not reached a sufficient level of technical maturity to consolidate its complete market penetration in Europe and all over the world. Integral efforts in innovation and development and commitment to brand projects such as the one presented will definitely contribute to consolidate the commercial takeoff of this technology in the next decade, thus constituting a solid alternative in the creation of a true sustainable, reliable, viable and future energy system.


 ,
, 


