Article

Effect of Mixture Design Parameters of Stone Mastic Asphalt Pavement on Its Skid Resistance

1
Key Laboratory for Special Area Highway Engineering of Ministry of Education, School of Highway, Chang’an University, Xi’an 710064, China
2
Highway and Airport Pavement Research Centre, School of Highway, Chang’an University, Xi’an 710064, China
*
Authors to whom correspondence should be addressed.
Appl. Sci. 2019, 9(23), 5171; https://doi.org/10.3390/app9235171
Submission received: 10 November 2019 / Revised: 22 November 2019 / Accepted: 26 November 2019 / Published: 28 November 2019
(This article belongs to the Section Materials Science and Engineering)

Abstract

:

Featured Application

This paper seeks to analyze the effect of gradation and asphalt content on the skid resistance of stone mastic asphalt pavement.

Abstract

Although it is well known that the stone mastic asphalt (SMA) pavement has good skid resistance, the skid resistance is not satisfactory and its durability is poor when the mixture design is unreasonable. In order to obtain excellent skid resistance for SMA pavement, this paper seeks to analyze the influence of mixture design parameters on the skid resistance of SMA pavement. The mixtures were designed with an orthogonal experiment. There were five factors, namely the percentage of aggregates passing the maximum size (PNMSA), the percentage of aggregates passing the sieve size which is only one smaller than the maximum size (PNMSA-1), the percentage of aggregates passing the control sieve size (PCS), the percentage of aggregates passing the sieve size which is only one smaller than the control sieve size (PCS-1), and asphalt content (AC), and each factor had four levels. The skid-resistance index (SI) obtained by the 3D measurement was used to evaluate skid resistance. The results show that the three parameters (PNMSA, PCS, and AC) are the key parameters to improve skid resistance. Among them, PNMSA has the greatest impact on the skid resistance, AC is the second, and the impact of PCS on skid resistance is the smallest. Moreover, the design parameters with best skid resistance are proposed.

1. Introduction

Skid resistance refers to the friction force that prevents the tire from slipping along the pavement surface [1]. It had been shown that the traffic accident risk increased significantly when the skid resistance was below a certain threshold value [2]. Therefore, skid resistance of the pavement is an important design parameter affecting driving safety.
Skid resistance/friction force consists of adhesion and hysteresis, mainly depending on the surface texture of the pavement [3,4,5,6]. The surface texture is classified according to wavelengths, including microtexture (0–0.5 mm), macrotexture (0.5–50 mm), megatexture (50–500 mm), and unevenness (500 mm to 50 m) [7]. The skid resistance of the pavement mainly depends on its microtexture and macrotexture. It is generally considered that the microtexture characterized by the friction coefficient plays a major role in skid resistance at low speeds; that the macrotexture characterized by mean texture depth (MTD), mean profile depth (MPD) or sensor measured texture depth (SMTD) has a great influence on the skid resistance at high speeds [8].
There are still no effective methods to accurately characterize microtexture until now. A number of studies used the British pendulum tester (BPN) to characterize microtexture and evaluate skid resistance at low speeds [9,10]. Liu et al. found that the friction coefficient measured by BPN was significantly affected by macrotexture. Hence, the general view that skid resistance of the pavement mainly depends on its microtexture is not always right [11]. Additionally, a dynamic friction tester (DFT) and a grip tester were also used to evaluate skid resistance at low speeds [12,13].
As mentioned previously, a number of parameters were applied to characterize the macrotexture of the pavement surface. These parameters could be obtained by different methods. Flintsch et al. used the circular track meter (CTM), laser inertial road profiler, and a sand patch to measure the pavement texture, and used MPD and MTD to characterize the macrotexture of stone mastic asphalt (SMA) and open-graded friction course (OGFC). Then, the correlation of parameters obtained by different test methods was established [14]. The stationary laser profilometer (SLP) was applied to obtain the texture elevation of the pavement surface and the texture spectral characteristics by digital signal processing. Simultaneously, the formulas of texture indicators with different wavelength ranges were proposed [15]. The texture elevation of the pavement surface could be also obtained by laser texture scanners (LTS), and geometrical indicators were used to characterize macrotexture, including MPD, average roughness, leveling depth, mean depth, surface roughness depth, and peak to valley height [16]. However, CTM, SLP, and LTS are quite expensive.
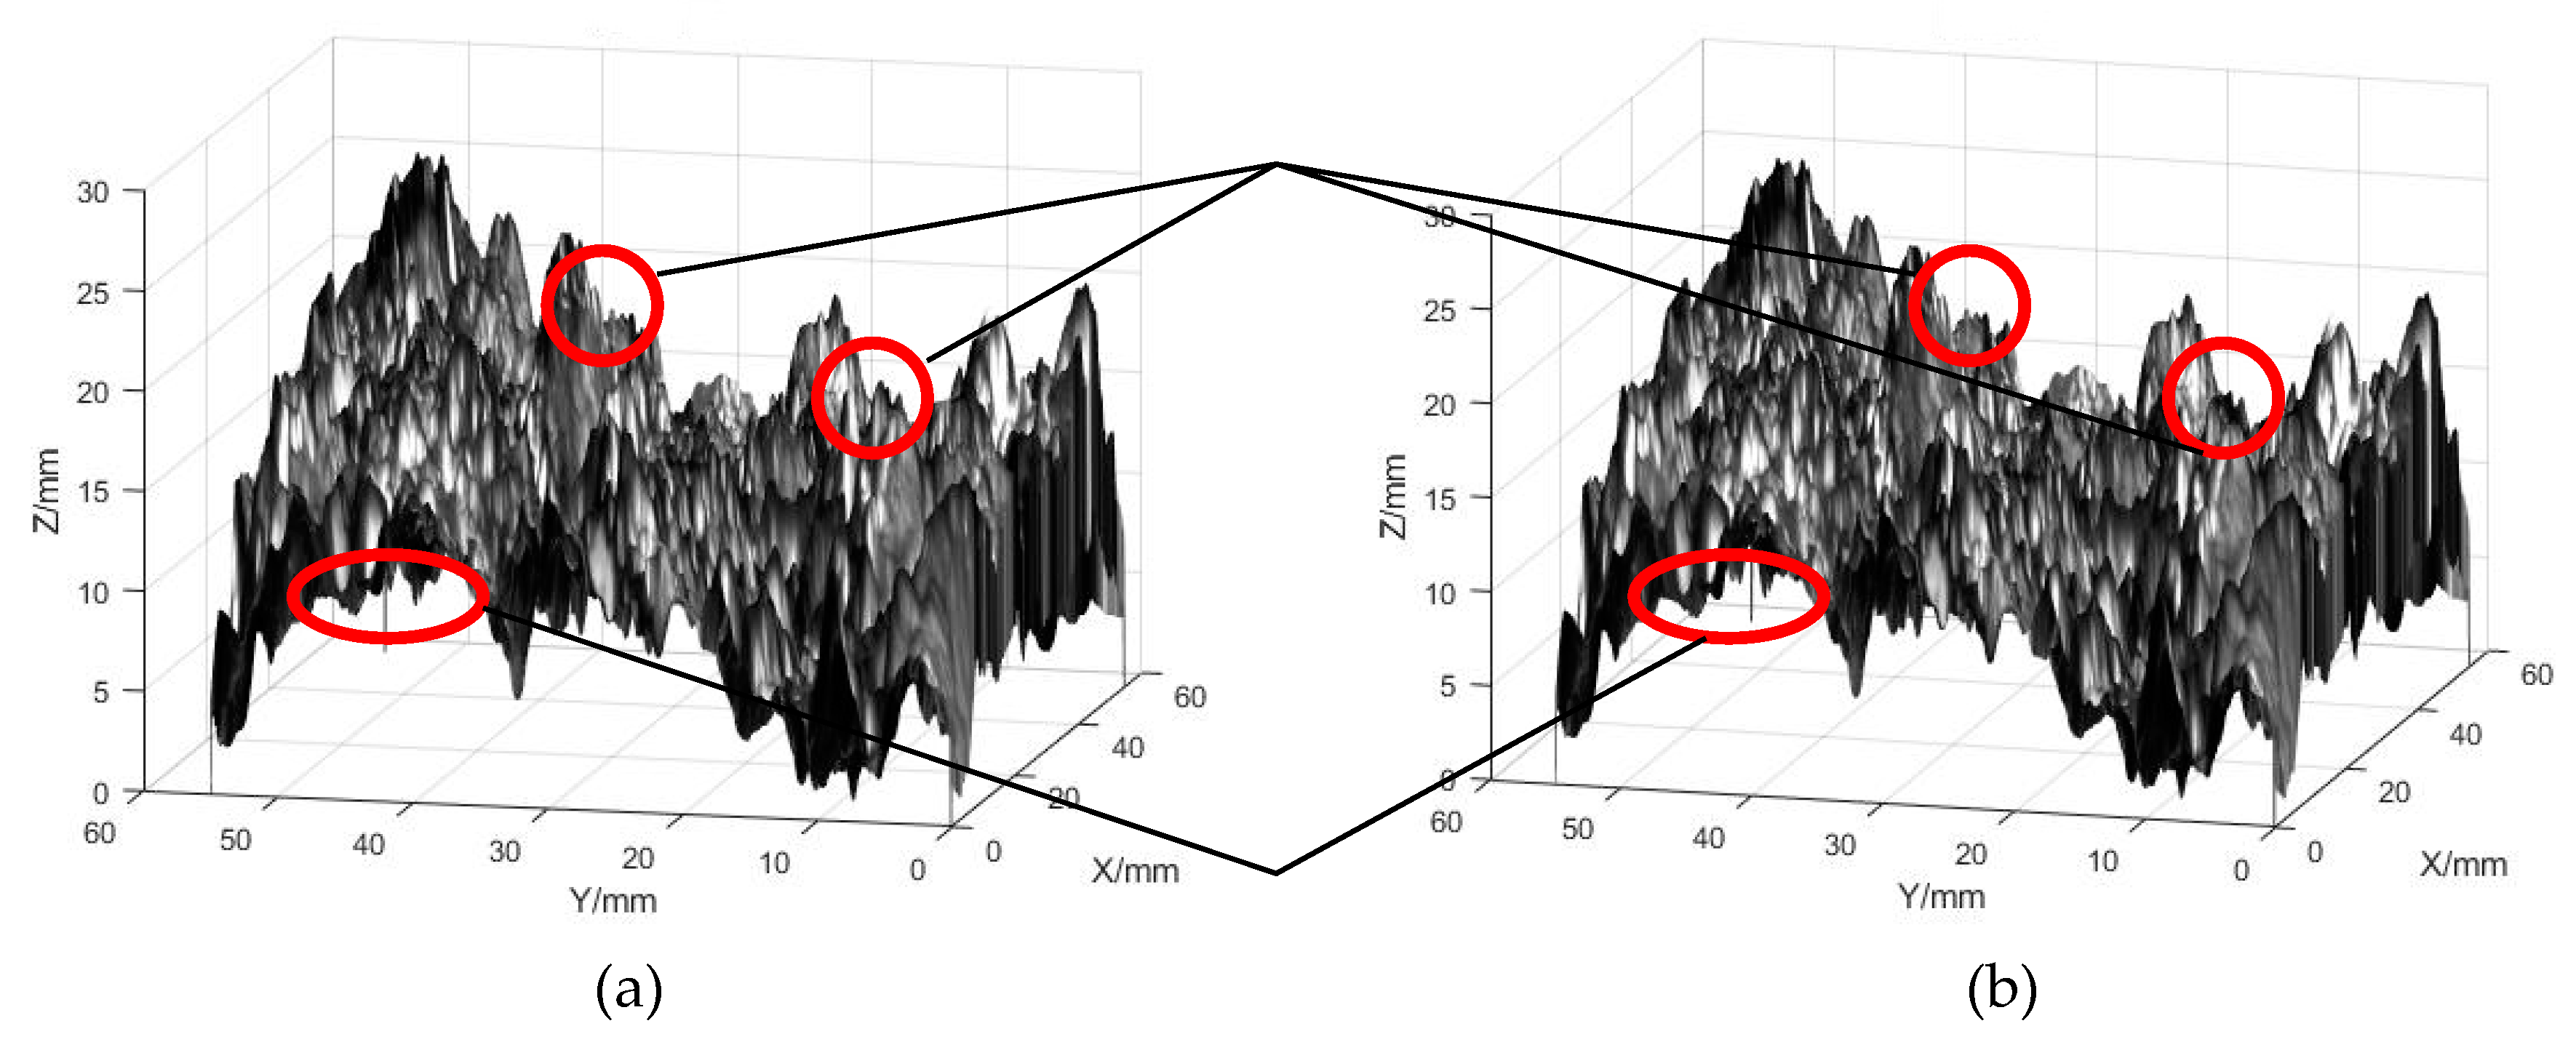
In light of expensive devices measuring pavement texture, three dimensional (3D) measurements by stereophotogrammetry or microscopy were considered to characterize macrotexture of pavement surface [17,18,19,20]. Compared with using two-dimensional (2D) line profiles, measurements in 3D can accurately characterize the roughness of the pavement surface. Firstly, a large amount of data from multiple images can be collected; secondly, 3D models of the pavement surface were established by some software, such as Digital Surf MountainsMap, 3D flow Zephyr, etc; finally, roughness parameters (arithmetic mean skewness, kurtosis, height, etc) were calculated. These parameters could be used to evaluate microtexture, macrotexture, and megatexture.
Asphalt pavement consists of asphalt and aggregates with different sizes [21,22,23,24,25,26,27,28]. Its texture is affected by many factors, such as aggregates type, aggregates sizes, mixture type, etc. Previous studies focused on how to characterize pavement surface texture and the influence of different factors (coarse aggregates type, mixture type, etc) on skid resistance. However, few studies were carried out to analyze the influence of mixture design parameters on skid resistance of pavement with constant coarse aggregates and mixture type. For a certain project, material source and mixture type are constant. Therefore, the skid resistance of pavement mainly depends on design parameters, such as gradation, asphalt content, etc. Although it is well known that the SMA pavement has good skid resistance, the skid resistance is not satisfactory, or its durability is poor when the mixture design is unreasonable [20].
This paper seeks to analyze the influence of mixture design parameters on the skid resistance of SMA pavement. The mixtures were designed with an orthogonal experiment. There were five factors, namely the percentage of aggregates passing the maximum size (PNMSA), the percentage of aggregates passing the sieve size which is only one smaller than the maximum size (PNMSA-1), the percentage of aggregates passing the control sieve size (PCS), the percentage of aggregates passing the sieve size which is only one smaller than the control sieve size (PCS-1), and asphalt content (AC), and each factor had four levels. The skid-resistance index (SI) obtained by the 3D measurement was used to evaluate skid resistance.

2. Materials and Methods

2.1. Materials

2.1.1. Asphalt

The asphalt selected in this paper was Styrene–Butadiene–Styrene (SBS) modified asphalt. The modified asphalt was mixed with virgin asphalt (SK90#) and SBS (Beijing Yan-shan-chan-dao-gai 2#) at a ratio of 3:100 (mass ratio). Its properties were tested according to Chinese specification JTG E20-2011 [29], and the results are shown in Table 1. Moreover, the technical requirements must meet Chinese standard JTG F40-2004) [30].

2.1.2. Aggregate

Aggregates selected in this paper were gneiss. There were four stockpiles with different sizes, namely 10–15 mm, 5–10 mm, 3–5 mm, and 0–3 mm. The first three stockpiles were coarse aggregates and the latter one was fine aggregates. The mineral filler was ground limestone. Their properties were tested according to Chinese specification JTG E42-2005 [31]. Table 2, Table 3 and Table 4 show the physical properties of coarse aggregate, fine aggregate, and mineral filler, respectively.

2.2. Mixture Design

There were four types of SMA with different nominal maximum sizes (NMAS) used in this paper, namely SMA-16, SMA-13, SMA-10, and SMA-5. The Marshall mix design procedure was used for mixture design. The target air voids (VV) were 3.5% and the optimal asphalt content (OAC) could be calculated according to Chinese standard JTG F40-2004 [31]. The OAC of SMA-16, SMA-13, SMA-10, and SMA-5 were 5.7%, 6.3%, 6.5%, and 6.6% respectively.
For SMA pavement, the percent air void in coarse aggregates (VCA) must be verified. There is a controlled sieve size (PCS) in this process. According to Chinese standard JTG F40-2004, PCS with both SMA-16 and SMA-13 are 4.75 mm, PCS with SMA-10 and SMA-5 are 2.36 mm and 1.18 mm respectively. PNMSA and PCS were key factors for SMA gradation design [32]. Moreover, surface texture is affected by AC [8]. Therefore, PNMSA, PNMSA-1, PCS, PCS-1, and AC were selected for mixture design factors. Each factor had four levels.
The mixture design is multi-factorial and multi-leveled. When there are more than three factors, there will be many experiments, thereby making our objectives hard to achieve. Thus, the orthogonal experimental design (OED) was chosen. OED selects some representative points from the comprehensive experiments based on the orthogonality. These representative points have the characteristics of “uniform and dispersion, neat and comparable”. Moreover, OED is the main method of the factorial design, and is a highly efficient, fast, and economical experimental design method. In this paper, OED was applied to analyze the effect of mixture design parameters on the skid resistance of SMA pavement, and orthogonal design table L16(45) was selected. The value of four parameters (PNMSA, PNMSA-1, PCS, and PCS-1) associated with gradations was determined according to gradations ranges in Chinese standard JTG F40-2004. The values of AC were selected according to OAC. Table 5, Table 6, Table 7 and Table 8 show the factors and levels of different SMA types. Table 9 is the orthogonal experimental design table with five factors and four levels for each factor.
It was assumed that there is no interaction between any two factors. SI was used to evaluate skid resistance. The test values of each factor at the constant level i were summed, then the mean values (ki) and range (R) at corresponding levels could be calculated by the following formulas.
k i = S I i 4 ,
R = k max k min ,
where ki represents mean values of SI for each factor at a certain level i (i = 1, 2, 3, 4). The skid resistance is better with higher ki. For each factor, kmax is maximal among four levels, while kmin is the minimum. R reflects the effect order of different factors. The factor has stronger impact on skid resistance with higher R.

2.3. Pavement Surface Texture Characterization

The 3D evaluation parameters of rock surface roughness are various, including arithmetic mean deviation, maximum height, contour root mean square deviation, contour maximum peak height, contour maximum valley depth, contour support area, curved surface slope, etc., up to 17 evaluation parameters [33]. For the 3D geometric features characterization of a rough surface, it is often necessary to select several representative parameters for evaluation, which may result in a comparative one-sided evaluation, and not a comprehensive or accurate characterization of the rough surface.
Belem et al. proposed five typical 3D evaluation parameters to quantitatively characterize the rock joint features, including mean of elementary inclination angle over the whole surface ( θ s ), root-mean-square of the joint surface gradient ( Z 2 s ), apparent anisotropy degree ( K a ), surface roughness coefficient ( R s ), and surface tortuosity coefficient ( T s ) [34]. These parameters were not affected by the direction of the axis, which could accurately and stably reflect the geometric characteristics of the 3D rock joint surface. In addition, the sensitivity of the five parameters to the changes in surface geometry was different [35]. Therefore, the parameters had convenient applicability.
This paper selected the five parameters to characterize pavement texture. SI was used to evaluation skid resistance, and its calculation method was according to previous research [20]. Test specimens were slabs with a geometric size of 300 mm (length) × 300 mm (width) × 50 mm (height) produced according to Chinese specification JTG E20-2011. There were three specimens for SMA pavement with the same mixture type and gradation. Due to the large amount of data acquired by the images, it had a significant impact on the calculation speed and efficiency. There was a significant difference in the aggregate size, so the calculated area was selected according to the mixture types. The analysis area of SMA-16 and SMA-13 was about 100 mm (length) × 100 mm (width), while for SMA-10 and SMA-5, the analysis area was 55 mm(length) × 55 mm(width). Each specimen was tested three times in different places.

2.3.1. Establishing 3D Models of Pavement Texture

The pavement texture images were collected by a digital camera, and then the images were subjected to a series of processes, such as spraying a developer, filtering, etc. The processed photos were imported into a computer, and the 3D models of pavement texture were established. Figure 1 shows the 3D models of pavement texture.

2.3.2. Calculation of SI

The five parameters ( θ s , Z 2 s , K a , R s , T s ) could be obtained based on the 3D models of pavement texture. The value of SI represents the skid resistance. The principal components analysis (PCA) was used to analyze the relationship between these five parameters and SI [20]. Then, SI could be calculated by the following formulas. The skid resistance is better with higher SI.
Z 1 = 0.966 θ s 0.723 K a + 0.913 Z 2 s + 0.984 R s + 0.984 T s
Z 2 = 0.149 θ s 0.690 K a + 0.051 Z 2 s + 0.157 R s + 0.157 T s
S I = 0.84488 Z 1 + 0.10992 Z 2

3. Results

SI was used to evaluate skid resistance. As mentioned before, ki represents mean values of SI for each factor at a certain level i (i = 1, 2, 3, 4), and R reflects the effect order of different factors. The above three parameters could be calculated by the corresponding formula. Table 10, Table 11, Table 12 and Table 13 show the calculation results.
Table 10, Table 11, Table 12 and Table 13 show the skid resistance of SMA-16, SMA-13, SMA-10, and SMA-5 respectively. The following conclusions can be drawn from these tables.
  • For different SMA types, the effect order of the three factors (PNMSA, PCS, and AC) is constant. Among them, PNMSA has the greatest impact on the skid resistance, AC is the second, and the impact of PCS on skid resistance is the smallest. Moreover, the three parameters have higher impact on skid resistance than the other two parameters in general. It is obvious that the three parameters are the key parameters to improve skid resistance.
  • The effect order of PNMSA-1 and PCS-1 with different SMA types is various. For SMA-16, PNMSA-1 has a greater impact on skid resistance than PCS-1, but the conclusion is the opposite for SMA-13.
  • For PNMSA-1, SMA pavements with different mixture types have the best skid resistance at the level (i = 1). For other design parameters, the corresponding levels (i) with different mixture types are significantly different when the skid resistance is best.
  • Taking SMA-13 as an example, AC (5.6%) is lower than OAC (6.3%) when the skid resistance is best. It is possible that the surface texture of SMA pavement with lower AC is richer, resulting in better skid resistance. It is noticed that the pavement may have excellent skid resistance but poor pavement performance when AC is 5.6%. Therefore, the determination of the best design parameters should be considered both skid resistance and pavement performance.
The influence of each factor on the skid resistance of SMA pavement could be intuitively determined by the trend of ki with different levels. For each factor, the value increased with levels.

3.1. The Influence of NMAS on Skid Resistance

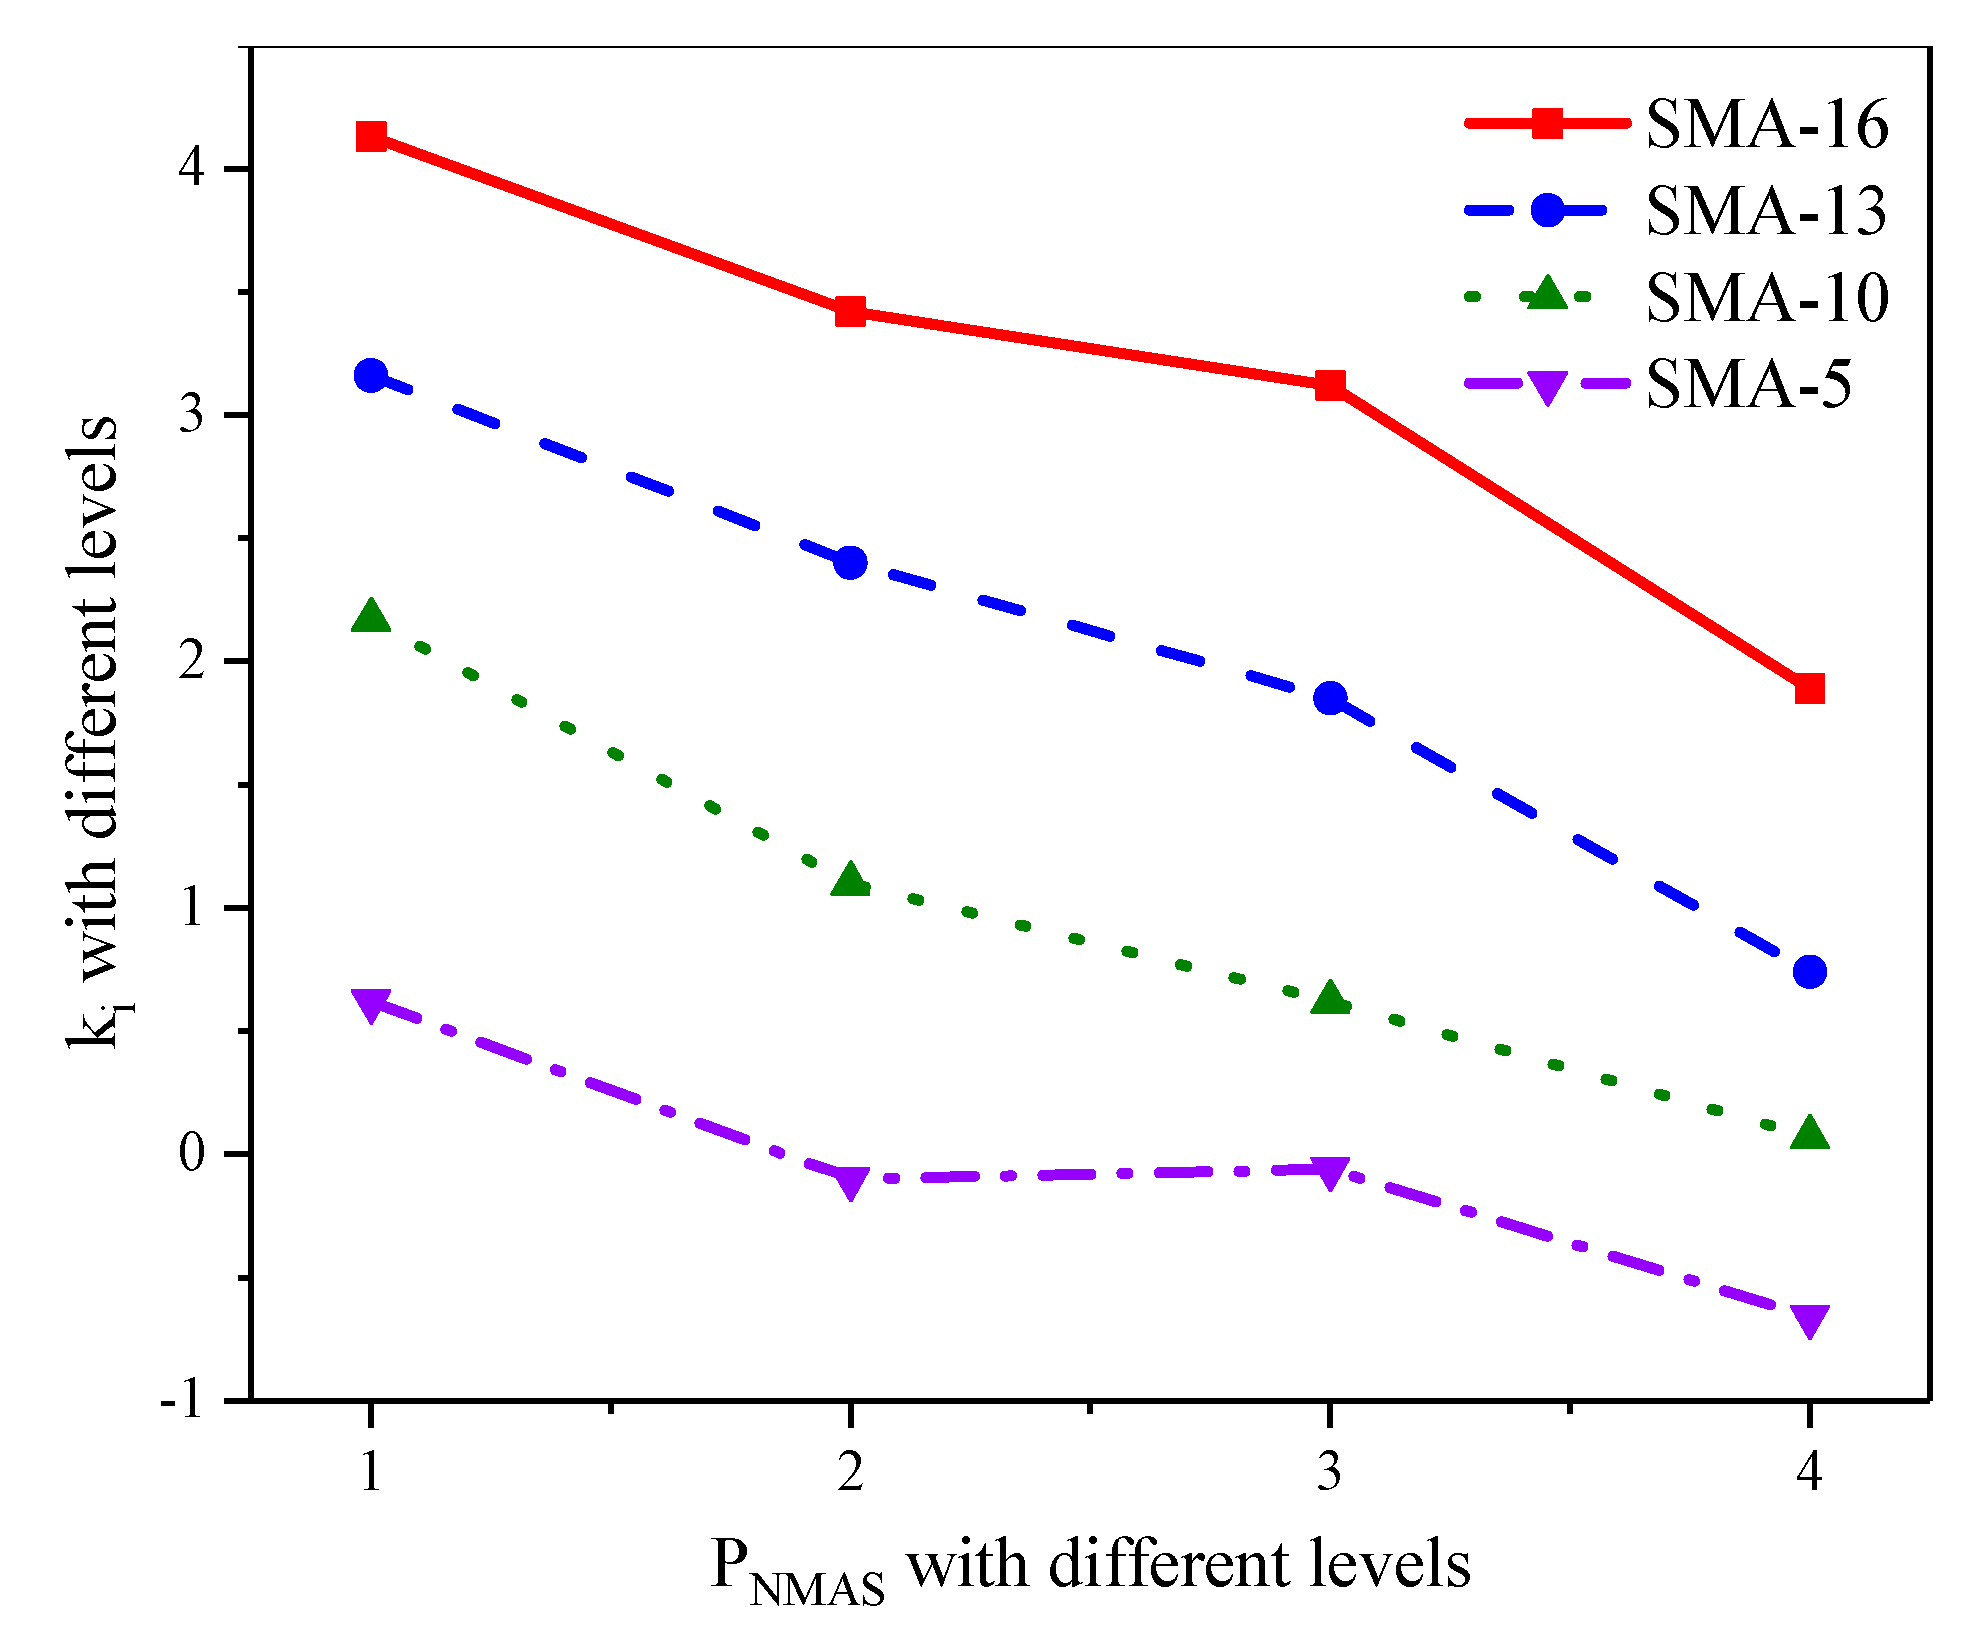
Figure 2 shows the relationship between PNMAS and the skid resistance of SMA pavement. It can be seen that the skid resistance gradually reduces with the increasing of PNMAS. PNMAS refers to percentage of aggregates passing of the maximum size. Lower PNMAS means more aggregates remaining on the sieve. The macrotexture of asphalt pavement is mainly contributed by the coarse aggregate. The content of aggregates with the size larger than nominal maximum size leads to richer macrotexture, resulting in better skid resistance.

3.2. The Influence of Control Sieve Percent on Skid Resistance

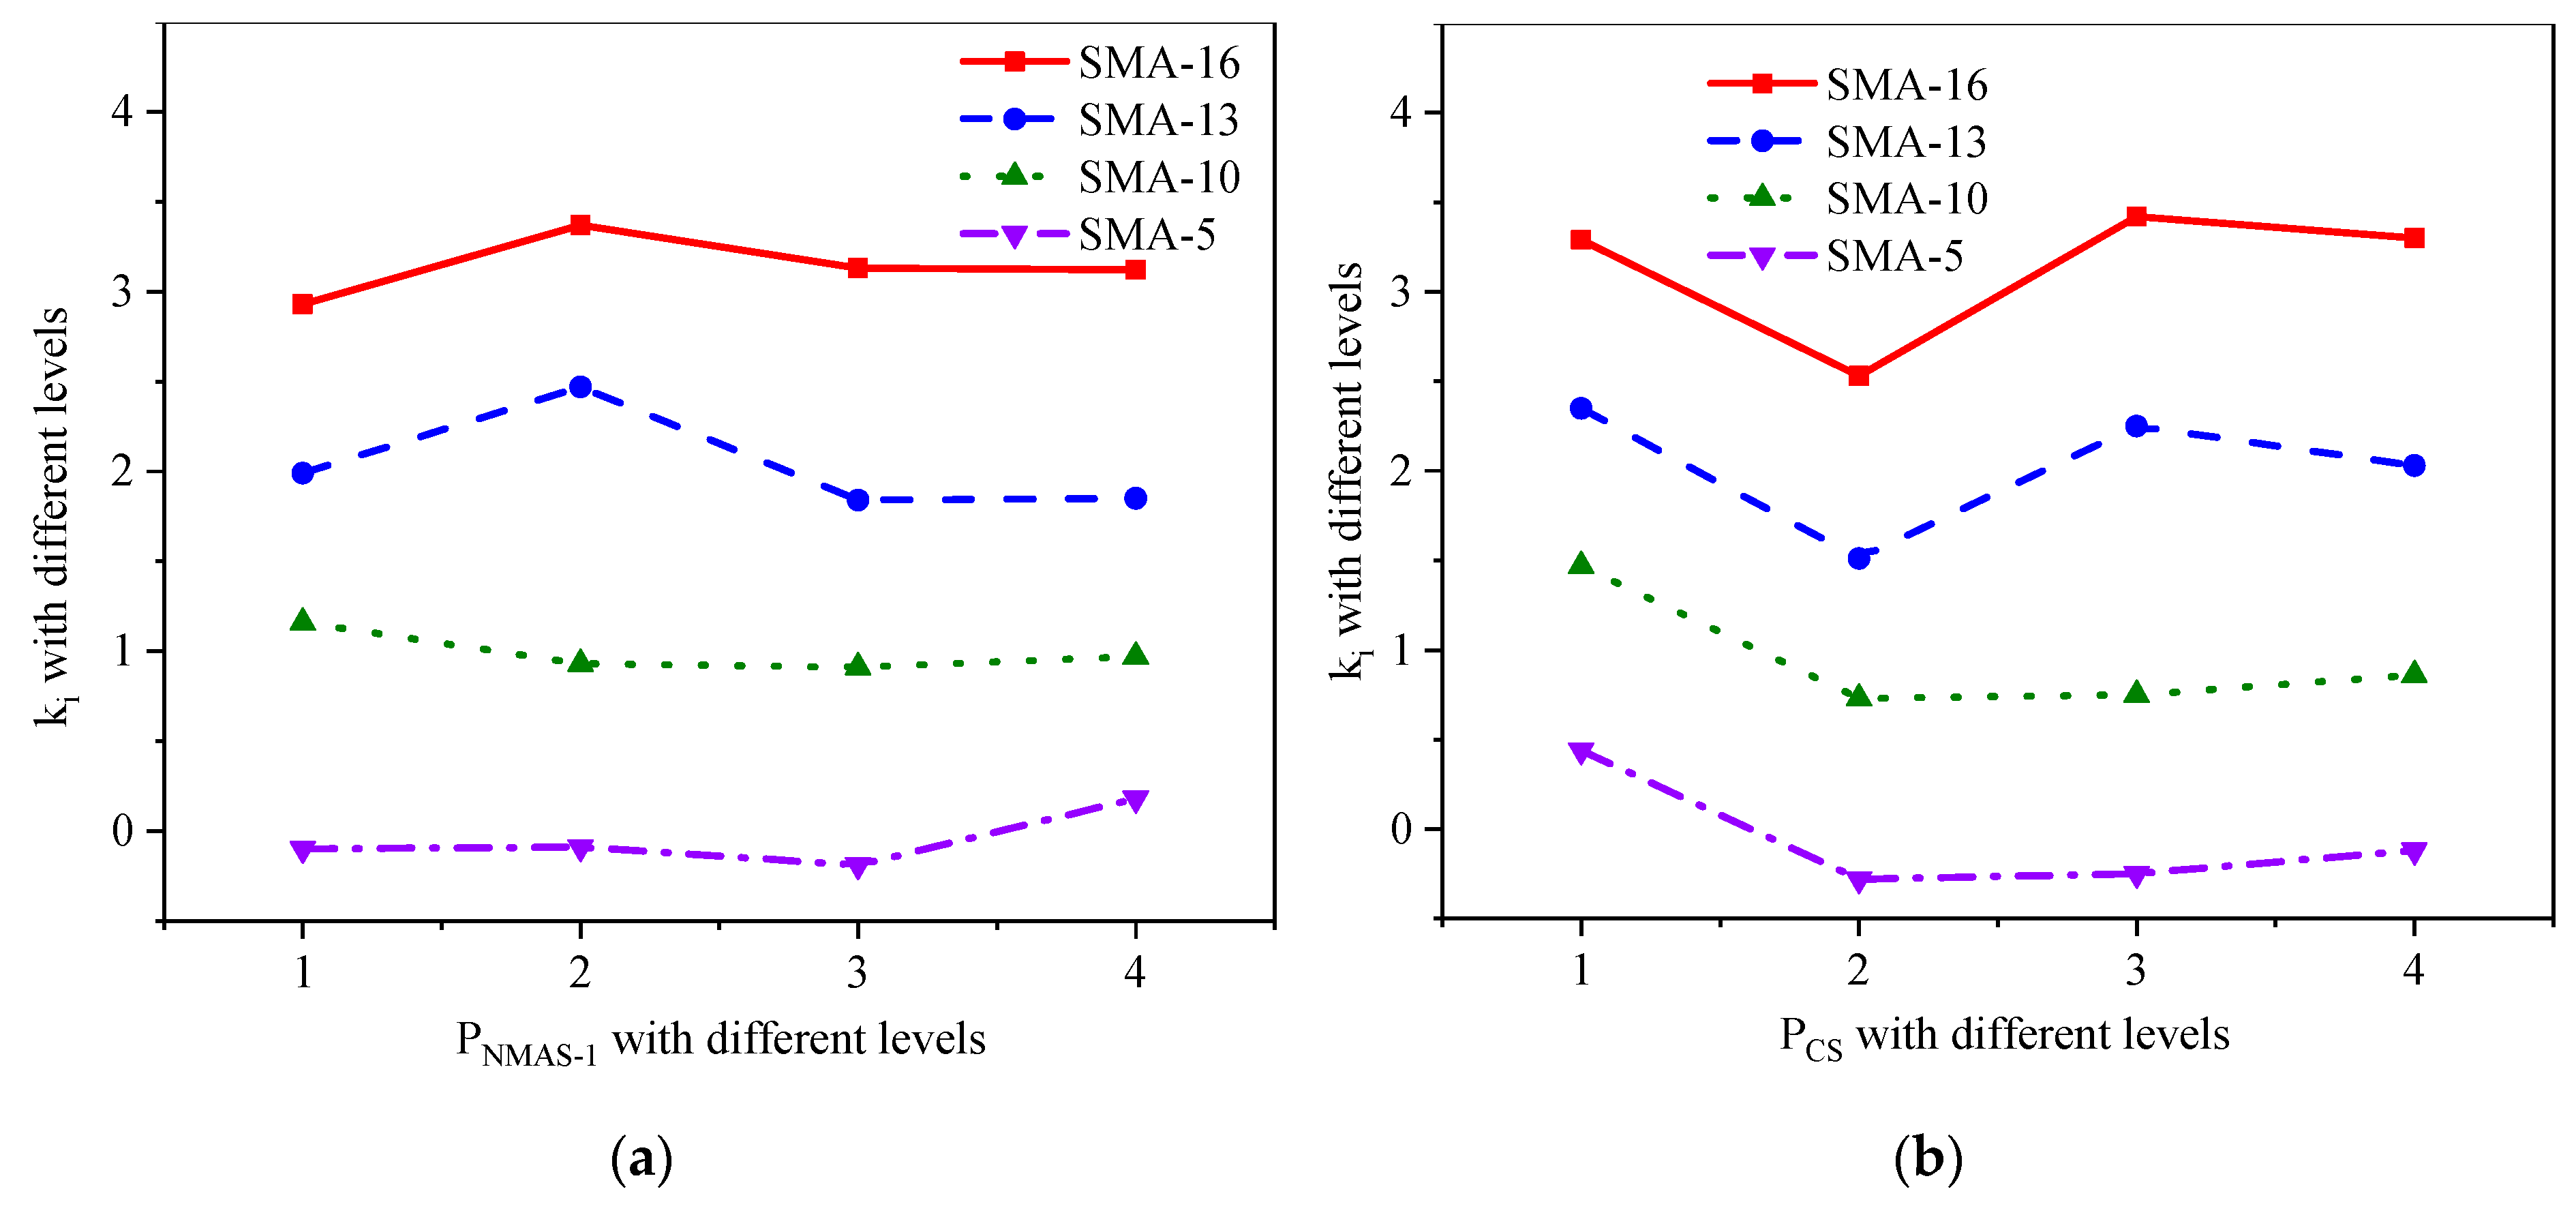
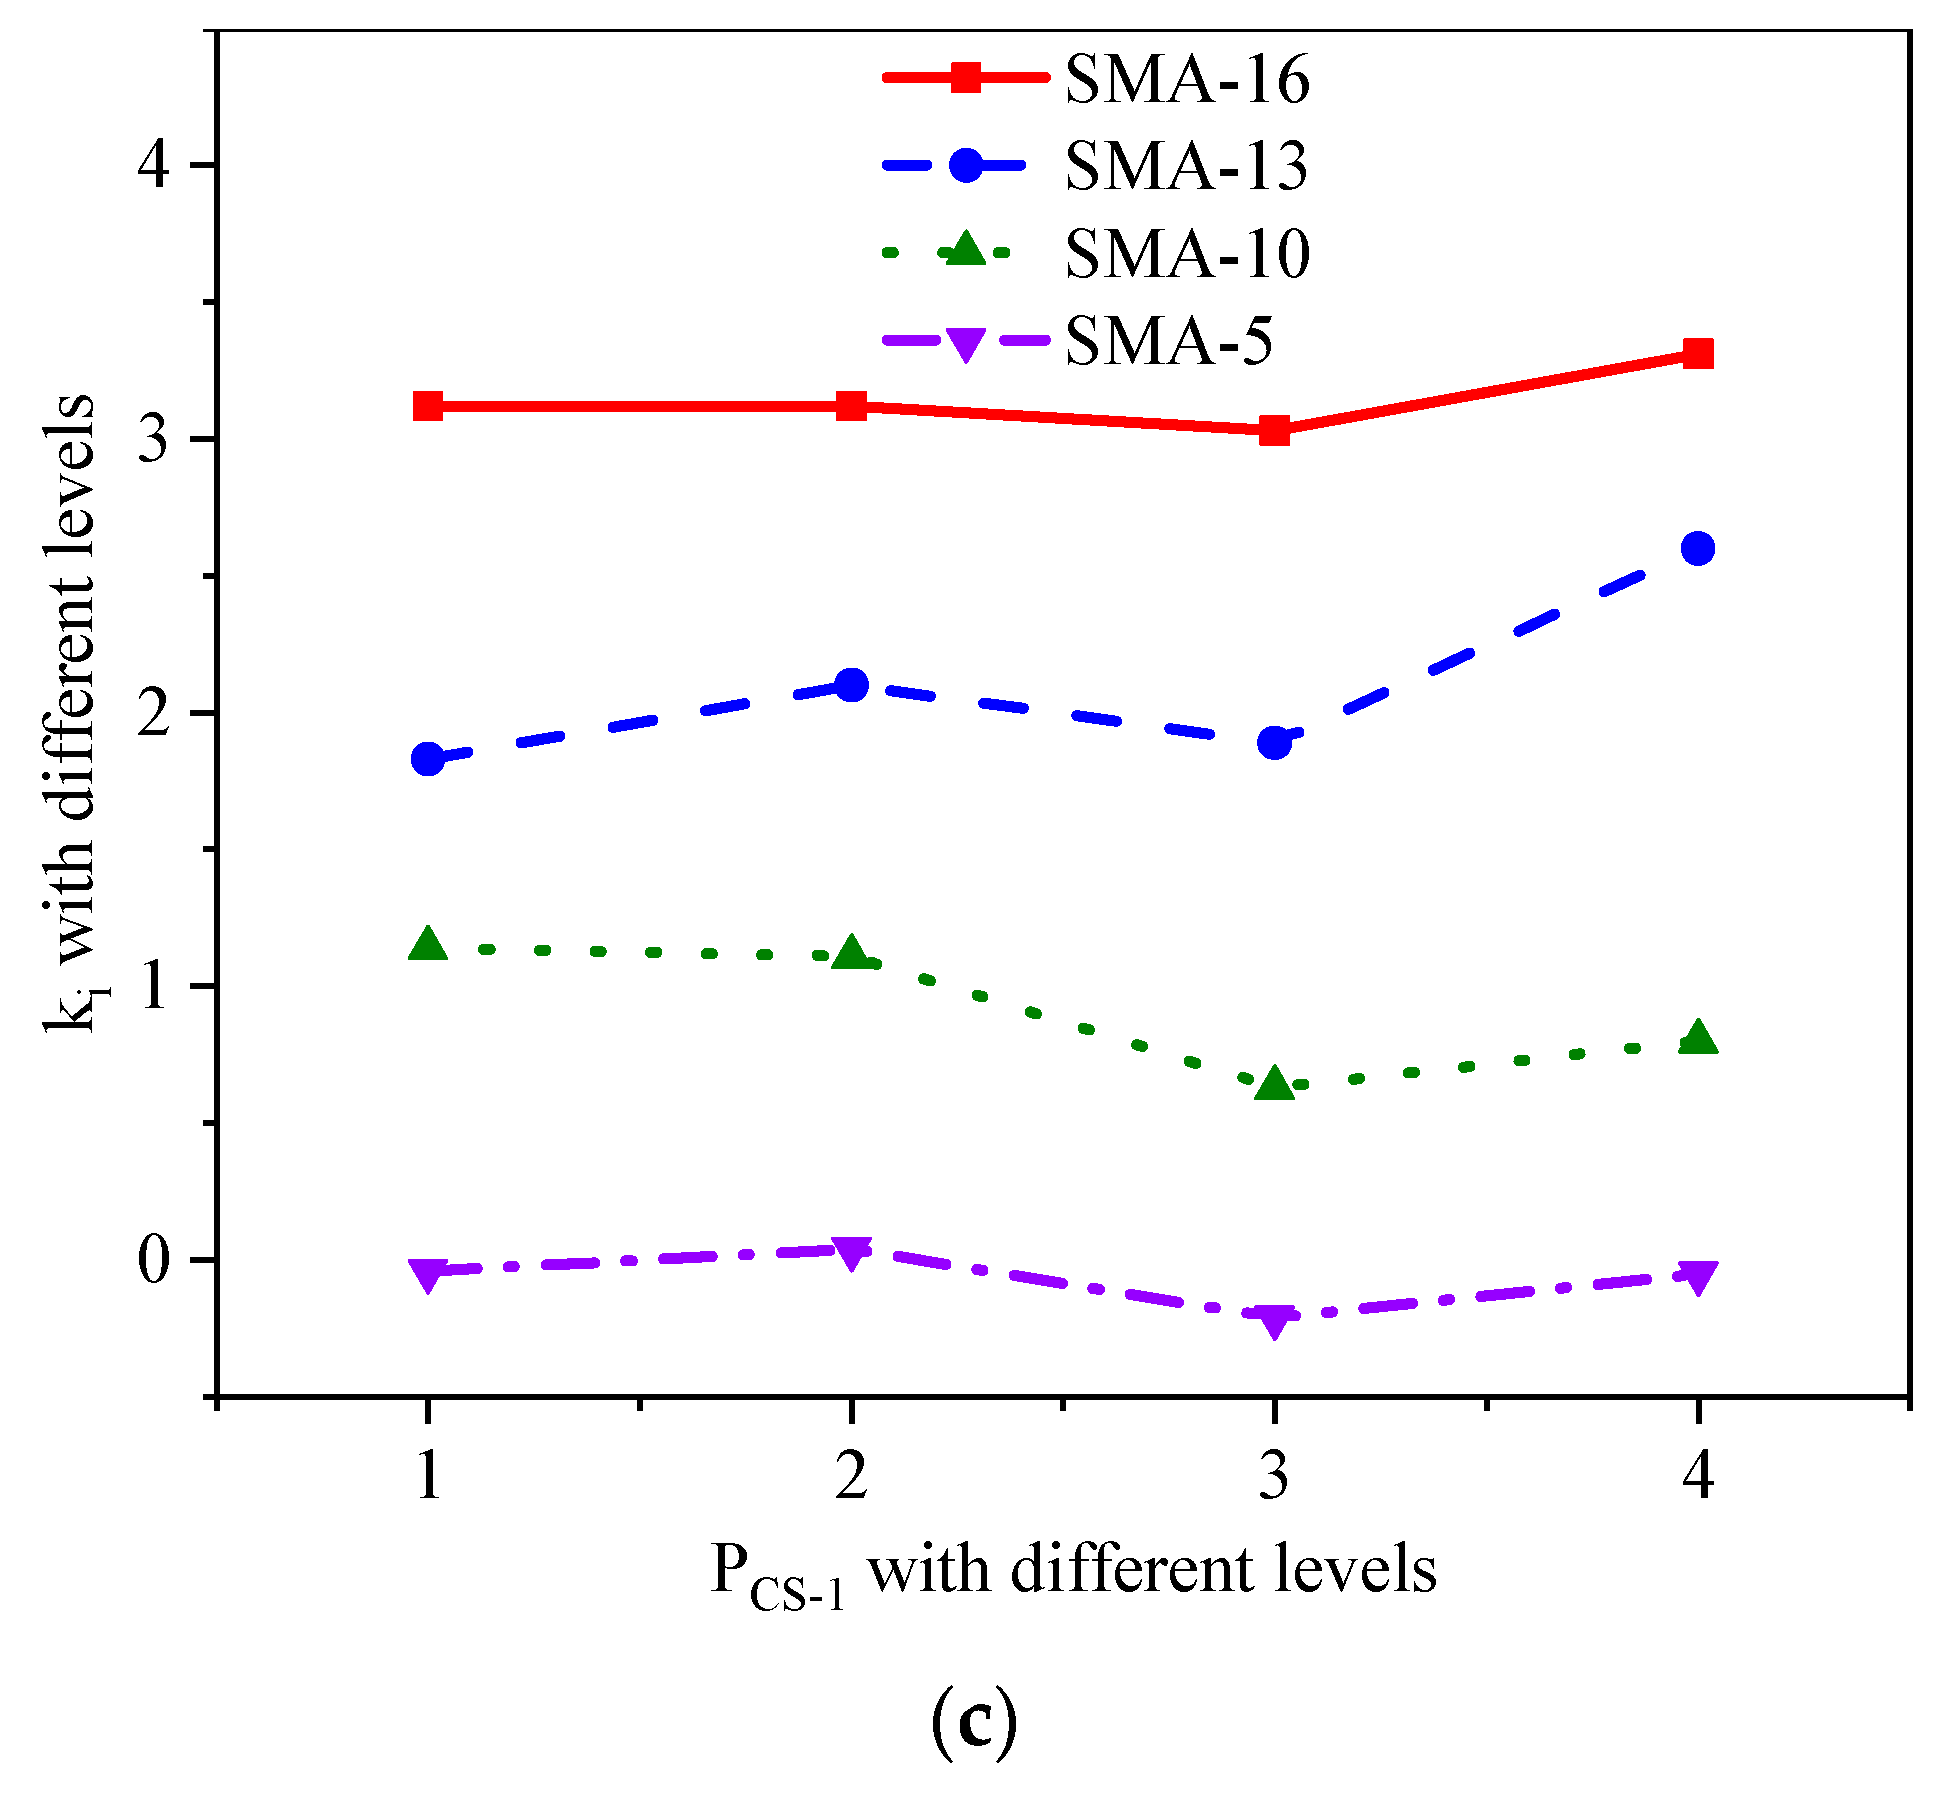
Figure 3 shows the relationship between the percentage passing several control sieves and skid resistance of SMA pavement. With increasing PCS, the trend of ki with different mixture types stays the same, which first decreases and then increases. It means that the skid resistance of SMA pavement first decreases and then increases with increasing PCS. For PNMAS-1 and PCS-1, ki with different mixture types and levels of factors is various. However, the value of ki does not change much, indicating that PNMAS-1 and PCS-1 have an insignificant effect on skid resistance of SMA pavement.

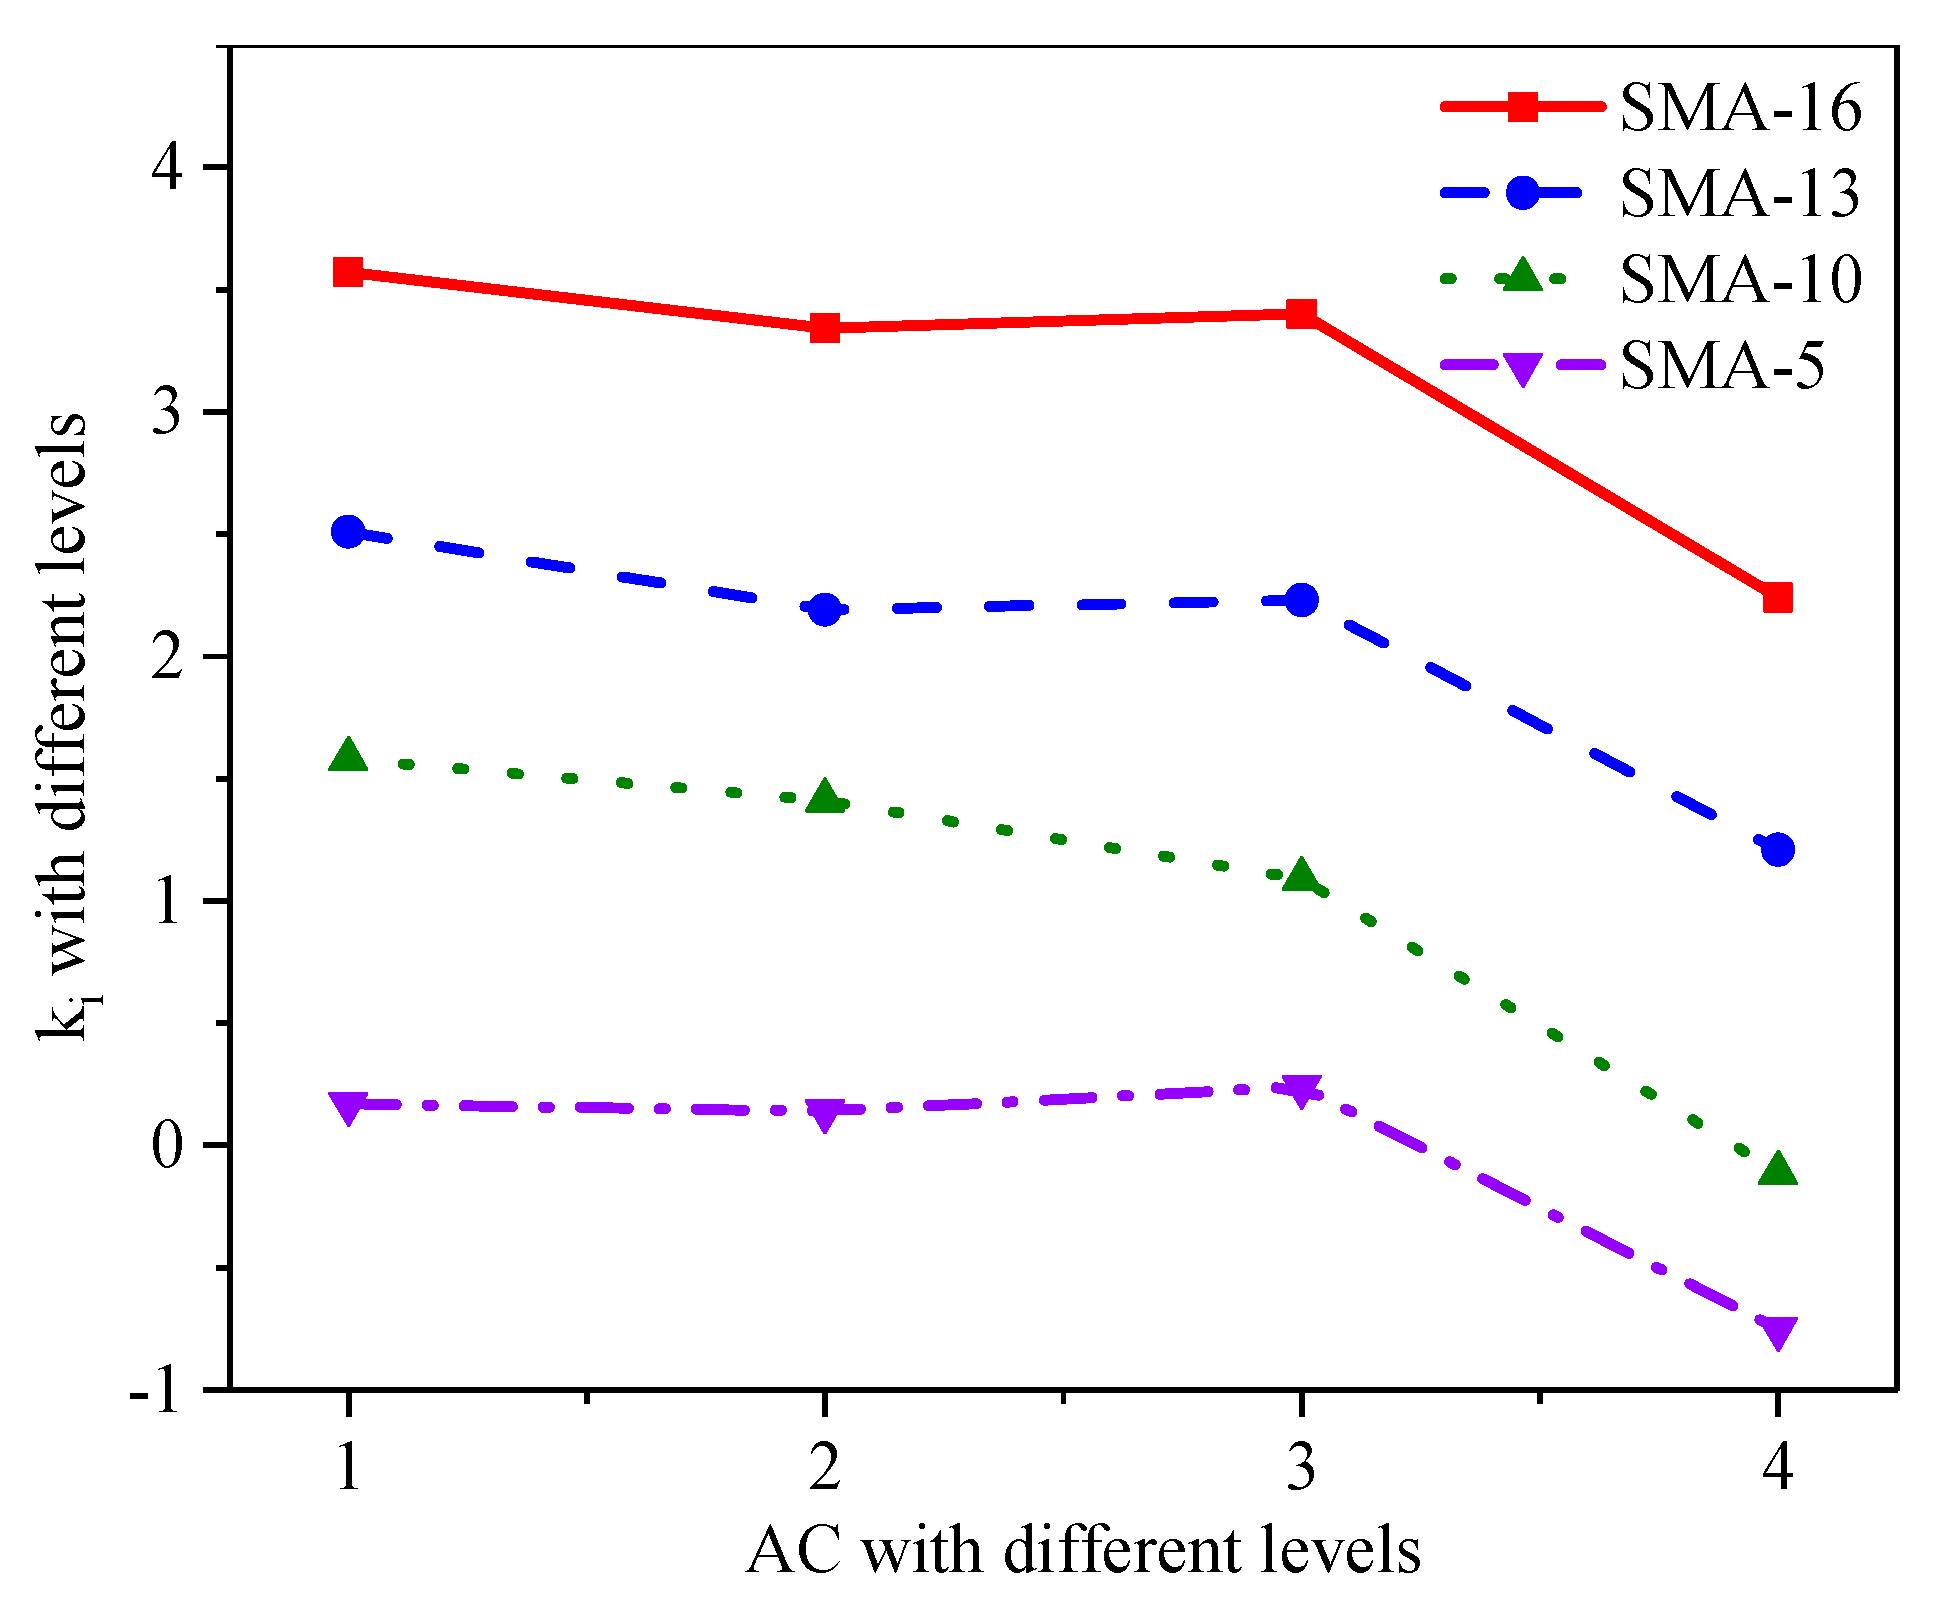
3.3. The Influence of AC on Skid Resistance

Figure 4 shows the relationship between AC and the skid resistance of SMA pavement.
It can be seen that the trend of ki is consistent for different mixture types in general with increasing AC. ki gradually decreases as AC increases, indicating that the skid resistance decreases. This is mainly due to the fact that when AC increases, the asphalt film is thicker, resulting in a smaller macrotexture, which leads to weaker skid resistance. It is noticed that the trend of ki of SMA-5 is significantly different from the other SMA types. ki first increases and then decreases with increasing AC. When the aggregates sizes are small enough, the compaction work during the specimen process may lead to rearrangement of aggregates, resulting in an abnormality in the gradation. It may have an impact on skid resistance.

4. Conclusions

  • The three parameters (PNMSA, PCS, and AC) are the key parameters to improve skid resistance. Among them, PNMSA may have the greatest impact on the skid resistance, AC is the second, and the impact of PCS on skid resistance is the smallest. Moreover, these three parameters have higher impact on skid resistance than the other two parameters (PNMSA-1, PCS-1) in general.
  • The skid resistance of SMA pavement decreases gradually with the increasing PNMSA and AC; the skid resistance of SMA pavement first decrease and then increase as PCS increases.
  • For PNMAS-1 and PCS-1, the skid resistance of SMA pavement with different mixture types and levels of factors varies. However, there is no obvious difference between them, indicating that PNMAS-1 and PCS-1 have insignificant effect on skid resistance of SMA pavement.
  • When the aggregates sizes are small enough, experimental conditions may have an impact on the skid resistance.
  • The best design parameters are proposed, but the results only consider skid resistance. In order to determine optimal design parameters, both skid resistance and pavement performance must be considered.

Author Contributions

Conceptualization, Y.L. and X.C., methodology, Y.L. and X.C., data curation, X.C. and Z.Y.; formal analysis, X.C. and Z.Y., writing—original draft preparation, X.C. and Z.Y., writing—review and editing, Y.L.

Funding

This research was funded by the National Natural Science Foundation of China (No. 51608048). The authors are very grateful for their financial support.

Conflicts of Interest

The authors declare no conflict of interest.

References

  1. Board, H.R. Skid Resistance; National Cooperative Highway Research Program Synthesis of Highway Practice 14; National Academy of Sciences: Washington, WA, USA, 1972. [Google Scholar]
  2. Wallman, C.-G.; Åström, H. Friction Measurement Methods and the Correlation between Road Friction and Traffic Safety; VTI Meddelande 911A; A Literature Review Report of the Swedish National Road and Traffic Institute: Linköping, Sweden, 2001; Available online: https://pdfs.Semanticschol-ar.org/142b/145fb1b5a2dc1a9b8c1f0b0145d972e9fea0.pdf. (accessed on 2 December 2019).
  3. Cairney, P. Skid Resistance and Crashes; A Review of the Literature Research Report ARR 311; ARRB Transport Research: Vermont, VT, USA, 1997. [Google Scholar]
  4. Kummer, H.W.; Meyer, W.E. Penn State Road Surface Friction Tester as Adapted to Routine Measurement of Pavement Skid Resistance; 42nd Annual Meeting; Road Surface Properties: Washington, WA, USA, 1963. [Google Scholar]
  5. Moore, D.F. The Friction and Lubrication of Elastomers; Pergamon Press: Oxford, UK, 1972. [Google Scholar]
  6. Moore, D.F. The Friction of Pneumatic Tires; Elsevier Scientific Publishing: Amsterdam, The Netherlands, 1975. [Google Scholar]
  7. PIARC. Report of The Committee on Surface Characteristics. In Permanent International Association of Road Congress; (PIARC) XVIII World Road Congress: Brussels, Belgium, 1987. [Google Scholar]
  8. Kogbara, R.B.; Masad, E.A.; Kassem, E. A state-of-the-art review of parameters influencing measurement and modeling of skid resistance of asphalt pavements. Constr. Build. Mater. 2016, 114, 602–617. [Google Scholar] [CrossRef]
  9. Hall, J.W.; Smith, K.L.; Titus-Glover, L. Guide for Pavement Friction; Project No. 1–43, Final Guide, National Cooperative Highway Research Program; Transportation Research Board, National Research Council: Washington, WA, USA, 2009. [Google Scholar]
  10. Stroup-Gardiner, M.; Studdard, J.; Wagner, C. Evaluation of hot mix asphalt macro-and microtexture. J. Test. Eval. 2004, 32, 7–16. [Google Scholar] [CrossRef]
  11. Liu, Y.; Fwa, T.F.; Choo, Y.S. Effect of surface macrotexture on skid resistance measurements by the British Pendulum Test. J. Test. Eval. 2004, 32, 304–309. [Google Scholar] [CrossRef]
  12. Kassem, E.; Awed, A.; Masad, E. Development of predictive model for skid loss of asphalt pavements. Transp. Res. Rec. 2013, 2372, 83–96. [Google Scholar] [CrossRef]
  13. Wu, Z.; King, B.; Abadie, C. Development of design procedure to predict asphalt pavement skid resistance. Transp. Res. Rec. 2012, 2306, 161–170. [Google Scholar] [CrossRef]
  14. Flintsch, G.W.; De León, E.; McGhee, K.K. Pavement surface macrotexture measurement and application. Transp. Res. Rec. 2003, 1860, 168–177. [Google Scholar] [CrossRef]
  15. Miller, T.; Swiertz, D.; Tashman, L. Characterization of Asphalt Pavement Surface Texture. J. Transp. Res. Board 2012, 2295, 19–26. [Google Scholar] [CrossRef]
  16. Bitelli, G.; Simone, A.; Girardi, F. Laser Scanning on Road Pavements: A New Approach for Characterizing Surface Texture. Sensors 2012, 12, 9110–9128. [Google Scholar] [CrossRef] [PubMed]
  17. Dunford, A.; Parry, A.R.; Shipway, P.H. Three-dimensional characterisation of surface texture for road stones undergoing simulated traffic wear. Wear 2012, 292–293, 188–196. [Google Scholar] [CrossRef]
  18. Woodward, D.; Millar, P.; McQuaid, G. Use of 3D Modelling Techniques to Better Understand Road Surface Textures. In Proceedings of the 4th International Safer Roads Conference, Cheltenham, UK, 18–21 May 2014. [Google Scholar]
  19. McQuaid, G.; Millar, P.; Woodward, D. Use of 3D Modeling to Assess Pothole Growth. In Proceedings of the 6th International Conference on Bituminous Mixtures and Pavements, Thessaloniki, Greece, 10–12 June 2015; Nikolaides, A.F., Ed.; Taylor and Francis Group: London, UK, 2015; pp. 161–166. [Google Scholar]
  20. Liu, Y. Study on the Mixture Design for Stone Mastic Asphalt Based on Skid-resistance and Tire/Pavement Noise. Ph.D. Thesis, Chang’an University, Xi’an, China, 2008. [Google Scholar]
  21. Fallah, F.; Khabaz, F.; Kim, Y. Molecular dynamics modeling and simulation of bituminous binder chemical aging due to variation of oxidation level and saturate-aromatic-resin-asphaltene fraction. Fuel 2019, 237, 71–80. [Google Scholar] [CrossRef]
  22. Cheng, Y.; Yu, D.; Gong, Y. Laboratory evaluations on performance of Eco-Friendly basalt fiber and diatomite compound modified asphalt mixture. Materials 2018, 11, 2400. [Google Scholar] [CrossRef] [PubMed]
  23. Li, D.; Greenfield, M. Chemical compositions of improved model asphalt systems for molecular simulations. Fuel 2014, 115, 347–356. [Google Scholar] [CrossRef]
  24. Khabaz, F.; Khare, R. Molecular simulations of asphalt rheology: Application of time–temperature superposition principle. J. Rheol. 2018, 62, 941–953. [Google Scholar] [CrossRef]
  25. Lemarchand, C.; Greenfield, M.; Dyre, J. ROSE bitumen: Mesoscopic model of bitumen and bituminous mixtures. J. Chem. Phys. 2018, 149, 214901. [Google Scholar] [CrossRef] [PubMed]
  26. Li, D.; Greenfield, M. Viscosity, relaxation time, and dynamics within a model asphalt of larger molecules. J. Chem. Phys. 2014, 140, 034507. [Google Scholar] [CrossRef] [PubMed]
  27. Khabaz, F.; Khare, R. Glass transition and molecular mobility in Styrene−Butadiene rubber modified asphalt. J. Chem. Phys. B 2015, 119, 14261–14269. [Google Scholar] [CrossRef] [PubMed]
  28. Huang, X.; Eldouma, I.B. Experimental Study to Determine the Most Preferred Additive for Improving Asphalt Performance Using Polypropylene, Crumb Rubber, and Tafpack Super in Medium and High-Temperature Range. Appl. Sci. 2019, 9, 1567. [Google Scholar]
  29. JTJ E20-2011. Standard Test Methods of Bitumen and Bituminous Mixtures for Highway Engineering; Ministry of Communication: Beijing, China, 2011.
  30. JTG F40–2004. Technical Specification for Construction of Highway Asphalt Pavement; Ministry of Transport of the People’s Republic of China: Beijing, China, 2004.
  31. JTG E42-2005. Test Methods of Aggregate for Highway Engineering; Ministry of Transport of the People’s Republic of China: Beijing, China, 2005.
  32. Ma, B. Study on Mixture Design Method of Stone Matrix Asphalt Pavement Based on Skid Resistance. Master’s Thesis, Chang’an University, Xi’an, China, 2012. [Google Scholar]
  33. Yang, B.; Jiang, S. The study on the 3D assessment of surface roughness. Mach. Des. Res. 2002, 18, 64–67. [Google Scholar]
  34. Belem, T.; Homand-Etienne, F.; Souley, M. Quantitative Parameters for Rock Joint Surface Roughness. Rock Mech. Rock Eng. 2000, 33, 217–242. [Google Scholar] [CrossRef]
  35. Li, Q. Quantitative Research of Three-Dimensional Paramaters for Rock Joint Surface Roughness. In Proceedings of the 7th of Chinese Society for Rock Mechanics & Engineering, Xi’an, China, 10–12 September 2002. [Google Scholar]
Figure 1. The 3D models of pavement texture: (a) the model before filtering; (b) the model after filtering.
Applsci 09 05171 g001
Figure 2. Relationship between PNMAS and skid resistance of SMA pavement.
Applsci 09 05171 g002
Figure 3. Relationship between the percentage passing several control sieves and skid resistance of SMA pavement: (a) the influence of PNMAS-1 on skid resistance; (b) the influence of PCS on skid resistance; (c) the influence of PCS-1 on skid resistance.
Applsci 09 05171 g003aApplsci 09 05171 g003b
Figure 4. Relationship between AC and skid resistance of SMA pavement.
Applsci 09 05171 g004
Table 1. Physical properties of Styrene–Butadiene–Styrene (SBS) modified asphalt.
Test ItemsUnitValueTechnical Requirements [30]Specification [29]
25 °C penetration0.1 mm70.360–80T0604
Penetration Index\0.291≥−0.4T0604
Softening Point (TR&B)°C88.2≥55T0606
Ductility at 15 °Ccm≥100≥100T0605
Viscosity at 135 °CPa.s2.202.0–3T0625
Table 2. Physical properties of coarse aggregate.
Test ItemsUnit Value Technical Requirements [30]Specification [31]
10–15 mm5–10 mm3–5 mm
Crushing value%13.1≤26T0316
Los Angeles abrasion%11.6≤28T0317
Apparent relative density2.7532.7762.772≥2.60T0304
Bulk relative density2.6922.6332.701 T0304
Water absorption%0.2850.460.41≤2.0T0304
Flat or elongated%4.45.3≤15T0312
Table 3. Physical properties of fine aggregate.
Test ItemsUnitValueTechnical Requirements [30]Specification [31]
Apparent relative density2.775≥2.50T0330
Mud content (percent of <0.075 mm)%1.3≤3T0333
Sand equivalent%95.2≥60T0334
Angularitys57.6≥30T0344
Table 4. Physical properties of mineral filler.
Test ItemsUnitValueTechnical Requirements [30]Specification [31]
Apparent relative density2.719≥2.50T0352
Water absorption%0.2≤1.0T0352
Grain sizes <0.6 mm%100.0100T0351
<0.15 mm%96.090–100
<0.075 mm%89.375–100
Hydrophilic coefficient0.69≤1T0354
Table 5. The factors and levels of stone mastic asphalt (SMA)-16.
Level iABCDE
PNMSA/%PNMSA-1/%PCS/%PCS-1/%AC/%
16 mm13.2 mm4.75 mm2.36 mm
1906520155.6
2937124185.9
3967828216.2
41008532246.5
Table 6. The factors and levels of SMA-13.
Level iABCDE
PNMSA/%PNMSA-1/%PCS/%PCS-1/%AC/%
13.2 mm9.5 mm4.75 mm2.36 mm
1905020155.6
2935824185.9
3966629226.2
41007534266.5
Table 7. The factors and levels of SMA-10.
Level iABCDE
PNMSA/%PNMSA-1/%PCS/%PCS-1/%AC/%
9.5 mm4.75 mm2.36 mm1.18 mm
1902820145.6
2933924185.9
3965028226.2
41006032266.5
Table 8. The factors and levels of SMA-5.
Level iABCDE
PNMSA/%PNMSA-1/%PCS/%PCS-1/%AC/%
4.75 mm2.36 mm1.18 mm0.6 mm
1902822185.8
2934027216.2
3965232246.6
41006536287.0
Table 9. The orthogonal experimental design table L16(45).
Experiment NumberFactors and Levels
ABCDE
111111
212222
313333
414444
521234
622143
723412
824321
931342
1032431
1133124
1234213
1341423
1442314
1543241
1644132
Table 10. The skid resistance of SMA-16.
Experiment NumberABCDESI
PNMSA/%PNMSA-1/%PCS/%PCS-1/%AC/%
11(90)1(65)1(20)1(15)1(5.6)4.455
212(71)2(24)2(18)2(5.9)3.932
313(78)3(28)3(21)3(6.2)4.258
414(85)4(32)4(24)4(6.5)3.855
52(93)12341.294
6221434.554
7234123.728
8243214.097
93(96)13423.872
10324313.537
11331242.353
12342132.714
134(100)14232.087
14423141.461
15432412.196
16441321.810
k14.132.933.293.123.57
k23.423.372.533.123.34
k33.123.133.423.033.40
k41.893.123.303.312.24
R2.240.440.890.281.33
Effect orderPNMSA > AC > PCS > PNMSA-1 > PCS-1
Optimum groupA1 + B2 + C3 + D4 + E1/PNMSA(90) + PNMSA-1(71) + PCS(28) + PCS-1(24) + AC(5.6)
Table 11. The skid resistance of SMA-13.
Experiment NumberABCDESI
PNMSA/%PNMSA-1/%PCS/%PCS-1/%AC/%
11(90)1(50)1(20)1(15)1(5.6)4.013
212(58)2(24)2(18)2(5.9)3.154
313(66)3(29)3(22)3(6.2)2.893
414(75)4(34)4(26)4(6.5)2.589
52(93)12340.510
6221433.778
7234122.462
8243212.831
93(96)13422.606
10324312.270
11331241.083
12342131.445
134(100)14230.816
14423140.677
15432410.926
16441320.539
k13.161.992.351.832.51
k22.402.471.512.102.19
k31.851.842.251.892.23
k40.741.852.032.601.21
R2.420.630.840.771.30
Effect orderPNMSA > AC > PCS > PCS-1 > PNMSA-1
Optimum groupA1 + B2 + C1 + D4 + E1/PNMSA(90) + PNMSA-1(58) + PCS(20) + PCS-1(26) + AC(5.6)
Table 12. The skid resistance of SMA-10.
Experiment NumberABCDESI
PNMSA/%PNMSA-1/%PCS/%PCS-1/%AC/%
11(90)1(28)1(20)1(14)1(5.6)3.912
212(39)2(24)2(18)2(5.9)2.394
313(50)3(28)3(22)3(6.2)1.680
414(60)4(32)4(26)4(6.5)0.696
52(93)1234-0.361
6221431.884
7234121.315
8243211.569
93(96)13420.910
10324310.579
11331240.368
12342130.617
134(100)14230.185
1442314-1.153
15432410.260
16441321.003
k12.171.161.471.141.58
k21.100.930.731.111.41
k30.620.910.750.631.09
k40.070.970.860.80-0.11
R2.100.260.740.511.69
Effect orderPNMSA > AC > PCS > PCS-1 > PNMSA-1
Optimum groupA1 + B1 + C1 + D1 + E1/PNMSA(90) + PNMSA-1(28) + PCS(20) + PCS-1(14) + AC(5.6)
Table 13. The skid resistance of SMA-5.
Experiment NumberABCDESI
PNMSA/%PNMSA-1/%PCS/%PCS-1/%AC/%
11(90)1(28)1(22)1(18)1(5.8)1.063
212(40)2(27)2(21)2(6.2)0.847
313(52)3(32)3(24)3(6.6)0.514
414(65)4(36)4(28)4(7.0)0.055
52(93)1234-1.138
6221430.609
723412-0.343
8243210.462
93(96)1342-0.154
10324310
1133124-0.098
12342130.0178
134(100)1423-0.184
1442314-1.808
1543241-0.848
16441320.198
k10.62-0.100.44-0.040.17
k2-0.10-0.09-0.280.040.14
k3-0.06-0.19-0.25-0.210.24
k4-0.660.18-0.12-0.05-0.75
R1.280.380.720.240.99
Effect orderPNMSA > AC > PCS > PNMSA-1 > PCS-1
Optimum groupA1 + B4 + C1 + D2 + E3/PNMSA(90) + PNMSA-1(65) + PCS(22) + PCS-1(21) + AC(6.6)
Note: Optimum group in Table 10, Table 11, Table 12 and Table 13 refers the optimal design parameters when the skid resistance of SMA pavements for different mixture types is best.

