Article

Assessing Spatial Distribution of Benthic Macroinvertebrate Communities Associated with Surrounding Land Cover and Water Quality

1
Fisheries Science Institute, Chonnam National University, Yeosu 59626, Korea
2
K-water Research Institute, 1689beon-gil 125, Yuseongdaero, Daejeon 34045, Korea
3
Faculty of Marine Technology, Chonnam National University, Yeosu 59626, Korea
*
Author to whom correspondence should be addressed.
Appl. Sci. 2019, 9(23), 5162; https://doi.org/10.3390/app9235162
Submission received: 29 September 2019 / Revised: 16 November 2019 / Accepted: 20 November 2019 / Published: 28 November 2019
(This article belongs to the Special Issue Food Chains and Food Webs in Aquatic Ecosystems)

Abstract

:
The study aims to assess the spatial distribution of benthic macroinvertebrate communities in response to the surrounding environmental factors related to land use and water quality. A total of 124 sites were surveyed at the Seomjin River basin in May and September 2017, respectively. We evaluated the abundance and composition of benthic macroinvertebrate communities based on nine subwatersheds. Subsequently, we compared the benthic information with the corresponding land use and water quality. To comprehensively explore the spatiotemporal distinction of benthic macroinvertebrate communities associated with those ambient conditions, we applied canonical correspondence analysis (CCA). The CCA results explicitly accounted for 61% of the explanatory variability; the first axis (45.5%) was related to land-use factors, and the second axis (15.5%) was related to water quality. As a result, the groups of benthic communities were distinctly characterized in relation to these two factors. It was found that land-use information is primarily an efficient proxy of ambient water quality conditions to determine benthic macroinvertebrates, such as Asellus spp., Gammarus spp., and Simulium spp. in a stream ecosystem. We also found that specific benthic families or genera within the same groups (Coleoptera, Diptera, Ephemeroptera, and Trichoptera) are also differentiated from ambient water quality changes as a secondary component. In particular, the latter pattern appeared to be closely associated with the impact of summer rainfall on the benthic community changes. Our study sheds light upon projecting benthic community structure in response to changes of land use and water quality. Finally, we conclude that easily accessible information, such as land-use data, aids in effectively characterizing the distribution of benthic macroinvertebrates, and thus enables us to rapidly assess stream health and integrity.

Graphical Abstract

1. Introduction

Benthic species are one of the most diverse and abundant biota in fluvial ecosystems such as rivers and streams [1]. Recognizing a large portion of their importance in fluvial ecosystems, the ecological responses of those benthic species to ambient physicochemical conditions have been explored and described for the sake of biological assessments based on species sensitivity [2,3,4]. For many years, it has been thought that benthic macroinvertebrate communities generally play a pivotal role in facilitating energy flows and nutrient cycling within ecosystems [5,6]. McLenaghan et al. [7] reported that the functional diversity of benthic macroinvertebrates regulates nutrient and algal dynamics in riverine ecosystems. Besides, the high sensitivity of species in their composition and assemblage to changes of ambient habitat conditions allows benthic macroinvertebrates to be used for assessing the stream health and integrity of fluvial ecosystems [8,9]. From an ecological perspective related to niche partitioning, monitoring the distribution of aquatic macroinvertebrates has been linked to ambient physicochemical constraints (e.g., ecosystem morphology and trophic status) [10,11]. Hence, the role of benthic invertebrates has been gradually emphasized as bioindicators [12].
Stream health based on benthic communities can be spatially heterogeneous according to ambient environmental factors, such as neighboring land use/cover, various pollutants, hydrological factors, and local climates. Particularly, land use/cover is a critical factor to drive the transport of sediments and nutrients related to stream water quality [13,14]. Given the recently advanced satellite technology, easily obtainable/accessible data to land-use information are highly cost-efficient relative to field-based water quality measurement [14,15]. Since the fate and transport of nutrients (e.g., nitrogen and phosphorus) are also closely associated with land use in watersheds, benthic communities can be correlated with surrounding land-use patterns [16,17]. Therefore, we hypothesize that land-use information from online websites can enable the rapid assessment of benthic communities in the context of ecosystem health.
Despite the assessment efficiency of land-use information, its slow changes can be still limited to explicitly account for the temporal dynamics of the target biota of our interest within a short term. In stream ecosystems, benthic macroinvertebrates vary in their composition as well as abundance within the same survey area over time. Particularly in East Asian countries including Korea, eastern China, and Japan, monsoon events along with multiple typhoons recur in summer [18,19]. Despite the short time span between surveys, this local climatological feature can change water quality quickly. Therefore, we infer that there are huge potentials in benthic macroinvertebrate community change within a short term, assuming that ambient water quality can be a supplementary indicator to characterize the benthic macroinvertebrate community in a temporal scale.
Our study aims to project the distributions of benthic macroinvertebrate communities associated with the surrounding land use/cover and water quality in Seomjin River, South Korea. We also analyze and evaluate the sensitivities of benthic communities in different taxonomical levels (e.g., order, genus, and species). Furthermore, to assess the status of stream health and integrity in the Seomjin River, we evaluated the values of biotic indices from the collected benthic macroinvertebrate data. Finally, we anticipate finding out more useful data information to effectively characterize the distribution of benthic macroinvertebrates in the context of the rapid assessment of stream health.

2. Materials and Methods

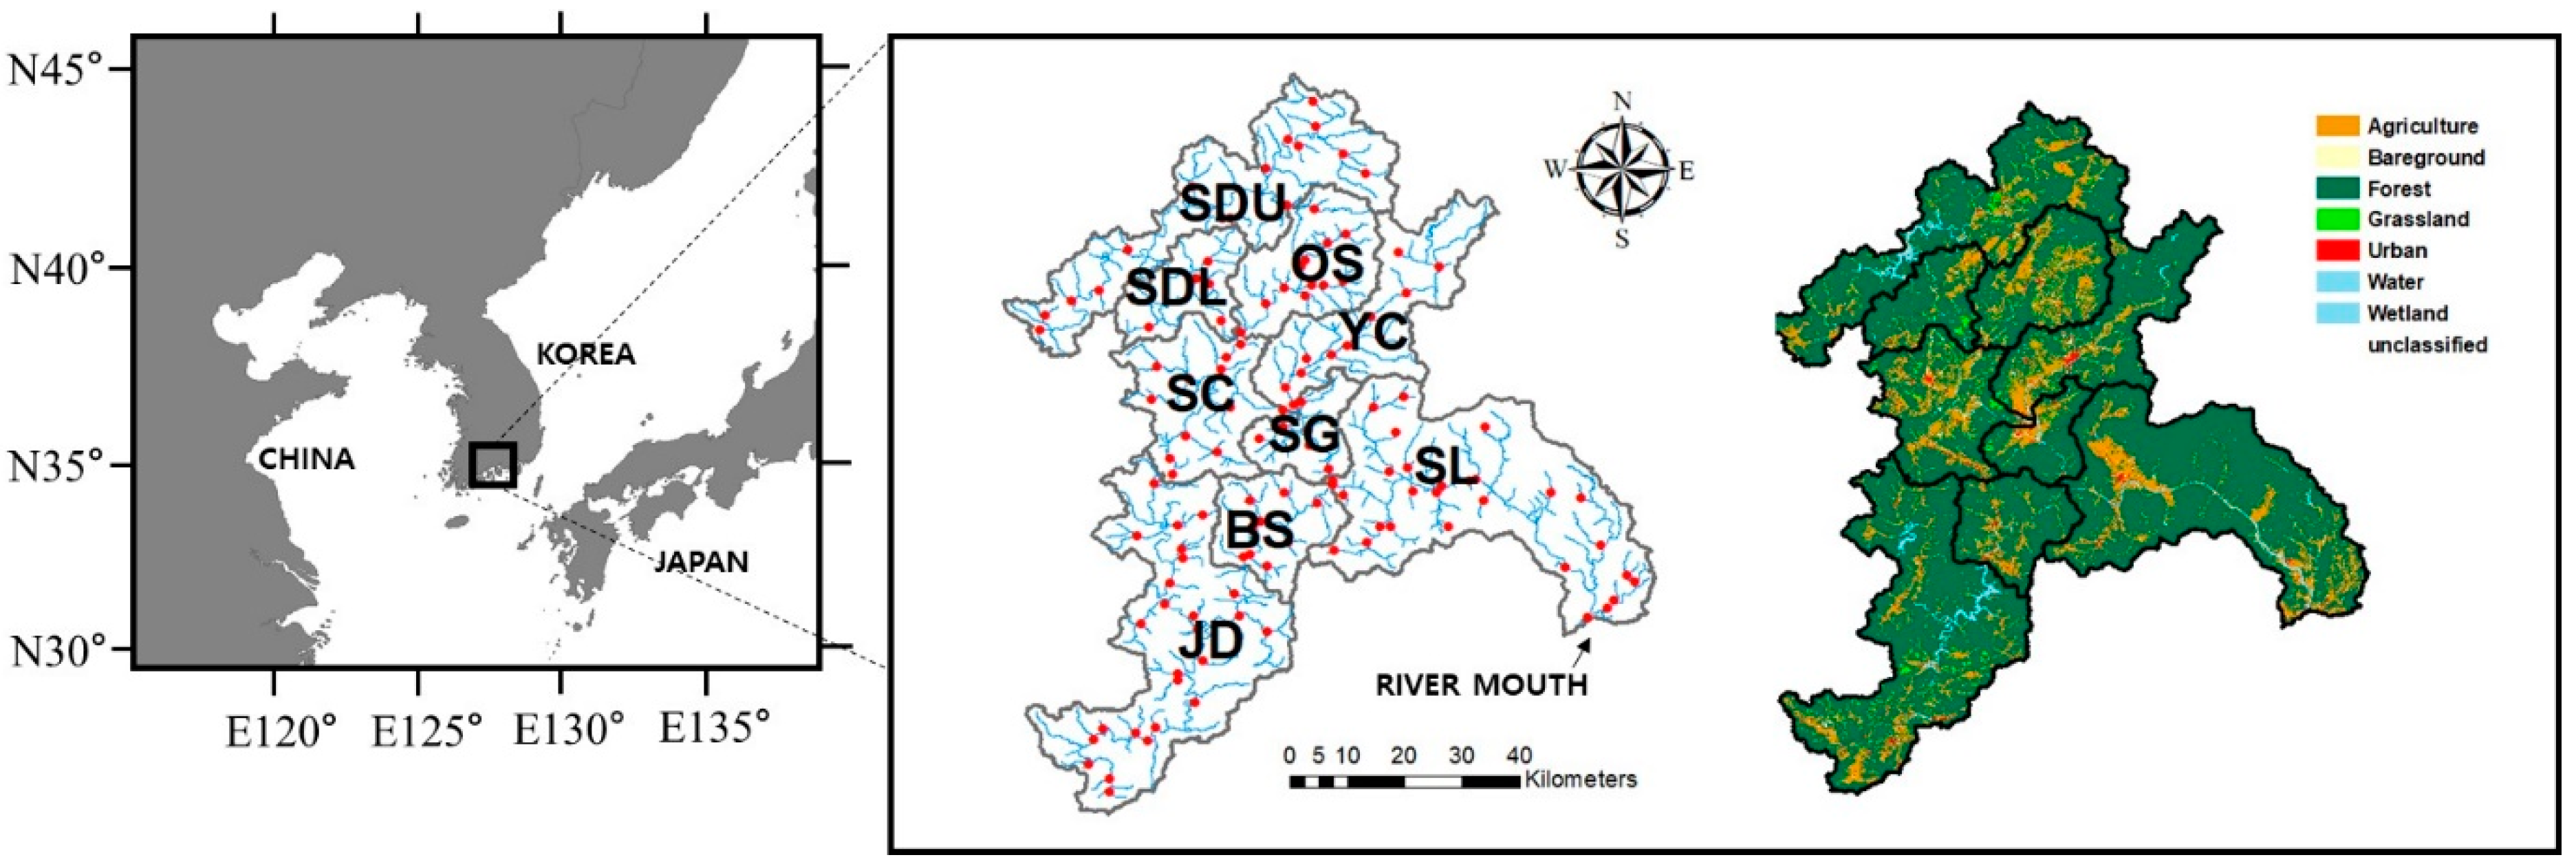
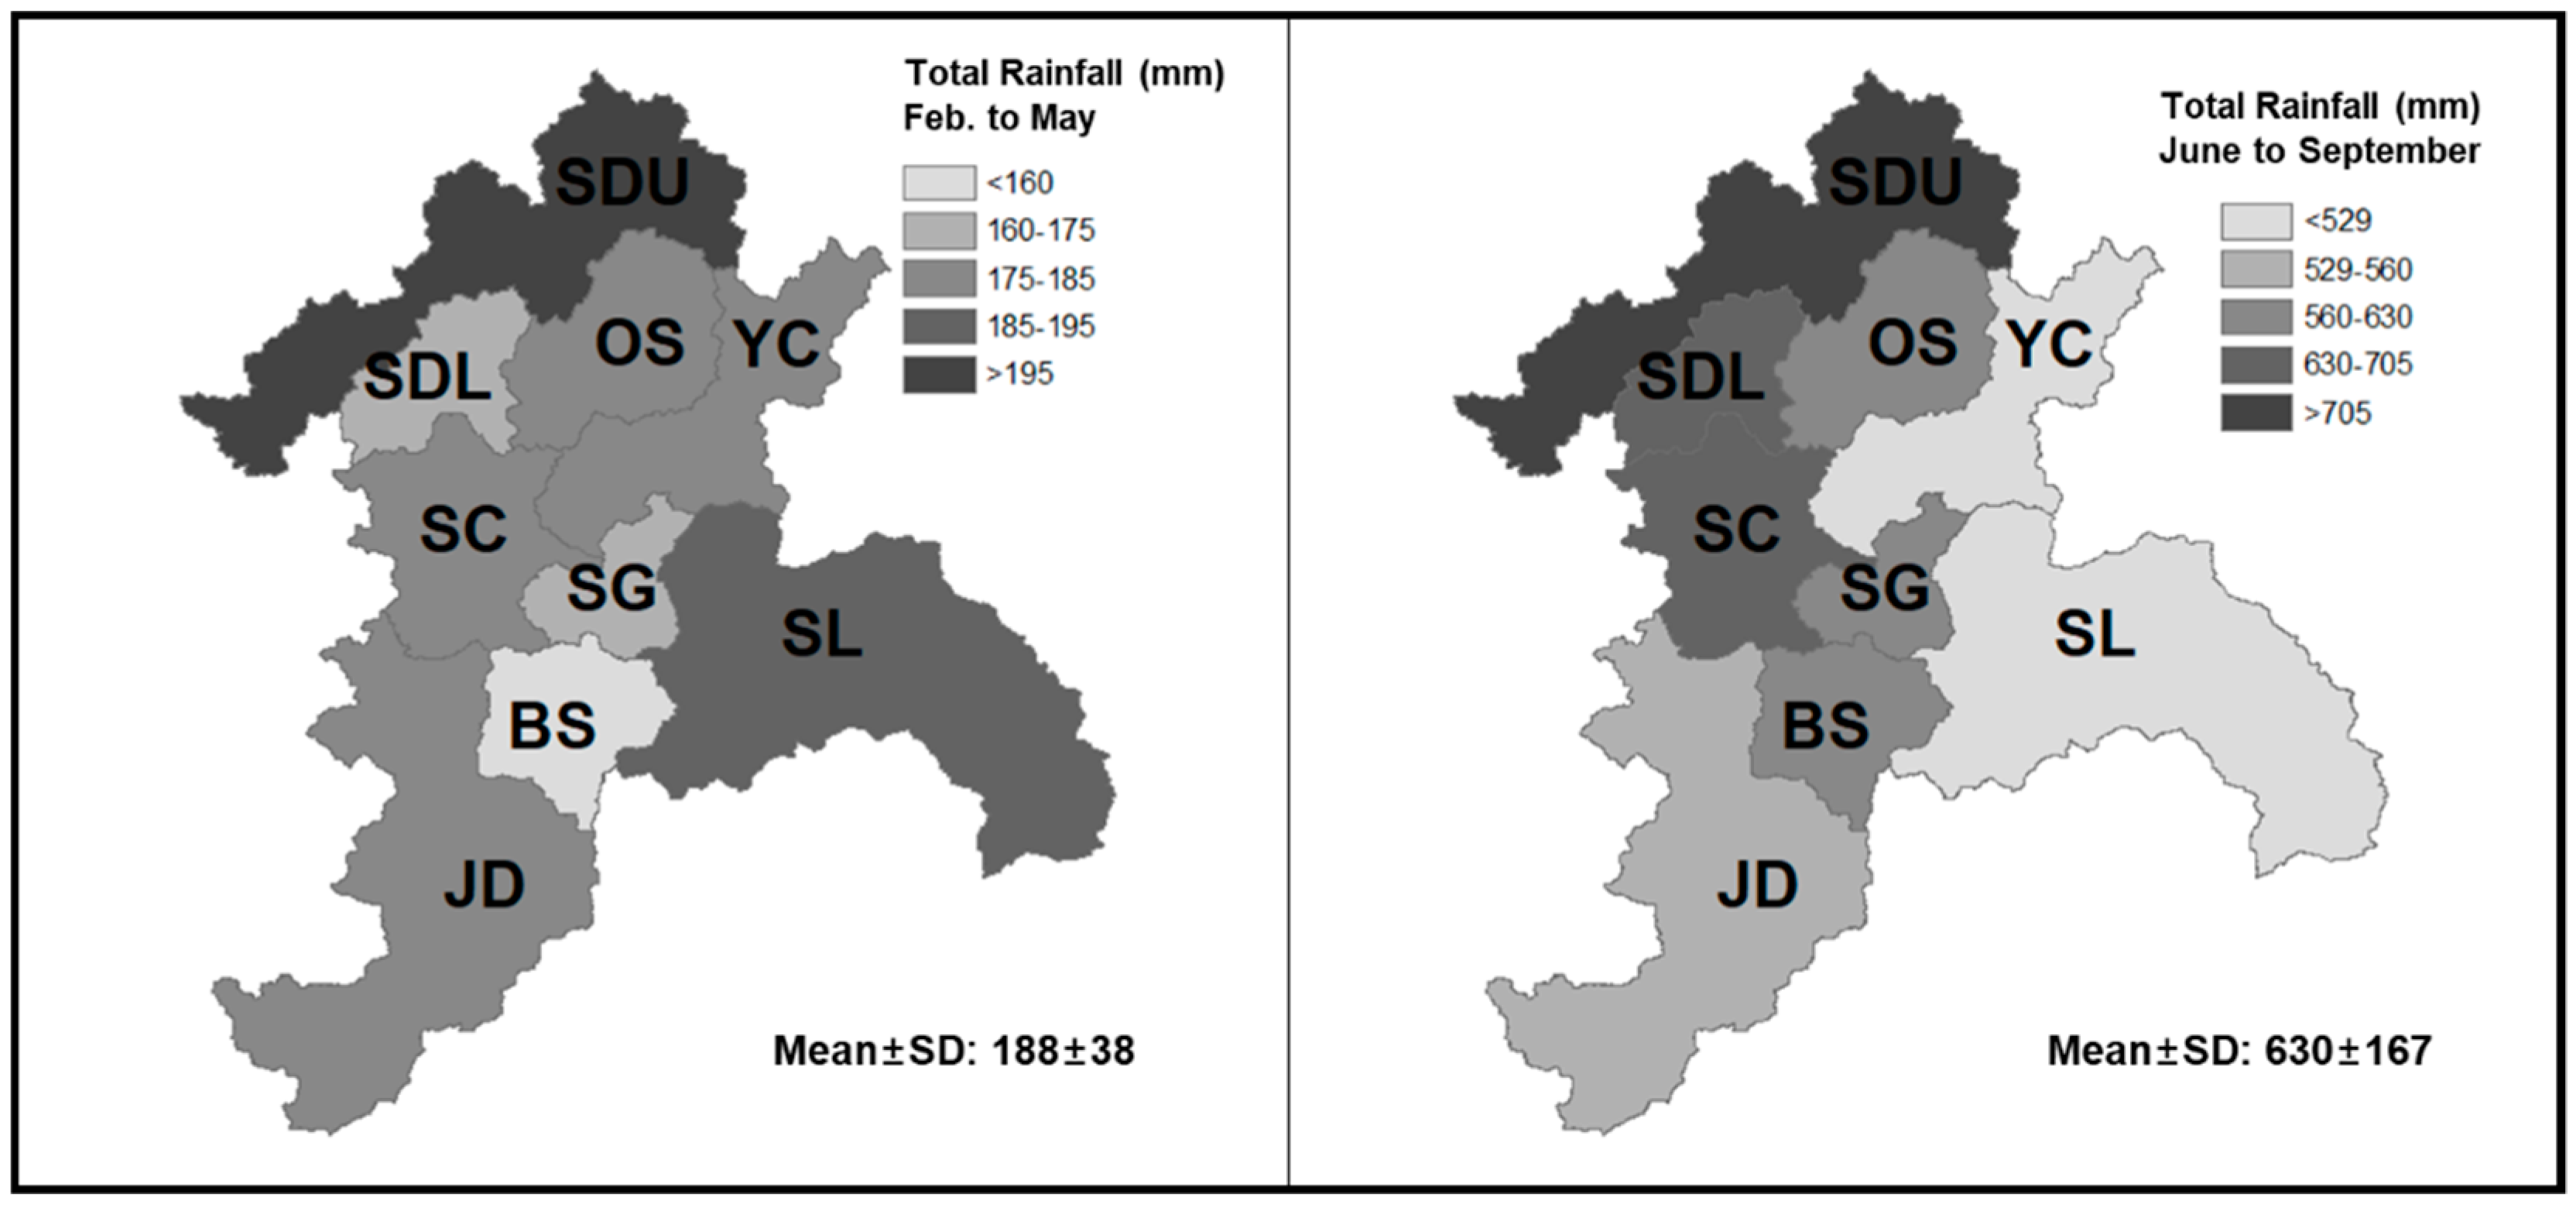
2.1. Site Description

Seomjin River is one of the four major watersheds in South Korea and is located in the southwestern part of the Korean peninsula (34°55′–35°45′ N, 126°57′–127°55′ E) (Figure 1). The catchment area is approximately 4900 km2, and the length of the river is 223 km. The primary land use is a forest area (48%), and the second dominant land use is an agricultural area (33.6%) (Figure 1). The urban lands comprise approximately 4% of the total catchment area. The agricultural lands are mainly adjacent to stream channels. The annual precipitation has been 1384 ± 317 mm (mean ± SD) in the Seomjin River catchment for the last decade. The unique climate conditions, such as monsoon and typhoons, bring about >50% of the precipitation concentrated in summer between June and September (Figure 2). For this reason, several multi-purpose dams are operational to effectively manage water resources for irrigation, potable use, and flow regulation. The Korean Ministry of the Environment manages the Seomjin River watershed, dividing it into nine subwatersheds in compliance with their geophysical characteristics, specifically the main channel, tributaries, upstream, downstream, and dam location. Particularly for the two groups of subwatersheds; (i) Seomjin Dam in the upper site (SDU) and the Seomjin Dam in the lower site (SDL), and (ii) Juam Dam (JD) and Bo-Seong (BS), the main characteristics of these subwatersheds are separated by dam location. The former subwatersheds form part of the headwater of the main channel, while the latter are of the main tributary (Figure 1).

2.2. Data Collection

The present study was based on 124 sites across the Seomjin River watershed in 2017. The study sites are part of the national water quality monitoring networks run by the National Institute of Environmental Research (NIER) which is operated by the Korean Ministry of Environment (KMOE). All 124 sites are located in the same catchment and are connected to one another by way of the Seomjin River. Due to the accessibility of sediment sampling, most of the study sites are placed on low-order streams (i.e., shallow depth). For data consistency, we conducted the surveys at the same sites twice a year in May and September. The total number of study sites consists of 16 from SDU (catchment area: 763 km2), five from SDL (237 km2), 12 from Oh-Soo, OS (370 km2), 12 from Soon-Chang, SC (431 km2), 11 from Yo-Cheon, YC (486 km2), seven from Seomjin-Gokseong, SG (183 km2), 27 from the lower Seomjin River, SL (1128 km2), 24 from JD (1029 km2), and 10 from BS (283 km2) (Figure 1).
From the study sites, we investigated geophysicochemical features, such as land-use information and water quality parameters. The land-use data were based on the year 2016, and were obtained from the National Spatial Data Infrastructure Portal (http://data.nsdi.go.kr). We specifically extracted the land-use data around the study sites by an arbitrary 1-km circle buffer using ArcGIS software (ESRI, Redlands, CA, USA). We collected water samples on each site (one sample per site). The water quality parameters included biochemical oxygen demand (BOD), total nitrogen (TN), nitrate (NO3-N), ammonia (NH3-N), total phosphorus (TP), phosphate (PO4-P), and chlorophyll a concentrations (Chl-a). The water quality parameters, including BOD, TN, NO3-N, NH3-N, TP PO4-P, and Chl-a concentrations were analyzed in the laboratory using water samples on sites in compliance with the methods proposed by Wetzel and Likens [20].
For biological data, we sampled three benthic sediments at each site, taking the spatial heterogeneity within the site into account. A Surber sampler (30 cm × 30 cm, 500 μm mesh; APHA et al., 1992) was used to collect benthic macroinvertebrates, at a depth of approximately 10 cm in May and September. Then, we preserved the obtained benthic macroinvertebrates in 7% formalin. In the laboratory, we sorted the invertebrate specimens, identified them up to genus or species level, and counted the number of specimens using a dissecting anatomy microscope. The identification was based on several pieces of literature including Quigley [21], Pennak [22], Brighnam et al. [23], Yun [24], and Merritt and Cummins [25].

2.3. Use of Biotic Indices

To assess the status of stream health and integrity in the Seomjin River, we calculated the values of biotic indices from the collected benthic macroinvertebrate data. Bearing in mind that there is no clear-cut distinction of ecosystem assessment in accordance with biotic indices, we considered both globally popular and regionally specific indices. In this respect, five biotic indices were selected to evaluate the abundance, diversity, dominance, evenness, and richness: McNaughton’s dominance index (DI, [26]), Shannon–Weaver index (H’, [27]), Richness index (RI, [28]), Evenness index (EI, [29]), and Benthic Macroinvertebrates index (BMI; [30]). In particular, BMI is a modified version (i.e., conceptually the same) of the saprobic index of Zelinka and Marvan [31], which ranges from 0 to 100. The BMI has been used for the bio-assessment of benthic macroinvertebrates in Korea [32]. The governing equation is expressed as:
B M I = ( 4 i = 1 n s i h i g i i = 1 n h i g i ) × 25
where si denotes the saprobic value of the species i, hi denotes the relative abundance ranking of the species i, and gi denotes the weight value of the species i of the total number of species n. There is a subtle difference between the saprobic index and BMI. While the saprobic index takes the absolute biomass of the species for hi, BMI uses the relative ranking of species abundance. Kong et al. [30] reported that BMI was a more capable means of assessing stream health and integrity when utilizing the information of relative abundance.

2.4. Multivariate Analysis for Data Ordination

We used canonical correspondence analysis (CCA) in order to relate the benthic macroinvertebrate communities to the surrounding environmental variables. The environmental variables included the land-use percent coverage of cropland, urban land, forest, and wetland, in addition to the ambient water quality parameters TN, TP, NH3, Chl-a, and BOD. The benthic macroinvertebrate data included 22 genus groups, except for the family group of Chironomidae. Prior to the CCA application, we calculated the length of the gradient based on detrended correspondence analysis in order to examine the adequacy of CCA application [33]. As the length was 4.16 (greater than 4), CCA was used for data ordination [34,35]. All the variables were modified by log transformation to stabilize the data close to normal distribution [36]. For statistical analysis, we used SPSS ver. 18 software (IBM, New York, NY, USA) and the open-source software PAST3 (SOFTPEDIA, Romania).

3. Results and Discussion

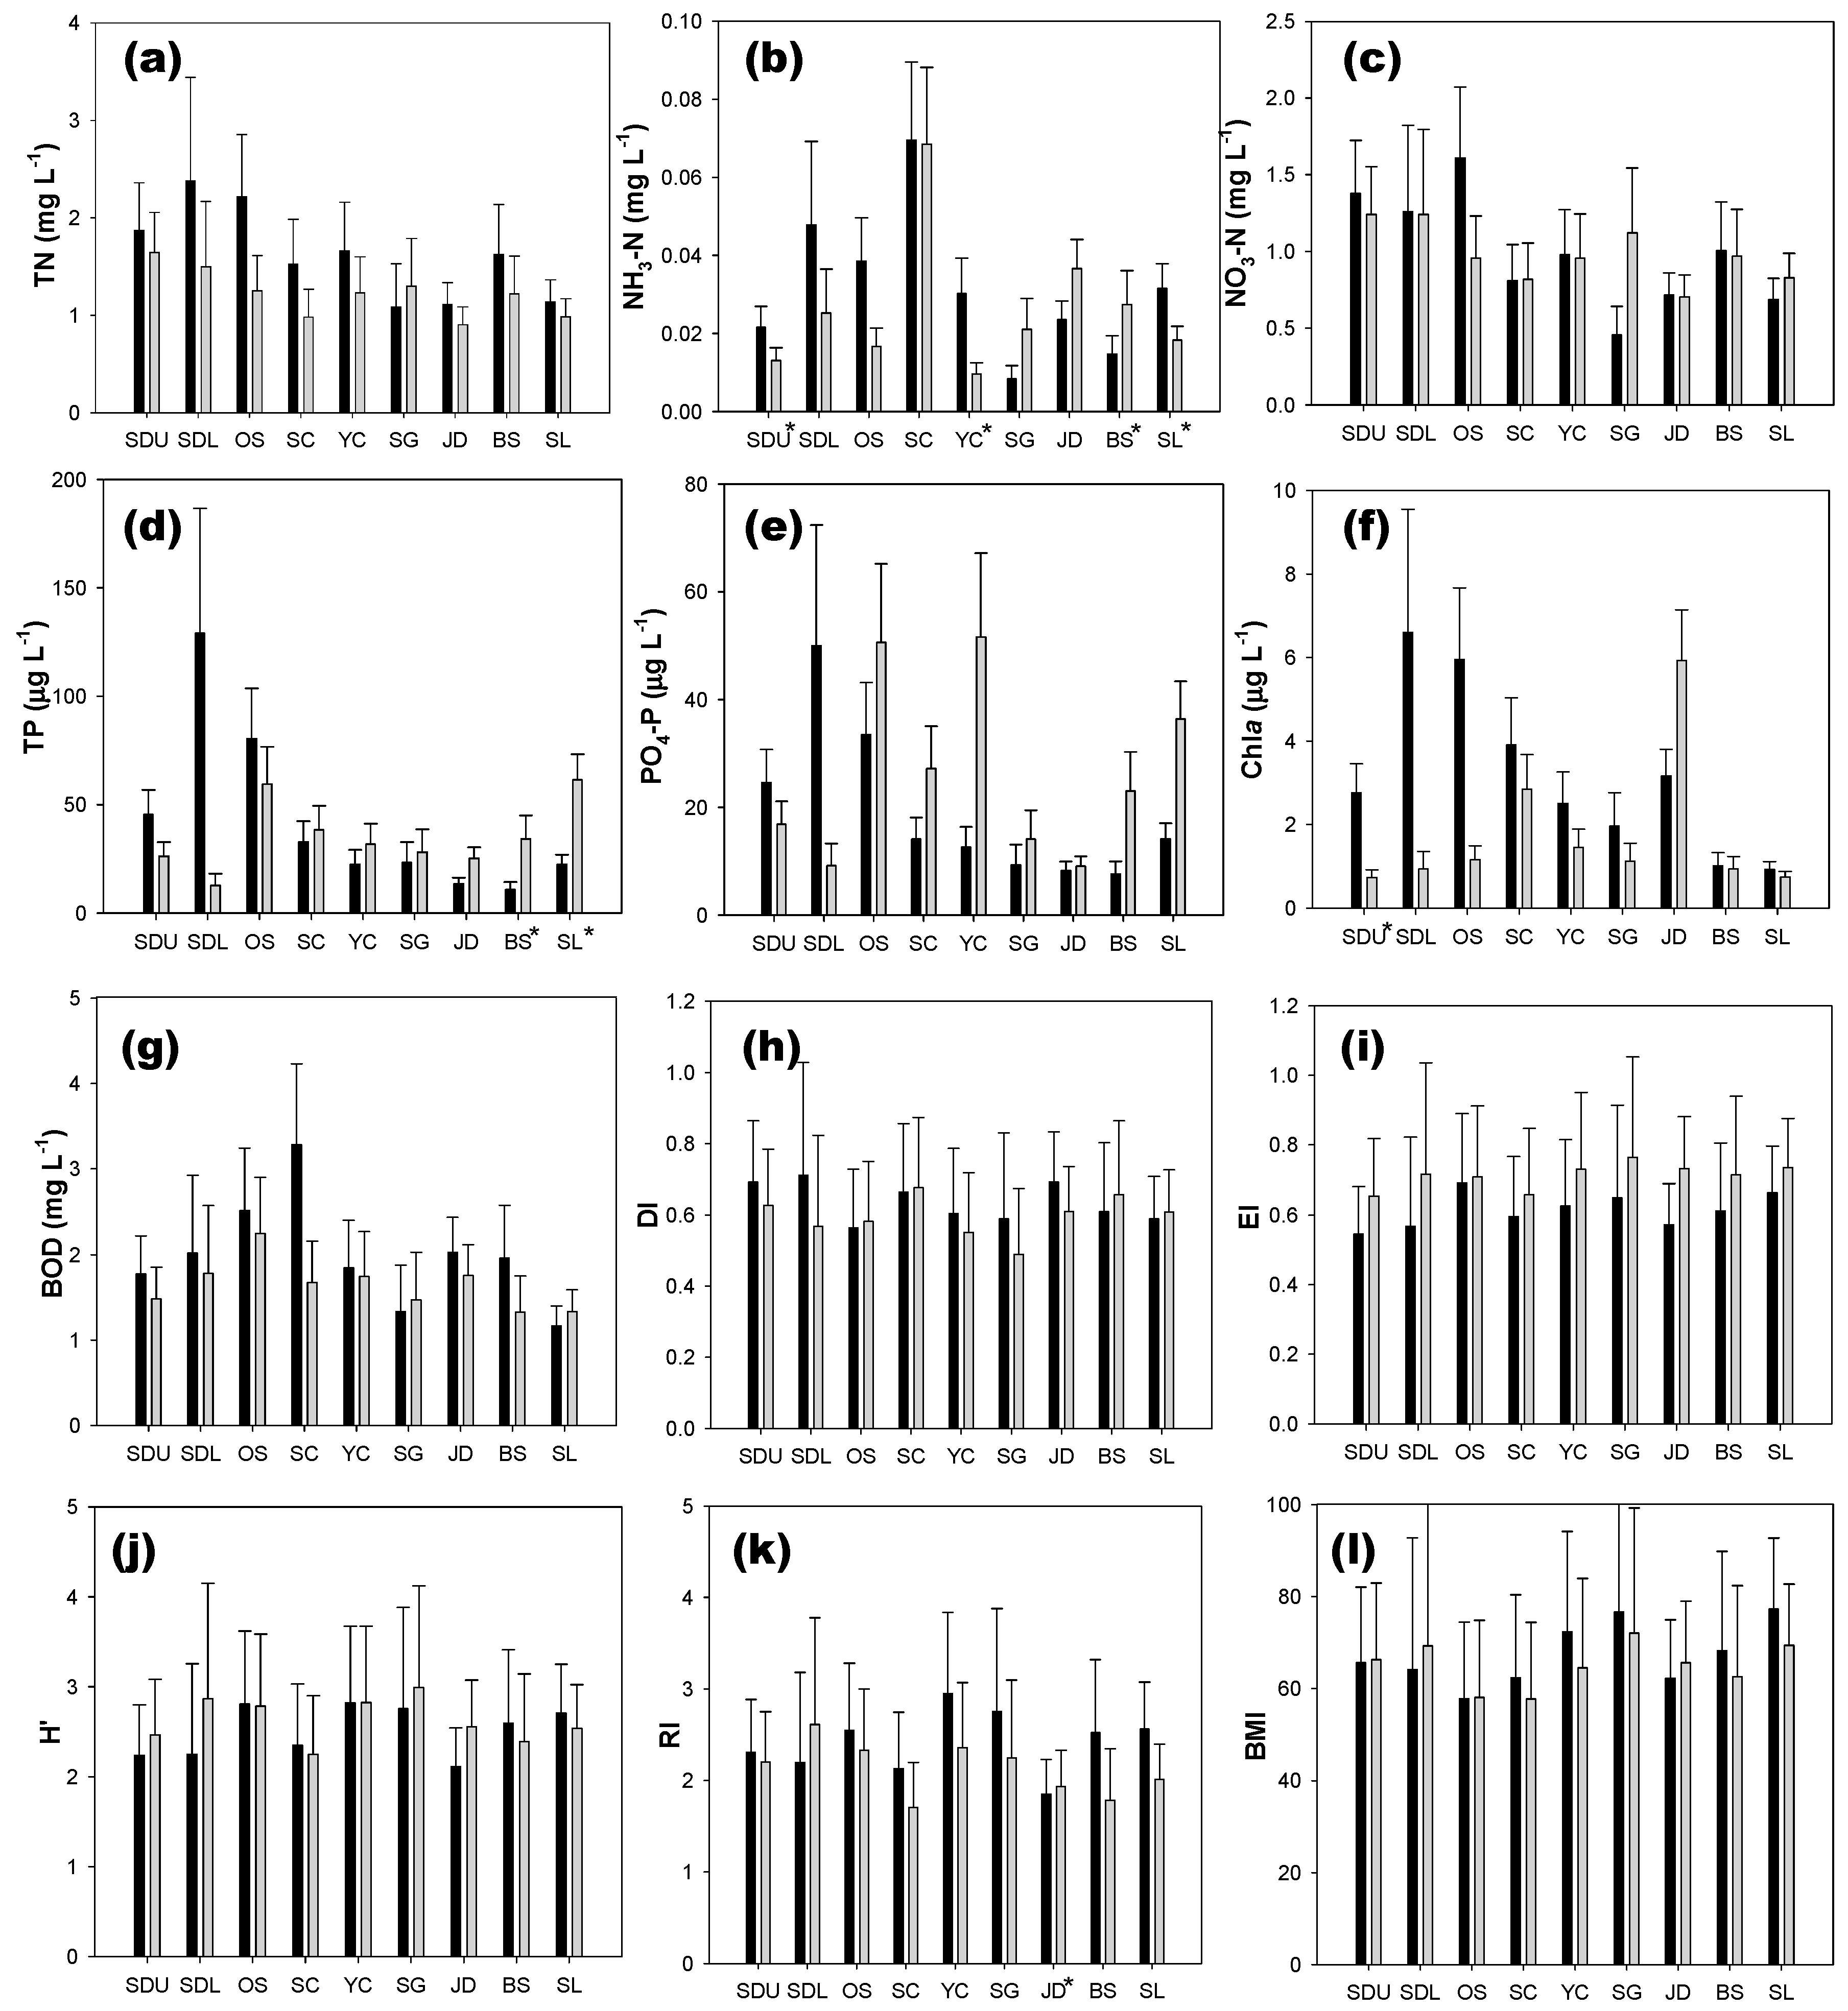
3.1. Comparison of Water Quality and Biotic Indices

Water quality parameters and biotic indices were compared in nine subwatersheds between May and September. In the temporal scale, the nitrogen level was slightly higher in May than in September (Figure 3). It appeared that a significant amount of nutrients entered the stream by summer rainfall (see Figure 2 and Figure 3). We speculate that incoming nutrients are more dissolved forms of nitrogen and phosphorus than particulate, because we observed frequent increases of NH3–N, NO3–N, and PO4–P (Figure 3). The previous studies have reported that the high flux of NO3–N could be driven by specific agricultural activities, such as manure applications and conservational tillage [37,38]. Nonetheless, TN concentrations exhibited a gradual decrease from upstream to downstream (Figure 3), and specifically exhibited approximately from 2 mg L−1 at sites SDU, SDL, and OS, to 1 mg L−1 at sites SG and SL. A study by Ahn [39] reported that unexpectedly high nutrient concentrations in headstreams are often observed because of the relatively undeveloped wastewater treatment and septic tanks in the rural area of South Korea, thereby inducing an increase of BOD. In contrast to TN and NO3–N, NH3–N concentrations were very high at the SC site, regardless of time (Figure 3). Given the largest fraction (49%) of cropland among nine subwatersheds, the high ammonia concentrations could be associated with agricultural activities. In China, which is geographically close to Korea, it was reported that agricultural nitrogen accounted for more than 40% of the variability of TN, and subsequently it drives ammonia increases [40,41].
The phosphorus pattern was spatially similar to the nitrogen pattern in May. The level of TP concentrations gradually decreased from upstream to downstream, except at the headstream SDU site in May (Figure 3). However, it was comparatively notable that phosphorus concentrations rebounded in the lower part of the river, such as at the BS and SL sites. This longitudinal trend could be consistent with the fact that the lower part of the Seomjin River was dominated by agricultural lands (38.8% at the IS, SC, YC, BS, and SL sites) and urban areas (6.6% at the YC and BS sites) relative to the upper part (27% at the SDU, SDL, SG, and JD sites, and 3.3% at the SDU, SDL, and JD sites) (see Figure 1). In relation to agricultural management practices (e.g., manure applications) and urbanization, a large amount of dissolved phosphorus could be generated [42,43].
Chl-a concentrations were also slightly higher at the upper part than at the lower part of the river. However, based on the current level of Chl-a concentrations, the Seomjin River changed from being oligotrophic to mesotrophic (Chl-a < 10 μg L−1). The BOD values mostly ranged from 1 to 3 mg L−1, and appear to differ from the spatial pattern of nutrient concentrations (Figure 3). Additionally, we also compared five biotic indices, and most of the values of biotic indices were not statistically significant across all the study sites (Figure 3). Thus, it was difficult to distinguish the spatial pattern of benthic communities based merely on the biotic indices.

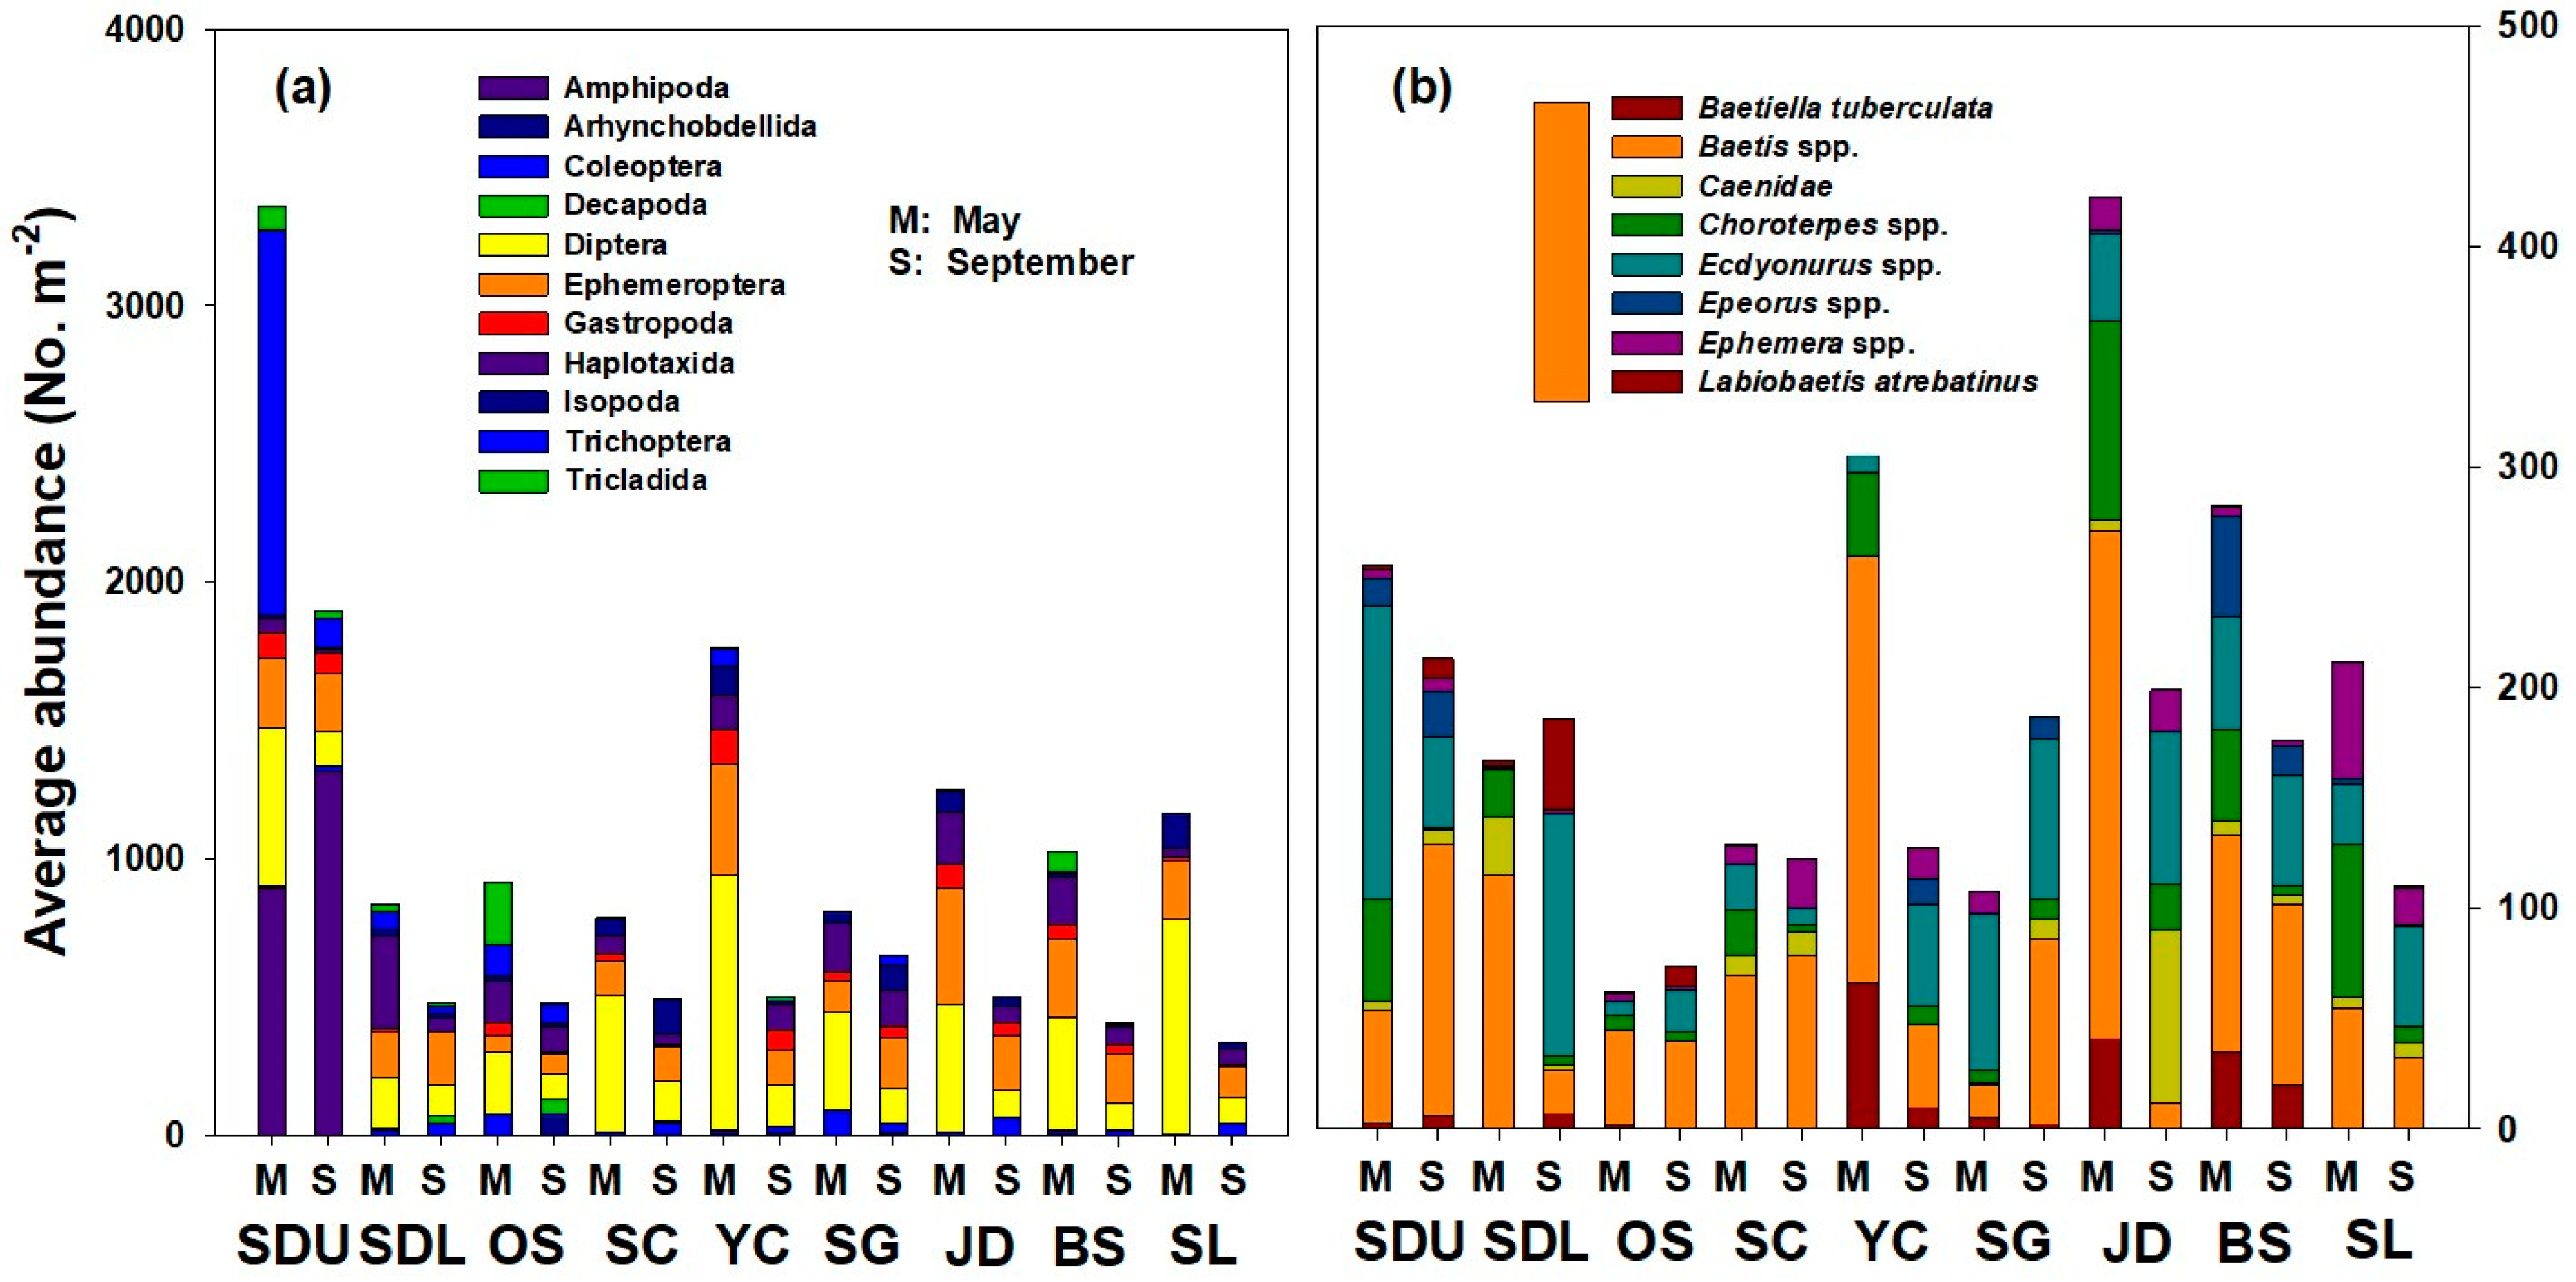
3.2. Spatial Distribution of Benthic Macroinvertebrate Communities Before and After Summer Rainfall

The distribution of benthic macroinvertebrate communities was spatially distinct (Figure 4). At all nine of the subwatersheds, the abundance of benthic macroinvertebrates decreased after the summer rainfall in September. A decreasing level of benthic communities differed from the location of subwatersheds. It was a particularly remarkable pattern that while the abundance of Gammarus spp. (Amphipoda) slightly increased, the abundance of Asellus spp. (Isopoda) dramatically decreased after the heavy rainfall (Figure 4). Moreover, the relative abundance decreased from 41% to 3.3% (Table 1). However, in this respect, Gammarus spp. also dramatically increased in terms of relative abundance (26.6% in May to 69.6% in September, Table 1). This pattern was clearer at the SDU site, which was a forest-dominated area. We could not find evidence to support their inverse abundance pattern associated with rainfall, especially in a forest area. To understand their relationships and ecological interactions, a long-term monitoring is highly required to depict the inter-annual variation in specific land-use coverage.
In relation to unfavorable benthic macroinvertebrates in polluted environments, it was found that Diptera (Chironomidae and Simulium spp.) prevailed across the Seomjin River watershed (Figure 3). However, it was also observed that their abundance was significantly low in September after summer rainfall. Chironomidae abundance consistently decreased across all of the study sites except for SDL. A slight increase (21.9% to 24.1%) of the abundance might be longitudinal flush effects, since the SDL site was located downstream of the Seomjin Dam. Simulium spp. also decreased after summer rainfall, but their low abundance appeals to further surveys over a long term.
On the other hand, the key benthic macroinvertebrates such as Coleoptera and Ephemeroptera were scrutinized. Interestingly, the abundance patterns of Elmidae spp. and Eubrianax spp. were opposite between May and September. The former was commonly higher in May, while the latter was higher in September (Table 1). Ephemeroptera were slightly more abundant in September. Particularly, Ecdyonurus spp. abundance was distinctly high in September relative to the other Ephemeroptera (Table 1). The most dominant Ephemeroptera, Baetis spp., showed irregular spatial pattern in their abundance. Interestingly, the longitudinal pattern of abundance looked like a zigzag, which implies that Baetis spp. (e.g., larva) could be influenced serially from upstream to downstream by hydrological factors. Another key group Trichoptera showed higher abundance, particularly at the SDL and OS sites (Table 1). Hydropsyche spp. appeared to be sensitive to summer rainfall, while Cheumatopsyche spp. seem to be more tolerant.

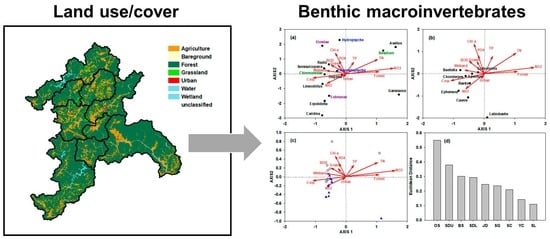
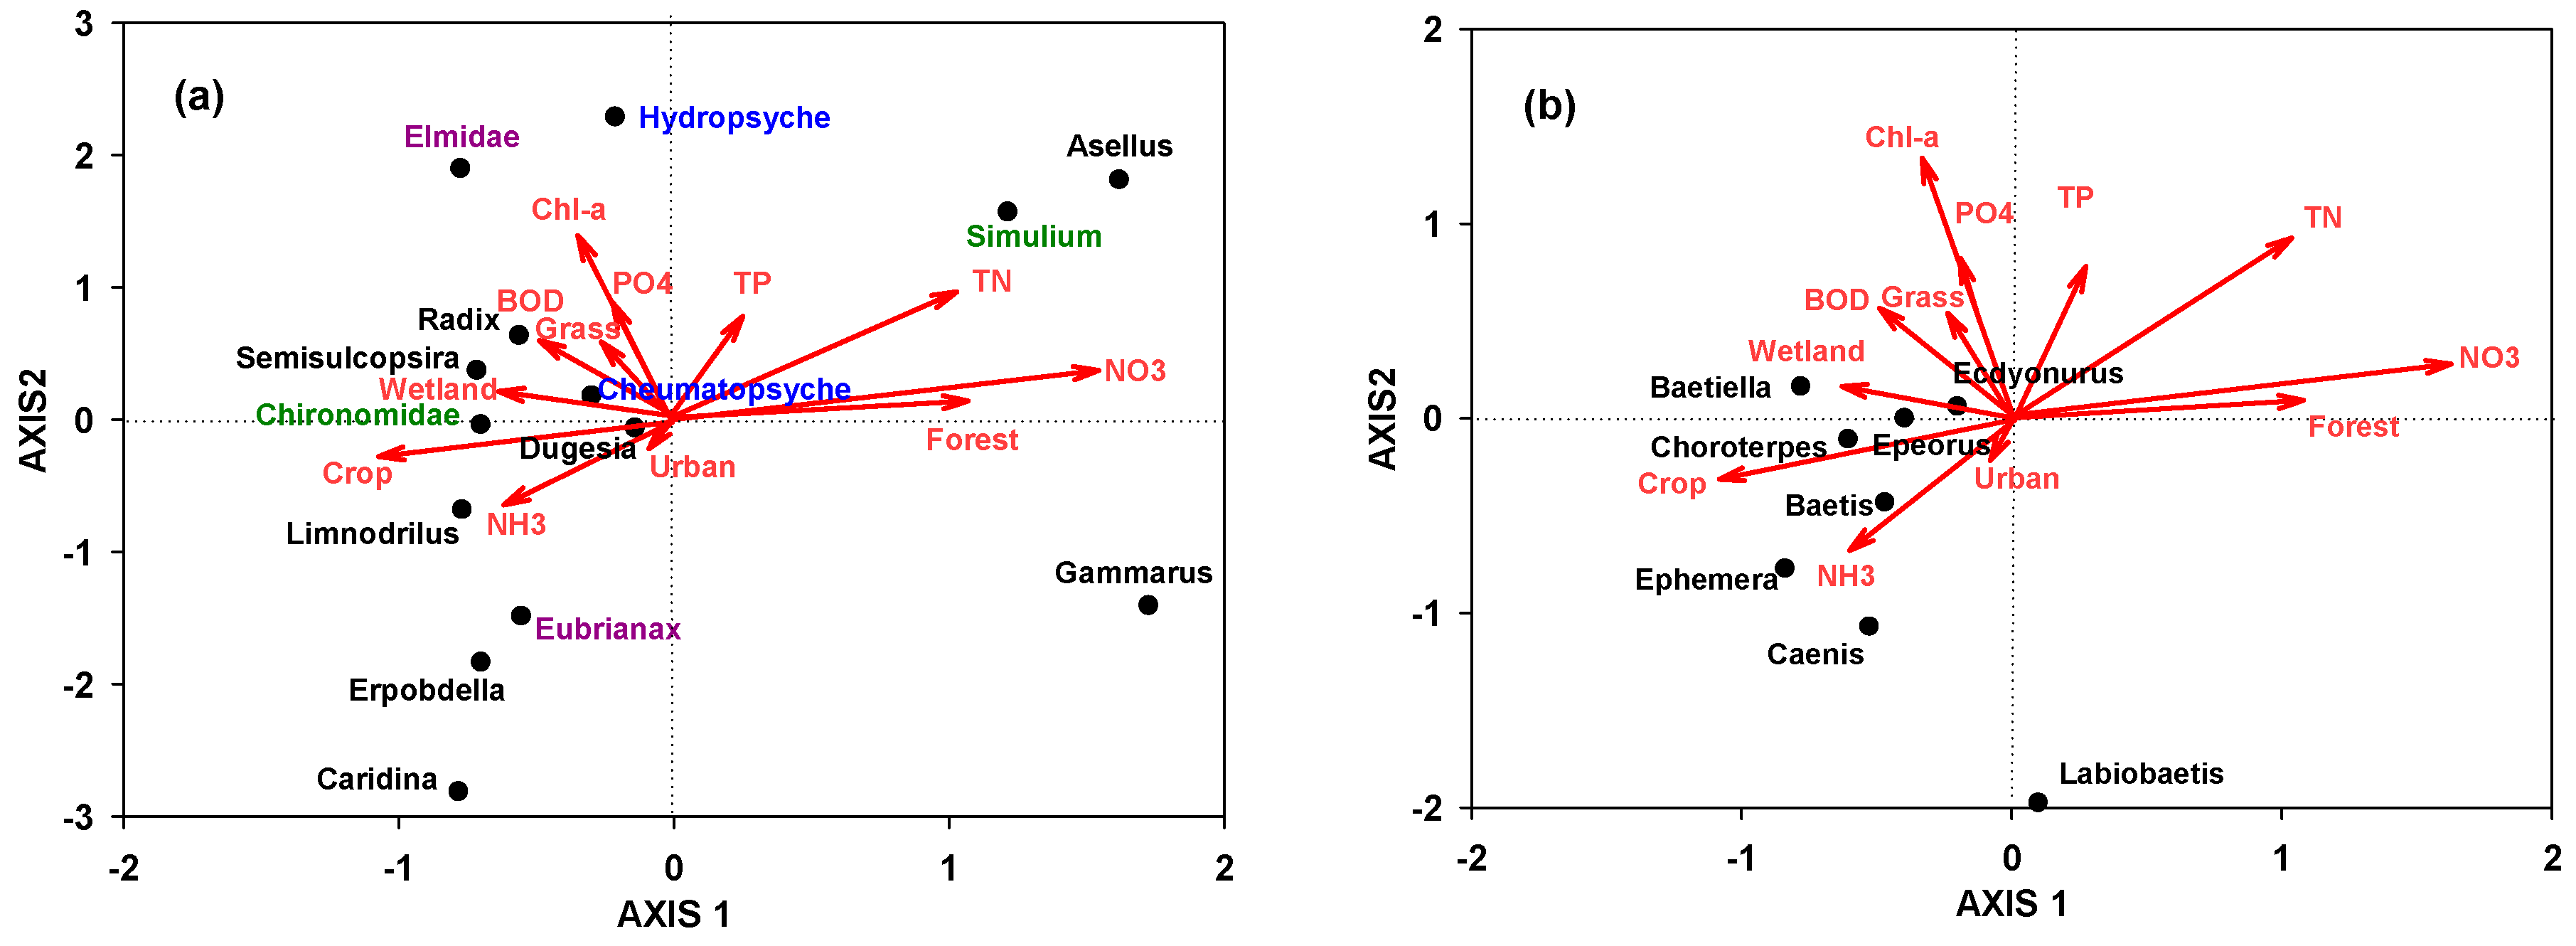
3.3. Association among Benthic Macroinvertebrates, Land-Use Coverage, and Ambient Water Quality

The CCA simplified the relationships among the variables of our interest (Figure 5). The CCA results explicitly accounted for 61% of the relational variability with two primary ordination axes; the first axis (45.5%) was related to land-use factors, and the second axis (15.5%) appeared to be related to water quality. The first ordination axis characterized the gradient of land-use coverage (Figure 5). The land-cover gradient was mainly separated by forest and agricultural/cropland areas. Urban land is topographically placed in the middle between forest and cropland. Wetland is close to cropland, which is reasonable because extensive agricultural areas have been converted from riverine wetlands by constructing levees in South Korea [44,45]. The second ordination axis depicted the gradient of water quality parameters. On the whole, the upper part of plot is closely associated with the parameters related to water quality deterioration, such as the higher concentration level of BOD, Chl-a, TP, and TN (Figure 5). It was notable that the ammonia (NH3–N) concentration showed an inverse pattern against the other water quality parameters. This pattern appears to be associated with agriculture and pasture. In contrast, the NO3–N concentration showed a weak relationship with agricultural activities including grassland/pasture, while the PO4–P concentration had close association (Figure 5 and Figure 6a). As previous mentioned, higher PO4–P concentrations were apparently observed in the lower part of the river (Figure 3). Thus, the CCA ordination depicted the disparate responses of nitrogen and phosphorus dynamics in the lower part of the Seomjin River.
In the ordination pattern of key benthic macroinvertebrates (e.g., EPTC taxa: E = Ephemeroptera, P = Plecoptera, T = Tricoptera, and C = Coleoptera), the major Coleoptera groups, Elmidae spp. and Eubrianax spp., were distinctly differentiated according to water quality. These two genera, especially the riffle beetles Elmidae, are typically known as a large group of aquatic Coleoptera that are generally indicators of good water quality, because of their sensitivity to changes in the surrounding environmental conditions [46,47]. Nonetheless, the association of Elmidae with several water quality signals to eutrophic conditions (PO4-P, Chl-a, and BOD) was unexpected (Figure 5a). This counterintuitive pattern may be a confounding effect stemming from the spatial migration of larvae. However, there have been some evidence that Elmidae can be distributed in a wide range of nutrient conditions [48]. We speculate that Elmidae can prevail to some extent, since the Seomjin River watershed is mainly dominated by forest (48% on average, see Figure 1). The Tripcoptera groups, Hydropsyche spp. and Cheumatopsyche spp., were separately characterized. It appears that Hydropsyche is more related to Chl-a than Cheumatopsyche. There have been several literatures on food preferences and niche partitioning among these species [49,50]. We understand the separate pattern of these species, in the sense that Hydropsyche larvae prefer higher-velocity microhabitats and mainly digest detritus and benthic diatoms [51]. Another key benthic macroinvertebrate Ephemeroptera generally tended to inhabit good water quality conditions (Figure 5b). However, they seemed to be apart from mountainous areas (i.e., forest areas). Within the same family Baetidae, Baetiella spp. was more associated with wetland habitat, while Baetis spp. was more associated with ammonia concentration. Particularly, it was found that Baetis spp. was less sensitive to ammonia toxicity than other mayflies [52]. We infer that the linkage between Baetis spp. and ammonia concentration is highly associated with their tolerance. In this context, Ephemera spp. and Caenis spp. seem to inhabit in a similar water quality condition (Figure 5b). The spatial ordination of Labiobaetis spp. was clearly distinct, which appears to be related to good water quality. The other Ephemeroptera, such as Choropterpes spp., Epeorus spp., and Ecdyonurus spp., were placed on a mixture of wetland, cropland, and urban areas. However, there was little evidence to advocate their association with surrounding environmental conditions.
The dominant Diptera groups were Chironomidae and Simulium spp. in the Seomjin River basin. These two groups were clearly separated in the data ordination induced by land-use coverage rather than water quality (Figure 5a). Chironomidae were closely associated with wetland and cropland. Plenty of literature papers have reported that Chironomidae are the most abundant insects in wetlands and play an important role in wetland food webs [53,54]. In addition, it is clear that agricultural land use has influenced water quality, as evidenced by high nutrient concentrations [55]. Thus, the accumulation of organic matters subsequently fosters the colonization of Chironomidae groups, particularly in lowland agricultural areas [55,56]. In contrast, the same group of Diptera, Simulium spp., was correlated with nitrogen rather than phosphorus in forest areas. The aforementioned Hydropsyche spp. is known to prefer boulder microhabitats, which are commonly found in upstream areas (i.e., forest area in Seomjin River). It was remarkable to show a weak relationship between Hydropsyche spp. and forest land cover. Given the interspecific competition between Hydropsyche spp. and Simulium spp., our result was plausible to make Hydropsyche spp. separate in order to avoid excessive predation and competition [57].
Of the remaining benthic macroinvertebrates, Asellus spp. and Gammarus spp. were strongly identified in forest areas (Figure 5a). These two genera were clearly separated by components related to water quality, which we will discuss in relation to temporal water quality changes in the following sections. The Gastropoda groups Radix spp. and Semisulcopsira spp. were similarly ordinated in the plot (Figure 5a). Although the former was more related to grassland (i.e., pasture) and the latter was more related to wetlands, it was difficult to characterize their habitat preferences. In this regard, further investigations are required. The Haplotaxida Limnodrilus spp. were closely associated with ammonia concentration in agricultural areas, and are known to be tolerant of unfavorable condition such as hypoxic and eutrophic states [58]. Thus, we suppose that Limnodrilus spp. is less sensitive to ammonia (NH3–N) toxicity, similar to the aforementioned Baetis spp. and Ephemera spp.

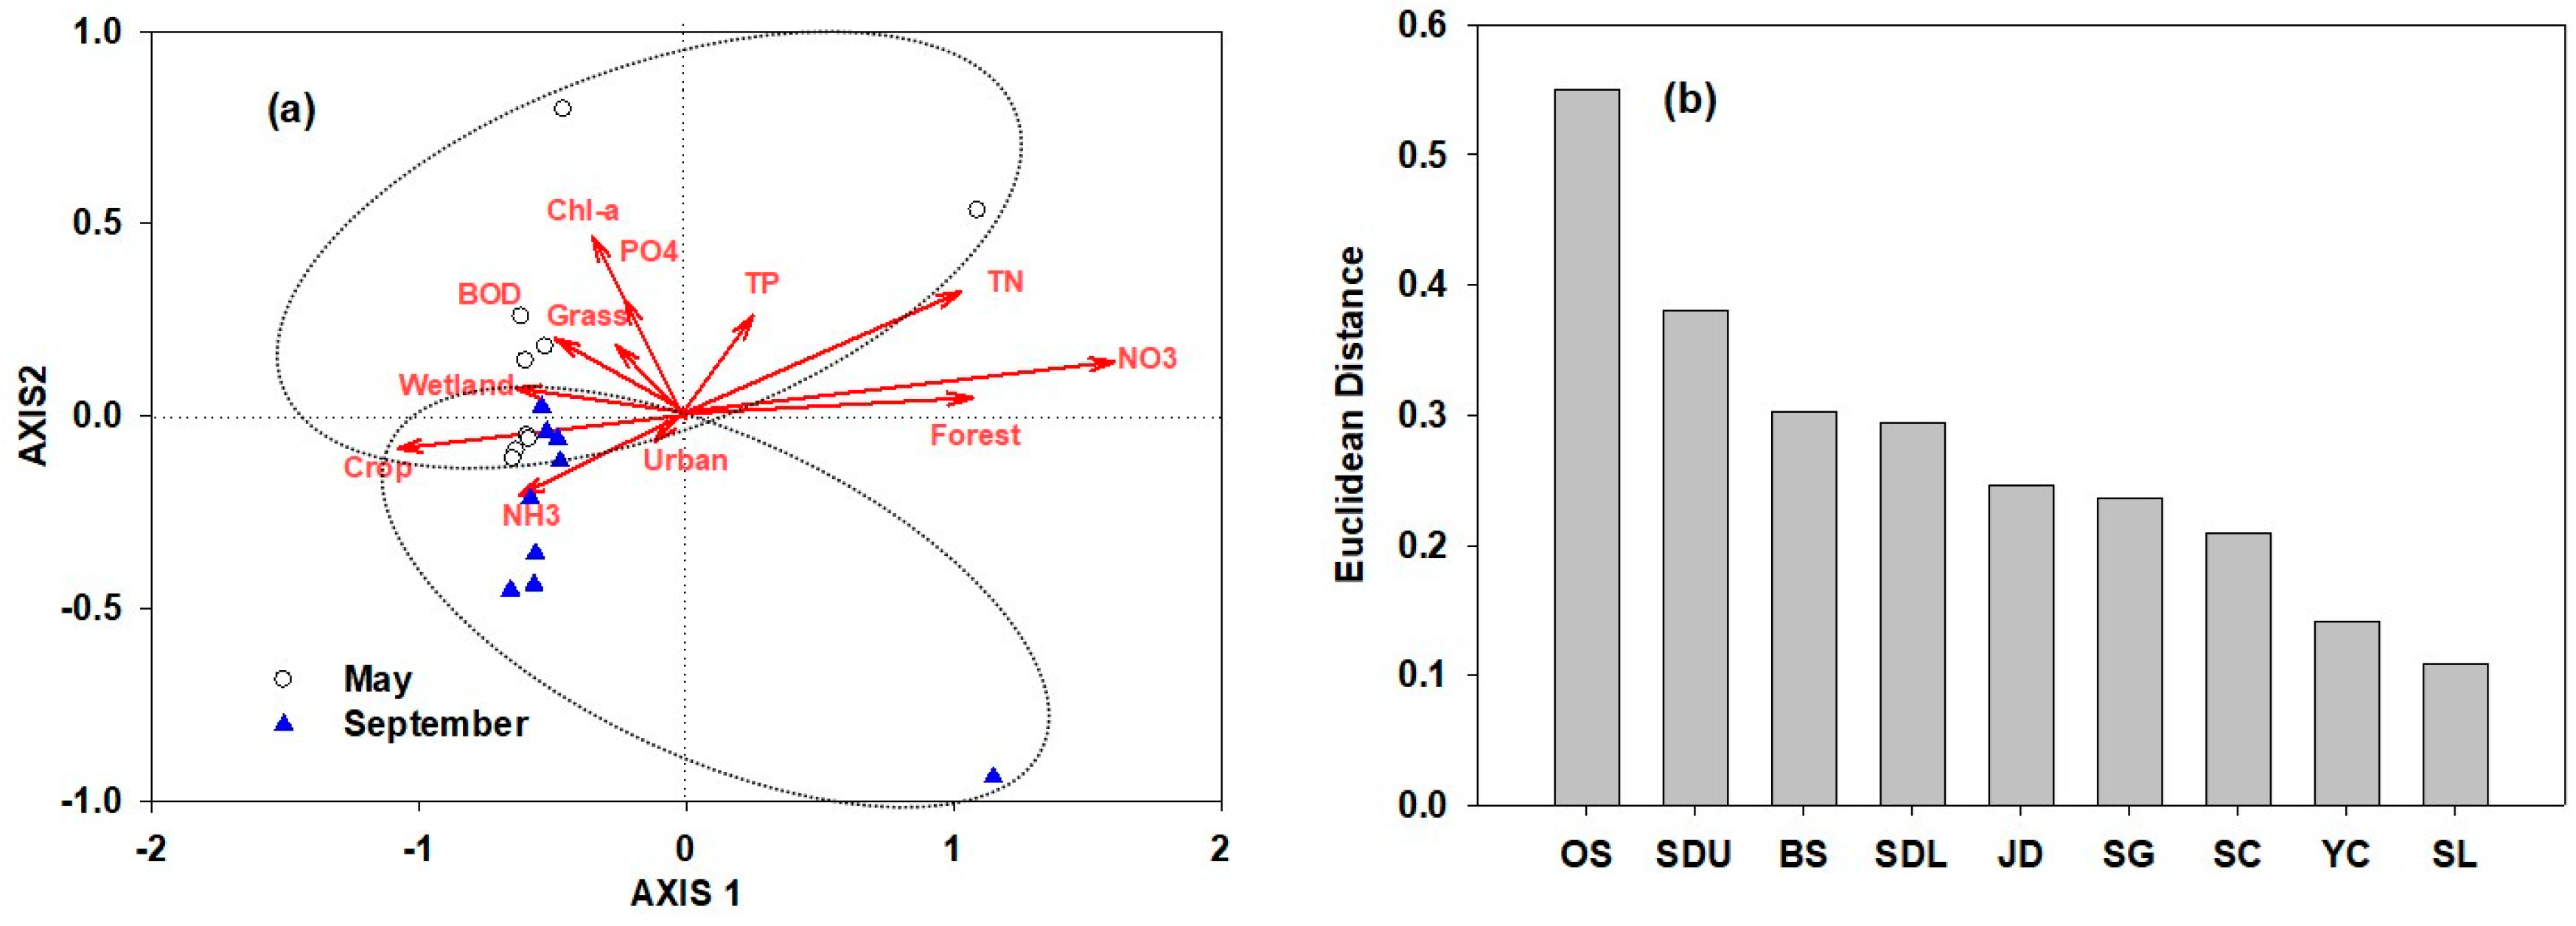
3.4. Identification of Spatiotemporal Characteristics in the Data from Seomjin River

We portrayed the data ordination according to time and space (Figure 6a). It was remarkable to primarily characterize the data characteristics between May and September. Two data points were associated with forest areas. In comparison with Figure 5a, it was certain that these data points were correlated with Asellus spp. (Isopoda) and Gammarus spp. (Amphipoda), respectively. However, most data points characterized their clear separation across the vertical axis, which implies that benthic macroinvertebrate communities were affected by the temporal change of water quality. Through this pattern, the key macroinvertebrates Coleoptera Elmidae spp. and Tricoptera Hydropsyche spp. were relatively abundant in May, while Coleoptera Eubrianax spp. were relatively abundant in September (Figure 5a and Figure 6a). Interestingly, the Ephemeroptera groups were closely associated with September compared to other key macroinvertebrates (Figure 5b and Figure 6a).
We also question what major factors could drive the water quality changes between May and September. Given the unique climatological features of East Asia, such as summer monsoons and typhoons [18,19], we conjecture that a significant factor of water quality change would be the precipitation between two time periods (Figure 2). Since our CCA did not accommodate the precipitation data, we put more emphasis on the intensity of rainfall as a key factor for benthic macroinvertebrate communities, especially in East Asian countries. There have also been plenty of literatures related to the effects of flooding on benthic macroinvertebrates on a global scale [59,60].
Keeping this clear temporal pattern of data ordination in mind, we estimated the dissimilarity of data samples between May and September. Since the amount of rainfall was spatially distinct and the corresponding land-use coverage differs, there was a conspicuous deviation of data ordination between May and September (Figure 6b). The OS and SDU sites showed a larger disparity of data compared to the YC and SL sites. While the SDU site is in a headstream area, the SL site is near the river mouth (Figure 1). In this respect, their sensitivity to rainfall could be distinct. This pattern was clearer at the SDU site, which is a forest-dominated area and was consistent with the data ordination from CCA (Figure 5).

4. Conclusions

From this study, we demonstrated how spatially benthic macroinvertebrate communities were closely related to surrounding environmental constraints such as the surrounding land use and ambient water quality. The present study depicted that land-use coverage is a primary factor and water quality is a secondary factor to evaluate benthic macroinvertebrate communities. Our analysis also showed that the water quality change in the Seomjin River basin was mainly influenced by summer precipitation, thereby inducing a community shift of benthic macroinvertebrates in Korea. In addition, we estimated and compared quantitatively the influence of summer rainfall on a spatial scale, and then linked those deviations with the surrounding land-use coverage. The data ordination explicitly accounted for 61% of the explanatory variability in benthic macroinvertebrate communities. We stress that land-use information is primarily an efficient proxy of ambient conditions to determine benthic macroinvertebrates in a stream ecosystem. Finally, our study highlights that land-use information, which is easily obtainable, is very helpful for delineating the spatial distribution of benthic macroinvertebrate communities in stream ecosystems.

Author Contributions

Conceptualization: D.-K.K., H.J., K.P., and I.-S.K.; Methodology: D.-K.K. and H.J.; Formal Analysis: D.-K.K. and H.J.; Investigation: H.J. and K.P.; Resources: I.-S.K.; Writing—Original Draft Preparation: D.-K.K.; Writing—Review and Editing: D.-K.K. and I.-S.K.; Supervision: I.-S.K.; Project Administration: I.-S.K.; Funding Acquisition: I.-S.K.

Funding

This research was funded by the National Research Foundation (NRF) of Korea, grant number NRF-2018R1A6A1A03024314, and was also supported by the project ‘Stream/River Ecosystem Survey and Health Assessment of Korea Ministry of Environment (KMOE).

Conflicts of Interest

The authors declare no conflict of interest.

References

  1. Rosenberg, D.M.; Resh, V.H. Freshwater Biomonitoring and Benthic Macroinvertebrates; Springer: Berlin/Heidelberg, Germany, 1993; p. 488. [Google Scholar]
  2. Baird, D.J.; Van den Brink, P.J. Using biological traits to predict species sensitivity to toxic substances. Ecotoxicol. Environ. Saf. 2007, 67, 296–301. [Google Scholar] [CrossRef] [PubMed]
  3. Doledec, S.; Statzner, B. Invertebrate traits for the biomonitoring of large European rivers: An assessment of specific types of human impact. Freshwat. Biol. 2008, 53, 617–634. [Google Scholar] [CrossRef]
  4. De Castro-Català, N.; Muñoz, I.; Armendáriz, L.; Campos, B.; Barceló, D.; López-Doval, J.; Pérez, S.; Petrovic, M.; Picó, Y.; Riera, J.L. Invertebrate community responses to emerging water pollutants in Iberian river basins. Sci. Total Environ. 2015, 503, 142–150. [Google Scholar] [CrossRef] [PubMed]
  5. Wallace, J.B.; Webster, J.R. The Role of Macroinvertebrates in Stream Ecosystem Function. Annu. Rev. Entomol. 1996, 41, 115–139. [Google Scholar] [CrossRef]
  6. Covich, A.P.; Palmer, M.A.; Crowl, T.A. The Role of Benthic Invertebrate Species in Freshwater Ecosystems: Zoobenthic species influence energy flows and nutrient cycling. BioScience 1999, 49, 119–127. [Google Scholar] [CrossRef]
  7. McLenaghan, N.A.; Tyler, A.C.; Mahl, U.H.; Howarth, R.W.; Marino, R.M. Benthic macroinvertebrate functional diversity regulates nutrient and algal dynamics in a shallow estuary. Mar. Ecol. Prog. Ser. 2011, 426, 171–184. [Google Scholar] [CrossRef]
  8. Ogbeibu, A.E.; Oribhabor, B.J. Ecological impact of river impoundment using benthic macro-invertebrates as indicators. Water Res. 2002, 36, 2427–2436. [Google Scholar] [CrossRef]
  9. Arimoro, F.O.; Ikomi, R.B. Ecological integrity of upper Warri River, Niger Delta using aquatic insects as bioindicators. Ecol. Indic. 2009, 9, 455–461. [Google Scholar] [CrossRef]
  10. Bonada, N.; Prat, N.; Resh, V.H.; Statzner, B. Developments in aquatic insect biomonitoring: A comparative analysis of recent approaches. Annu. Rev. Entomol. 2006, 51, 495–523. [Google Scholar] [CrossRef]
  11. Birk, S.; Bonne, W.; Borja, A.; Brucet, S.; Courrat, A.; Poikane, S.; Solimini, A.; van de Bund, W.; Zampoukas, N.; Hering, D. Three hundred ways to assess Europe’s surface waters: An almost complete overview of biological methods to implement the Water Framework Directive. Ecol. Indic. 2012, 18, 31–41. [Google Scholar] [CrossRef]
  12. Feld, C.K.; Hering, D. Community structure or function: Effects of environmental stress on benthic macroinvertebrates at different spatial scales. Freshwat. Biol. 2007, 52, 1380–1399. [Google Scholar] [CrossRef]
  13. Zhang, F.; Wang, J.; Wang, X. Recognizing the Relationship between Spatial Patterns in Water Quality and Land-Use/Cover Types: A Case Study of the Jinghe Oasis in Xinjiang, China. Water 2018, 10, 646. [Google Scholar] [CrossRef]
  14. Kim, D.-K.; Kaluskar, S.; Mugalingam, S.; Arhonditsis, G.B. Evaluating the relationships between watershed physiography, land use patterns, and phosphorus loading in the Bay of Quinte, Ontario, Canada. J. Great Lakes Res. 2016, 42, 972–984. [Google Scholar] [CrossRef]
  15. Sponseller, R.A.; Benfield, E.F.; Valett, H.M. Relationships between land use, spatial scale and stream macroinvertebrate communities. Freshwat. Biol. 2001, 46, 1409–1424. [Google Scholar] [CrossRef]
  16. Kim, D.-K.; Kaluskar, S.; Mugalingam, S.; Blukacz-Richards, A.; Long, T.; Morley, A.; Arhonditsis, G.B. A Bayesian approach for estimating phosphorus export and delivery rates with the SPAtially Referenced Regression On Watershed attributes (SPARROW) model. Ecol. Inform. 2017, 37, 77–91. [Google Scholar] [CrossRef]
  17. Wellen, C.; Arhonditsis, G.B.; Labencki, T.; Boyd, D. Application of the SPARROW model in watersheds with limited information: A Bayesian assessment of the model uncertainty and the value of additional monitoring. Hydrol. Process. 2014, 28, 1260–1283. [Google Scholar] [CrossRef]
  18. Park, S.-B.; Lee, S.-K.; Chang, K.-H.; Jeong, K.-S.; Joo, G.-J. The impact of monsoon rainfall (Changma) on the changes of water quality in the lower Nakdong River (Mulgeum). Korean J. Limnol. 2002, 35, 161–170. [Google Scholar]
  19. Park, J.-S.; Kang, H.-S.; Lee, Y.S.; Kim, M.-K. Changes in the extreme daily rainfall in South Korea. Int. J. Climatol. 2011, 31, 2290–2299. [Google Scholar] [CrossRef]
  20. Wetzel, R.G.; Likens, G.E. Limnological Analysis; Springer: Berlin/Heidelberg, Germany, 1991; p. 429. [Google Scholar]
  21. Quigley, M. Invertebrates of Streams and Rivers; Edward A. Ltd.: Colchester, London, UK, 1977; p. 84. [Google Scholar]
  22. Pennak, R.W. Freshwater Invertebrates of the United States; John Wiley and Sons, Inc.: Hoboken, MY, USA, 1978; p. 803. [Google Scholar]
  23. Brighnam, A.R.; Brighnam, W.U.; Gnika, A. Aquatic Insects and Oligochaetea of North and South Carolina; Midwest Aquatic Enterprises: Seaford, UK, 1982. [Google Scholar]
  24. Yun, I.-B. Illustrated Encyclopedia of Fauna and Flora of Korea. Aquatic Insects; Ministry of Education: Seoul, Korea, 1988; Volume 30, p. 840.
  25. Merritt, R.W.; Cummins, K.W. An Introduction to the Aquatic Insects of North America; Kendall/Hunt Publishing Company: Dubuque, IA, USA, 1996; p. 862. [Google Scholar]
  26. McNaughton, S.J. Relationships among Functional Properties of Californian Grassland. Nature 1967, 216, 168–169. [Google Scholar] [CrossRef]
  27. Shannon, C.E.; Weaver, W. The Mathematical Theory of Communication; The University of Illinois Press: Champaign, IL, USA, 1964; p. 125. [Google Scholar]
  28. Margalef, R. Temporal succession and spatial heterogeneity in phytoplankton. In Perspectives in Marine Biology; Buzzati-Traverso, A.A., Ed.; University of California Press: Berkeley, CA, USA, 1958; pp. 323–347. [Google Scholar]
  29. Pielou, E.C. Ecological Diversity; Wiley: New York, NY, USA, 1975; p. 165. [Google Scholar]
  30. Kong, D.; Son, S.-H.; Hwang, S.-J.; Won, D.H.; Kim, M.C.; Park, J.H.; Jeon, T.-S.; Lee, J.E.; Kim, J.H.; Kim, J.S.; et al. Development of benthic macroinvertebrates index (BMI) for biological assessment on stream environment. J. Korean Soc. Water Environ. 2018, 34, 183–201, (Written In Korean). [Google Scholar]
  31. Zelinka, M.; Marvan, P. Zur Präzisierung der biologischen Klassifikation der Reinheit fließender Gewässer. Arch. Hydrobiol. 1961, 57, 389–407. [Google Scholar]
  32. National Institute of Environmental Research (NIER). Biomonitoring Survey and Assessment Manual; NIER: Incheon, Korea, 2017.
  33. Lepš, J.; Šmilauer, P. Multivariate Analysis of Ecological Data Using CANOCO; Cambridge University Press: Cambridge, UK, 2003; p. 269. [Google Scholar]
  34. Ter Braak, C.J.F.; Smilauer, P. CANOCO Reference Manual and CanoDraw for Windows User’s Guide: Software for Canonical Community Ordination (version 5.0); Microcomputer Power: Ithaca, NY, USA, 2012; p. 496. [Google Scholar]
  35. Aschonitis, V.G.; Feld, C.K.; Castaldelli, G.; Turin, P.; Visonà, E.; Fano, E.A. Environmental stressor gradients hierarchically regulate macrozoobenthic community turnover in lotic systems of Northern Italy. Hydrobiologia 2016, 765, 131–147. [Google Scholar] [CrossRef]
  36. Osborne, J.W. Improving your data transformation: Applying the Box-Cox transformation. Pract. Assess. Res. Eval. 2010, 15, 1–9. [Google Scholar]
  37. Liu, R.; Wang, Q.; Xu, F.; Men, C.; Guo, L. Impacts of manure application on SWAT model outputs in the Xiangxi River watershed. J. Hydrol. 2017, 555, 479–488. [Google Scholar] [CrossRef]
  38. Tiessen, K.H.D.; Elliott, J.A.; Yarotski, J.; Lobb, D.A.; Flaten, D.N.; Glozier, N.E. Conventional and conservation tillage: Influence on seasonal runoff, sediment, and nutrient losses in the Canadian Prairies. J. Environ. Qual. 2010, 39, 964–980. [Google Scholar] [CrossRef]
  39. Ahn, K.S. The water pollution of Yocheon, uppermost stream of the Sumjin River. J. Korean Earth Sci. Soc. 2005, 26, 821–827. [Google Scholar]
  40. Liang, T.; Wang, S.; Cao, H.; Zhang, C.; Li, H.; Li, H.; Song, W.; Chong, Z. Estimation of ammonia nitrogen load from nonpoint sources in the Xitiao River catchment, China. J. Environ. Sci. 2008, 20, 1195–1201. [Google Scholar] [CrossRef]
  41. Chen, A.; Lei, B.; Hu, W.; Lu, Y.; Mao, Y.; Duan, Z.; Shi, Z. Characteristics of ammonia volatilization on rice grown under different nitrogen application rates and its quantitative predictions in Erhai Lake Watershed, China. Nutr. Cycl. Agroecosyst. 2015, 101, 139–152. [Google Scholar] [CrossRef]
  42. Bünemann, E.K.; Heenan, D.P.; Marschner, P.; McNeill, A.M. Long-term effects of crop rotation, stubble management and tillage on soil phosphorus dynamics. Aust. J. Soil Res. 2006, 44, 611–618. [Google Scholar] [CrossRef]
  43. Easton, Z.M.; Gérard-Marchant, P.; Walter, M.T.; Petrovic, A.M.; Steenhuis, T.S. Identifying dissolved phosphorus source areas and predicting transport from an urban watershed using distributed hydrologic modeling. Water Resour. Res. 2007, 43. [Google Scholar] [CrossRef]
  44. Ahn, S.R.; Jeong, J.H.; Kim, S.J. Assessing drought threats to agricultural water supplies under climate change by combining the SWAT and MODSIM models for the Geum River basin, South Korea. Hydrol. Sci. J. 2016, 61, 2740–2753. [Google Scholar] [CrossRef]
  45. Jeong, K.-S.; Hong, D.-G.; Byeon, M.-S.; Jeong, J.-C.; Kim, H.-G.; Kim, D.-K.; Joo, G.-J. Stream modification patterns in a river basin: Field survey and self-organizing map (SOM) application. Ecol. Inform. 2010, 5, 293–303. [Google Scholar] [CrossRef]
  46. Jäch, M.A.; Balke, M. Global diversity of water beetles (Coleoptera) in freshwater. Hydrobiologia 2008, 595, 419–442. [Google Scholar] [CrossRef]
  47. Jung, S.W.; Jäch, M.A.; Bae, Y.J. Review of the Korean Elmidae (Coleoptera: Dryopoidea) with descriptions of three new species. Aquat. Insects 2014, 36, 93–124. [Google Scholar] [CrossRef]
  48. Criado, F.G.; Alaez, M.F. Aquatic Coleoptera (Hydraenidae and Elmidae) as indicators of the chemical characteristics of water in the Orbigo River basin (N-W Spain). Ann. Limnol. Int. J. Lim. 1995, 31, 185–199. [Google Scholar] [CrossRef]
  49. Wallace, J.B. Food Partitioning in Net-spinning Trichoptera Larvae: Hydropsyche venularis, Cheumatopsyche etrona, and Macronema zebratum (Hydropsychidae). Ann. Entomol. Soc. Am. 1975, 68, 463–472. [Google Scholar] [CrossRef]
  50. Fuller, R.L.; Mackay, R.J. Effects of food quality on the growth of three Hydropsyche species (Trichoptera: Hydropsychidae). Can. J. Zool. 1981, 59, 1133–1140. [Google Scholar] [CrossRef]
  51. Osborne, L.L.; Herricks, E.E. Microhabitat Characteristics of Hydropsyche (Trichoptera:Hydropsychidae) and the Importance of Body Size. J. N. Am. Benthol. Soc. 1987, 6, 115–124. [Google Scholar] [CrossRef]
  52. Beketov, M. Different sensitivity of mayflies (Insecta, Ephemeroptera) to ammonia, nitrite and nitrate: Linkage between experimental and observational data. Hydrobiologia 2004, 528, 209–216. [Google Scholar] [CrossRef]
  53. Lammers-Campbell, R. Ordination of Chironomid (Diptera: Chironomidae) Communities Characterizing Habitats in a Minnesota Peatland. J. Kans. Entomol. Soc. 1998, 71, 414–425. [Google Scholar]
  54. Principe, R.E.; Boccolini, M.F.; Corigliano, M.C. Structure and Spatial-Temporal Dynamics of Chironomidae Fauna (Diptera) in Upland and Lowland Fluvial Habitats of the Chocancharava River Basin (Argentina). Int. Rev. Hydrobiol. 2008, 93, 342–357. [Google Scholar] [CrossRef]
  55. Campbell, B.D.; Haro, R.J.; Richardson, W.B. Effects of agricultural land use on chironomid communities: Comparisons among natural wetlands and farm ponds. Wetlands 2009, 29, 1070–1080. [Google Scholar] [CrossRef]
  56. Corkum, L.D. Responses of chlorophyll-a, organic matter, and macroinvertebrates to nutrient additions in rivers flowing through agricultural and forested land. Arch. Hydrobiol. 1996, 136, 391–411. [Google Scholar]
  57. Hemphill, N. Competition between two stream dwelling filter-feeders, Hydropsyche oslari and Simulium virgatum. Oecologia 1988, 77, 73–80. [Google Scholar] [CrossRef]
  58. Azrina, M.Z.; Yap, C.K.; Rahim Ismail, A.; Ismail, A.; Tan, S.G. Anthropogenic impacts on the distribution and biodiversity of benthic macroinvertebrates and water quality of the Langat River, Peninsular Malaysia. Ecotoxicol. Environ. Saf. 2006, 64, 337–347. [Google Scholar] [CrossRef]
  59. Scrimgeour, G.J.; Winterbourn, M.J. Effects of floods on epilithon and benthic macroinvertebrate populations in an unstable New Zealand river. Hydrobiologia 1989, 171, 33–44. [Google Scholar] [CrossRef]
  60. Robinson, C.T.; Uehlinger, U.; Monaghan, M.T. Effects of a multi-year experimental flood regime on macroinvertebrates downstream of a reservoir. Aquat. Sci. 2003, 65, 210–222. [Google Scholar] [CrossRef] [Green Version]
Figure 1. Map of the study area and land-use information in the Seomjin River catchment. The red circles indicate a total of 124 study sites. The entire watershed was divided into nine subwatersheds.
Applsci 09 05162 g001
Figure 2. Total precipitation of the Seomjin River basin in 2017, based on nine major subwatersheds.
Applsci 09 05162 g002
Figure 3. Comparison of water quality and biological indices between May and September. Error bars indicate standard errors. Asterisks represent statistical significances at P < 0.05. (a) TN; (b) NH3-N; (c) NO3-N; (d) TP; (e) PO4-P; (f) Chl-a; (g) BOD; (h) DI; (i) EI; (j) H’; (k) RI; (l) BMI.
Applsci 09 05162 g003
Figure 4. Average abundance of benthic macroinvertebrate communities based on (a) order and (b) subcategory (family, genus, and species) in Seomjin River.
Applsci 09 05162 g004
Figure 5. Results of data ordination based on canonical correspondence analysis (CCA). Comparison of land use and water quality with benthic macroinvertebrate communities; (a) 14 groups, and (b) eight Ephemeroptera groups.
Applsci 09 05162 g005
Figure 6. (a) CCA data ordination associated with data samples and ambient environmental factors. (b) Dissimilarity of data attributes between May and September.
Applsci 09 05162 g006
Table 1. The relative abundances of benthic macroinvertebrates in Seomjin River. SDU: Seomjin Dam in the upper site, SDL: Seomjin Dam in the lower site, OS: Oh-Soo, SC: Soon-Chang, YC: Yo-Cheon, SG: Seomjin-Gokseong, JD: Juam Dam, BS: Bo-Seong, SL: Seomjin River.
OrderFamily or GenusMonthSDUSDLOSSCYCSGJDBSSL
AmphipodaGammarus spp.May26.6%0.0%0.0%0.0%0.1%0.0%0.0%0.0%0.6%
Sep69.6%0.0%0.0%0.0%0.1%0.0%0.0%0.0%0.0%
ArhynchobdellidaErpobdella spp.May0.1%0.0%0.3%0.2%0.3%0.2%0.1%0.1%0.3%
Sep0.0%0.2%12.0%2.1%2.7%2.0%1.0%0.2%0.8%
ColeopteraElmidae spp.May0.2%1.9%8.3%0.7%0.6%10.6%0.5%0.5%0.3%
Sep0.0%9.0%2.4%0.3%2.9%0.1%1.9%0.7%1.7%
Eubrianax spp.May0.0%0.0%0.0%0.1%0.1%0.1%0.0%0.1%0.5%
Sep0.9%0.6%1.2%6.6%0.5%4.2%9.6%11.8%1.1%
DecapodaCaridina spp.May0.0%0.5%0.1%0.3%0.0%0.1%0.0%0.1%0.0%
Sep0.0%4.5%10.9%1.1%0.3%0.2%0.0%0.7%0.3%
DipteraChironomidaeMay9.6%21.9%23.5%61.7%51.6%44.3%66.3%36.1%37.8%
Sep5.9%24.1%19.5%30.3%30.3%19.1%28.1%19.5%24.4%
Simulium spp.May7.4%0.5%0.4%0.7%0.5%0.3%0.1%0.7%1.9%
Sep0.7%0.0%0.3%0.0%0.0%0.1%0.2%0.0%1.1%
EphemeropteraBaetiella spp.May0.1%0.0%0.2%0.0%3.8%0.7%0.0%3.3%3.4%
Sep0.3%1.5%0.1%0.0%2.0%0.4%0.0%0.0%5.1%
Baetis spp.May1.5%13.7%4.6%8.8%10.9%1.8%4.7%18.4%9.5%
Sep6.5%4.0%8.2%16.1%7.6%12.8%9.7%2.4%20.2%
CaenidaeMay0.1%3.2%0.0%1.1%0.0%0.1%0.4%0.4%0.7%
Sep0.4%0.6%0.0%2.2%0.0%1.5%1.8%15.9%0.9%
Choroterpes spp.May1.4%2.6%0.7%2.7%2.1%0.8%6.0%7.2%4.0%
Sep0.0%0.8%0.9%0.7%1.6%1.3%2.4%4.0%1.1%
Ecdyonurus spp.May4.0%0.0%0.7%2.6%2.9%8.7%2.3%3.2%5.0%
Sep2.2%23.1%3.9%1.4%9.3%11.2%13.5%14.0%12.4%
Epeorus spp.May0.4%0.1%0.0%0.0%1.7%0.1%0.3%0.1%4.4%
Sep1.1%0.0%0.1%0.1%2.4%1.5%0.1%0.0%3.2%
Ephemera spp.May0.1%0.2%0.4%1.1%1.4%1.1%4.5%1.2%0.4%
Sep0.3%0.3%0.3%4.5%2.7%0.1%4.9%3.8%0.6%
Labiobaetis spp.May0.0%0.3%0.0%0.1%0.0%0.0%0.0%0.0%0.0%
Sep0.5%8.7%1.9%0.0%0.1%0.0%0.2%0.0%0.1%
GastropodaSemisulcospira spp.May1.5%40.4%16.6%8.1%7.0%22.2%3.0%15.3%16.3%
Sep0.6%11.6%19.4%7.1%18.1%19.6%16.2%11.8%15.6%
Radix spp.May0.4%0.1%2.1%0.7%1.3%1.7%0.3%0.3%2.0%
Sep0.1%0.0%0.3%0.0%0.2%1.0%0.8%6.6%1.4%
HaplotaxidaLimnodrilus spp.May0.5%1.7%2.1%7.7%6.2%3.1%9.3%5.4%1.5%
Sep0.5%2.9%1.7%25.6%2.2%15.2%6.9%6.0%2.6%
IsopodaAsellus sp.May41.0%0.0%2.1%0.2%0.5%1.1%1.2%0.0%0.0%
Sep3.3%0.2%0.6%0.0%0.1%4.8%0.0%0.0%0.1%
TrichopteraCheumatopsyche spp.May0.2%8.4%10.4%0.1%2.6%0.0%0.0%0.1%0.5%
Sep2.2%5.0%13.6%0.0%0.2%0.0%0.2%0.0%0.4%
Hydropsyche spp.May2.6%3.2%24.5%0.2%0.6%0.1%0.0%0.7%7.4%
Sep1.2%2.9%1.7%0.0%2.4%0.0%0.0%0.0%0.1%
TricladidaDugesia spp.May2.3%1.3%2.9%3.0%5.9%2.9%0.9%6.8%3.5%
Sep3.7%0.0%0.9%1.8%14.3%5.1%2.5%2.8%6.6%

