Article

Evaluation of Self-Compacting Concrete Strength with Non-Destructive Tests for Concrete Structures

by
Miguel C. S. Nepomuceno
* and
Luís F. A. Bernardo
C-MADE—Centre of Materials and Building Technologies, Department of Civil Engineering and Architecture, University of Beira Interior, 6201-001 Covilhã, Portugal
*
Author to whom correspondence should be addressed.
Appl. Sci. 2019, 9(23), 5109; https://doi.org/10.3390/app9235109
Submission received: 30 October 2019 / Revised: 21 November 2019 / Accepted: 22 November 2019 / Published: 26 November 2019
(This article belongs to the Special Issue Architectural Structure)

Abstract

:
Self-compacting concrete (SCC) shows to have some specificities when compared to normal vibrated concrete (NVC), namely higher cement paste dosage and smaller volume of coarse aggregates. In addition, the maximum size of coarse aggregates is also reduced in SCC to prevent blocking effect. Such specificities are likely to affect the results of non-destructive tests when compared to those obtained in NVC with similar compressive strength and materials. This study evaluates the applicability of some non-destructive tests to estimate the compressive strength of SCC. Selected tests included the ultrasonic pulse velocity test (PUNDIT), the surface hardness test (Schmidt rebound hammer type N), the pull-out test (Lok-test), and the concrete maturity test (COMA-meter). Seven sets of SCC specimens were produced in the laboratory from a single mixture and subjected to standard curing. The tests were applied at different ages, namely: 1, 2, 3, 7, 14, 28, and 94 days. The concrete compressive strength ranged from 45 MPa (at 24 h) to 97 MPa (at 94 days). Correlations were established between the non-destructive test results and the concrete compressive strength. A test variability analysis was performed and the 95% confidence limits for the obtained correlations were computed. The obtained results for SCC showed good correlations between the concrete compressive strength and the non-destructive tests results, although some differences exist when compared to the correlations obtained for NVC.

Graphical Abstract

1. Introduction

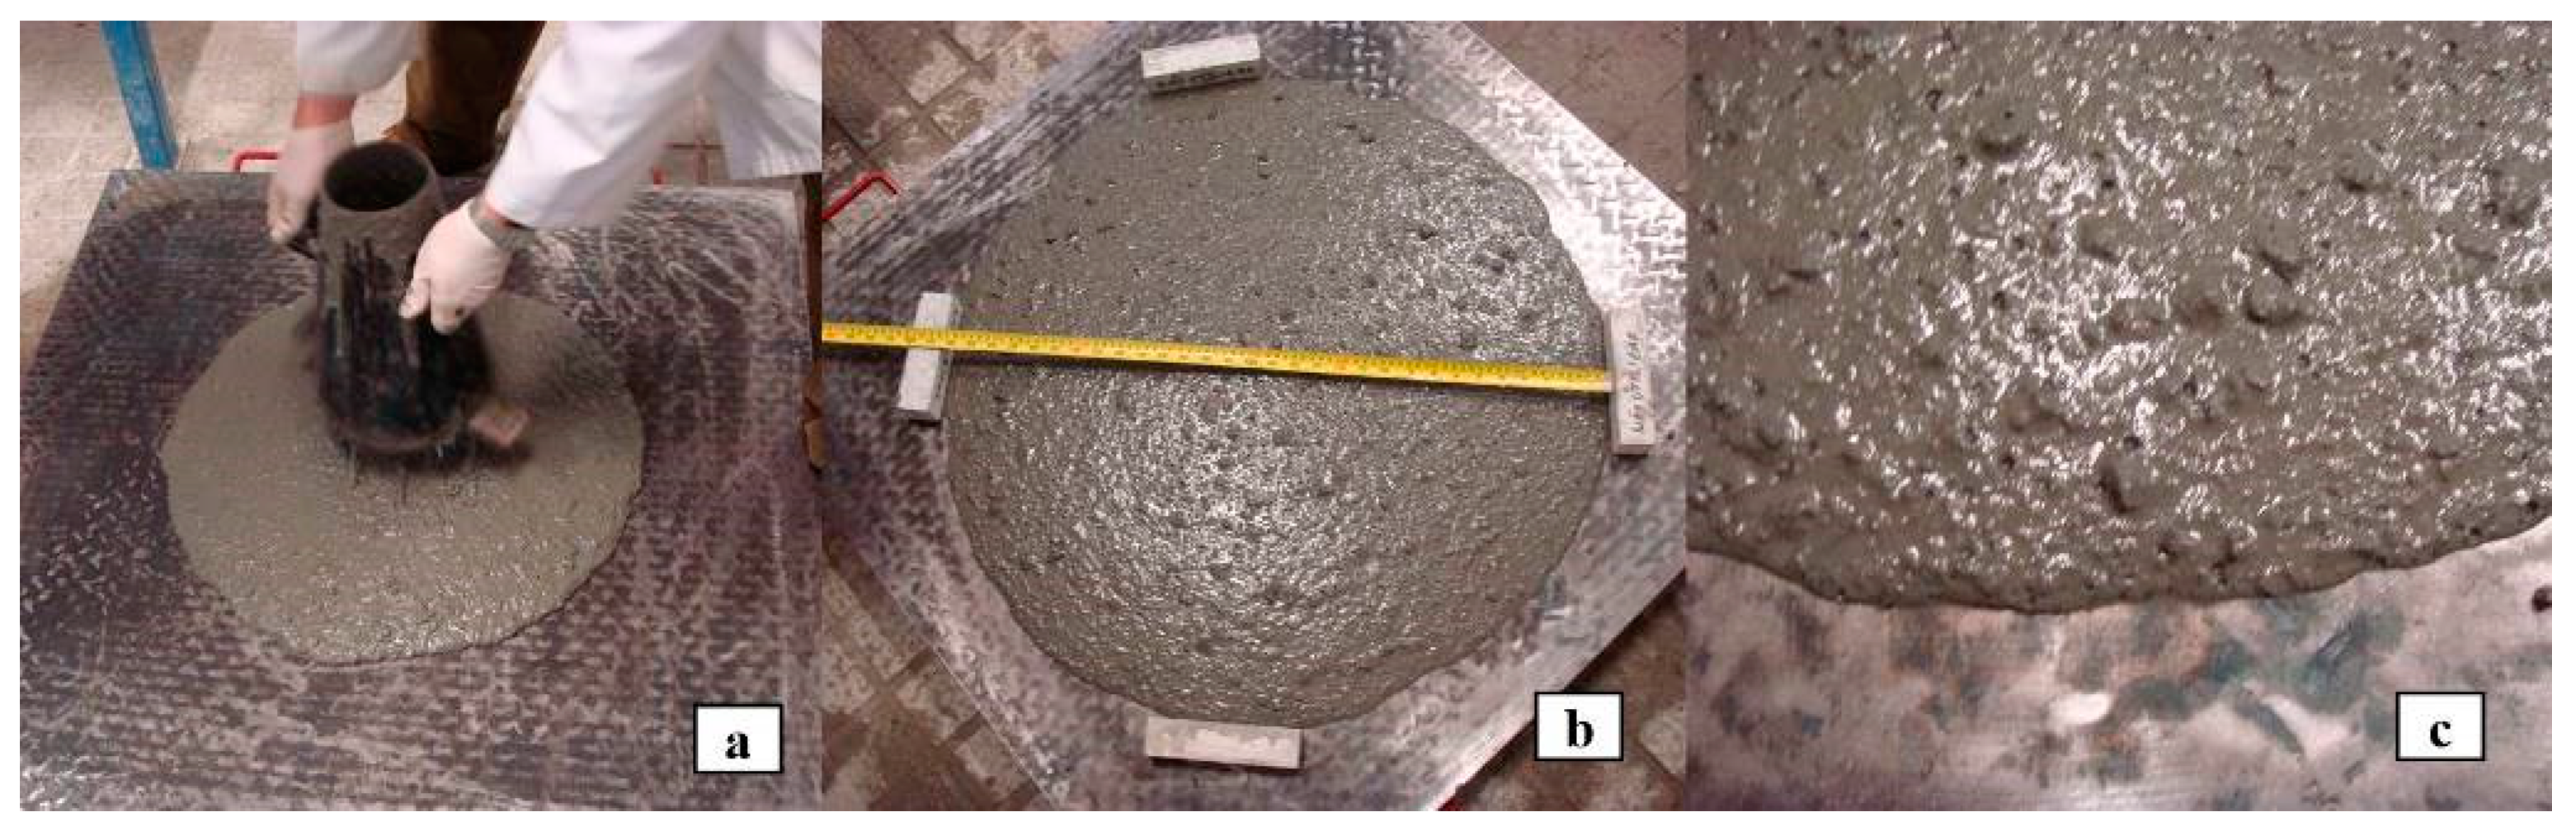
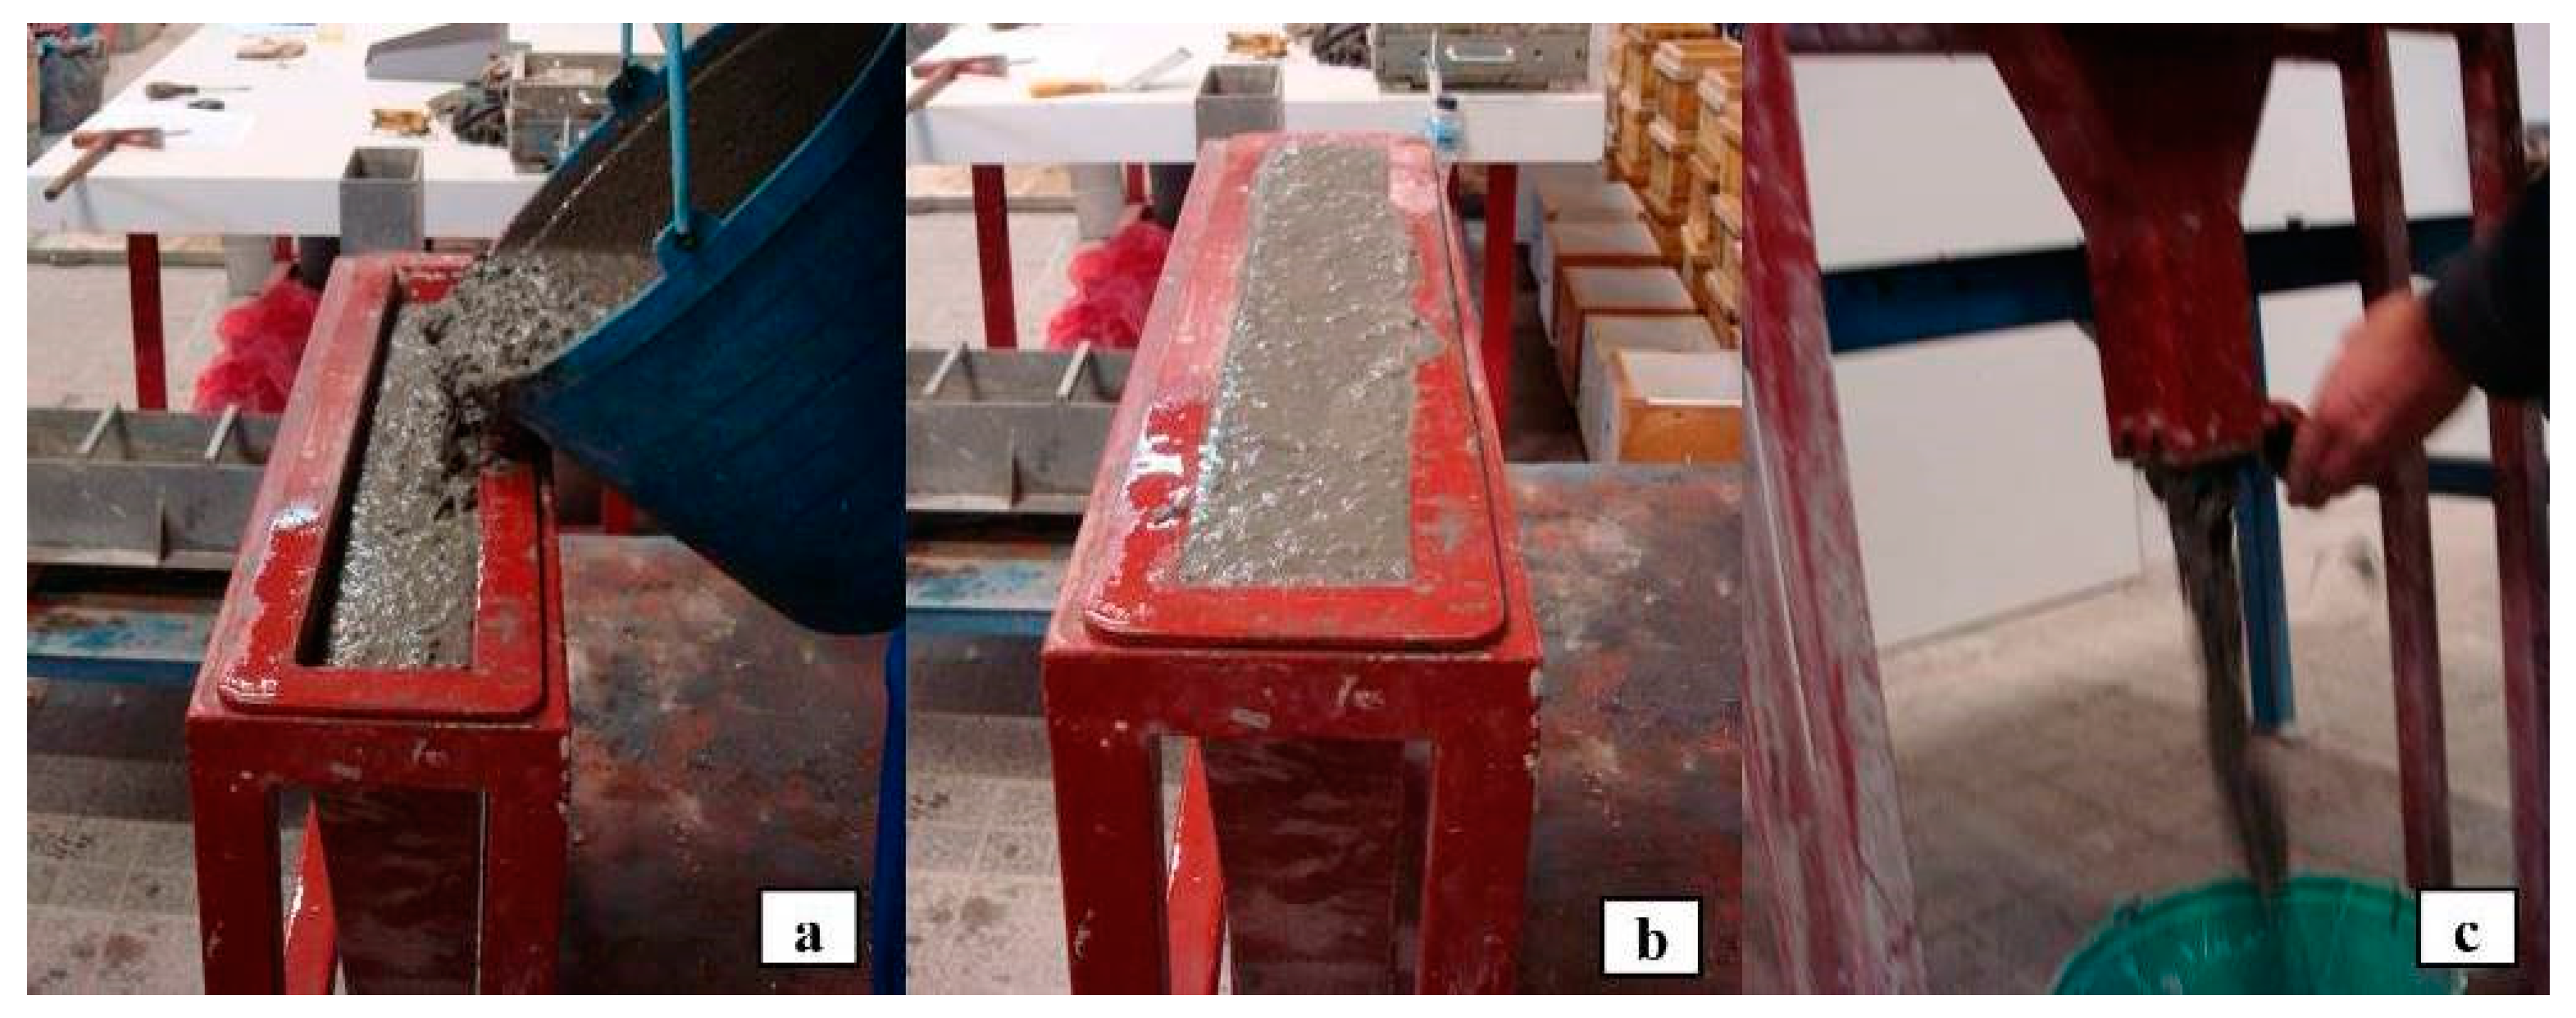
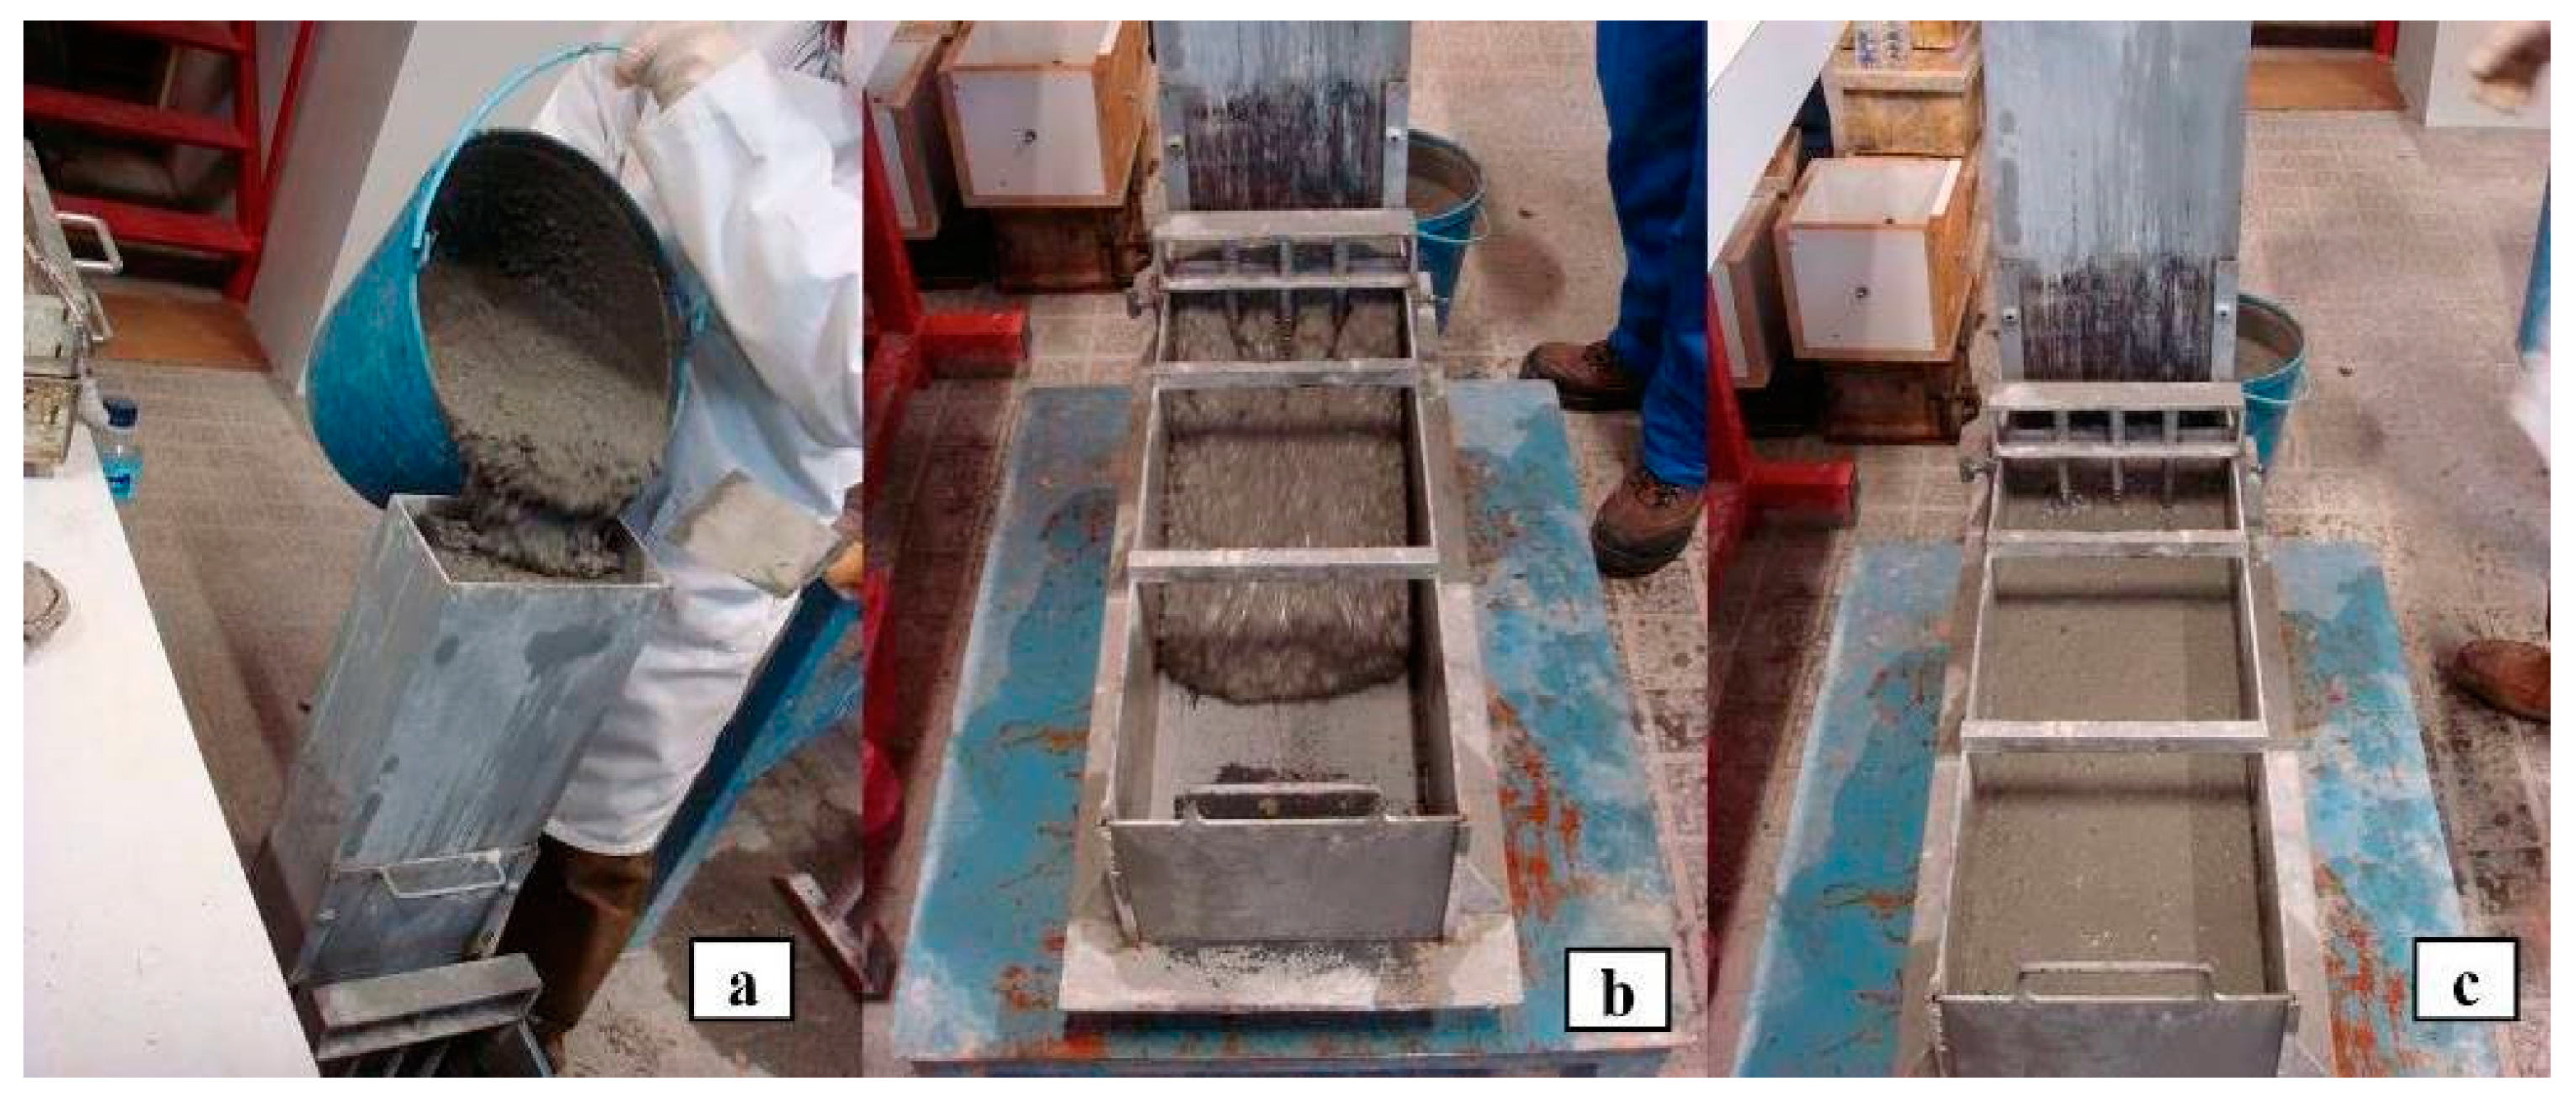
Since the middle of last century, concrete has undergone several developments and continued to show to be a remarkably versatile material for many applications in civil constructions. Nowadays, concrete still continues to be the preferential construction material to integrate many structural members for different kinds of constructions and infrastructures, such as buildings, bridges, dams, among others. In particular, many architectural structures have been and still are built using concrete as the key building material to achieve often complex spatial geometries. In this particular case, self-compacting concrete (SCC) has been widely used because it can be placed easily in complicated formwork and with high degree of reinforcement without the need of vibration. In addition, SCC produces a smooth and well-finished surface at the end of concreting, which is an important factor in many architectural structures with exposed concrete.
In the last years, maintenance and rehabilitation concerns have also covered concrete as a building material. Its preservation is essential to ensure the stability of the structure, so as not to impair its use nor jeopardize the safety of the users during the intended lifetime.
The need to ensure the quality of concrete structures, the verification of aging of older structures and the premature degradation of recent ones justify, because of the associated high costs, special attention to the study of maintenance and rehabilitation issues. Nowadays, if existent concrete structures show unacceptable deterioration, a correct assessment of the actual state of concrete is required to quantify the available safety margin. The effective concrete compressive strength is usually a key parameter that is required to perform this evaluation. Other situations that require an evaluation of concrete strength include the quality control of precast or in-situ concrete application, namely to decide when handling and transport precast units, to evaluate the concrete compressive strength for application of prestress, or to support the decision to remove formwork or temporary supports for structural elements.
The use of non-destructive tests (NDT) to evaluate concrete quality and to estimate its in-situ compressive strength has been well-known for some decades [1,2,3,4,5]. Many of these tests and devices were initially developed for normal vibrated concrete (NVC) of normal strength range. However, in the nineties of the last century, some of these tests and devices were adapted for high-strength NVC [6,7,8,9]. Specific studies concerning the application of NDT in SCC are still scarce [10]. The procedures to apply the most firmly established NDT methods can be found in the normative documents from different countries. However, it is important to mention that such procedures can present small differences between them and the selection of the most appropriate method should be decided previous to test, to avoid divergences when interpreting the results [4,5].
The range of available tests vary from the most economical, simple, and easy to use (e.g., surface hardness test, ultrasonic pulse velocity test, and pull-out test using Lok-test system), to the most complicated (e.g., pull-off test using Bond-test system with partial coring and pull-out test using CAPO-test system) and expensive ones (e.g., Windsor Probe Test System and Maturity meter). Careful selection of the types of tests to be combined in each situation is critical to achieve both accuracy of results and cost savings [1,3,4]. When such tests are applied, it is necessary to evaluate the variables which can affect the test results and the correlations. Some tests are more sensitive and/or reliable than others, but all of them can differ in terms of the within-test variability and repeatability of test results [10,11,12,13].
In general, the interpretation and validation of NDT results should involve three distinct phases [10]: processing of collected data, analysis of within-test variability, and quantitative evaluation of the property under analysis. Relevant information can be obtained by the analysis of within-test variability, by comparing the obtained results in a location with the typical one for the NDT method in use, either to provide a measure of the quality control or to detect abnormal circumstances in NDT application [10]. A good planning of a research when inspecting a concrete structure should also include the procedures for data treatment and interpretation of in-situ test results prior to the inspection. When monitoring concrete compressive strength during construction, it is usually sufficient to compare test results with the limits established by trials made at the start of the contract, but in other complex situations, like in old structures, the prediction of the actual concrete compressive strength could be required for calculation design. Depending on the purpose of the research, either for estimation of the in-situ concrete compressive strength for conformity checking, either for design calculations, many questions concerning the conversion between the mean value of compressive strength and the characteristic value or the minimum in-situ design value, or either about the safety factor coefficient to apply, may lead to complex discussions, because of the basic differences between in-situ concrete and the standard test specimens upon which most specifications are based [1,4].
Most of the NDT give a measure of a property of concrete on the surface or near to the surface that can be related to concrete strength (surface hardness, resistance to penetration of a probe, pull-out force of a 25 mm ring placed at 25 mm depth, pull-off force to extract a cylindrical disk glued to the surface or near the surface to measure direct tensile strength, internal fracture test, among others). The obtained readings of NDT may be correlated with compressive strength experimentally. However, placing, compacting, and curing may turn the concrete in the surface zone unrepresentative of the concrete at deeper levels, and care should be taken to ensure that the correlations adopted are relevant to the circumstances of use. One of the NDT methods that does not cause any damages on concrete surface and can be used to evaluate the interior mass of concrete elements is the ultrasonic pulse velocity test. However, the ultrasonic pulse velocity in reinforced concrete is significantly affected by the presence of steel reinforcement, and this can impair significantly the results [1,3,4]. It is worth mentioning that, because of its versatility, the ultrasonic pulse velocity test can also be used in rocks to evaluate its mechanical properties, e.g., for structural diagnosis of old rock masonry of historical heritage building [14]. Likewise, the surface hardness test (type-L) can also be used to estimate the compressive strength in rocks for the same purpose.
The number and type of variables affecting the correlations with the concrete compressive strength may differ for each NDT method. Some correlations can include correction parameters to attend for some of these variables in order to broad the range of application of the test, while others are missing with respect to this. As examples, some of the referred variables that can affect the correlations are the following ones [1,3,4]: differences in concrete mix proportions (quantity, nature, shape, and texture of aggregates; type and amount of cement; paste to aggregate ratio, water to cement ratio, among others); differences in moisture conditions (saturated or dry); type and size of the test specimens used to establish the correlation; surface carbonation (which changes the relationship between the superficial and inner concrete); the age of concrete and used curing type (in some methods the correlations are different for concrete with short ages compared to concrete over 28 days); differences in concrete surface finish (metal formwork may lead to differences in the surface layer when compared with wood formwork); the used equipment (similar equipment with the same technical reference may have different correlation); the used procedure (different procedures may lead to different results); different stress states in the tested element may affect the readings; the mass of the test specimen, among others.
When selecting the most appropriate method some factors are crucial, such as: the purpose of the testing, practical factor related to the nature and position of the concrete under evaluation, the availability and reliability of surface damage, size of member to be tested, the complexity and preparation of the operation, access requirements and test positions. In some circumstances, the selection of a NDT which is quicker to carry out and less damaging can be more useful to mapping areas of different quality in a structural member (without the need to use correlations with compressive strength) and to locate appropriate areas for testing by other methods, more destructive and usually more expensive, but more precise, including the extraction of a small number of cores.
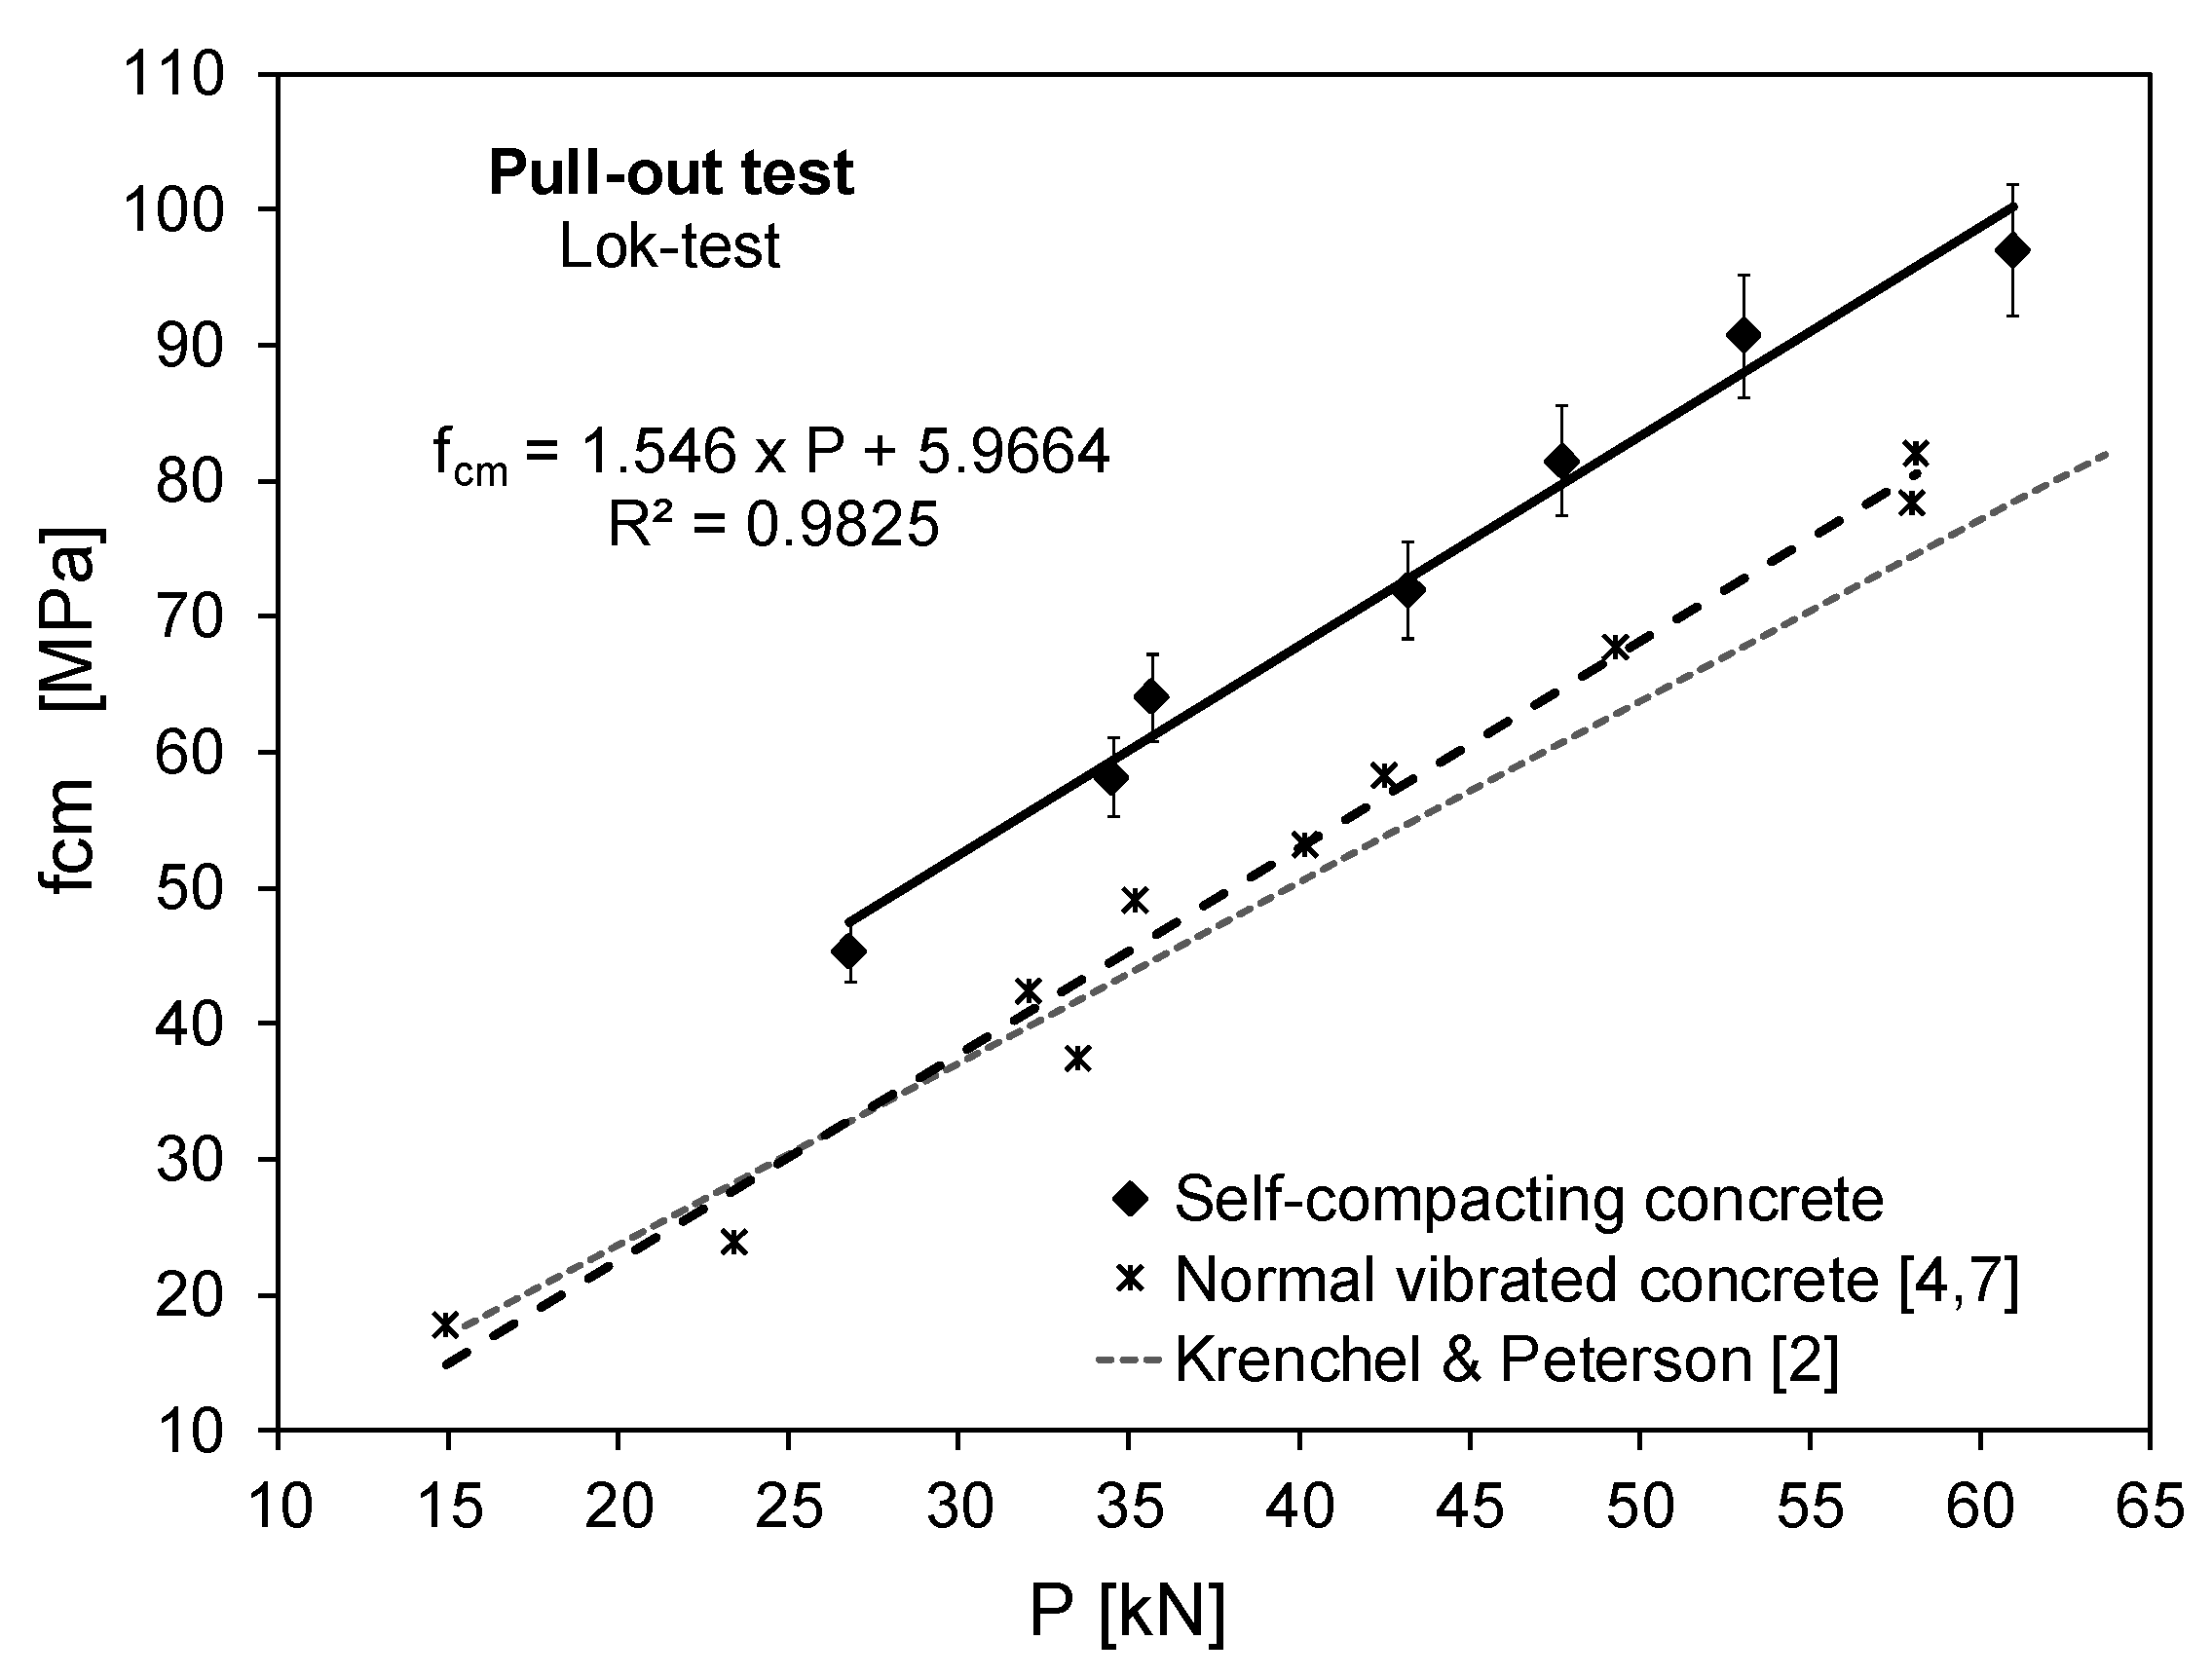
For the majority of the NDT, it is recommended that a specific correlation is obtained for the type of concrete under investigation to achieve higher accuracy. However, there are some NDT, such as the pull-out test, for which the use of general correlations is allowed to estimate concrete compressive strength with reasonable accuracy for a wide range of concrete mixes of NVC [15]. According to BS 1881-207:1992 [15], even for the pull-out test, special correlations are required for lightweight concretes or other mixes with less common constituents. It could be the case of SCC, in which the mix proportions differ from NVC in order to achieve the required fresh properties.
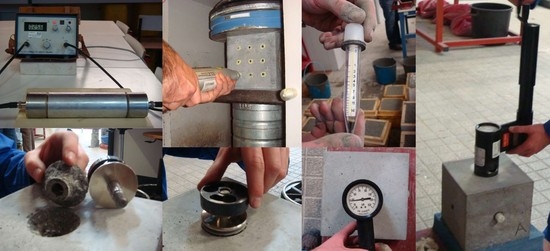
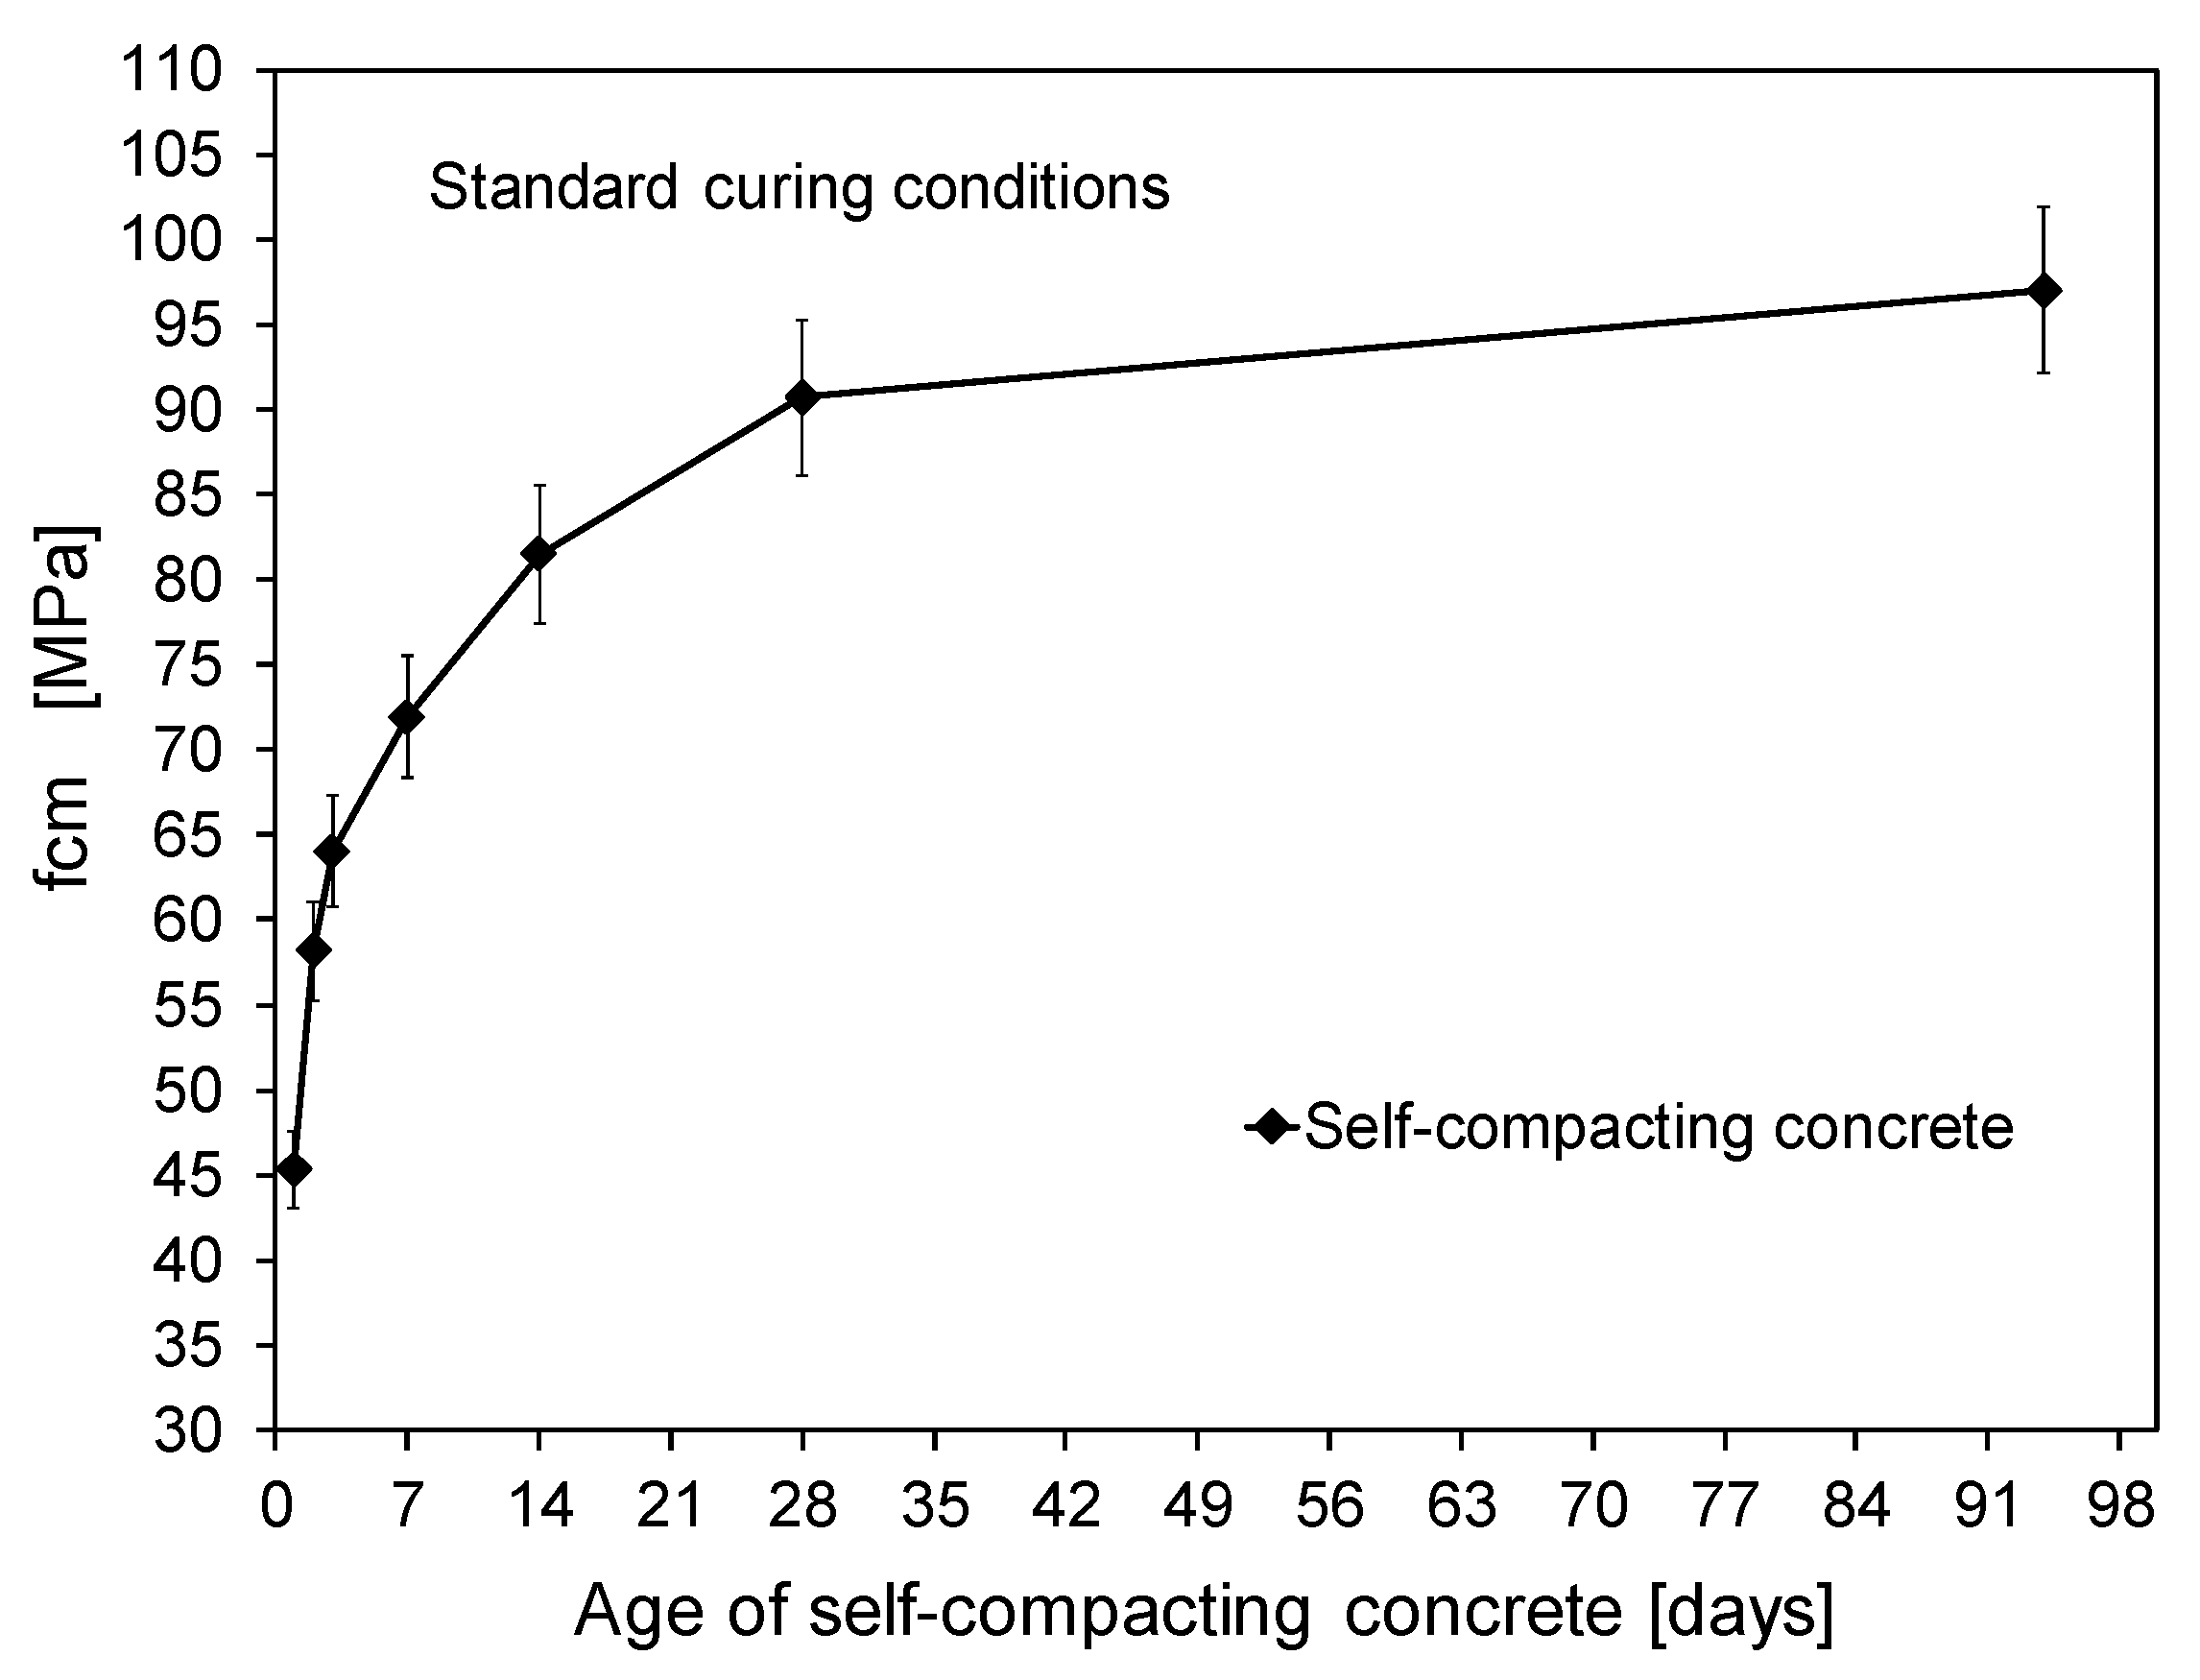
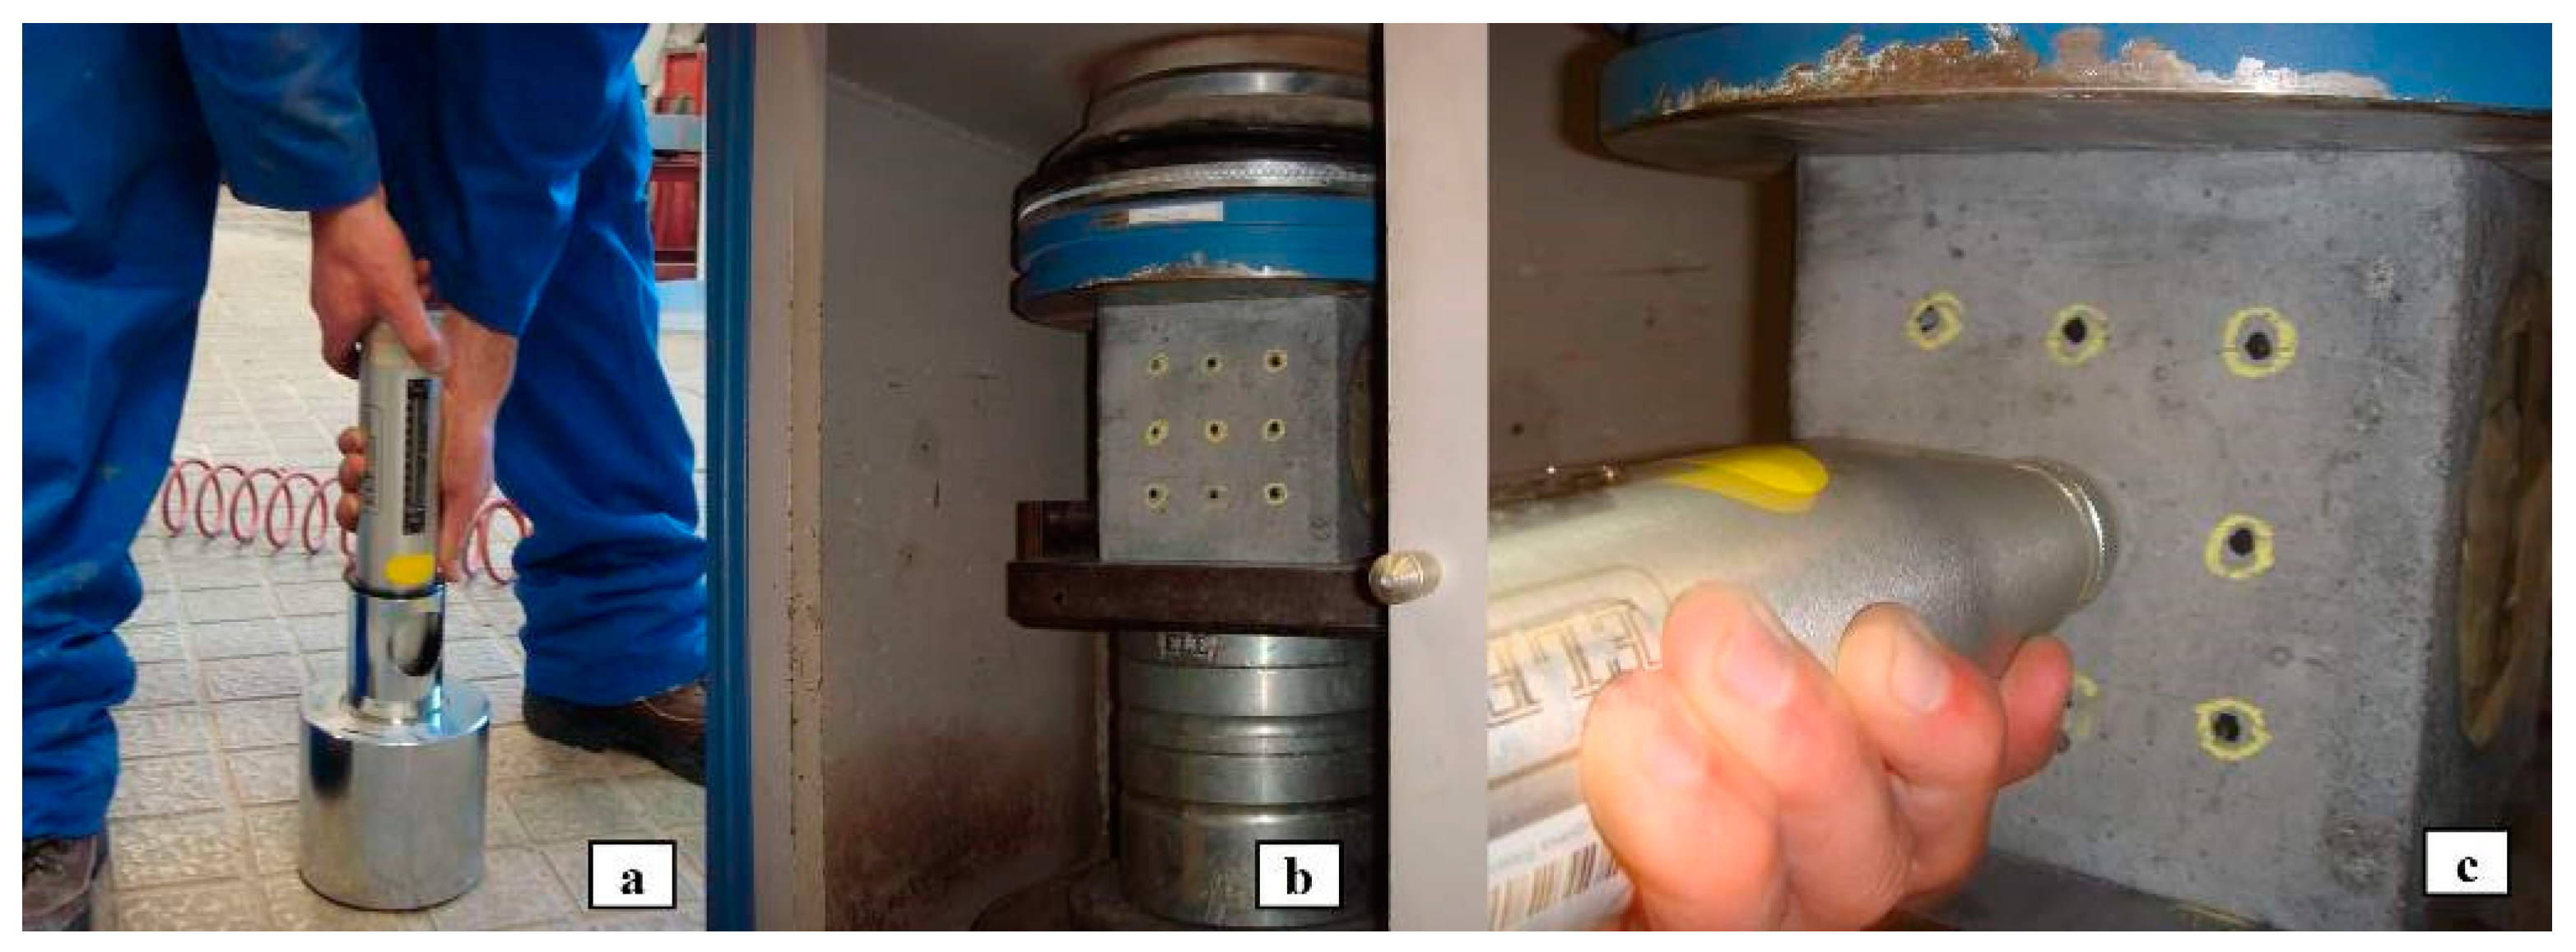
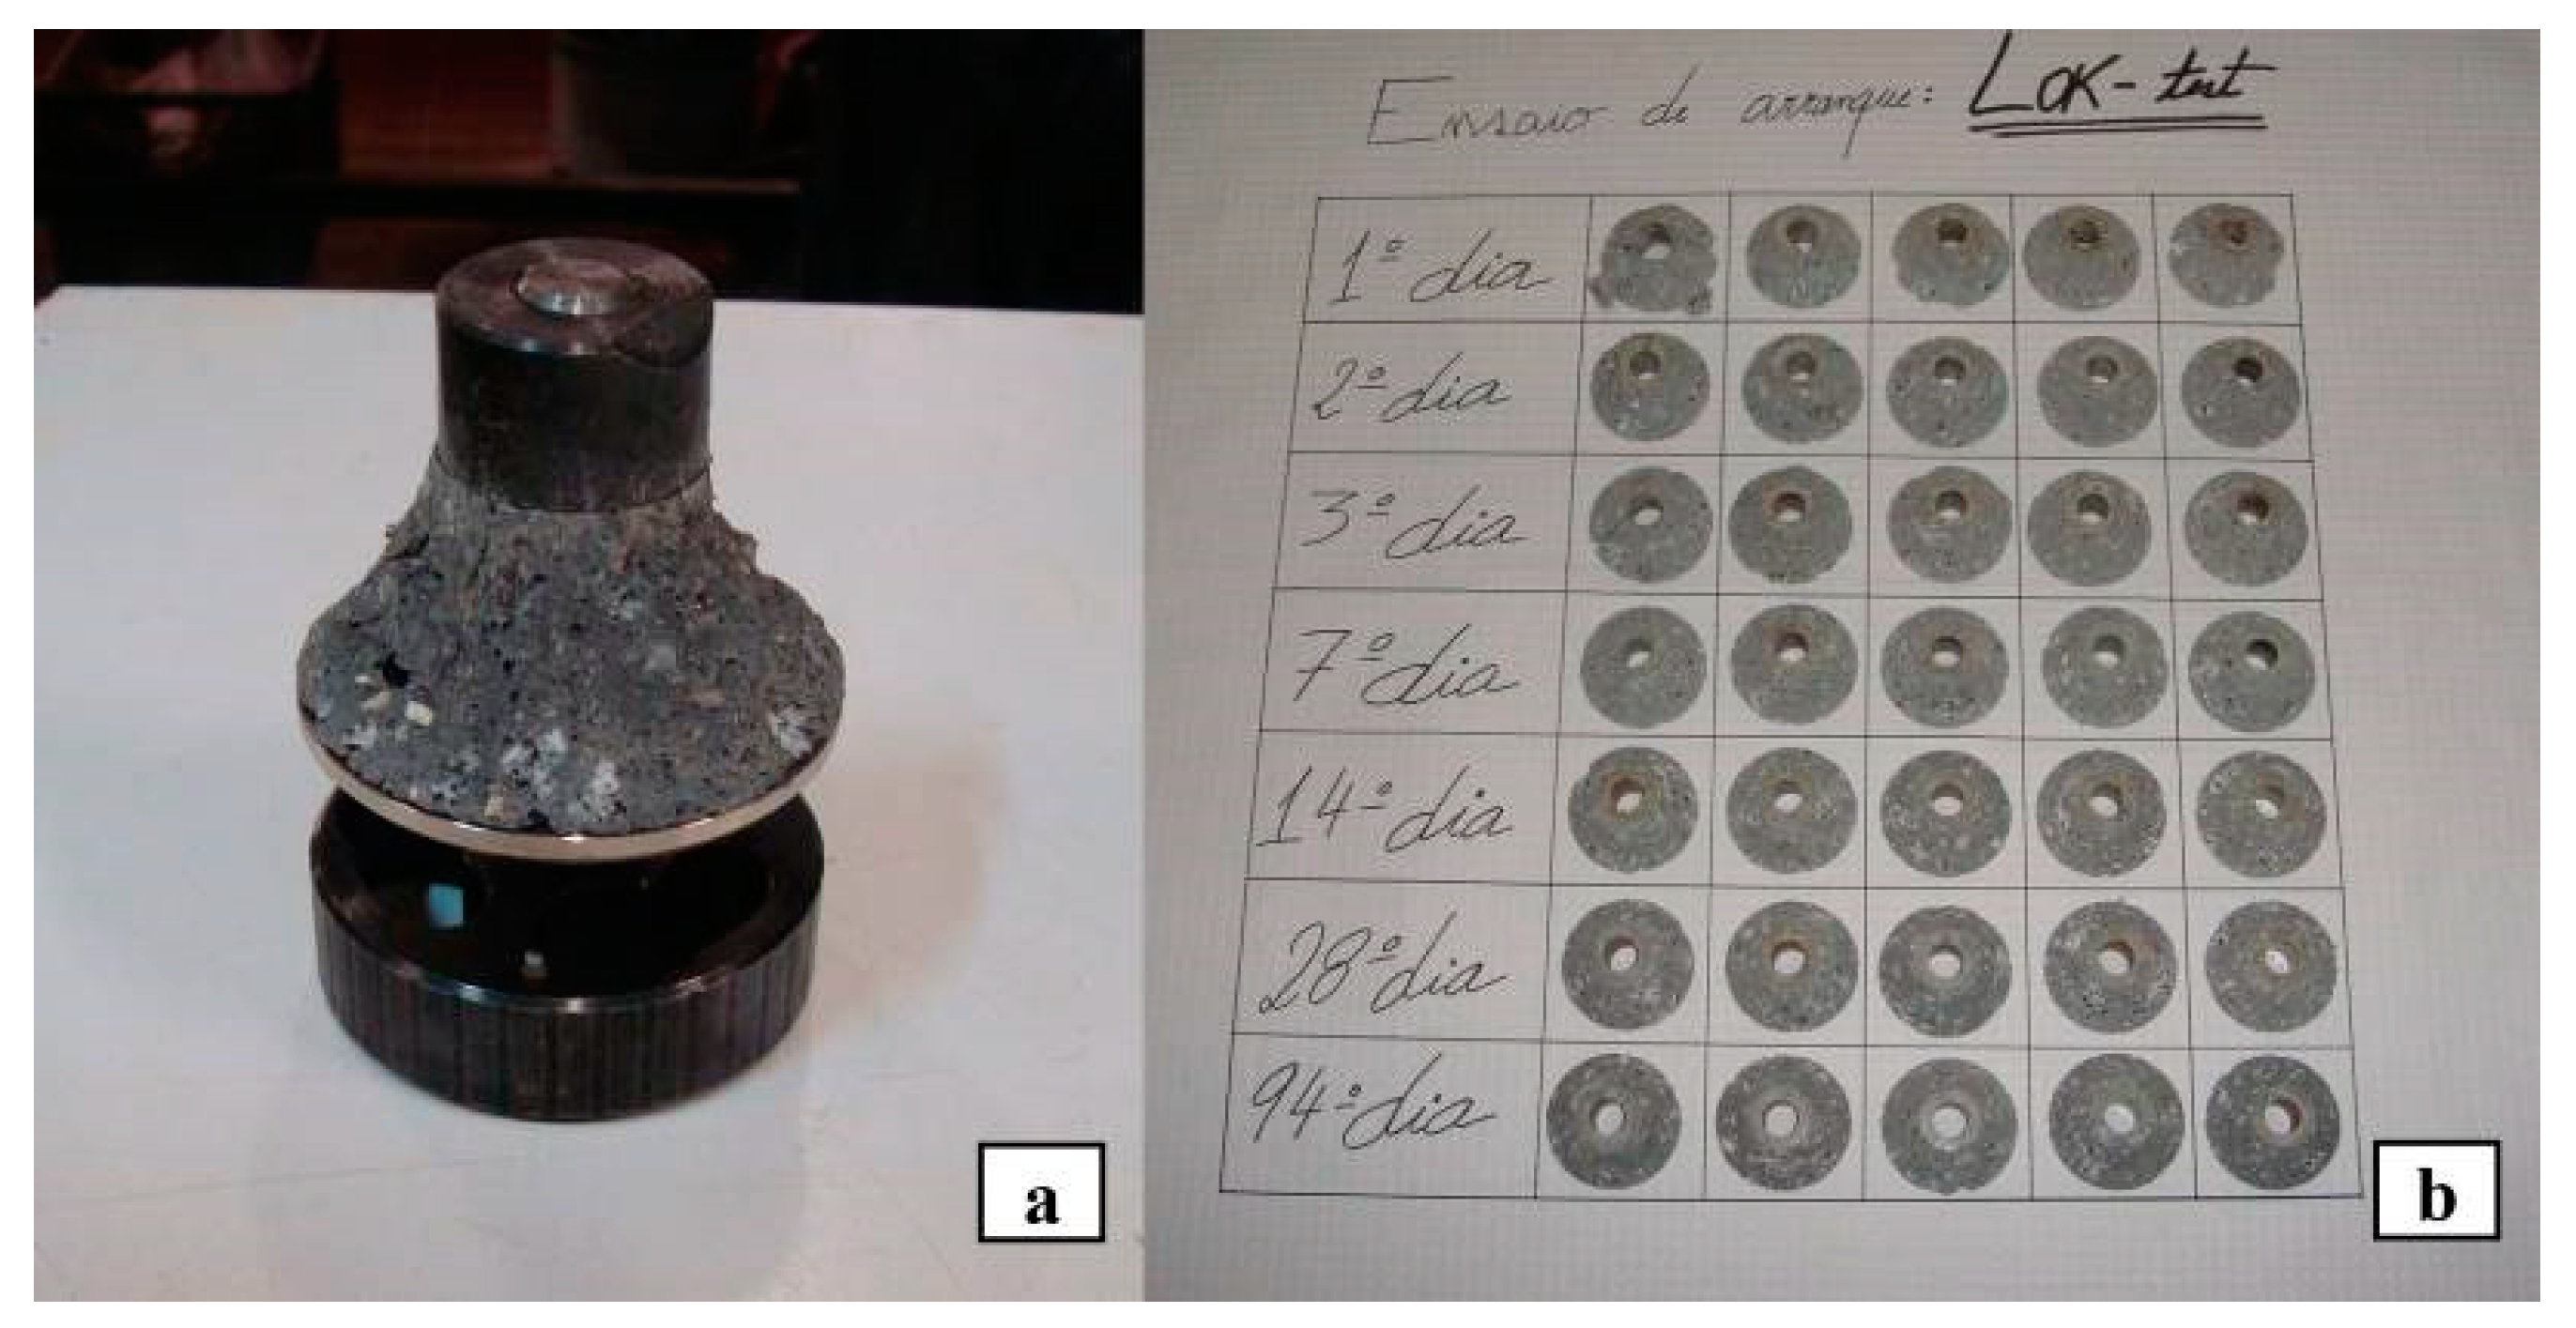
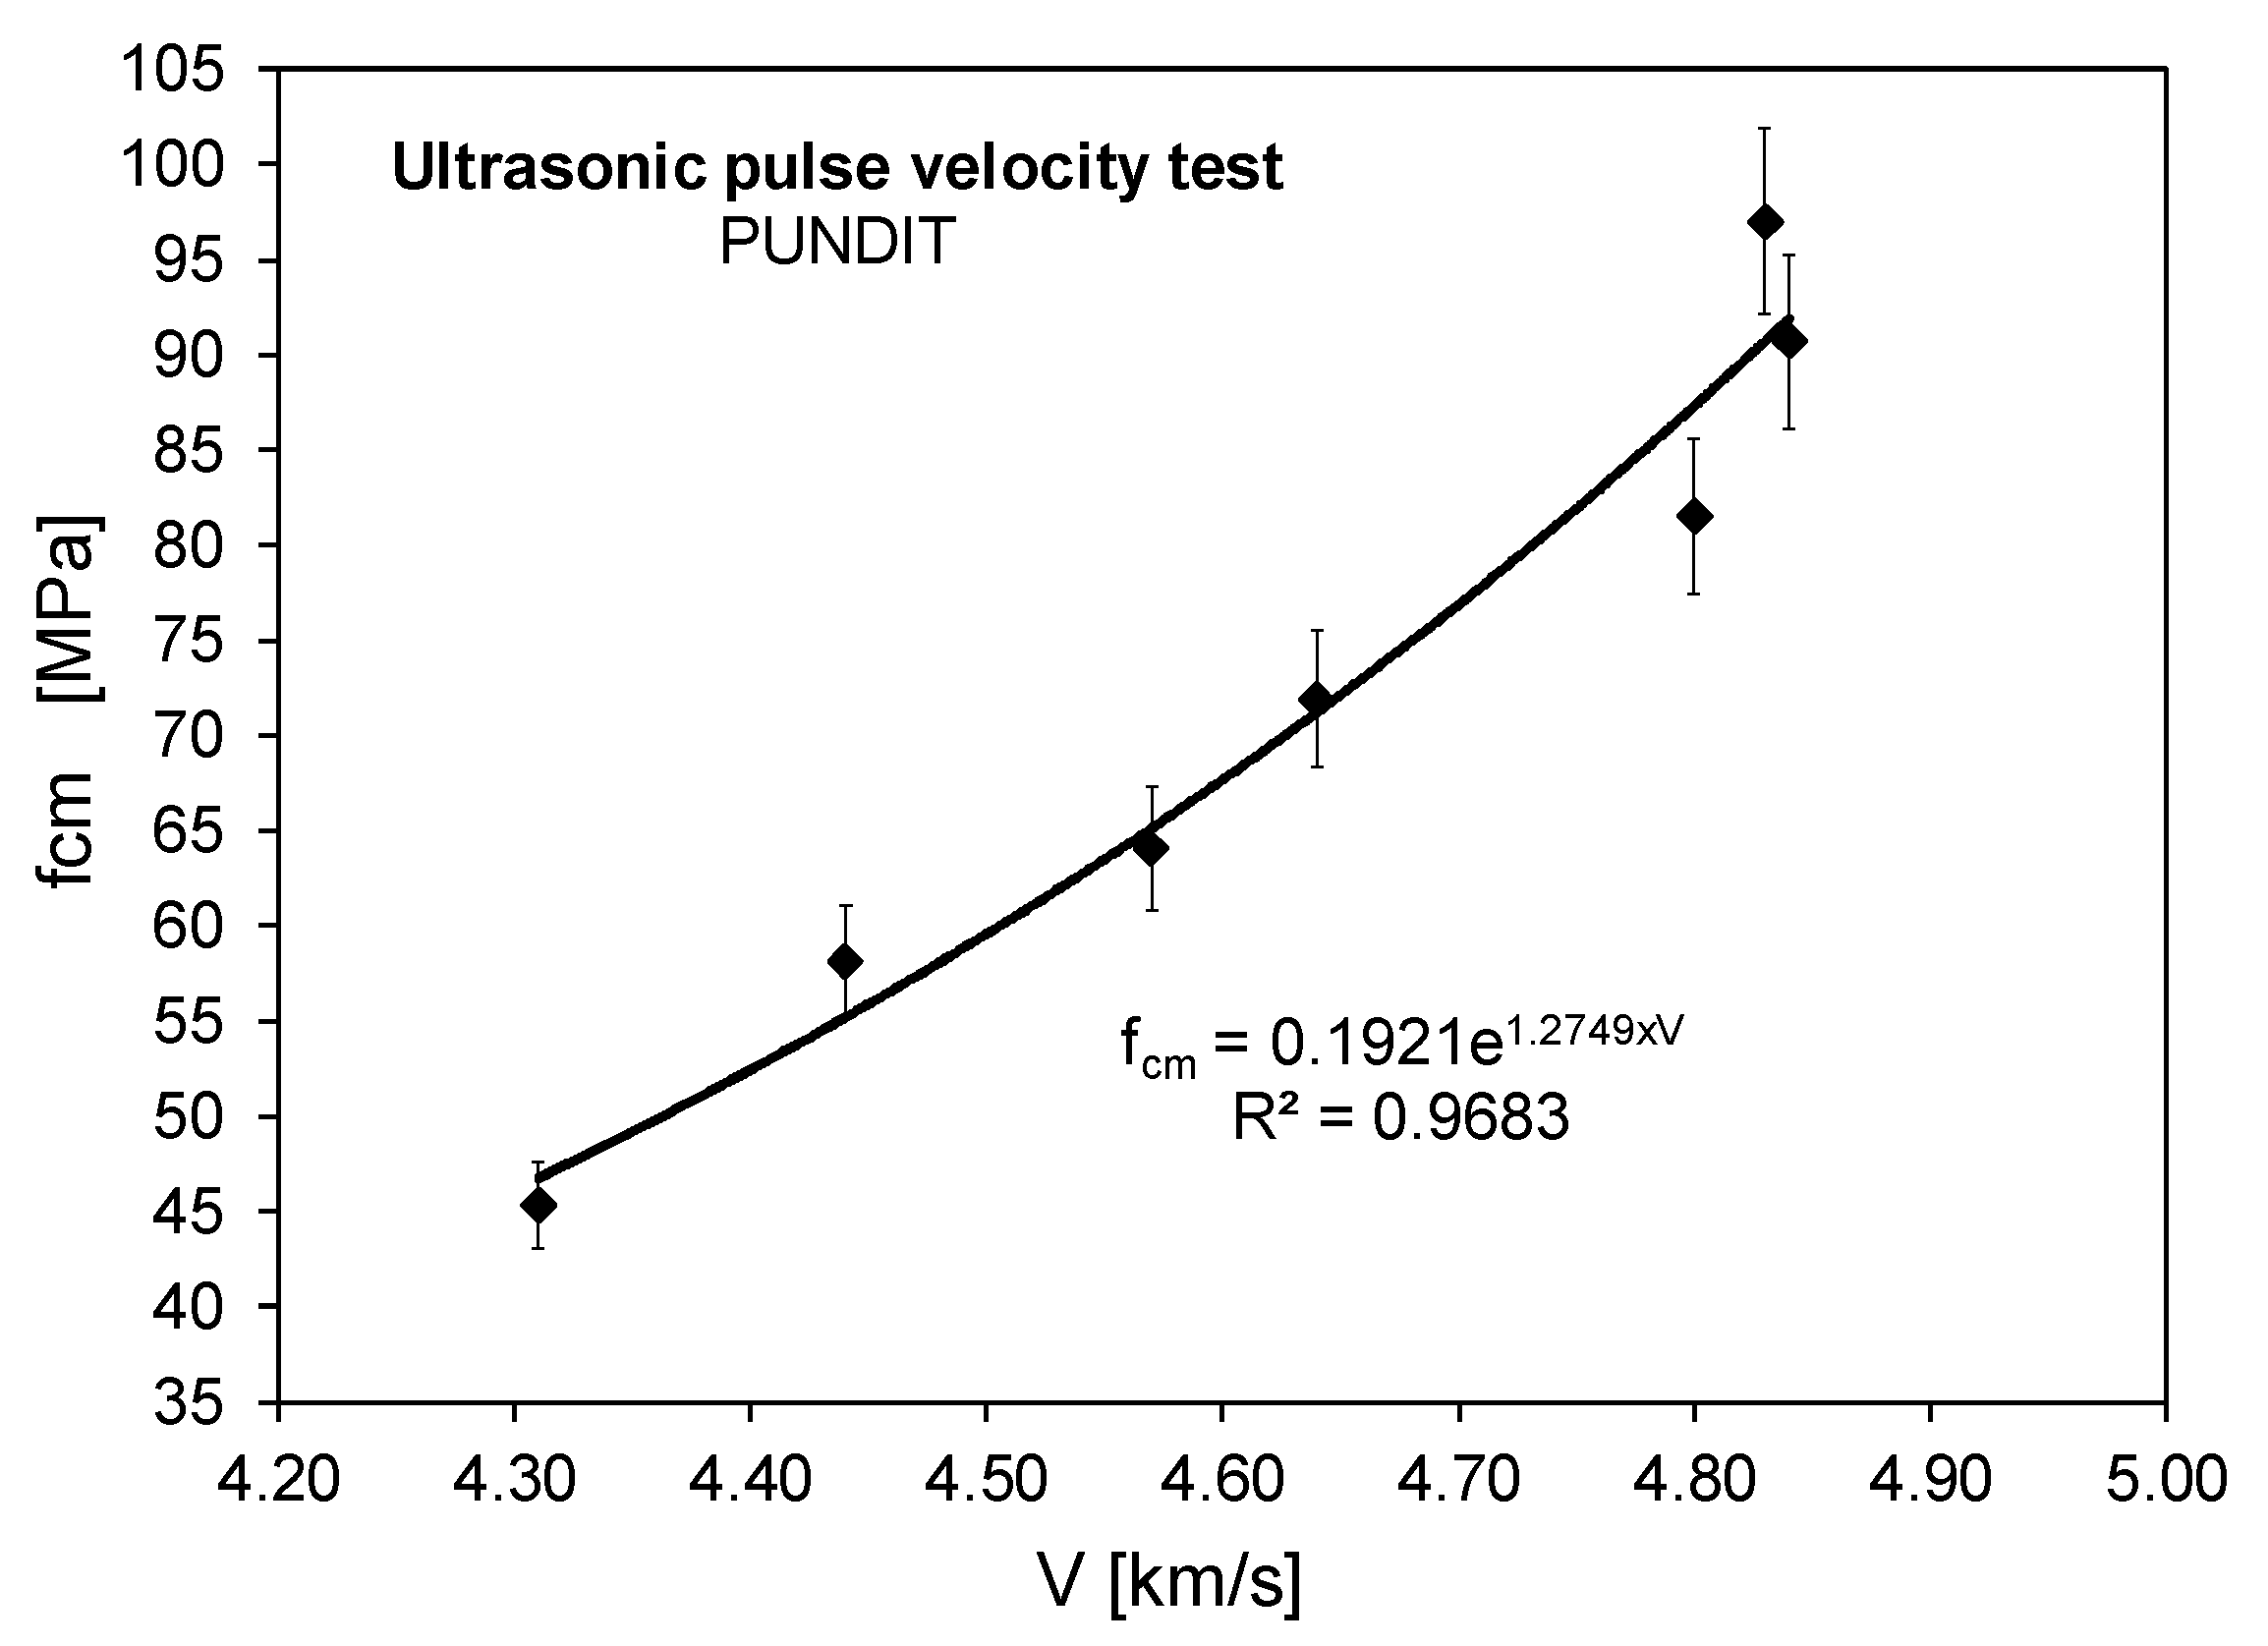
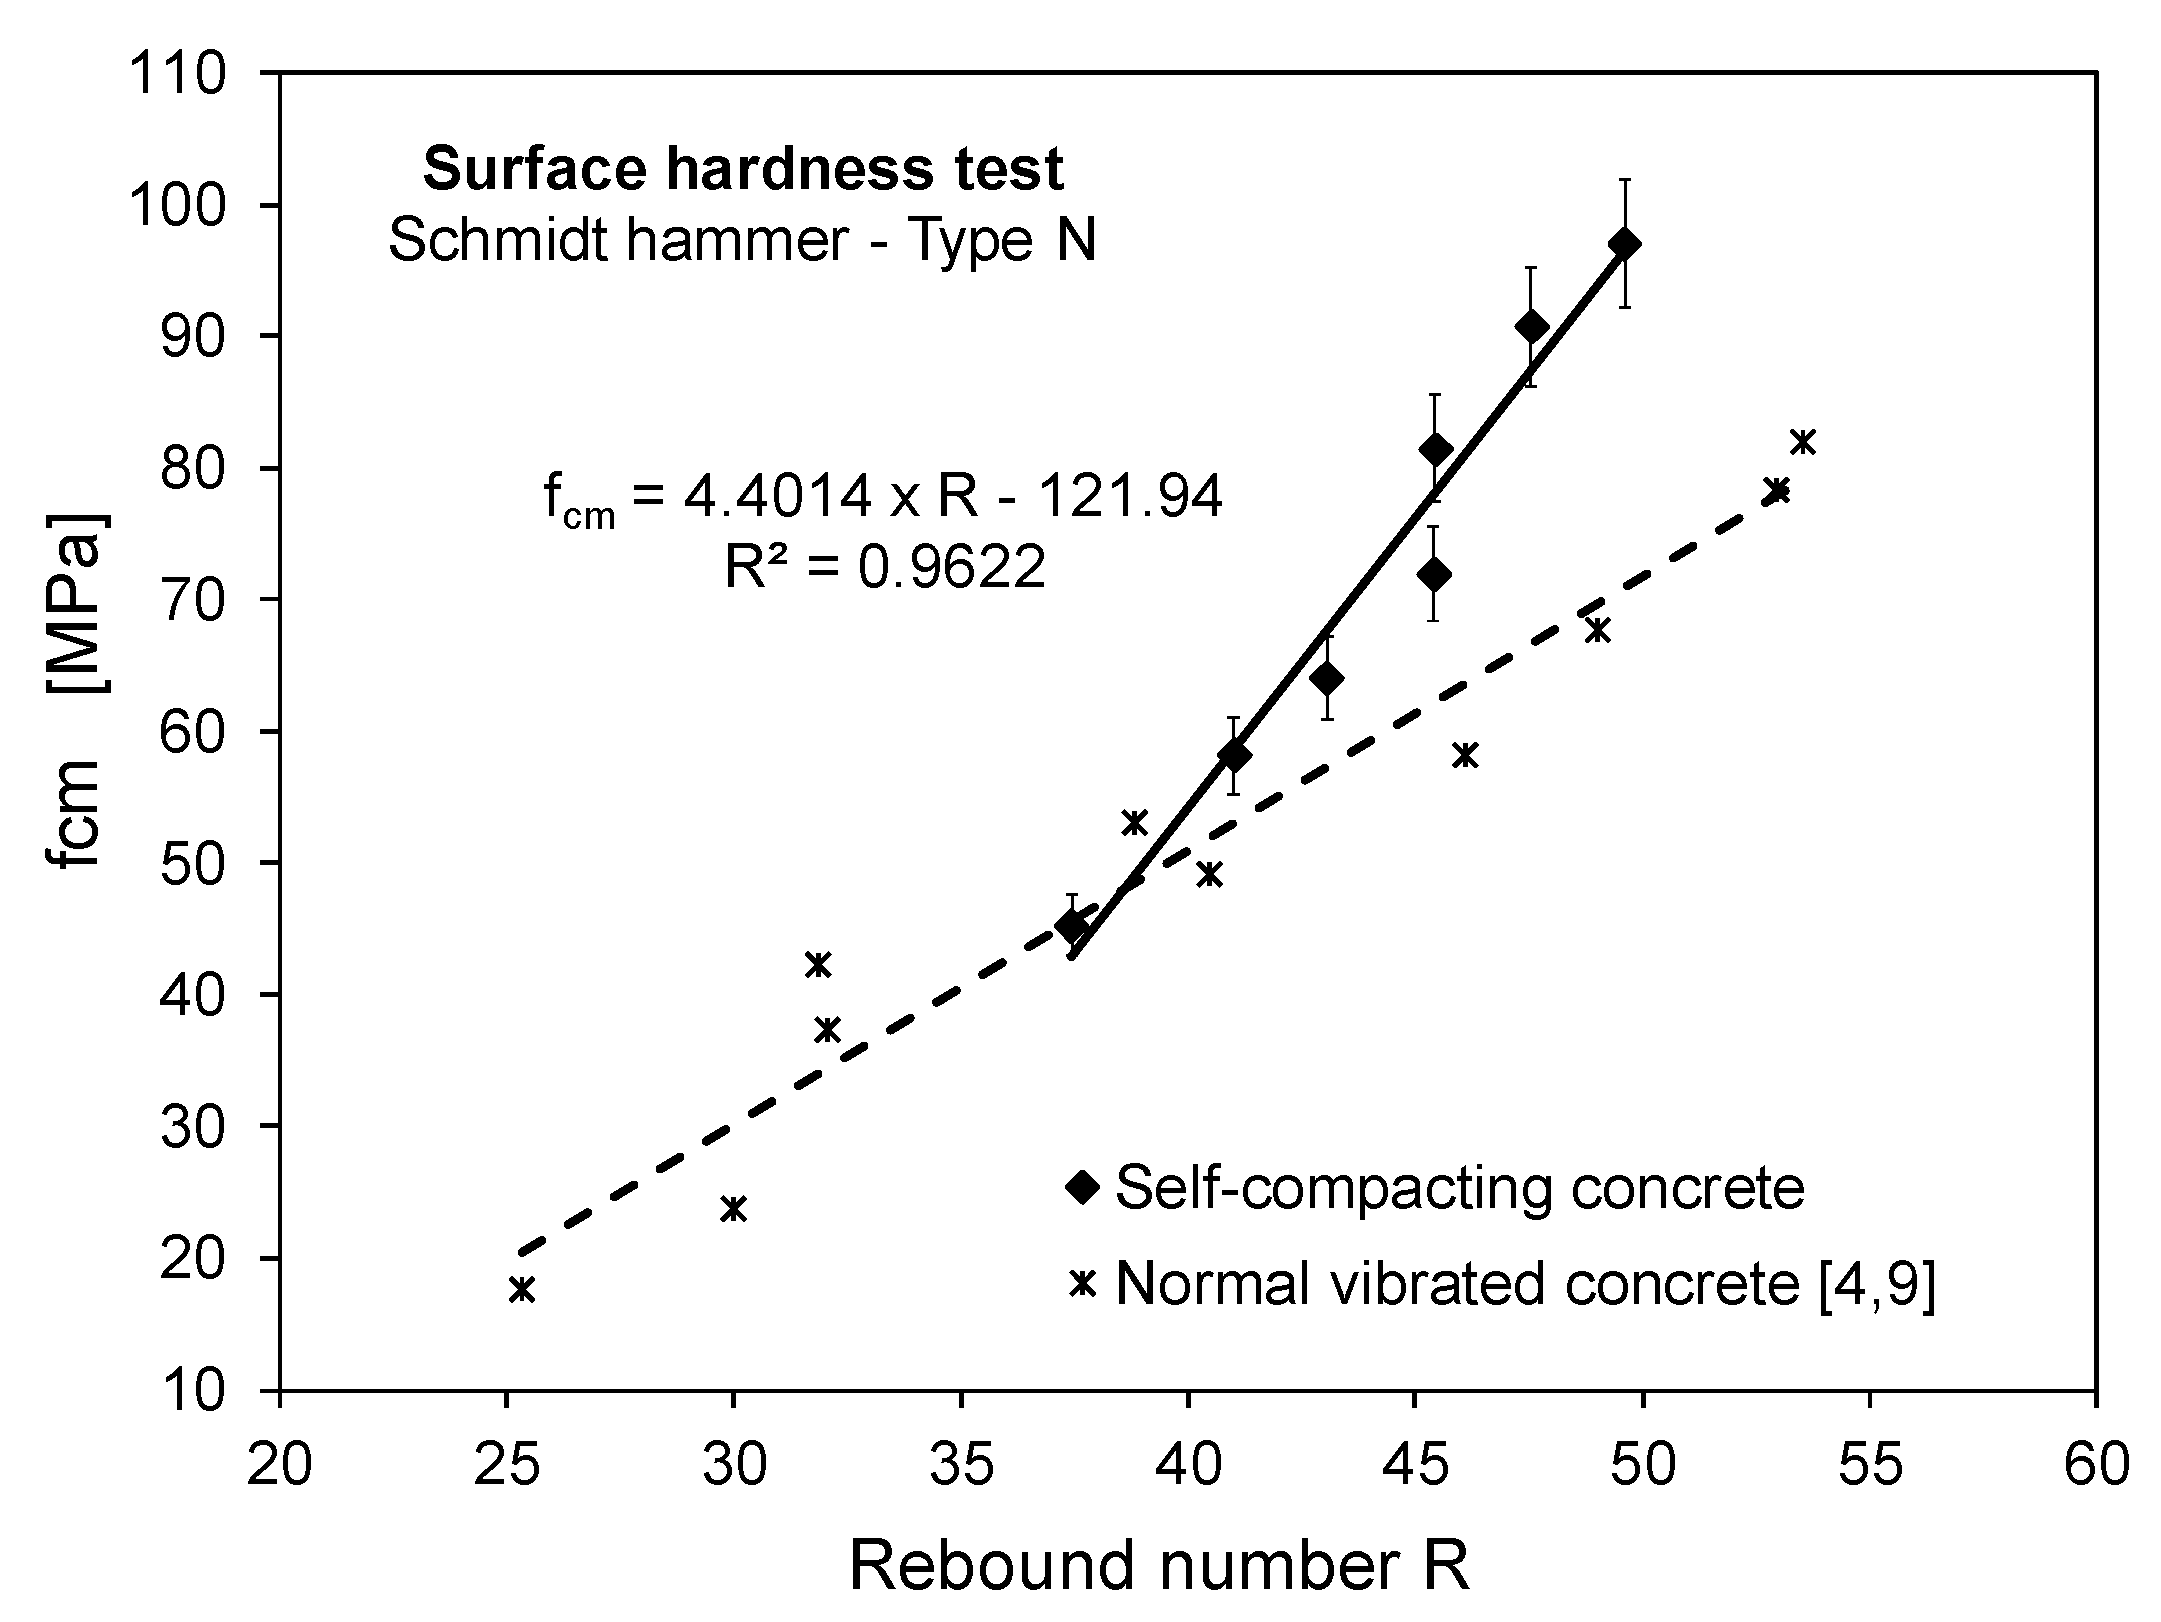
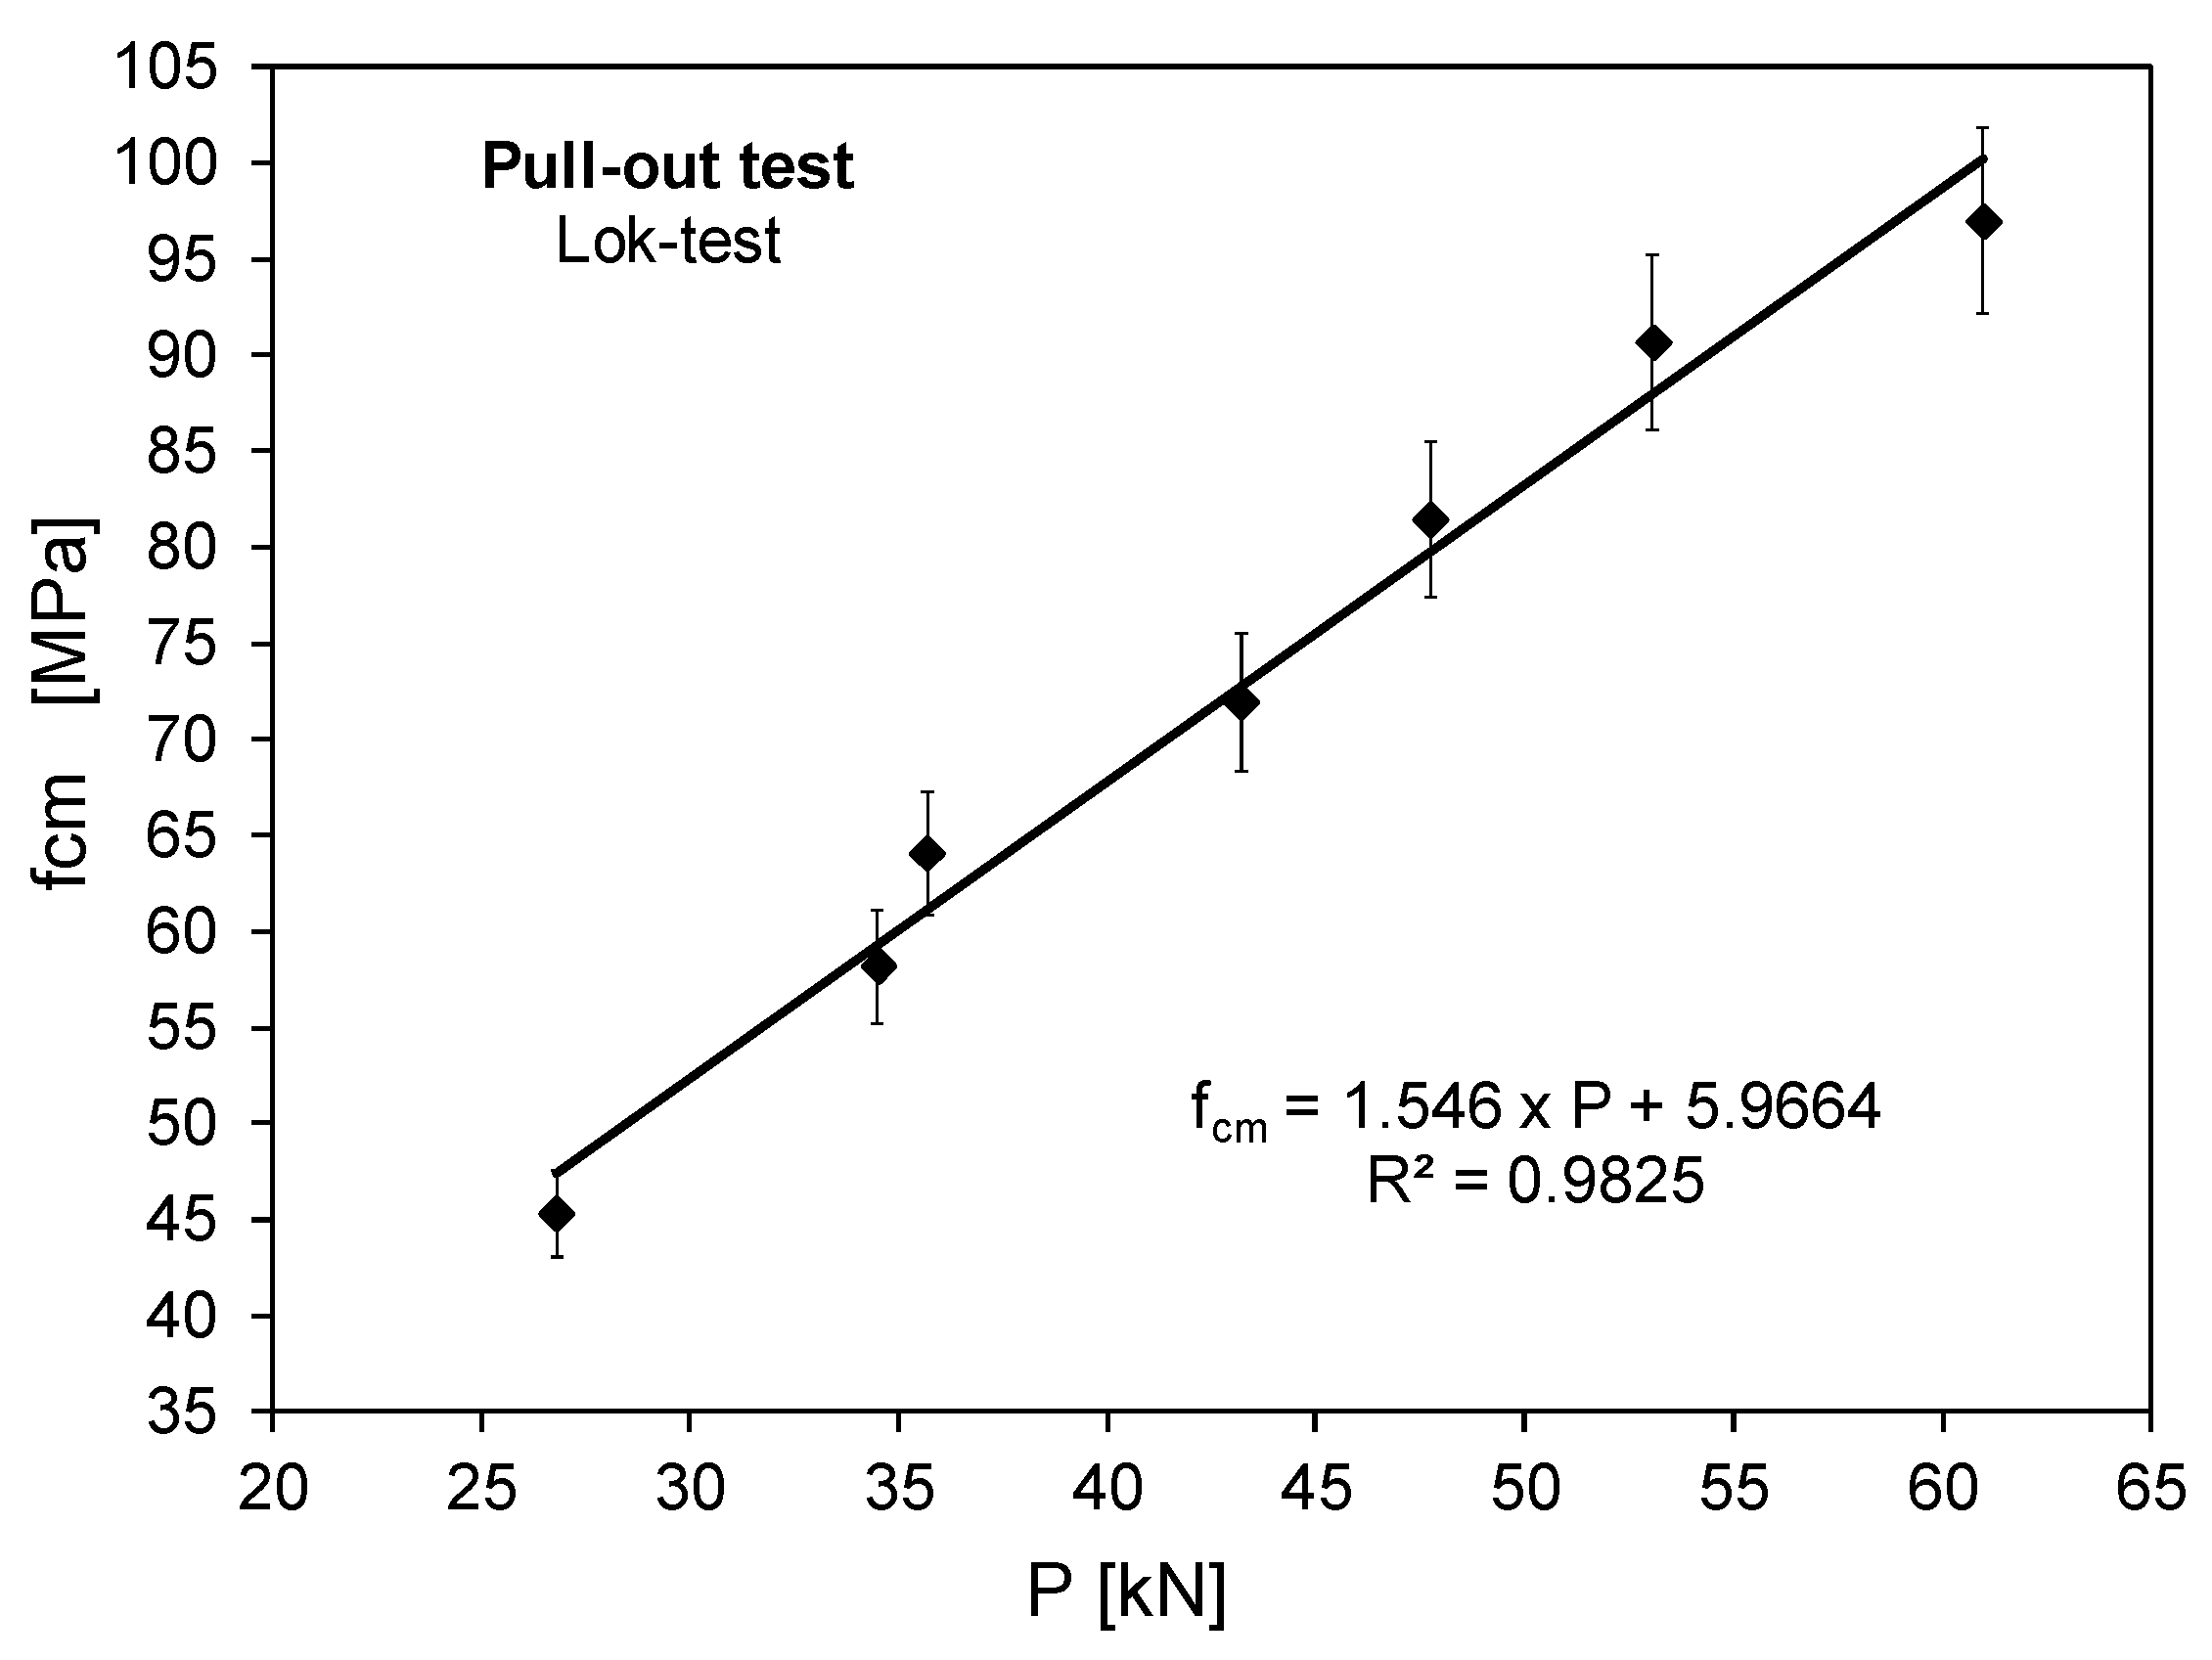
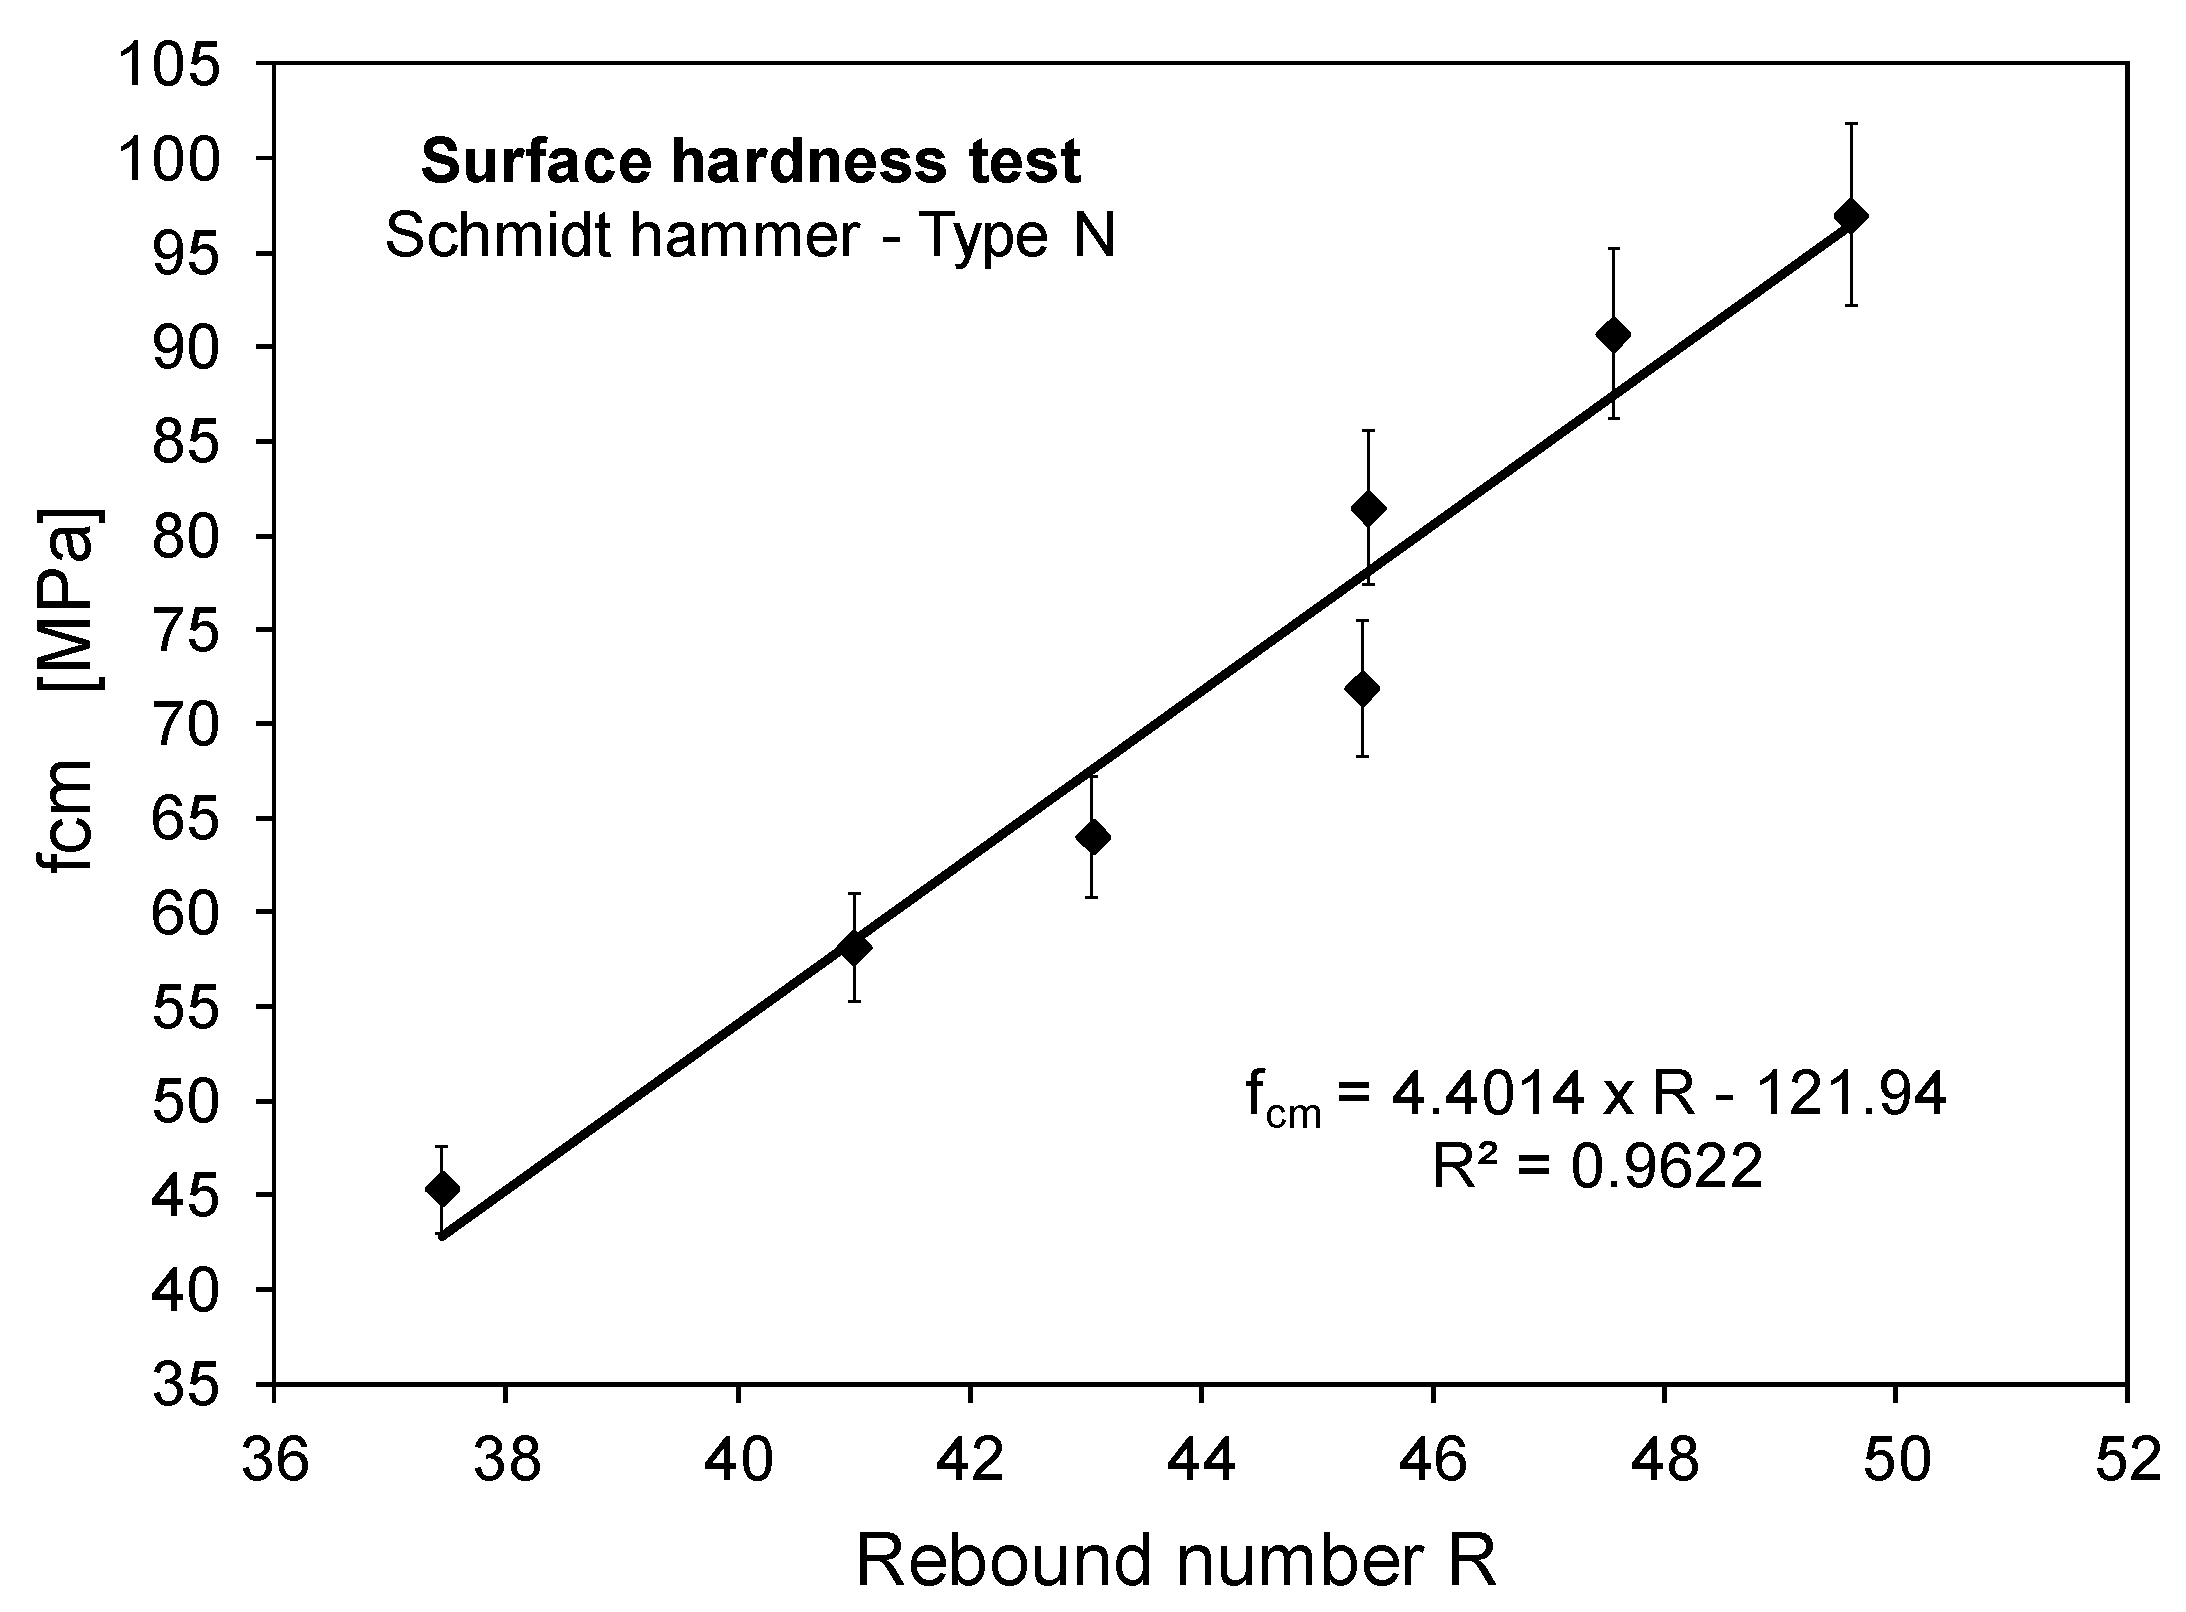
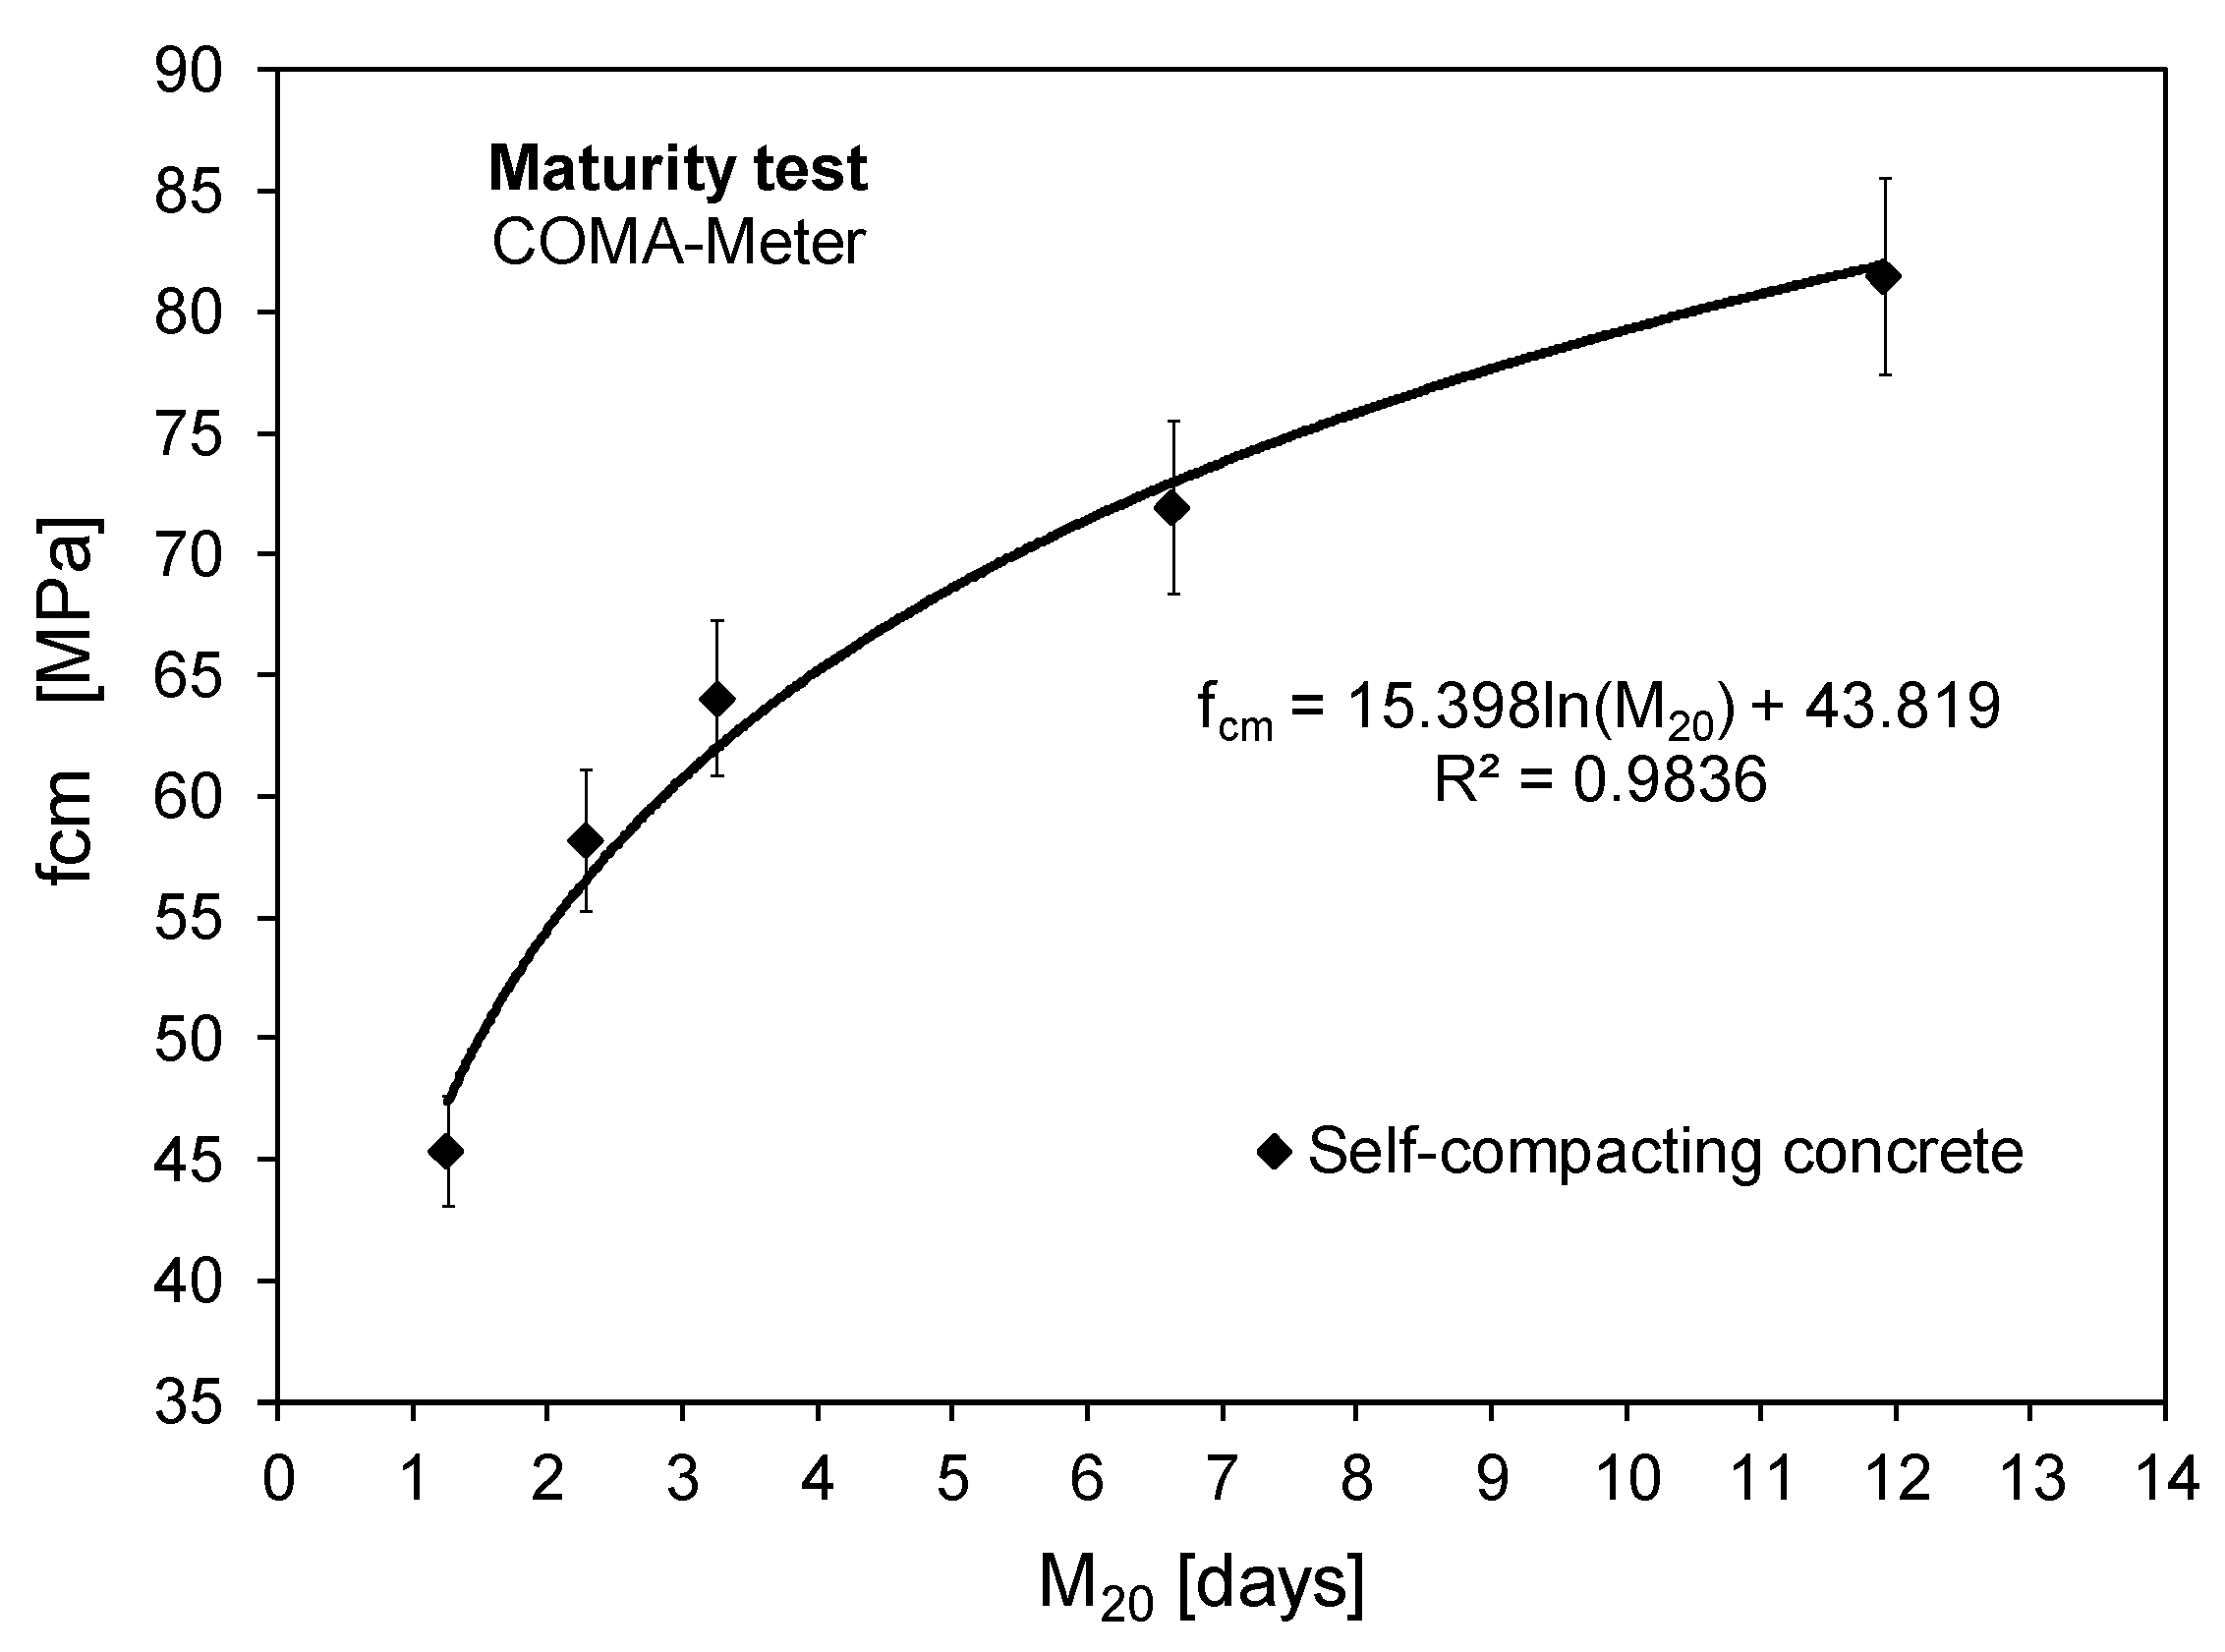
From the aforementioned, it can be stated that the specificities of SCC when compared with NVC, namely higher cement paste dosage and smaller volume of coarse aggregates, smaller coarse aggregates, the absence of vibration, among others, are susceptible to affect the correlations with the concrete compressive strength. In this sense, the present study evaluates the applicability of some NDT to SCC in order to estimate the concrete compressive strength. Selected tests included the ultrasonic pulse velocity test (PUNDIT), the surface hardness test (Schmidt rebound hammer type N), the pull-out test (Lok-test), and the concrete maturity test (COMA-meter).
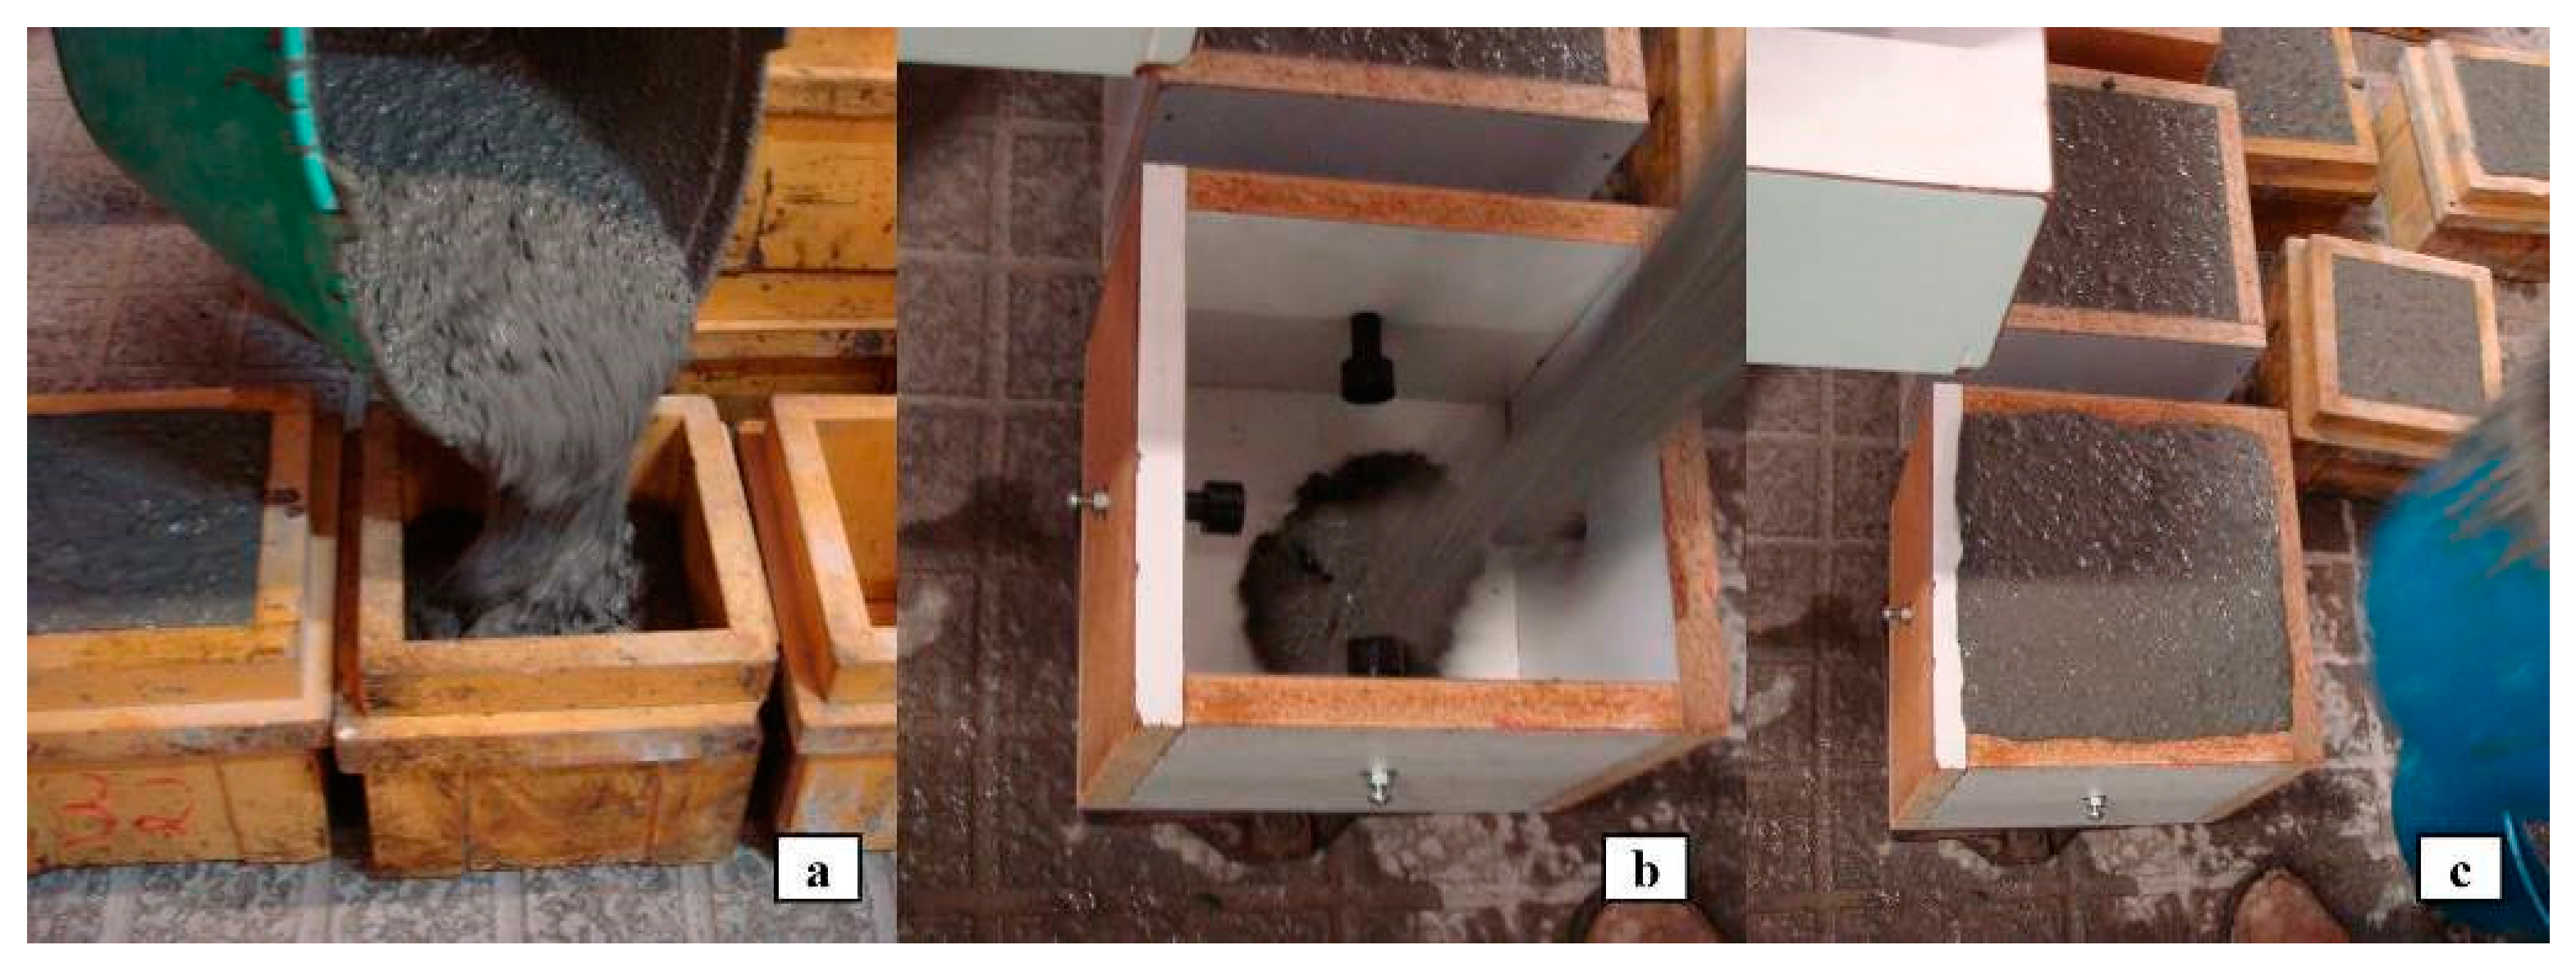
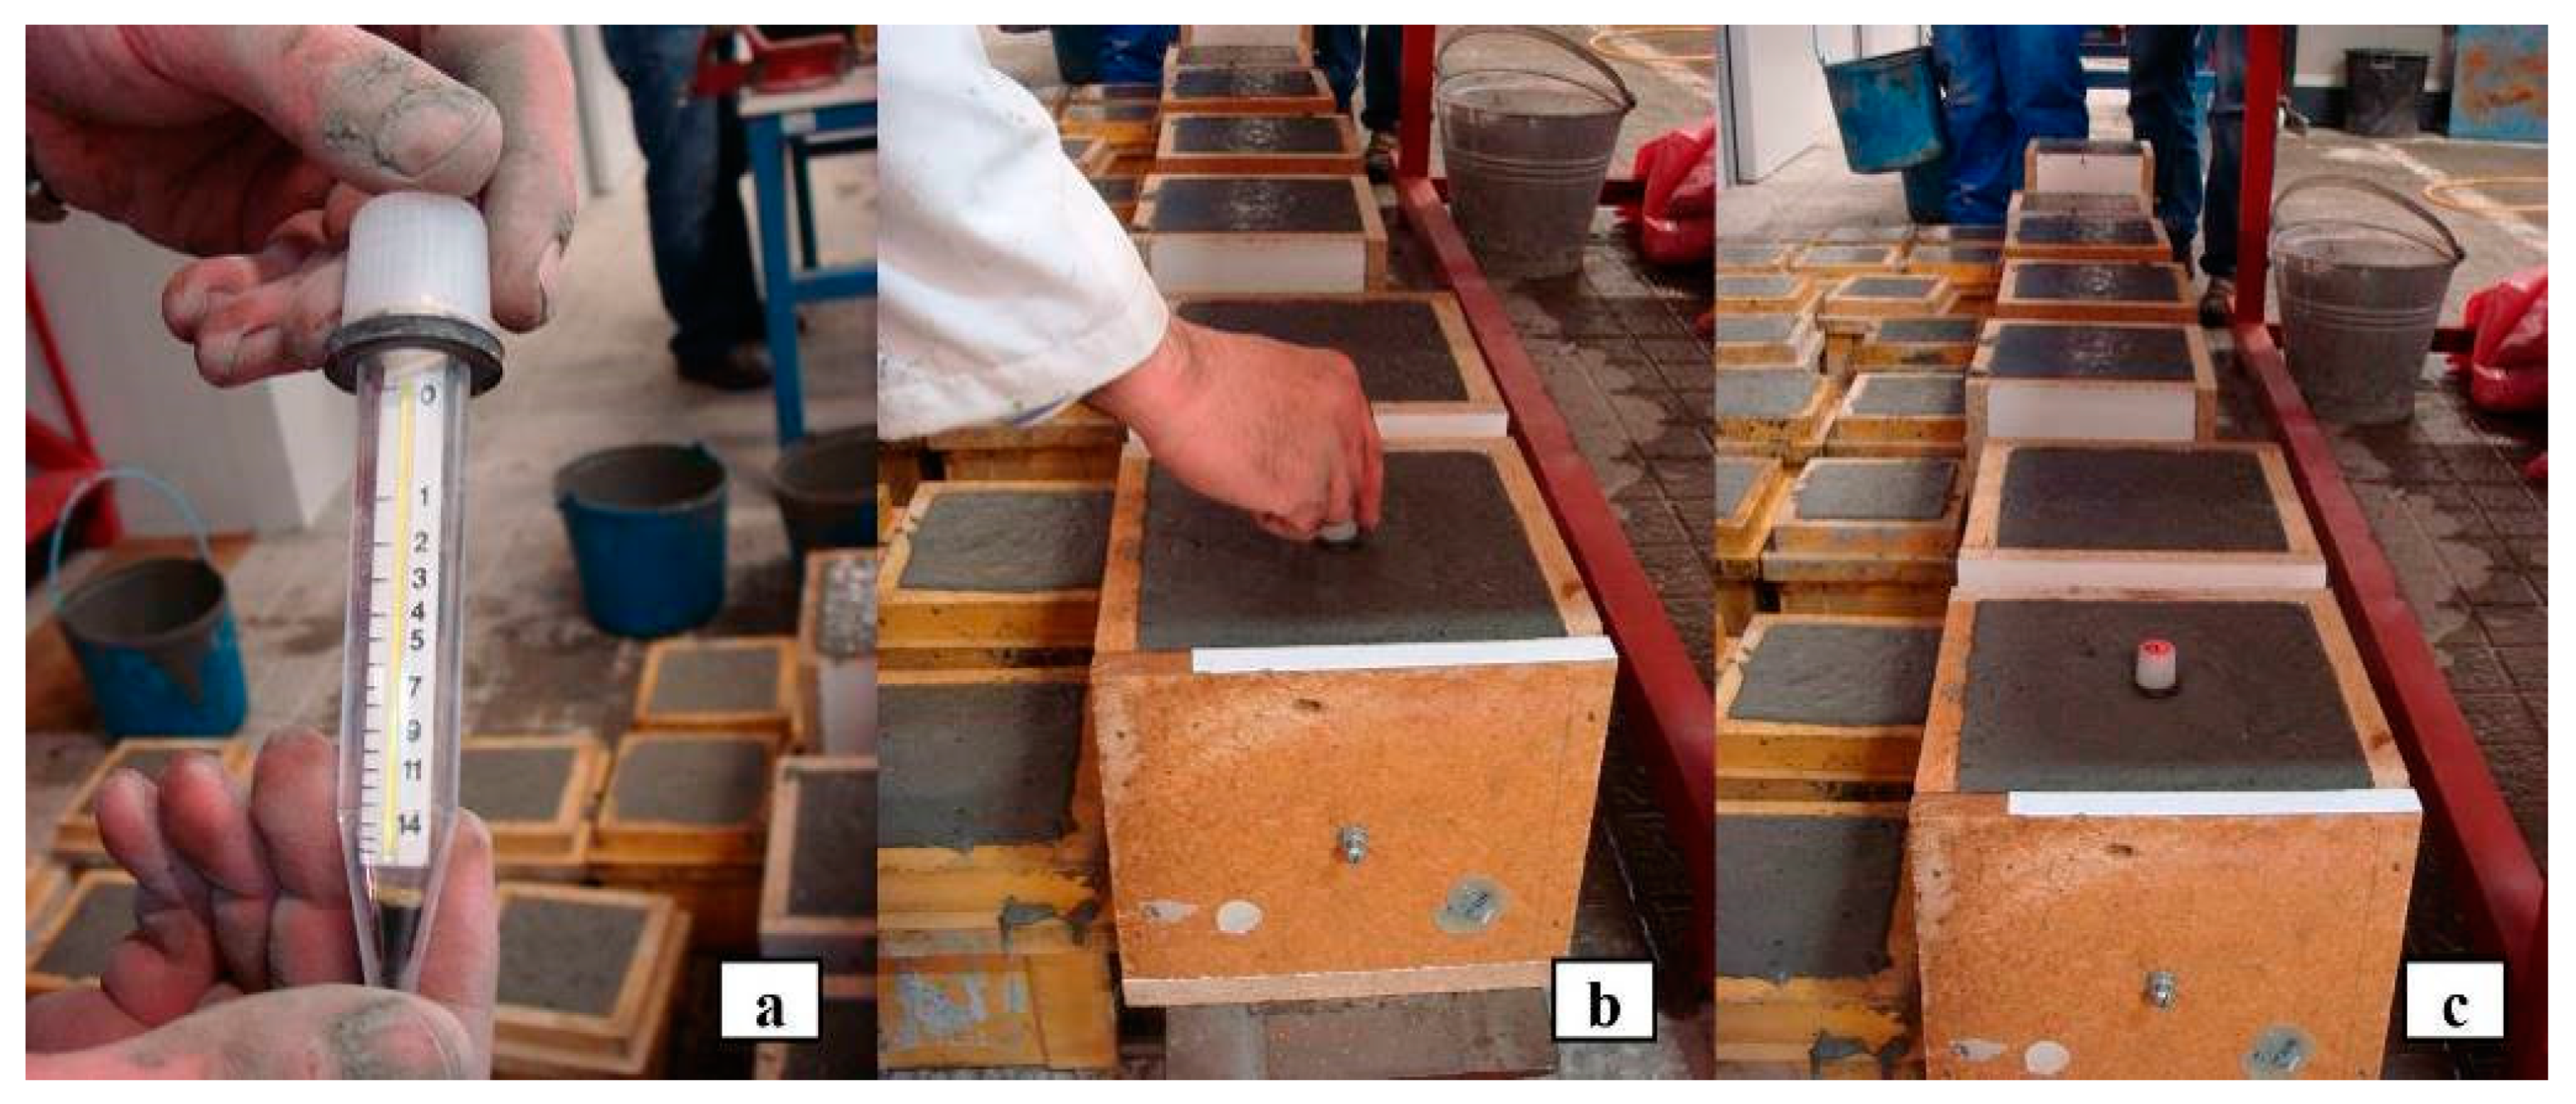
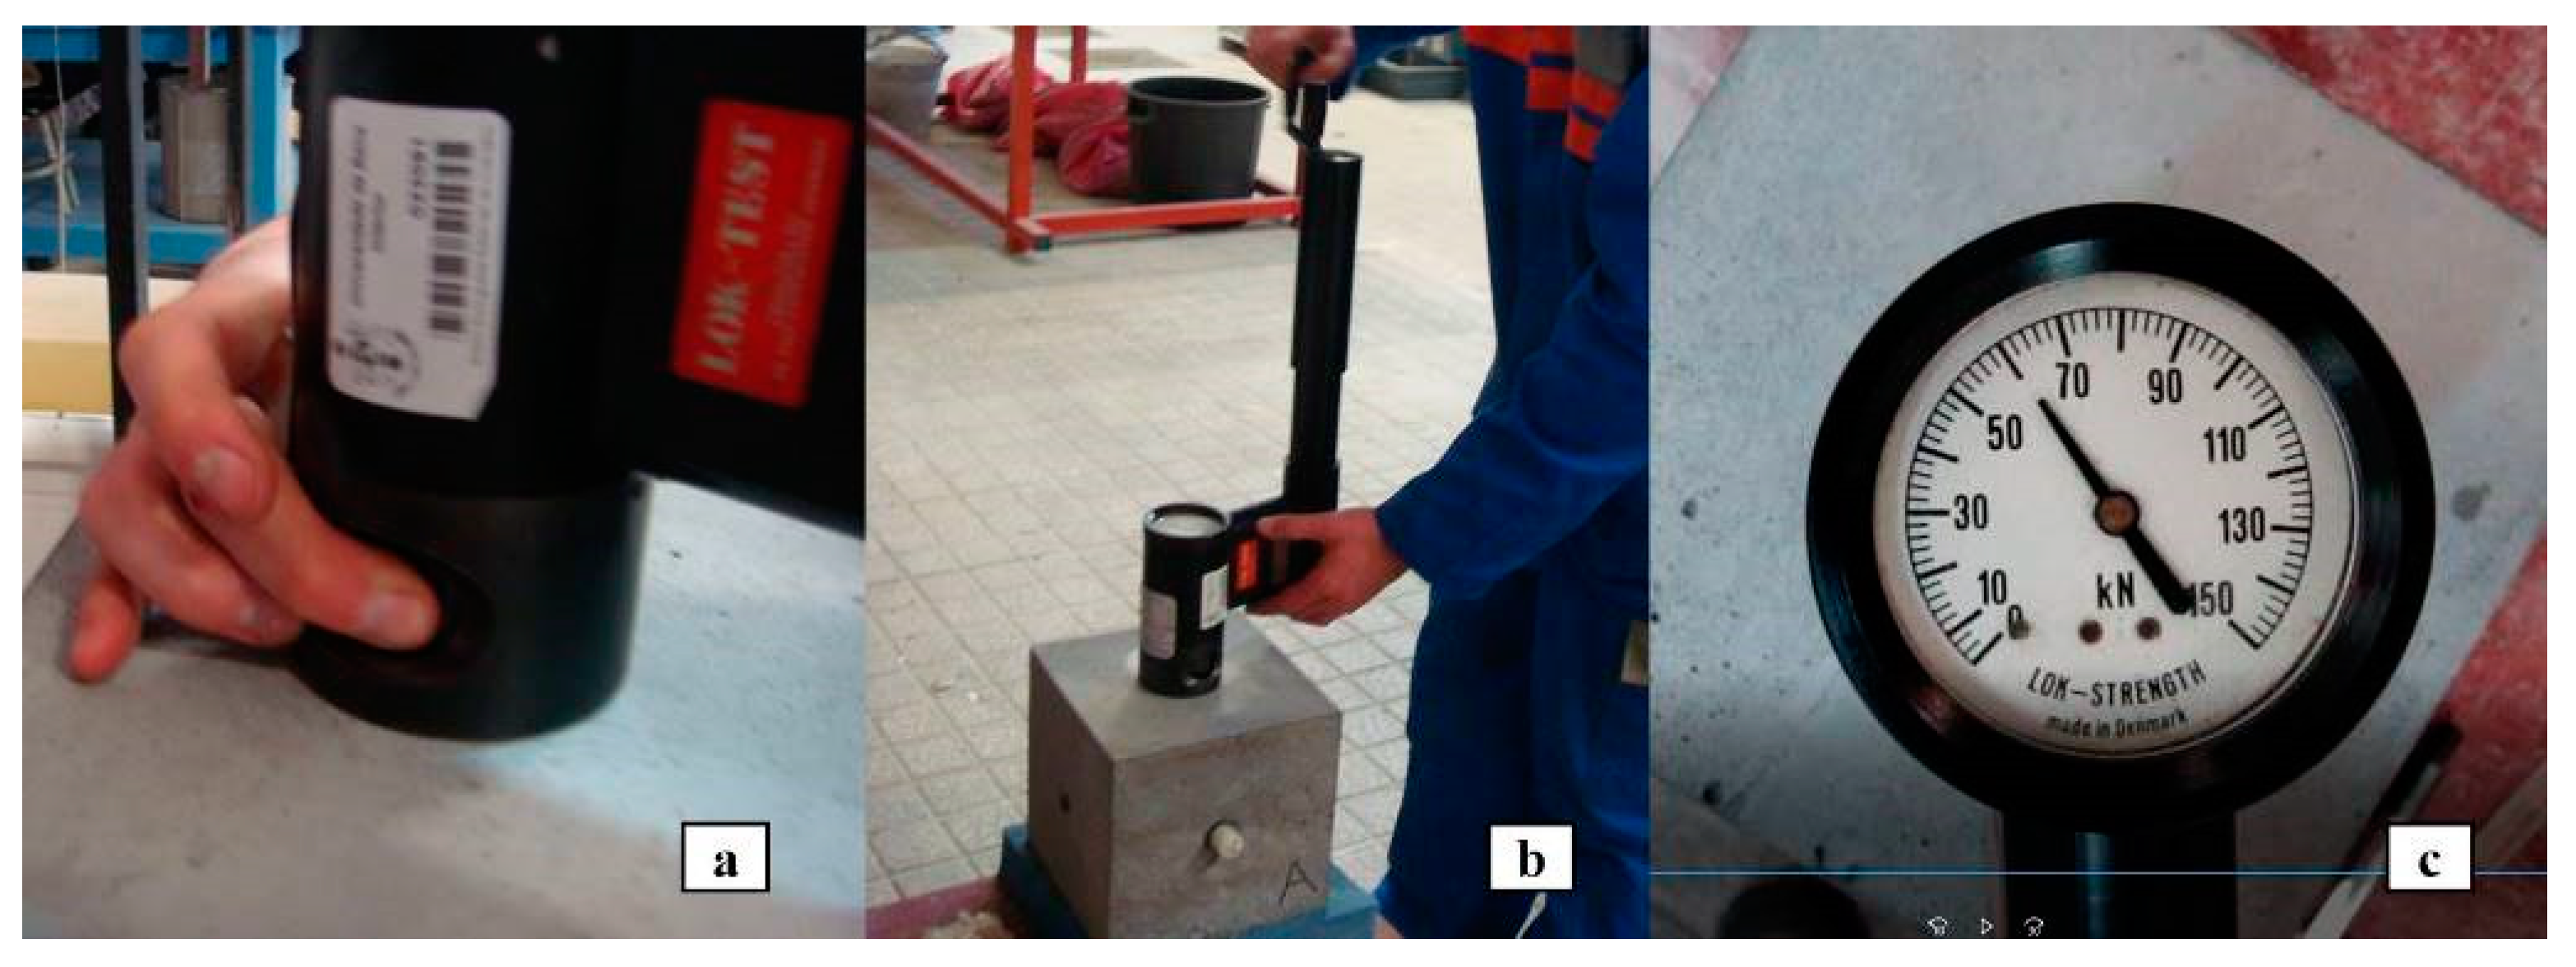
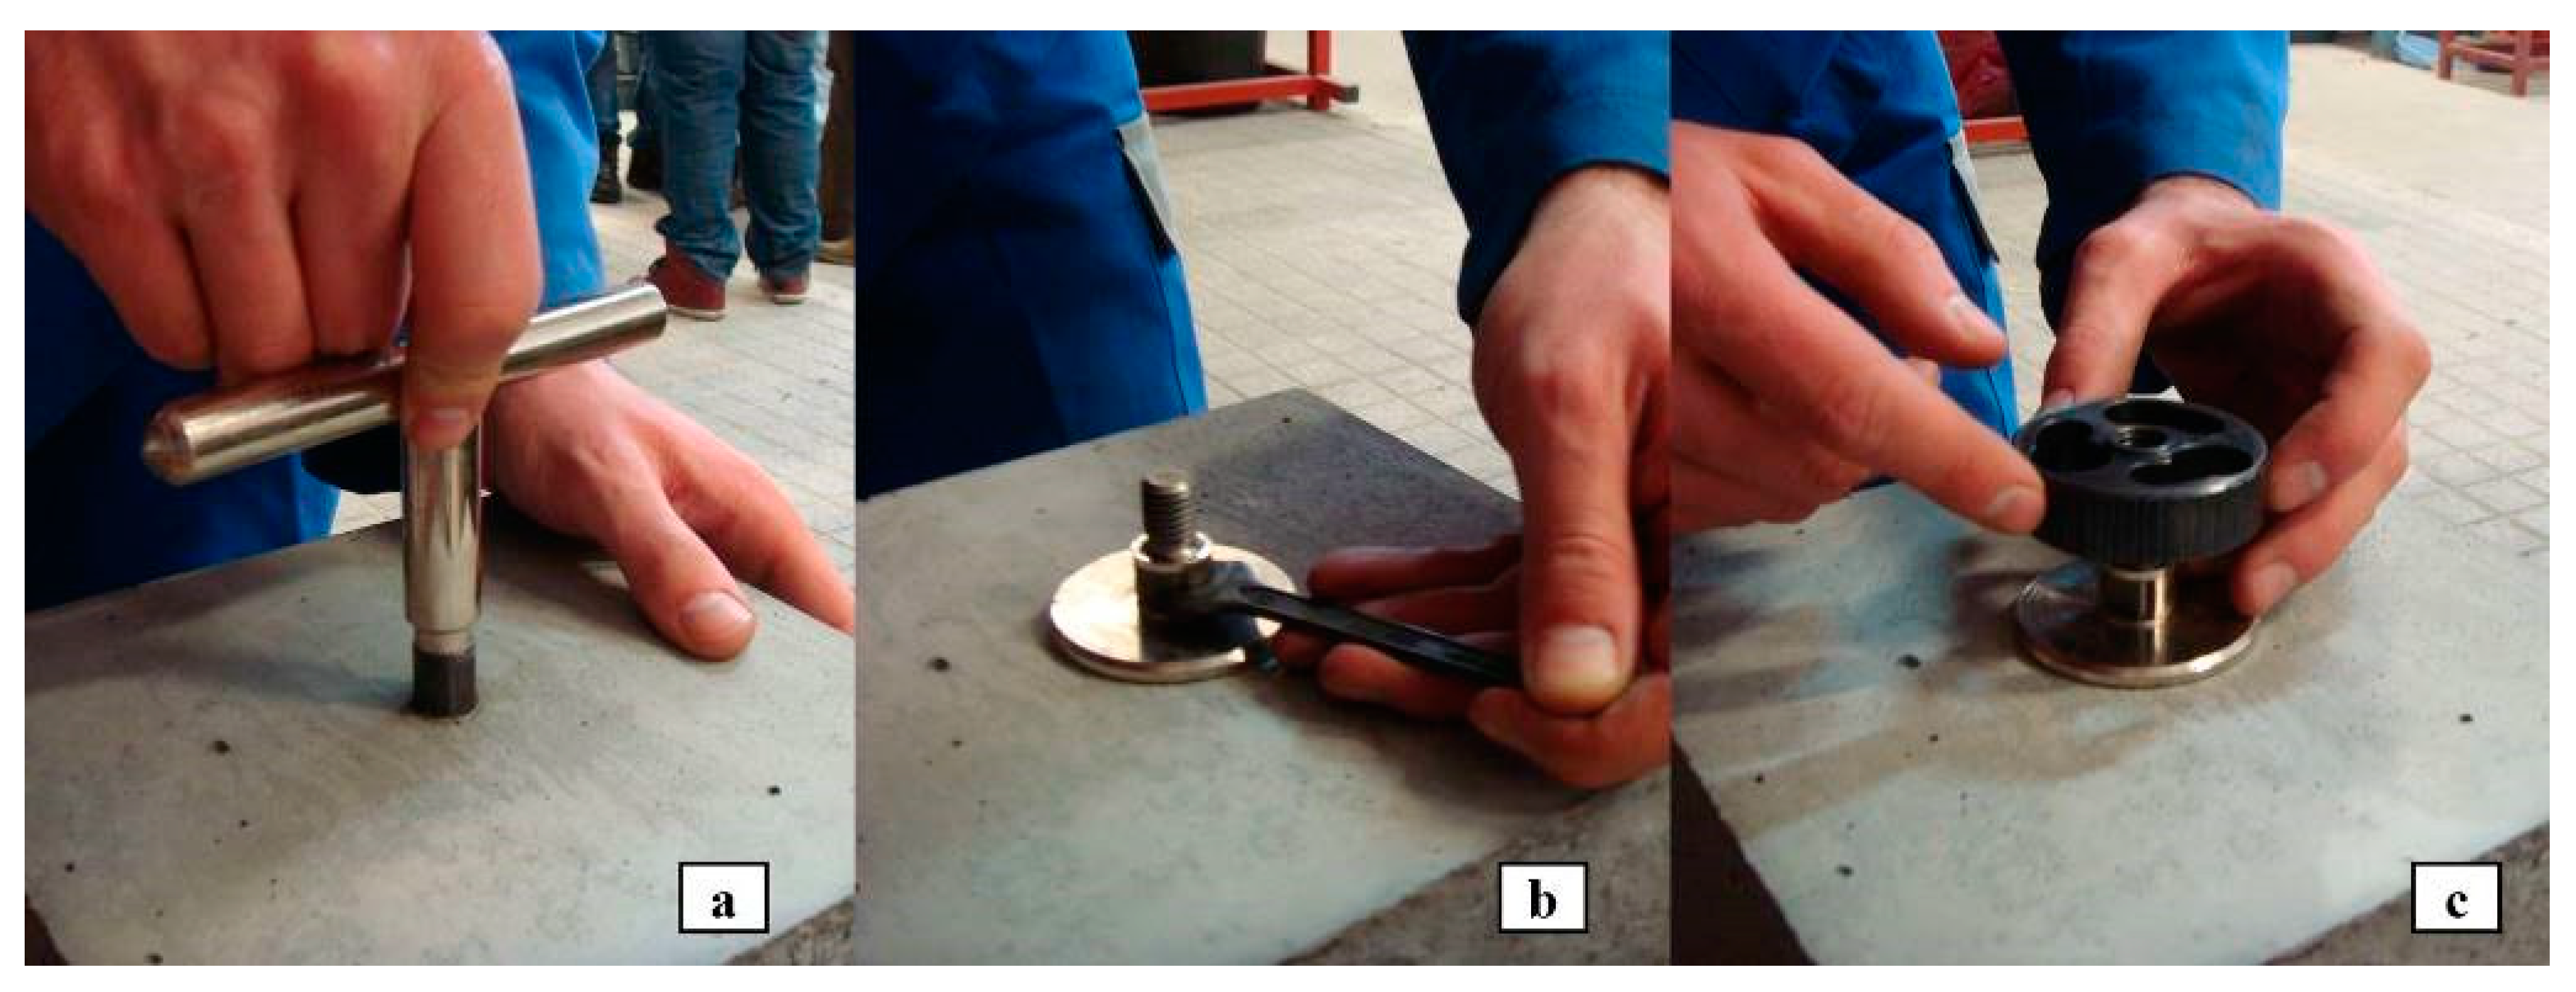
The tests used in this research work were selected based on its user-friendly characteristics. The ultrasonic pulse velocity test and the surface hardness test can be used either in new or old concrete, being easy to operate, do not produce damage on the concrete surface, results are immediately available, are of low cost and require only the maintenance of the equipment. These allow a more extensive analysis of structures covering a larger extension. The pull-out test (Lok-test) can be used only in new concrete, since the insert has to be placed in formwork prior to casting. However, Germann Instruments A/S have developed the CAPO-test system (Cut And Pull-Out) which allows to perform the pull-out test in old concrete. In this system, the capo-insert (25-mm diameter ring) is placed in hardened concrete at a depth of 25 mm by drilling a 18-mm central hole with a drill unit, using a diamond recess router to open an inside hole at 25 mm depth and an expansion unit to fully expand a 25-mm diameter ring inserted in the hole. The geometry and mechanism of fracture in CAPO-test system is similar to Lok-test system, allowing the use of the same correlations to compressive strength. Both systems measure the force by which a 25-mm disc or ring placed in a depth of 25 mm is pulled out of the concrete through a 55 mm inner diameter counterpressure placed on the testing surface. The concrete maturity test (COMA-meter) is the one that is exclusively used in fresh concrete because the capillary tube has to be placed just after casting.
The 95% confidence limits for the estimation of the concrete compressive strength will vary significantly according to the type of selected NDT and the reproducibility of the used correlations. The data actually available concerns only the NVC. In this context, it has been referred that even using correlations specifically developed for a given concrete and under well reproduced in-situ conditions, it is unlikely that the 95% confidence limits for the estimation of the concrete compressive strength are better than ± 20%, ± 25%, and ± 10% of the mean value, when using the ultrasonic pulse velocity test, surface hardness test, and pull-out test, respectively [1,15,16,17]. When using specifically developed correlations and under ideal laboratory conditions it is probable that this difference would be reduced to ± 10% and ± 15% from the estimated mean value for ultrasonic pulse velocity test and surface hardness test, respectively [1,16,17]. Without specific correlations this difference could arise ± 50% for the ultrasonic pulse velocity test [1,16]. Even for the pull-out test, when using general correlations, such as those suggested by Lok-test and CAPO-test manufacturers, such interval would probably be widened to ± 20% of the mean value [
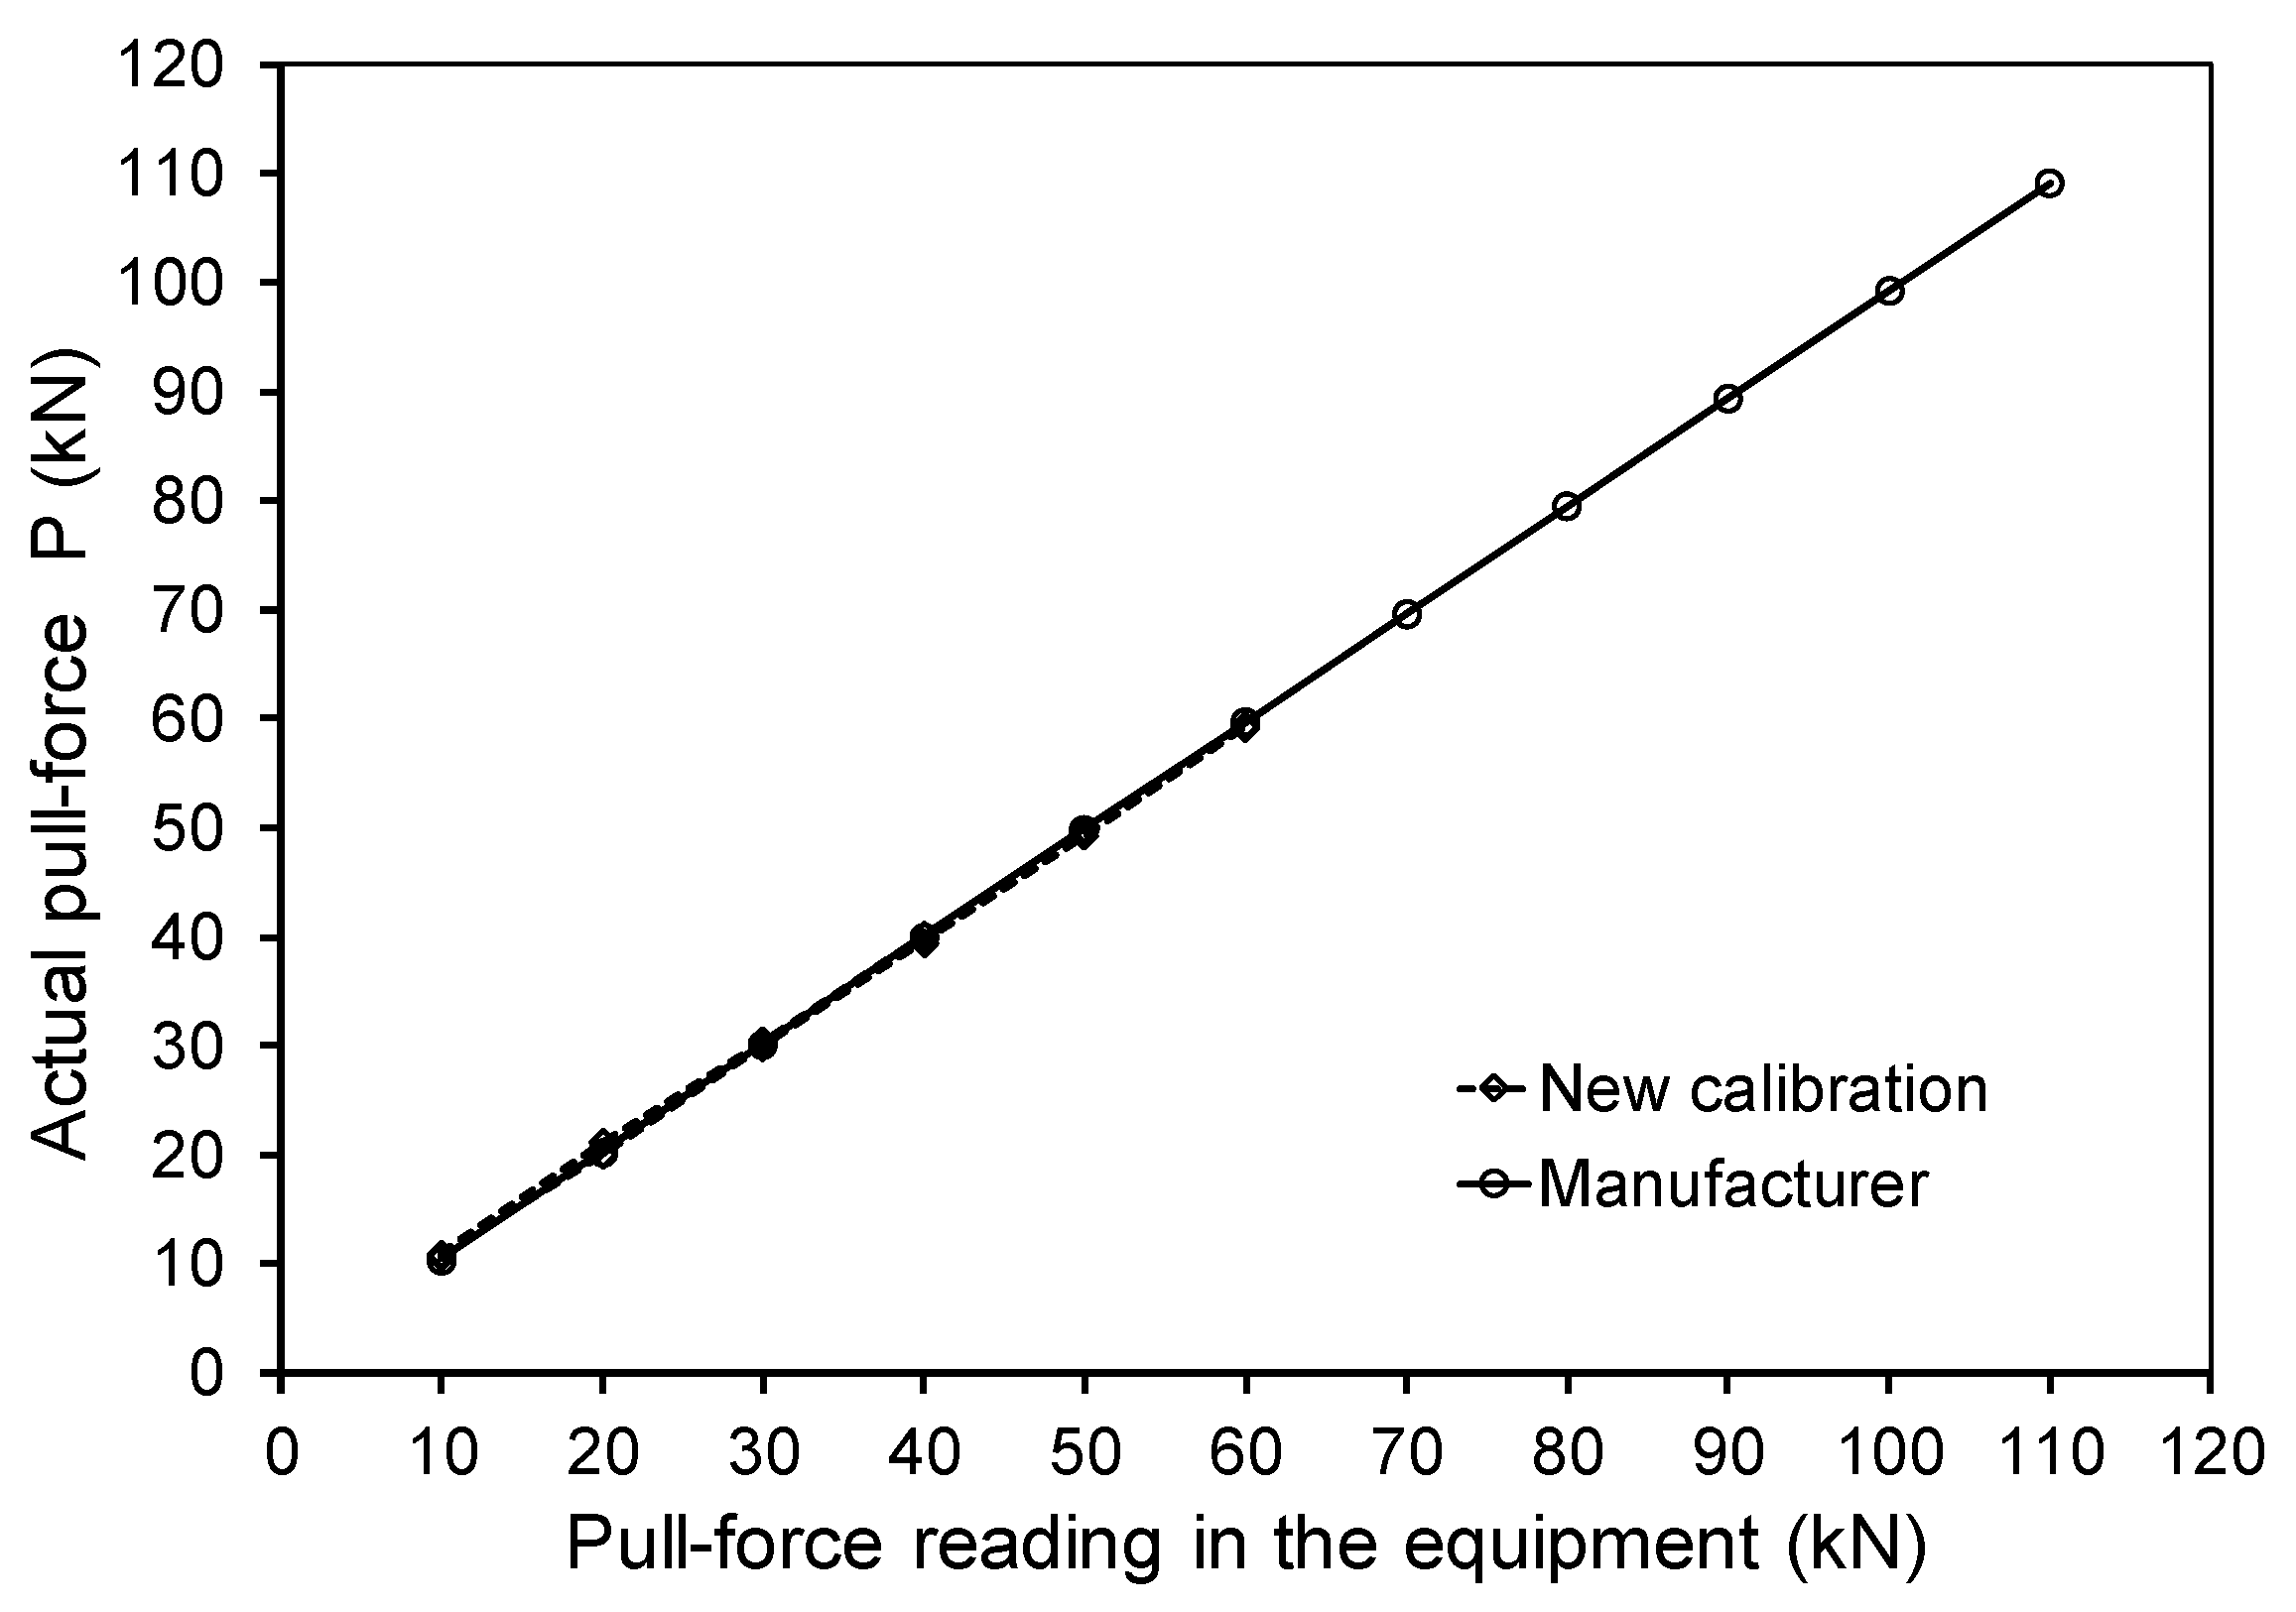
1,15].

2. Experimental Program

The experimental program was developed in three stages. In the first stage, the mix proportions of a SCC with average compressive strength at 28 days of 90 MPa was studied and characterized. In the second stage, seven sets of concrete test specimens were produced: P1, P2, P3, P7, P14, P28, and P94. For each set, the number corresponds to the concrete age (days). In the third stage, the selected NDT were applied, namely: the ultrasonic pulse velocity test (PUNDIT), the surface hardness test (Schmidt rebound hammer type N), the pull-out test (Lok-test), and the concrete maturity test (COMA-meter).

2.1. Study and Characterization of the SCC

The design of the mix proportions for the SCC was performed according to the methodology proposed by Nepomuceno et al. [18,19,20]. The characterization of the fresh and hardened concrete properties was performed according to NP EN 206-9: 2010 [21].

2.1.1. Material

To produce the SCC, the following materials were selected: Portland cement (CEM I 42.5R) with density 3140 kg/m3; fly ash with density 2380 kg/m3; modified carboxylate-based superplasticizer supplied by Sika Portugal, SA with the commercial name Sika ViscoCrete 3005 having a density 1050 kg/m3; fine-rolled natural sand (Sand 0/2) with density 2600 kg/m3 and fineness modulus 2.104; rolled natural sand from river with medium grain size (Sand 0/4) with density 2640 kg/m3 and fineness modulus 3.035; crushed granite aggregate (Gravel 3/6) with density 2710 kg/m3 and fineness modulus 5.311; and crushed granite aggregate (Gravel 6/15) with density 2700 kg/m3, fineness modulus 6.692 and maximum size 19.1 mm.
The optimum proportions of fine aggregates to fit with the fine aggregate reference curve was obtained by combining, in absolute volume ratio, 50% of Sand 0/2 and 50% of Sand 0/4, resulting in a mixture with fineness modulus 2.569. The coarse aggregates were combined in absolute volume ratio of 65% Gravel 3/6 and 35% Gravel 6/15 to fit with the coarse aggregate reference curve, resulting in a mixture with fineness modulus 5.794.

2.1.2. Mix Proportions of the SCC

The mix design of the mortar phase of SCC was performed based on the methodology proposed by Nepomuceno et al. [18], which considers the volumetric ratio of each fine aggregate (s1, s2,.., sn) in the total volume of fine aggregates (Vs), the powder mixture proportions (cement replacement by the addition), the ratio between the volume of powder and fine aggregates (Vp/Vs), the ratio between the volume of water and powder (Vw/Vp) and the percentage mass ratio between the superplasticizer and the powder (Sp/p%). Thus, considering the selected cement type and the intended average compressive strength, a water to cement ratio W/C (in mass) of 0.35 was estimated. Next, parameter Vp/Vs was set to be 0.80 and, based on the W/C ratio, cement type, and addition selected, the percentage of cement replacement by the addition was estimated as 30%. Parameters Vw/Vp and Sp/p% were obtained experimentally using the procedure described by Nepomuceno et al. [18]. The following values were obtained: Vw/Vp = 0.77 and Sp/p% = 0.70. The volumetric ratio of each fine aggregate, defined in Section 2.1.1, is 0.5 of Sand 0/2 and 0.5 of Sand 0/4.
According to the methodology proposed by Nepomuceno et al. [19,20], to complete the mix design of SCC, the following parameters are needed: the volumetric ratio of each coarse aggregate (g1, g2, …, gn) in the total volume of coarse aggregates (Vg), the volume of voids in concrete (Vv) and finally, the ratio between the volume of mortar and coarse aggregates (Vm/Vg). The following parameters were defined: Vv = 0.03 m3, Vm/Vg was estimated to be 2.279 considering the required fresh properties. The volumetric ratio of each coarse aggregate, defined in Section 2.1.1, is 0.65 for Gravel 3/6 and 0.35 for Gravel 6/15. The SCC mix proportions are presented in Table 1.

2.1.3. Fresh Properties of SCC

The evaluation of the SCC fresh properties was performed by measuring the spread in the slump-flow test (Figure 1), the fluidity in V-funnel test (Figure 2), and the passing ability in L-box test (Figure 3). The obtained results are presented in Table 2 (where Dm is the average diameter in slump-flow test, t is the V-funnel time and H2/H1 is the concrete heights ratio in L-box test) and fit the defined objectives. These tests were further complemented by visual observation of the fresh concrete to evaluate the segregation resistance. As shown in Figure 1, the concrete has spread uniformly with a very homogeneous distribution of aggregates and without any visible segregation or bleeding.

2.1.4. Production of Specimens for Testing

Seven series of SCC test specimens were produced, all cast on the same day and from a single concrete mixture. Fresh SCC was placed in the formworks without any kind of vibration (Figure 4). Each series consisted of a 200 mm cubic specimen to accommodate the five pull-out probes (one per face, see Figure 4b) and the maturity meter (Figure 5), and four 150 mm cubic specimens for the remaining tests (ultrasonic pulse velocity test, surface hardness test and compressive strength).
After molding, all test specimens were protected with plastic sheet to prevent the premature loss of moisture and stored in the laboratory for 24 h (Figure 6a). After 24 h, the test specimens were demolded (Figure 6b) and then placed in a curing chamber. The curing of concrete test specimens follows the EN 12390-2:2000 [22]—testing hardened concrete—Part 2: Making and curing specimens for strength tests. The automatic curing chamber was programmed to keep a temperature of 20 °C and a relative humidity (RH) of 95%. However, a small fluctuation occurred and the temperature varied between 18 and 20 °C, while the RH varied between 90 and 95%.

2.2. Hardened Properties of SCC

The evaluated hardened state properties were the concrete compressive strength and the density. The average concrete compressive strength results (fcm) are presented in Table 3 for each series corresponding to different ages of the same concrete. The density at 28 days was found to be around 2300 kg/m3. In Table 3, Sd is the standard deviation and Cv is the coefficient of variation. Figure 7 shows graphically the evolution of the compressive strength (fcm) with the age of concrete (in days) when submitted to standard curing conditions.
The characteristic value of the concrete compressive strength at 28 days (fck) is 88.5 MPa, considering the standard deviation (Sd) of 1.33 MPa, the mean value (fcm) of 90.70 MPa, and a margin parameter for the probability distribution of strength of 1.64 (assuming a normal distribution). According to NP EN 206-9:2010 [21], the SCC concrete class can be classified as C70/85, which corresponds to a high strength SCC.

2.3. Non-Destructive Tests

All test procedures and correlations for the selected NDT followed the recommendations from BS 1881-201:1986 [23].

2.3.1. Ultrasonic Pulse Velocity Test

The ultrasonic pulse velocity test was performed in accordance with BS 1881-203:1986 [16] using an apparatus (PUNDIT) connected to electro-acoustic transducers with frequency 54 kHz, produced by ELE International. Prior to the tests on each series, the calibration of the apparatus was checked (Figure 8). Then, four measurements were made in the 150 mm cubic test specimens, between two parallel faces, perpendicular to cast direction. The recorded readings are shown in Table 4, where V is the average value of four individual readings of the recorded velocity.

2.3.2. Surface Hardness Test

Surface hardness tests were performed in accordance with BS 1881-202:1986 [17] by applying a Schmidt rebound hammer type N with an impact energy of 2.207 Nm, produced by ELE International. Prior to this test, and after performing the ultrasonic pulse velocity test, the average concrete compressive strength until failure was measured by using three of the four 150 mm cubic test specimens produced in each set. The remaining four 150 mm cubic test specimen of each set was loaded with a compressive stress state equivalent to 1/10 of the average concrete compressive strength previously measured, in order to confine the test specimen between the steel plates of the compressive testing machine (Figure 9b). The main purpose was to subject the specimen to a certain load to prevent bouncing during test and to simulate the concrete under loading, as in real situation. By testing a free specimen, it will bounce and the result will not represent correctly the concrete surface hardness. The Schmidt rebound hammer was used horizontally and nine readings were recorded in the test specimen, in a molded face perpendicular to the concrete cast direction (Figure 9c). Prior to the surface hardness tests, the calibration of the apparatus was checked (Figure 9a). The recorded readings are shown in Table 5, where R represents the average value of nine individual readings of rebound number.

2.3.3. Pull-Out Test

Pull-out tests were performed in accordance with BS 1881-207:1992 [15] and using an apparatus with maximum loading capacity of 150 kN, from Germann Instruments A/S and based on the Lok-test system. Prior to the tests, the calibration provided by the manufacturer to convert the value of the pull-force recorded with the apparatus to the actual pull-force P (in kN) was checked. This checking was performed by using a load cell (Figure 10b) connected to a data logger (Figure 10a). The calibration correlation provided by the manufacturer was validated through several consecutive loading-unloading cycles between 10 to 60 kN, as shown in Figure 11.
Pull-out tests were applied on five faces of the 200 mm cubic test specimens according to the arrangement of the probes illustrated in Figure 4b. The probe geometry of the Lok-test system is characterized by a disc with 25 mm diameter located 25 mm in depth (Figure 4b). The test procedure consists of the following steps: Removal of the insert stem that is screwed to the cast-in disk (Figure 12a); screwing a pull-bolt flange to the cast-in disk (Figure 12b); screw of the coupling in the head of the pull bolt flange (Figure 12c); connection of the hydraulic jack to the coupling (Figure 13a); loading the instrument by turning slowly the telescoping handle clockwise about two seconds per each full lap in order to keep a loading rate of 0.5 ± 0.2 kN/s (Figure 13b) and finally, register the peak load (Figure 13c). In the present research, a video of the screen of the hydraulic jack was made to register the progress of the gauge pointer (Figure 13c), since when it reaches the peak load it quickly jumps to zero scale and the measurement could be lost.
After the pull-force load measured in the equipment is reached and recorded, the concrete cone trunk fragment was removed (Figure 14a) in order to visualize the geometry of the failure surface and to deduce the validity of the result (Figure 14b). If the insert is not to be reused, it is not necessary to fully extract the insert after achieving the maximum load, reducing the surface damage in the concrete surface. The pull-force load recorded in the apparatus was then converted into the actual pull-force load P (in kN) and the average value from the five readings obtained for each series was calculated. The recorded readings are shown in Table 6, where P represents the average value of the five individual readings of pull-force load, in kN.

2.3.4. Maturity Test

For the concrete maturity test, meters of range 0 to 14 M20 days and type COMA-Meter (COncrete MAturity-Meter) were selected. They consist of a closed capillary tube containing a special liquid (Figure 5a). Right prior to starting the test, the capillary tube was broken at its upper ending, and was immediately inserted into the threaded protective casing and then placed into the fresh concrete (Figure 5b,c). From that time, the liquid inside the capillary tube begins to evaporate because of the temperature of the concrete. Fixed to the tube, exists a blade that shows an equivalent maturity scale in days (M20). Right after the concrete casting, maturity meters were placed in the 200 mm cubic test specimens of series P1, P2, P3, P7, and P14. The maturity results M20 after 1, 2, 3, 7, and 14 days are shown in Table 7, where M20 (days) is the average value of the five individual readings.

3. Presentation and Discussion of the Results

3.1. Ultrasonic Pulse Velocity Test

Figure 15 illustrates the graph with the correlation obtained between the ultrasonic pulse velocity (V) and the average SCC compressive strength (fcm), as well as the corresponding exponential curve (continuous curve) used to fit the results with a correlation coefficient of about 0.97. Figure 16 compares the obtained correlation for SCC from Figure 15 to that obtained by Nepomuceno and Lopes [4,9] for NVC, with identical materials but with maximum coarse aggregate size of 25 mm. From Figure 16, it can be stated that a slight difference exists between the correlations. The small observed deviations are probably due to the differences of properties of the elastic medium because of the different mortar/coarse aggregate ratios. However, the results seem to show that for NVC the ultrasonic pulse velocity test loses sensitivity for the estimate of the concrete compressive strength for speeds above 4.6 km/s, while for SCC the same is observed to occur for higher speeds, from about 4.8 km/s. By analyzing the results presented in Table 4, it can be observed that Sd varied from 0.011 to 0.063 km/s with the average being 0.029 km/s. These results are similar to those obtained in NVC of compressive strength up to 82 MPa [4,9], the correlation of which is shown in Figure 16, namely Sd shows a variation from 0.006 to 0.086 km/s and a mean value of 0.028 km/s. Likewise, for SCC, the Cv varied from 0.2 to 1.3% with the average being 0.6% (Table 4). These results are similar to those for NVC [4,9], where Cv shows a variation between 0.1 to 1.9% with the average being 0.6%. In a previous analysis on repeatability undertaken by Nepomuceno and Lopes [10], bringing together NVC and SCC results, no evidence was found to conclude about the statistical parameter (Sd or Cv) that better represents the repeatability of ultrasonic pulse velocity test.

3.2. Surface Hardness Test

Figure 17 illustrates the graph with the correlation obtained between the rebound number (R) and the mean concrete compressive strength (fcm) for the studied SCC as well as the corresponding equation for the straight line (continuous line) used to fit the results with a correlation coefficient of about 0.96. In Figure 18 the obtained correlation for SCC from Figure 17 is compared to that obtained by Nepomuceno and Lopes [4,9], as previously referred in Section 3.1. From Figure 18 some differences are visualized between SCC and NVC, which are probably due to the different mortar/coarse aggregate ratios and different maximum size of the coarse aggregate. Also, the wall effect and the external vibration used to compact NVC certainly contributed to densify the near surface area of concrete. In fact, from Figure 18 it seems that, for concretes with equal compressive strength, NVC presents higher surface hardness when compared to SCC.
The results of Table 5 show that Sd varied from 0.63 to 2.24, the average being 1.21. Again, there is no significant difference when testing NVC of compressive strength up to 82 MPa [4,9], which correlation is shown in Figure 18, since the Sd varied from 0.66 to 1.93, the average being 1.11. Similar analysis was done for the Cv, showing that for SCC the Cv varied from 1.3 to 4.9%, the average being 2.7% (Table 5), while for NVC [4,9] the Cv varies between 1.3 to 5.0% with the average being 3.0%. These results are according to those reported by Bungey [24], which indicates as typical a Cv of 4% when testing different locations of the same element. The values of Sd and Cv are quite similar for NVC and SCC and no abnormal circumstances were detected. Previous analysis on the repeatability of surface hardness test, undertaken by Nepomuceno and Lopes [10], bringing together NVC and SCC results here reported, have revealed that Cv tends to be slightly lower as concrete compressive strengths increases, while Sd remains almost constant, which indicates that Sd is the statistical parameter which better represents the repeatability.

3.3. Pull-Out Test

Figure 19 illustrates the graph with the correlation obtained between the pull-out force (P) and the average concrete compressive strength (fcm) for the studied SCC, as well as the corresponding equation for the straight line (continuous line) used to fit the results, with a correlation coefficient of about 0.98. Figure 20 illustrates the comparison between the correlation obtained in the present research work for SCC (Figure 19) and those obtained for NVC by Nepomuceno and Lopes [4,7] and by Krenchel and Peterson [2]. For both SCC and NVC, the correlations in Figure 20 show the same tendency and high correlation coefficients. However, for the same concrete compressive strength, the pull-out force is higher for NVC when compared to SCC. This observation can be explained because of the higher amount of mortar and the existence of smaller aggregates in the surrounding area of the probe for SCC. For NVC, the existence of larger aggregates in the surrounding area provides higher resistance to failure in the zone of the compressive arm between the probe and the counterpressure ring.
At the ending of the last century, many independent analytical and experimental studies have been developed to understand how failure mechanism works during the pull-out test. A consensus has been achieved regarding the existence of a triaxial state of stress highly non uniform on the concrete involving the insert during extraction [1,3]. In spite of some divergence as far as the basic failure mechanism is concerned, a consensus exists regarding the fact that the last pull-out load is influenced by the same properties which influence the concrete compressive strength [1,3]. As previously mentioned, the pull-out test is assuming by the BS 1881-207:1992 [15] as being a very reliable test method, for which the use of general correlations is allowed with reasonable accuracy for a wide range of NVC mixes. However, the same standard points out that special correlations are required for lightweight concretes or other mixes with less common constituents. The different mix proportions of an SCC compared to NVC and the absence of vibration can justify the differences in the concrete hardness in the surface or near to the surface. Such differences were also detected when using the surface hardness test.
Table 6 shows that for SCC the Sd varied from 1.13 to 4.27 kN with the average being 2.17 kN. These values are similar to those obtained in NVC of compressive strength up to 82 MPa [4,7], the correlation of which is shown in Figure 20, presenting an Sd from 1.24 to 5.19 kN with the average being 2.53 kN. Krenchel and Petersen [2] have reported as typical a Sd from 1.9 kN to 2.5 kN when using 150 mm cubes and nearly 2.8 kN for larger specimens. For SCC, the Cv varied from 3.0 to 8.0% with the average being 4.9% (Table 6), while for NVC [4,7] of high strength the Cv varied from 2.9 to 7.0% with the average being 5.1%. Krenchel and Petersen [2] reported as typical a Cv between 6.8% and 7.5% when using 150 mm cube specimens and nearly 9.9% for larger specimens. The BS 1881-207:1992 [15] indicates a typical Cv of 7%. Previous analysis on repeatability of pull-out test, undertaken by Nepomuceno and Lopes [10], bringing together NVC and SCC reported results, have revealed that Sd is the statistical parameter which better represents the repeatability, which contradicts the Carino’s report [3].

3.4. Maturity Test

Figure 21 shows the graph with the correlation between the maturity days (M20) and the average SCC compressive strength (fcm) as well as the logarithmic curve (continuous curve) used to fit the results with a correlation coefficient of about 0.98. Based on the values presented in columns 2 and 3 of Table 7, a small lag can be observed between the maturity days M20 and the effective curing days after 7 days. This can be explained because the temperature of the curing chamber was, on average, slightly below 20 °C. Anyway, Figure 21 shows that the maturity test is effective to estimate the SCC compressive strength. Table 7 shows that Sd of five individual readings of M20 varied from 0.09 to 0.70 days with the average being 0.26 days, while the Cv varied from 3.7 to 7.1% with the average being 5.1%. From Table 7 it can be observed that, except for the first reading (one day), the Cv remains almost constant as SCC compressive strength increases, while the Sd tends to increase. These results can lead to the conclusion that Cv will better represents the repeatability of the maturity meter test.

4. Conclusions

Concerning the main achievement in this article the following conclusions can be drawn:
(1)
The obtained results showed good correlations between the SCC compressive strength and the NDT test readings. However, some differences were observed, when comparing with the correlations obtained for NVC, being more evident for the surface hardness test and the pull-out test. Thus, when testing SCC with NDT, general correlation should be used with precaution.
(2)
Surface hardness of SCC seems to be lower than that measured in NVC for the same level of concrete compressive strength, and this can be attributed to differences in mixture proportions and the used method to densify the concrete. The absence of vibration in SCC (it compacts by its self-weigh), the higher cement paste dosage, lower volume of coarse aggregates, and lower maximum aggregate size, together with the wall effect, can introduce differences near to the concrete surface. External vibration used to compact NVC specimens certainly have contributed to densify the near surface area of concrete.
(3)
Pull-out force measured in SCC was lower than that measured in NVC for the same level of concrete compressive strength, and this can be attributed to the same causes reported for surface hardness. In fact, both methods evaluate the concrete in the surface or near to the surface.
(4)
The analysis of the within-test variability allows to conclude that the standard deviation (Sd) and the coefficient of variation (Cv) which could be expected in a location of SCC with compressive strength up to 97 MPa, when using surface hardness test (9 readings), ultrasonic pulse velocity test (4 readings), and pull-out test (5 readings) are quite similar to that obtained in a location of NVC of compressive strengths up to 82 MPa, when using the same type of equipment and number of individual readings, respectively.

Author Contributions

M.C.S.N. supervised the experimental tests, processed the recorded data, and performed the comparative analyzes. M.C.S.N. and L.F.A.B. wrote the paper.

Funding

This work was financed by Portuguese national funds through FCT—Foundation for Science and Technology, IP, within the research unit C-MADE, Centre of Materials and Building Technologies (UID/ECI/04082/2019 project), University of Beira Interior, Portugal.

Acknowledgments

The authors would like to thank João J.B. Costa for his support in laboratory tests.

Conflicts of Interest

The authors declare no conflict of interest.

References

  1. Bungey, J.H.; Millard, S.G. Testing of Concrete in Structures, 3rd ed.; Chapman & Hall: London, UK, 1996. [Google Scholar]
  2. Krenchel, H.; Petersen, C.G. In-situ Pullout Testing with Lok-test. Ten Years’ Experience. In Proceedings of the International Conference on In Situ/Non-Destructive Testing of Concrete, Ottawa, ON, Canada, 2–5 October 1984. [Google Scholar]
  3. Carino, J.N. Pullout Test. In Handbook on Non-Destructive Testing of Concrete; CRC Press Inc.: Boca Raton, FL, USA, 1991; pp. 39–82. [Google Scholar]
  4. Nepomuceno, M.C.S. Ensaios Não Destrutivos em Betão (Non-destructive Tests on Concrete). In Provas de Aptidão Pedagógica e Capacidade Científica; UBI: Covilhã, Portugal, 1999. (In Portuguese) [Google Scholar]
  5. Nepomuceno, M.C.S.; Lopes, S.M.R. Non-destructive Tests on Concrete. In Journal of Concrete Technology Today Incorporating Structural Steel; Trade Link Media: Singapore, 2002; pp. 14–20. [Google Scholar]
  6. Lopes, S.M.R.; Nepomuceno, M.C.S. A Comparative Study of Penetration Resistance Apparatus on Concrete. In Proceedings of the Fourth International Conference on Composites Engineering, Kona, HI, USA, 6–12 July 1997; University of New Orleans: New Orleans, LA, USA, 1997; pp. 615–616. [Google Scholar]
  7. Lopes, S.M.R.; Nepomuceno, M.C.S. Evaluation of In-place Concrete Strength by Near-to-surface Tests. In Proceedings of the 12th European Ready Mixed Concrete Congress (ERMCO1998), Lisbon, Portugal, 23–26 June 1998; pp. 338–347. [Google Scholar]
  8. Lopes, S.M.R.; Nepomuceno, M.C.S. High Strength Concrete: Penetration Resistance Tests on High Strength Concrete. In Proceedings of the 1st International Conference on High Strength Concrete, Kona, HI, USA, 13–18 July 1997; ASCE: Reston, VA, USA, 1999; pp. 425–433. [Google Scholar]
  9. Lopes, S.M.R.; Nepomuceno, M.C.S. Non-Destructive Tests on Normal and High Strength Concrete. In Proceedings of the 26th Conference on Our World in Concrete & Structures, Singapore, 27–28 August 2001; CI-Premier PTE LTD-Singapore: Singapore, 2001; Volume 20, pp. 53–67. [Google Scholar]
  10. Nepomuceno, M.C.S.; Lopes, S.M.R. Analysis of Within-Test Variability of Non-Destructive Test Methods to Evaluate Compressive Strength of Normal Vibrated and Self-Compacting Concretes. IOP Conf. Ser. Mater. Sci. Eng. 2017, 245, 032025. [Google Scholar] [CrossRef]
  11. Alwash, M.; Breysse, D.; Sbartaï, Z.M.; Szilágyi, K.; Borosnyói, A. Factors affecting the reliability of assessing the concrete strength by rebound hammer and cores. Constr. Build. Mater. 2017, 140, 354–363. [Google Scholar] [CrossRef]
  12. Szilágyi, K.; Borosnyói, A.; Zsigovics, I. Extensive statistical analysis of the variability of concrete rebound hardness based on a large database of 60 years experience. Constr. Build. Mater. 2014, 53, 333–347. [Google Scholar] [CrossRef]
  13. El Mir, A.; Salem, G. Nehme. Repeatability of the rebound surface hardness of concrete with alteration of concrete parameters. Constr. Build. Mater. 2017, 131, 317–326. [Google Scholar] [CrossRef]
  14. Ramos, L.F.; Miranda, T.; Mishra, M.; Fernandes, F.M.; Manning, E. A Bayesian approach for NDT data fusion: The Saint Torcato church case Study. Eng. Struct. 2015, 84, 120–129. [Google Scholar] [CrossRef]
  15. British Standard BS 1881-207:1992. Testing Concrete. Recommendations for the Assessment of Concrete Strength by Near-to-surface Tests; British Standards Institution: London, UK, 1992. [Google Scholar]
  16. British Standard BS 1881-203:1986. Testing Concrete: Recommendations for Measurement of Velocity of Ultrasonic Pulses in Concrete; British Standards Institution: London, UK, 1986. [Google Scholar]
  17. British Standard BS 1881-202:1986. Testing Concrete: Recommendations for Surface Hardness Testing by Rebound Hammer; British Standards Institution: London, UK, 1986. [Google Scholar]
  18. Nepomuceno, M.C.S.; Pereira-de-Oliveira, L.A.; Lopes, S.M.R. Methodology for mix design of the mortar phase of self-compacting concrete using different mineral additions in binary blends of powders. Constr. Build. Mater. 2012, 26, 317–326. [Google Scholar] [CrossRef]
  19. Nepomuceno, M.C.S.; Pereira-de-Oliveira, L.A.; Lopes, S.M.R. Methodology for the mix design of self-compacting concrete using different mineral additions in binary blends of powders. Constr. Build. Mater. 2014, 64, 82–94. [Google Scholar] [CrossRef]
  20. Nepomuceno, M.C.S.; Pereira-de-Oliveira, L.A.; Lopes, S.M.R.; Franco, R.M.C. Maximum coarse aggregate’s volume fraction in self-compacting concrete for different flow restrictions. Constr. Build. Mater. 2016, 113, 851–856. [Google Scholar] [CrossRef]
  21. NP EN 206-9:2010. Regras adicionais para o betão autocompactável (BAC); Instituto Português da Qualidade: Caparica, Portugal, 2010. (In Portuguese) [Google Scholar]
  22. EN 12390-2:2000. Testing Hardened Concrete—Part 2: Making and Curing Specimens for Strength Tests; European Committee for Standardization: Brussels, Belgium, 2000. [Google Scholar]
  23. British Standard BS 1881-201:1986. Testing Concrete: Guide to the Use of Non-Destructive Methods of Test for Hardened Concrete; British Standards Institution: London, UK, 1986. [Google Scholar]
  24. Bungey, J.H. Concrete Strength Variations and In-place Testing. In 2nd Australian Conference on Engineering Materials; University of New South Wales: Sydney, Australia, 1981; pp. 85–96. [Google Scholar]
Figure 1. Slump-flow test: (a) start test, (b) measuring the diameter, (c) absence of segregation or bleeding.
Applsci 09 05109 g001
Figure 2. V-funnel test: (a) fill of V-funnel, (b) ready to test, (c) flowing of concrete.
Applsci 09 05109 g002
Figure 3. L-box test: (a) fill the L-box, (b) concrete flow, (c) prepared for readings after stop flow.
Applsci 09 05109 g003
Figure 4. Concrete molding: (a) cubes of 150 mm side, (b) cube of 200 mm side, (c) concrete placing.
Applsci 09 05109 g004
Figure 5. Concrete maturity test: (a) COMA meter, (b) and (c) placing the closed capillary tube.
Applsci 09 05109 g005
Figure 6. Concrete test specimens: (a) protection, (b) demolding.
Applsci 09 05109 g006
Figure 7. Variation of the concrete compressive strength with the age under standard cure.
Applsci 09 05109 g007
Figure 8. Calibration of the PUNDIT apparatus.
Applsci 09 05109 g008
Figure 9. Surface hardness test: (a) calibration of apparatus, (b) confinement of specimen, (c) testing.
Applsci 09 05109 g009
Figure 10. Pull-out test: (a) data logger, (b) calibration checking.
Applsci 09 05109 g010
Figure 11. Comparison between new calibration and that provided by the manufacturer.
Applsci 09 05109 g011
Figure 12. Pull-out test: (a) removal of the stem, (b) screw of pull-bolt flange (c) screw of coupling.
Applsci 09 05109 g012
Figure 13. Pull-out test: (a) connection of the hydraulic jack, (b) loading, (c) reading.
Applsci 09 05109 g013
Figure 14. Pull-out test: (a) and (b) concrete cone trunk fragments.
Applsci 09 05109 g014
Figure 15. Ultrasonic pulse velocity versus average concrete compressive strength.
Applsci 09 05109 g015
Figure 16. Comparison between correlations for SCC and NVC using ultrasonic pulse velocity test.
Applsci 09 05109 g016
Figure 17. Rebound number versus average concrete compressive strength.
Applsci 09 05109 g017
Figure 18. Comparison between correlations for SCC and NVC using surface hardness test.
Applsci 09 05109 g018
Figure 19. Pull-out force versus average concrete compressive strength.
Applsci 09 05109 g019
Figure 20. Comparison between correlations for SCC and NVC using pull-out test.
Applsci 09 05109 g020
Figure 21. Maturity days versus average concrete compressive strength.
Applsci 09 05109 g021
Table 1. Mix proportions of SCC (contents per cubic meter).
Constituent MaterialsDosage
Portland cement CEM I 42.5R (kg)487.5
Fly ash (kg)158.4
Superplasticizer (liters)4.3
Water (liters)170.8
Sand 0/2 (kg)360.4
Sand 0/4 (kg)366.0
Gravel 3/6 (kg)521.1
Gravel 6/15 (kg)279.6
Table 2. Fresh properties of SCC.
Slump-Flow Dm (mm)V-Funnel t (s)L-Box H2/H1
78015.60.92
Table 3. Hardened properties of SCC.
SeriesAge (days)fcm (MPa) Sd (MPa) Cv (%)
P1145.311.483.26
P2258.162.213.81
P3364.062.093.26
P7771.923.004.16
P141481.476.167.56
P282890.701.331.46
P949497.001.791.84
Table 4. Ultrasonic pulse velocity test results.
SeriesAge (days)V (km/s) Sd (km/s) Cv (%)
P114.310.0350.82
P224.440.0110.24
P334.570.0250.56
P774.640.0300.64
P14144.800.0631.31
P28284.840.0220.45
P94944.830.0150.31
Table 5. Surface hardness test results.
SeriesAge (days)RSdCv (%)
P1137.440.631.69
P2241.001.202.92
P3343.061.072.49
P7745.391.393.06
P141445.442.244.93
P282847.561.262.65
P949449.610.651.31
Table 6. Pull-out test results.
SeriesAge (days)P (kN)Sd (kN)Cv (%)
P1126.811.505.58
P2234.511.504.34
P3335.691.133.15
P7743.201.292.98
P141447.743.236.76
P282853.074.278.04
P949460.962.253.69
Table 7. Maturity test results.
SeriesAge (days)M20 (days)Sd (days) Cv (%)
P111.260.0897.10
P222.290.1144.98
P333.260.1193.66
P776.640.2633.96
P141411.920.6985.85

