Article

Haptic Hybrid Prototyping (HHP): An AR Application for Texture Evaluation with Semantic Content in Product Design

by
Miguel-Ángel Pardo-Vicente
1,*,
Lucía Rodríguez-Parada
1,
Pedro F. Mayuet-Ares
1 and
Francisco Aguayo-González
2
1
Department of Mechanical Engineering & Industrial Design, Faculty of Engineering, University of Cádiz, Av. Universidad de Cádiz 10, Puerto Real, E-11519 Cádiz, Spain
2
Department of Design Engineering, University of Seville, Virgen de África 7, 41011 Seville, Spain
*
Author to whom correspondence should be addressed.
Appl. Sci. 2019, 9(23), 5081; https://doi.org/10.3390/app9235081
Submission received: 28 October 2019 / Revised: 18 November 2019 / Accepted: 21 November 2019 / Published: 25 November 2019
(This article belongs to the Special Issue Augmented Reality: Current Trends, Challenges and Prospects)

Abstract

:
The manufacture of prototypes is costly in economic and temporal terms and in order to carry this out it is necessary to accept certain deviations with respect to the final finishes. This article proposes haptic hybrid prototyping, a haptic-visual product prototyping method created to help product design teams evaluate and select semantic information conveyed between product and user through texturing and ribs of a product in early stages of conceptualization. For the evaluation of this tool, an experiment was realized in which the haptic experience was compared during the interaction with final products and through the HHP. As a result, it was observed that the answers of the interviewees coincided in both situations in 81% of the cases. It was concluded that the HHP enables us to know the semantic information transmitted through haptic-visual means between product and user as well as being able to quantify the clarity with which this information is transmitted. Therefore, this new tool makes it possible to reduce the manufacturing lead time of prototypes as well as the conceptualization phase of the product, providing information on the future success of the product in the market and its economic return.

Graphical Abstract

1. Introduction

Consumers’ lifestyles are continually changing and demand that new products come onto the market more frequently [1]. These products are increasingly personalized so that they can, on the one hand, adapt to the functional needs of today’s market and, on the other, use the product as a means of communicating a changing lifestyle [2]. This, together with the challenge posed by the paradigm of Industry 4.0 (I 4.0) at present, makes tools such as augmented reality (AR) have the purpose of promoting autonomous interoperability, agility, flexibility, rapid decision-making, efficiency, and cost reduction [3,4,5].
Within this framework, one of the main purposes of design engineering teams is to focus on the user to meet their needs and expectations [6,7]. Thus, in the conceptual phase, the correct formal, functional and aesthetic adaptation of the product by industrial designers is crucial to avoid problems in the following phases of the design process or even market products with erroneous attributes [8].
For this reason, during the product conceptualization process, it is crucial to predict at an early stage during the design phase the future reactions of users to the product [9]. Thus, it must be possible to demonstrate that the requirements of the product specification are aligned with what users think and feel in real conditions of use.
Historically, the most studied requirements in the field of product design have been those that allow the product to accomplish its function. However, in the last few decades, product semantics (PS) [10] and then emotional design (ED) [11,12] have shown that not only is function important, but that products serve as a channel for communicating concepts [13,14,15]. Many of these concepts are related to the way of living and feeling of people and with them emotions are produced [16,17]. The beginning of this communication process starts with what concepts want to be communicated and by what means they are going to be transmitted [18,19]. Hence the importance of establishing design and manufacturing requirements related to PS and of being able to reliably demonstrate what message is delivered through the design properties (shape, colour, material, and texture) [20,21].
To approach the resolution of this problem, one of the most commonly used methods by design teams to get the user’s opinion before the manufacturing phase has been the creation of prototypes [22]. This is an economical and quick way to reproduce the shape of the product and be able to validate certain basic requirements [23]. Thus, the techniques developed in prototyping vary depending on the historical framework where increasing complexity in design processes and efforts to improve decision making leads to the creation of new approaches and techniques to support designers in order to improve product quality. This scenario has given rise to the appearance of hybrid prototypes (HP), defined as the simultaneous presence of a virtual representation, either through virtual reality (VR) or AR and physical support [24,25]. Thus, the application of these processes results in a reduction of time in the manufacture of prototypes and, therefore, of the conceptualization phase [26]. In addition, it allows the process to use fewer materials, produce less waste and consume less energy, achieving the same result [27,28].
These techniques make it possible to combine virtual interaction with physical interaction, studying specific aspects of the product [29]. However, there is no methodology that is oriented towards the evaluation and selection of textures and reliefs, being this an important facet in the detailed design of a product.
There is currently a multitude of methods and techniques to help designers to graphically represent a product. Among the most commonly used are rendering and animation techniques, although it should be noted that advanced techniques have recently appeared such as VR and AR [30,31]. In addition, other methods are being developed that focus on the choice of sounds, such as the door of a car when it closes [32] or the sound of an office chair as it slides [33]. Similarly, there is a long tradition of perfumers who create essences capable of evoking emotions through past memories [34]. However, when it comes to the choice of textures, the industry employs traditional methods based on catalogs of commercial samples [35], so there is no satisfactory framework for exploiting the haptic sensitivity of the user as a means of conveying concrete emotions that enhance the user experience and help communicate concepts related to the product or the brand image of the manufacturer. In addition, these methods do not allow the haptic property to be connected to other properties, such as the visual property [36]. Although touch is capable of evoking memories of our subconscious and helps to communicate the concepts we wish to transmit, other products also require integrating the haptic experience with the rest of the senses and aligning them with the objectives of the project, as in the case of packaging or other products that may come into contact with the user [37]. An outstanding example is the interior of a car, where the texture of the steering wheel, the upholstery or the plastics of the dashboard must be aimed at achieving the same objective.
Thus, in order to transmit emotions, it is important to determine what message is to be transmitted through the product and by what sensory means this information reaches the user. Studies have shown that the most diverse sensory system is touch, as it is not limited to perceiving textures, but also thermal, chemical or mechanical characteristics and allow the person to collect more data about their weight, pressure, temperature, humidity, or determine if the surface is slippery [38]. In this way, it has been stated that touch is more accurate than vision when evaluating changes in the surface of an object [36]. This ability makes touch an important means of emotional communication between product and user. It is for this reason that this article aims to provide a method to assess and predict haptic communication early and efficiently by creating the haptic hybrid prototyping (HHP) concept. In order to validate the method, this article carries out an experiment with 56 participants in which the perception of users is evaluated by substituting the final products with HHP.

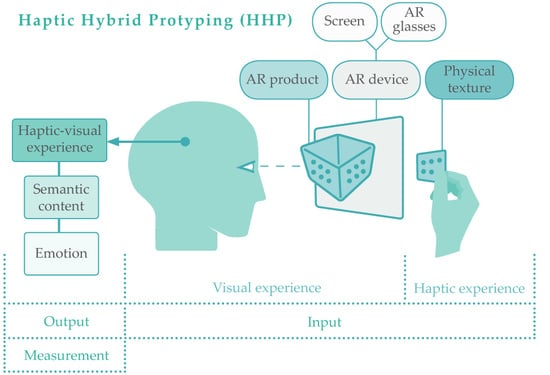
2. Haptic Hybrid Prototyping (HHP): Method Overview

This article studies the development of a method that combines haptic and visual experience with the aim of transmitting a certain message. For this purpose the concept of HHP is created, a method that aims to shorten the product design phase in the early stages, reducing costs and making the process more efficient. The development of this method, based on the AR technique, provides a methodology that serves as a means of validating textures or reliefs and ribs from simulation by finite elements. This is a methodology that serves to test the solutions, to meet the communication needs of users, that reduces costs and prototyping times, eventually using additive manufacturing techniques. Figure 1 outlines these five ways leading to the justification and creation of HHPs.
This integration of solutions in a single method has been the product of the study and observation of multiple investigations. Accordingly, there are some projects of special relevance that served as precursors of HHP. In 2005, Lee and Park created prototypes of products with foamed material that is easy to work with. They included a QR code to add different aesthetic aspects to evaluate in AR. To test their proposal they superimposed the virtual and physical models of a cup and a vacuum robot [39]. In this experiment, the authors evaluated the physical appearance of a product without the need to create a detailed the prototype. This experiment can be considered as a visual validation prototype.
Another important milestone came in 2009, at the 8th Berlin Workshop Human-Machine-Systems BWMMS’09, whereby a hybrid is created between a mechatronic prototype and a VR image for the purpose of evaluating functional characteristics of a product. The combination of physical and virtual parts was called smart hybrid prototyping (SHP) [25,28,40]. In this experiment, it was possible to interact with a physical product in a virtual environment.
Recently, a novel methodology called VPModel has also been published, which uses mixed reality (MR) through Microsoft MR HoloLens glasses, a leap motion controller and 3D printing technology to make a physical-virtual hybrid prototype capable of detecting hand gestures and recognizing actions [41]. This methodology was put into practice in the creation of a digital camera, in which the user could handle the product in a situation of use similar to the real one. The objective of the VPModel is to provide information on the general geometry of the product and in turn implement graphic information.
However, through the creation of the HHPs, there has been a response to the need to use the sense of touch as a means of transmitting semantic content related to the product or the marketing company. In this way, it helps the product design teams to choose the textures and reliefs that communicate the key information detailed in the design requirements, thus reaching the end user in a more efficient and effective way.
The HHP method is based on the integration of haptic and visual sense. Commercial texture and relief samples and a device capable of working with AR applications are used (Figure 2). The aim is to use partial samples of texture and relief and to complete the geometry of the product by means of virtual modeling. This allows the user to receive the haptic and visual information he needs to perceive a situation of use similar to the real one.
In order for HHPs to be useful, easily reproducible and inexpensive to implement in design teams around the world, a simple methodological design has been sought. Thus, it is not necessary to manufacture physical prototypes or expensive pre-series by means of final manufacturing technologies. By means of AR technology and commercial samples it is possible to approach experiences of use of finished products. It is convenient to point out that although in this application the samples used are flat, it is possible to use any geometry, two-dimensional or three-dimensional, with any relief or texture.
In summary, this study is based on the hypothesis that the haptic-visual experience of a user before a real product can be extrapolated to the interaction with an HHP through samples of textures and three-dimensional images using AR.

3. Materials and Methods

3.1. Ethical Implications

Participants have been provided with understandable information about the experimental procedure. There are no known dangers for participants. All subjects have participated voluntarily and could have decided to leave the study at any time without explanation. The data collected in this research are anonymous and their use will be regulated by the current legislation on the protection of personal data.

3.2. Participants

The study involved 56 members from the community of the Faculty of Engineering of the University of Cádiz, of whom 42 were men and 14 women. 75% of those surveyed were between 18 and 30 years old; 16% were between 31 and 40; and 9% were between 41 and 50. It should be noted that 82.1% of participants studied engineering degrees that are offered at the educational center where the study was carried out. All of the participants carried out the same experiment.

3.3. Materials

The virtual models of the products evaluated were generated with the computer-aided design program Solidworks® (2019 version, Dassault Systèmes SE, Velizy-Villacoublay, France), commonly used by industrial designers, and the virtual models were generated using the AR program Unity® (12 October 2017, 2.0f3 version, Unity Technologies, San Francisco, CA, USA). This software was selected because it represents the virtual perspective of a high-quality object, provides fluid movement and rendering allows for a clear appreciation of changes in the plane of the containers studied. The engine of the AR software used was Vuforia® Engine 8.3, which uses deep learning to generate the graphic models instantly. In order to associate the CAD models in AR with the samples, each of the products was associated with a QR code with the minimum size to be read by the application: 47 × 47 mm. It should be added that the combination of the CAD model, the sample and the QR code result in the HHP.
Physical finishing samples have been developed in this experiment using additive manufacturing and thermoforming techniques. Afterwards they were attached to a support, which includes the QR code, to allow manipulation of the samples while evaluating the virtual image. Also, although the AR program allows use of any digital device, we have worked with a 10.1 inch Samsung® Tab A 2016 Tablet with an IPS display with a maximum resolution of 1920 × 1200 was used to improve the functionality of the procedure.
In addition, four types of packaging have been created for the purpose of carrying out the experiment, which, in turn, includes four different reliefs. Figure 3 shows the geometries used, where the model type A presents relief in the form of sawtooth, type B a dot pattern, type C ribs and type D undulations.
Figure 4 shows a comparative example of visualization of the physical and virtual product. The physical prototype, Figure 4a, has a transparent finish and the virtual prototype has a white finish, Figure 4b, showing in the image the superposition of the prototype in AR over the physical prototype.
For the physical samples, the moulds of the containers were constructed by means of additive manufacturing (FFF) on a Zortrax M200 printer. They were printed using a layer height of 0.2 mm, filling density of 15% and wall of 1.4 mm to prevent the surface roughness caused by the layer manufacturing of the FFF from being transmitted to the thermoformed sheet, in accordance with [42]. Hence, users were only able to perceive the designed reliefs.
The containers were then manufactured using a Formech 450DT thermoforming machine with a 500 µm thick transparent PET sheet. This material allows the containers to be transparent and the colour does not distract the interviewees.
Figure 5 shows the three physical products evaluated and the three QR-coded flat relief samples used to generate HHP by using AR. Thus, the coding of the relief samples, with associated QR code, is the same as the container to which the sample corresponds and the termination AR has been added.
In order to carry out the experiment, 6 samples were manufactured, Figure 5: two samples of the type A and B container models and one sample for types C and D (Figure 3). This is due to the fact that the prototypes type A and B were evaluated by means of the conventional experimental physical prototype and by means of the HHP method proposed in this work. These parts tested with AR were called A-AR and B-AR in Figure 5. On the other hand, the thermoformed prototype type C, Figure 5, has been evaluated only physically, and the sample type D has been evaluated virtually with HHP, Figure 5, called D-AR in the experiment.
Accordingly, in order to make the samples that make up part of the proposed HHP, a wall of the thermoformed container was cut to remove only the reliefs designed on type A, B and D containers in Figure 3. As shown in Figure 6, a support with three legs was placed on the cut samples, which was used as a separator, at a distance of 35 mm, with the generated QR code, which was designed to touch the finishing sample without hiding the QR code from the camera. An effect of the superimposition of the virtual product on the hand was achieved on the screen.

3.4. Evaluation of Haptic-Visual Properties

The survey created was divided into seven blocks, the first relating to user data: sex, age, and level of education. The remaining six were related to the pieces studied. In each of these blocks the concepts were ordered randomly, maintaining 10 concepts related to texture: silky, dirty, abrasive, rough, soft, sharp-edge, clean, slippery, adherent and smooth, but adding other concepts related to other properties of temperature, hardness, shape, and weight. The aim of adding these adjectives was to prevent the respondent from relating the experiment only with the haptic characteristics of the packaging. In this way, it was intended that the interviewee did not know the objective of the study and, therefore, did not unintentionally alter the result of the work.
Each of the concepts evaluated could be graded, on a Likert scale, between 1 (not at all adequate) and 5 (very adequate). During the bibliographic review it was detected that this five-point scale has been used in other research on applied haptic experience in product design [43] or in emotion research by means of Kansei Engineering [44]. Thus, the aim of the questionnaire was to ask users about concepts related to the haptic experience of the samples while they are watching and manipulating the physical prototype and to contrast their answers with those reported after performing the same process with the hybrid prototype. It is important to point out that the value they gave to each concept is not relevant for the study, but to know if its answer does not depend on the visual medium used.

3.5. Procedure

The participants were moved one by one to an empty, quiet and well-illuminated room. Participants were not informed about the purpose of the study. There were no distractions. They were made to sit at a table with a computer monitor and mouse and asked to complete the first survey data relating to their gender, age, and educational level. The rest of the experiment was divided into two phases:
Phase 1: Packaging A was delivered to the subjects (Figure 7). The subjects were informed that there was no time limit and they were asked to manipulate the packaging and then answer the questionnaire questions on the computer. At the end of the process, the container was removed and B was handed over with the same instructions. Then it was repeated with packaging C. The interviewees could not see which samples would be given to them or the number of them.
Phase 2: A Tablet was placed in front of the interviewees on a support that maintained it in an upright position. The A-AR sample was given to them and they were asked to place it in front of the camera so that they had to see it through the screen (Figure 8). They were asked to manipulate it, but always seeing it through the device. As they did this, they answered the questions on the questionnaire using the mouse. Next, they were given the D-AR sample and given the same instructions. The procedure was repeated with the B-AR sample. The HHP images obtained for these three products are shown in Table A1.
With regard to the evaluation order of the samples from both phases, an attempt was made to hinder the relationship of the physical flat samples, phase 2, with the physical products evaluated, phase 1, varying the order of evaluation, thus ensuring the reliability of the results.

4. Results and Discussion

As mentioned above, of the four models used in the experiment, only models A and B are used for the assessment of the reliability of the methodology applicable to product design. These models could be evaluated in parallel during the physical handling of the packaging and through AR technology using the HHP method. The studied attributes were evaluated with respect to the degree of coincidence of both results.

4.1. Analysis of Coincidence between Physical Prototypes and HHP

Table 1 shows the sum of the answers given to each attribute indicating the level of coincidence for product type A between both experiments: physical prototype and HHP method. From the sum of the results obtained in all adjectives by the level of coincidence, it can be deduced that in 216 responses the deviation of the results was ±1 on a weighting of 5 points. Secondly, and no less representatively, 201 answers were obtained with total coincidence in the answers, the numerical value of the rest of the answers were much lower. Therefore, in a first approximation of the results, it was detected that the HHP method allows the analysis of haptic-visual properties in the field of industrial design, generating an evaluable sensory experience [45].
On the other hand, Figure 9 shows the results obtained in Table 1 as a percentage of responses. An overall analysis of the results shows that the deviation of ±3 and ±4 is reduced in comparison to the responses that present a greater similarity. Thus, of the 10 attributes studied, the answers in 5 of them present a total coincidence: silky, dirty, abrasive, clean and smooth. Among them, the adjective “abrasive” stands out, for which 57.1% of the participants coincided in their answers in both experiments. The minimum value of these terms is reached by the “smooth” attribute with 33.9%, which means a difference of 23.2% between these terms. This adjective is also the one that presents similar values between total coincidence, ±1, ±2 and ±3. This may be due to the fact that product type A presents angulated plane changes where the surface finish of the plastic material is intentionally non-abrasive, due to the lack of discontinuities that the product presents, to evaluate the degree of flatness of a piece is complex, with which the degree of dispersion of responses is higher.
As to the degree of coincidence ±1, the adjectives that stand out are “rough”, “soft”, “sharp-edge”, “slippery” and “adherent”. Where the highest value is for “adherent” with 53.6% and the lowest for “soft” and “sharp-edge” with 42.9%. These data indicate that there is a difference between these terms of 10.7%. It is also important to point out that the adjectives “soft”, “sharp-edge” and “smooth” present a percentage of answers with a ±2 coincidence between 20% and 30%. It is possible that the adjective “soft” has the same difficulty for users as the term “smooth” since both are related to the lack of discontinuities in the surface of the pieces. On the other hand, the term “sharp-edge” can direct the attention of respondents from the proposed reliefs to the edges of the pieces and cause a distortion in the statistics.
As an overall result of the study of product type A it was obtained that 74.5% of the answers are concentrated between the total coincidence and ±1. This result indicates that respondents tend to repeat their answers between the first and second phases exactly or with the minimum deviation.
Table 2, analogous to Table 1, shows the sum of the answers given to each attribute, indicating the level of coincidence for the type B product between both experiments. In the summation, it is observed that 228 responses correspond to a deviation of ±1 on a weighting of 5 points, followed by total coincidence with 224 responses. As in Table 1, the rest of the answers are much smaller in magnitude than the rest of the data. In this way it is observed that in product B there is also a tendency to respond with a total coincidence or ±1 so this second product also suggests that the HHP method makes it possible to analyze haptic-visual properties in the field of industrial design, generating an assessable sensory experience.
On the other hand, Figure 10 shows the results obtained in Table 2 as a percentage of responses. In a deeper analysis of the results, it is observed that the deviation of ±3 and ±4 is comparatively reduced and can be considered irrelevant, which reinforces the validation of the method in the same way as for the A packaging. In addition, from the results it is extracted that there are 4 adjectives that present a majority of total coincidence for product B, these are: “silky”, “dirty”, “abrasive” and “clean”. Specifically, this last term represents the highest percentage of coincidence with 58.9% and the terms “silky” and “dirty” have had the lowest percentage of coincidence with 54.4% each. This indicates that there is only a 3.5% difference between the highest hit values.
Considering the values of coincidence ±2, it is observed that the adjectives that present greater reliability between answers are “soft”, “sharp-edge”, “slippery”, “adherent” and “smooth”. The highest value is produced for “soft” with 58.9% and the lowest for “sharp-edge” with 44.6%, there is a difference of 14.3% between them.
Regarding the values for the ±3 coincidence, only the term “Sharp-edge” is between 20% and 30%, with the rest of the data being much lower.
As a global result of the study of product type B it is obtained that 80.7% of the answers are concentrated between the total coincidence and ±1. As in product A, this result indicates that the respondents tend to repeat their answers between the first phase and the second in an exact way or with the minimum deviation.
In a comparative evaluation between Figure 9 and Figure 10, it is observed that the total coincidences and the coincidences ±1 have increased in product B with respect to A for all the adjectives evaluated except for the term “rough”. Based on this, it should be noted that the maximum deviation between the maximum value reached in product A and the lowest in product B for the concept “rough” occurs for the coincidence ±1 and is 5.3%. This value in comparison with the increments that have experienced the rest of adjectives can be considered unrepresentative.
This general increase in the coincidence between one product and another indicates that the dot pattern texture generates less response dispersion than the sawtooth texture and the results obtained are clearer. It can, therefore, be deduced that with the HHP method it is possible to distinguish between textures that communicate concepts clearly (categorical responses) or confusingly (dispersion of responses), being able to choose not only what information is to be transmitted, but also the clarity of this. In the same way and regulating the level of texture, it would be possible to regulate the intensity of the concept transmitted, having an influence on the emotion produced and associated with that concept [46]. It is important to point out that this experience is not only linked to the haptic sense, but to the union of this sense with the sense of view. Accordingly, in the mind of the user this sensory information is linked to the product in an inseparable way [47,48] so that it was this texture associated with that image that led him or her to transmit a semantic content and with it, evoke an emotion [49] and not the perception of both pieces of information separately. Thus, the design team of the trading company can use this sensory and cognitive experience to communicate through its products a concrete brand image [50,51] detecting this synergetic effect of two sensory channels together with a concrete memory and an associated emotion. All this becomes more valuable when detected at a very early stage of the design phase, enabling the working methodology proposed in this article to be made more efficient and effective.
On the other hand, there is also a strong parallelism in the level of overlap between product A and product B. So all adjectives where total matches predominate in one product also do in the other. In the case of total coincidence, these adjectives are “silky“, “dirty“, “abrasive“ and “clean”. And in the same way, all the adjectives in which the ±1 match is predominant in product A also coincide in product B. These are “soft“, “sharp-edge”, “slippery“ and “adherent“. This occurs with eight of the adjectives, except in the terms “smooth” where the predominance is opposite and the term “rough” where both coincidences, total and ±1 are equal. This may be due, as explained above, to the fact that the adjective “smooth” in the plastic samples causes confusion in the users since the test samples do not deliberately show surface irregularities in both products, making it difficult to evaluate a change in flatness. Similarly, for the term “rough” the response deviation between products A and B is minimal so it is not considered relevant data.
All of the above suggests that there are some terms that are more complex to evaluate and make the user tend to a slight dispersion in their responses. Therefore, it can be deduced that the level of success that the interviewees have in their answers depends on the evaluated adjectives and not on the textures or reliefs of the proposed pieces. Thus, on the one hand, the easiest adjectives to evaluate for the proposed products are “silky”, “dirty”, “abrasive” and “clean” and, on the other hand, the more complicated “soft”, “sharp-edge” “slippery” and “adherent”. It is also deduced that the adjective “smooth”, depending on the type of texture and relief evaluated, can generate greater uncertainty than the rest of the adjectives, producing the described tendency to move away from total coincidence.
In order to analyses in a more detailed way the differences between the responses of products A and B, Figure 11 is carried out. It shows the sum of the percentages of total coincidence and ±1 coincidence for each product and compares these values reached in both products. In this way, it is observed that in both products the adjective “sharp-edge” reports the lowest values, below 65%. As commented, it is possible that the term leads users to evaluate the cut made to produce the sample shown and they do not evaluate the texture, so a clarification in the evaluation of this term or its substitution could produce higher values of success.
If we analyze the differences between the percentages of success between pieces A and B (Figure 12), we observe that the adjective “smooth” has the highest value with 21.5%. This term is followed by “soft” with 19.6%. The rest of adjectives present increases of a lower magnitude. Once again it is proven that users have problems when evaluating these concepts. Additionally, the evaluation of these terms is sensitive to the texture evaluated. This may be due to the fact that users evaluate the surface finish and not the reliefs of the containers. Therefore, if we want to evaluate these adjectives it is convenient to focus the user’s attention on the surface finish, eliminating the reliefs and at the same time that these present very different roughness. Accordingly, greater percentages of response and smaller increases between pieces could be obtained.
However, it should also be pointed out that the success rate could be increased by carrying out an experimental design more focused on certain haptic-visual experiences. Thus, examples such as the adjective “dirty” could be interpreted differently in the real prototype as synonymous with cleanliness or as image clarity in the virtual prototype. Therefore, by being careful in the preparation of the sample and clearly delimiting the limits of the essay and informing the subject of the objective sought the percentage of success between pieces could increase.
Taking into account this information and in order to make the results of the experiment conform to reality, it is observed that the adjectives “smooth” and “soft” are causing an alteration in the analysis of data, just as the term “sharp-edge” is also producing a bias in the results due to the problem of understanding the concept to be evaluated described above. For these reasons, a new analysis is carried out by eliminating these three adjectives.
Table 3 shows the sum of answers given to products A and B together. It can be seen that by eliminating the three concepts mentioned above, users reach the highest value of answers for total coincidence, with a difference of 5.4 points above the next coincidence, the rest being a downward progression. This information reveals the significant fact that 81% of the answers are concentrated in the first two rows of the table.
These values are plotted in Figure 13. This shows the percentages of answers and a linear interpolation of the points that show a clear tendency of the users to correct.
It therefore follows that HHPs can simulate a real experience of using a product in haptic visual terms, with a probability of 81% and a dispersion of the set of measured values of ±1 over 5 points, implying an accuracy of ±20%. These values can guide design teams to know the tendency of users to understand the semantic information of the product perceived in a multimodal way and with it the emotion associated with that cognitive processing.

4.2. Analysis of the Application of Augmented Reality (AR) Technology as Part of the HHP Method

The experience of using AR technology as part of the design process was also analyzed during the HHP evaluation experiment. The majority of participants perceived that the technology is useful, being qualified as positive and realistic. However, they considered that the synchronization system of the virtual image and the texture sample could be improved with the elimination of the QR code. The study of the application of the AR without code is considered of interest to improve the interaction of the prototype with the user. To this end, it has been observed the existence of AR software tools in which a photograph is used as a reference image for the virtual object [52]. This can be applied using the physical sample, although it is necessary to study the dynamic relationship between the user and the hybrid prototype since the virtual image could be lost with the movement of the physical pattern.
In addition, it should be noted that the application of AR has been validated as a technique used in the perception of a product, so it can be improved through the application of rendering motors with photorealistic materials.
On the other hand, in previous investigations prototypes and methodologies can be found that measure the functionality of a product and that use the new technologies of VR, AR, and MR to reproduce experiences close to those lived by the users in the real circumstances of their use. This is the case of the Smart Hybrid Prototyping (SHP), which was created for the rapid and efficient evaluation of mechatronic products early in the product design phase [53]. All these experiences use VR to generate an environment and, for this, facilities and technical preparation that require a relatively high investment are necessary [54]. In this context, the study carried out shows that HHPs improve these technical aspects through the use of AR, allowing an integration of the element created in a real environment, and not the other way around. This facilitates user immersion, creating more realistic experiences. In this way, the realization of these hybrid prototypes is less expensive, besides being faster to implement, with simple software preparation.

4.3. Sensory Experience and HHP

In the study conducted with the HHP method created, it was observed that this method provides, in addition to a realistic haptic-visual multimodal integration, a way of being able to choose the sensations that users need to feel when faced with a specific product. This makes it possible for the product to be more competitive in the market. This way of detecting the information that is communicated to the client through the product makes is possible to carry it out in the early stages of the conceptualization of the product with the rapidity of implementation and effectiveness that the I4.0 demands.
Accordingly, this simple evaluation method, thanks to HHP, provides the creation of a new method that offers the evaluation of a sensory experience related to the finishes of a product. In this way other techniques related to haptic experience have been investigated, however, few works of literature have been found about devices that recreate the sense of touch. An example of this is the creation of a glove prototype that allows hand movements to be monitored and acted on [55]. Work is also being done on the use of general-purpose devices such as the Phantom Omni, a device that is also applied in the simulation of a tool in an operating room or controlling a robot arm during a virtual mechanical assembly [43]. However, with this device when evaluating a texture a bias is generated in the transmitted information. In this device, it is not the user who can directly touch the texture sample and, therefore, this complex sensory chain of electrical currents of the body is replaced by one based on vibrations. This is not the case with HHP, where the haptic experience is real and it must also be added that the visual experience in the case of AR allows an integration of the object in the real environment, which creates an integrated multimodal experience and not a disaggregated experience. The simplicity of the use of HHPs also allows for a simpler and less costly implementation in monetary terms than in the case of the Phantom Omni.
With regard to Product Semantics, it should be noted that there are some outstanding authors who have made important contributions in this field, such as Krippendorff [10,20,56], Gibson [57,58] or Karjalainen [51,59]. However, no contributions have been found on the evaluation of semantic content transmitted via haptics technology. However, as explained in previous research, an attempt is made to integrate haptic sense with visual sense but they do not provide an effective methodology for the selection of textures in the creation of new products. On the contrary, the HPP semantic evaluation method has managed to integrate both perceptions and, therefore, it is possible to verify the transmission and correct reception of the information in a multimodal way.

5. Conclusions

In the experiment, a new prototyping tool was evaluated, for the evaluation of products, based on AR technology. The haptic-visual experience of the participants during the interaction with a real product and an HHP was studied.
Analyzing the data, the results show that during the use of HHPs users tend to perceive the same semantic information as during the experience of use with a real product.
Therefore, it is concluded that the HHP method is capable of distinguishing between the meaning transmitted by the textures and reliefs of a product, and consequently, it is possible to transmit concrete information to users. It has also been found that it is possible to distinguish not only the information communicated but also the clarity with which this information reaches the user. The HHP can be used in this way by design teams to detect and transmit product-related values, being a reliable method for initially evaluating the emotions evoked by products, together with their finish, in users through haptic-visual means.
On the other hand, it has been detected that in order to achieve results closer to a real situation of use, it is considered necessary to focus the evaluation of products on certain surface finishes, provided that all of them are relevant for the study, and at the same time, if a clear differentiation is incorporated between texturized surfaces, the analysis of the experience would improve.
Similarly, the increased graphical integration of the physical sample finish with the prototype in AR can provide an improved haptic experience in evaluating products with the HHP tool. In addition, the reliability of the method can be increased by generating samples with a clear delimitation of the textured zone, as this favours concentration on the elements of interest in the evaluation of finishes and shapes. In this way, the user experience with HHP could be improved.
Finally, it was concluded that the application of the HHP method in early stages of the conceptualization of a product can lead to the reduction of design times and the lowering of the prototyping phase, in addition to leading to more reliable results in user-product communication and, therefore, to have some certainty in the success of the product and economic return.

Author Contributions

Conceptualization, M.-Á.P.-V.; methodology, M.-Á.P.-V., L.R.-P. and P.F.M.-A.; software, M.-Á.P.-V.; validation, M.-Á.P.-V., L.R.-P., P.F.M.-A. and F.A.-G.; formal analysis, M.-Á.P.-V., L.R.-P., P.F.M.-A. and F.A.-G.; investigation, M.-Á.P.-V. and L.R.-P.; resources, P.F.M.-A.; data curation, M.-Á.P.-V., L.R.-P. and P.F.M.-A.; writing—original draft preparation, M.-Á.P.-V.; writing—review and editing, L.R.-P. and P.F.M.-A.; supervision, P.F.M.-A. and F.A.-G. All authors read and approved the final manuscript.

Funding

The APC was funded by the University of Cádiz (Programme for the promotion and encouragement of research and transfer).

Acknowledgments

The authors thank the collaboration of Guillermo Naya García for his contribution in the realization of the experiment, as well as all the participants in it.

Conflicts of Interest

The authors declare no conflict of interest.

Appendix A

Table A1. HHP image for A-AR, B-AR and D-AR samples.
SampleAR Prototype
A-AR Applsci 09 05081 i001
B-AR Applsci 09 05081 i002
D-AR Applsci 09 05081 i003

References

  1. Nafisi, M.; Wiktorsson, M.; Rösiö, C.; Granlund, A. Manufacturing engineering requirements in the early stages of new product development—A case study in two assembly plants. In Advanced Applications in Manufacturing Enginering; Woodhead Publishing: Cambridge, UK, 2019; pp. 141–167. ISBN 9780081024140. [Google Scholar]
  2. Rodríguez-Parada, L.; Pardo-Vicente, M.-Á.; Mayuet-Ares, P.-F. Digitalización de alimentos frescos mediante escaneado 3d para el diseño de envases personalizados. DYNA Ing. E Ind. 2018, 93, 681–688. [Google Scholar] [CrossRef]
  3. Gilchrist, A. Introducing Industry 4.0. In Industry 4.0; Apress: Berkeley, CA, USA, 2016; pp. 195–215. [Google Scholar]
  4. Alcácer, V.; Cruz-Machado, V. Scanning the industry 4.0: A literature review on technologies for manufacturing systems. Eng. Sci. Technol. Int. J. 2019, 22, 899–919. [Google Scholar]
  5. Čolaković, A.; Hadžialić, M. Internet of Things (IoT): A review of enabling technologies, challenges, and open research issues. Comput. Netw. 2018, 144, 17–39. [Google Scholar] [CrossRef]
  6. Calvillo-Arbizu, J.; Roa-Romero, L.M.; Estudillo-Valderrama, M.A.; Salgueira-Lazo, M.; Aresté-Fosalba, N.; del-Castillo-Rodríguez, N.L.; González-Cabrera, F.; Marrero-Robayna, S.; López-de-la-Manzana, V.; Román-Martínez, I. User-centred design for developing e-Health system for renal patients at home (AppNephro). Int. J. Med. Inform. 2019, 125, 47–54. [Google Scholar] [CrossRef] [PubMed]
  7. Desmet, P.M.A.; Xue, H.; Fokkinga, S.F. The same person is never the same: Introducing mood-stimulated thought/action tendencies for user-centered design. She Ji J. Des. Econ. Innov. 2019, 5, 167–187. [Google Scholar] [CrossRef]
  8. Crolic, C.; Zheng, Y.; Hoegg, J.; Alba, J.W. The influence of product aesthetics on consumer inference making. J. Assoc. Consum. Res. 2019, 4, 398–408. [Google Scholar] [CrossRef]
  9. Khalaj, J.; Pedgley, O. A semantic discontinuity detection (SDD) method for comparing designers’ product expressions with users’ product impressions. Des. Stud. 2019, 62, 36–67. [Google Scholar] [CrossRef]
  10. Krippendorff, K. The Semantic Turn: A New Foundation for Design; CRC/Taylor & Francis: Boca Raton, FL, USA, 2006; ISBN 9780415322201. [Google Scholar]
  11. Desmet, P.; Hekkert, P. Framework of product experience. Int. J. Des. 2007, 1, 13–23. [Google Scholar]
  12. Norman, D.A. El Diseño Emocional: Por Qué nos Gustan (o no) los Objetos Cotidianos; Paidós: Barcelona, Spain, 2005; ISBN 8449317290. [Google Scholar]
  13. Shannon, C.E.; Weaver, W. The Mathematical Theory of Communication; University of Illinois Press: Champaign, IL, USA, 1964; ISBN 0252725484. [Google Scholar]
  14. Monó, R. Design for Product Understanding: The Aesthetics of Design from a Semiotic Approach; Liber AB: Trelleborg, Sweden, 1997; ISBN 914701105X. [Google Scholar]
  15. Crilly, N.; Good, D.; Matravers, D.; Clarkson, P.J. Design as communication: Exploring the validity and utility of relating intention to interpretation. Des. Stud. 2008, 29, 425–457. [Google Scholar] [CrossRef]
  16. Demet, P. Getting Emotional With Pieter Desmet|Design & Emotion. Available online: http://www.design-emotion.com/2006/11/05/getting-emotional-with-dr-pieter-desmet/ (accessed on 19 November 2018).
  17. Norman, D.A.; Berkrot, P.; Tantor Media. The Design of Everyday Things; Tantor Media, Inc.: Old Saybrook, CT, USA, 2011; ISBN 1452654123. [Google Scholar]
  18. Crilly, N.; Moultrie, J.; Clarkson, P.J. Seeing things: Consumer response to the visual domain in product design. Des. Stud. 2004, 25, 547–577. [Google Scholar] [CrossRef]
  19. Bloch, P.H. Seeking the ideal form: Product design and consumer response. J. Mark. 1995, 59, 16. [Google Scholar] [CrossRef]
  20. Krippendorff, K. Propositions of human-centeredness; A philosophy for design. Dr. Educ. Des. Found. Futur. 2000, 3, 55–63. [Google Scholar]
  21. You, H.; Chen, K. Applications of affordance and semantics in product design. Des. Stud. 2007, 28, 23–38. [Google Scholar] [CrossRef]
  22. Chang, K.-H.; Chang, K.-H. Rapid prototyping. In e-Design; Academic Press: Cambridge, MA, USA, 2015; pp. 743–786. ISBN 978-0-12-382038-9. [Google Scholar]
  23. Um, D. Solid Modeling and Applications: Rapid Prototyping, CAD and CAE Theory, 2nd ed.; Springer: Berlin, Germany, 2018; ISBN 9783319745947. [Google Scholar]
  24. Bruno, F.; Angilica, A.; Cosco, F.; Luchi, M.L.; Muzzupappa, M. Mixed prototyping environment with different video tracking techniques. In Proceedings of the IMProVe 2011 International Conference on Innovative Methods in Product Design, Venice, Italy, 15–17 June 2011. [Google Scholar]
  25. Buchholz, C.; Vorsatz, T.; Kind, S.; Stark, R. SHPbench—A smart hybrid prototyping based environment for early testing, verification and (user based) validation of advanced driver assistant systems of cars. Procedia CIRP 2017, 60, 139–144. [Google Scholar] [CrossRef]
  26. Rieuf, V.; Bouchard, C.; Meyrueis, V.; Omhover, J.-F. Emotional activity in early immersive design: Sketches and moodboards in virtual reality. Des. Stud. 2017, 48, 43–75. [Google Scholar] [CrossRef]
  27. Mathias, D.; Snider, C.; Hicks, B.; Ranscombe, C. Accelerating product prototyping through hybrid methods: Coupling 3D printing and LEGO. Des. Stud. 2019, 62, 68–99. [Google Scholar] [CrossRef]
  28. Stark, R.; Beckmann-Dobrev, B.; Schulze, E.-E.; Adenauer, J.; Israel, J.H. Smart hybrid prototyping zur multimodalen erlebbarkeit virtueller prototypen innerhalb der produktentstehung. In Proceedings of the Berliner Werkstatt Mensch-Maschine-Systeme BWMMS’09: Der Mensch im Mittelpunkt Technischer Systeme, Berlin, Germany, 7–9 October 2009. [Google Scholar]
  29. Ng, L.X.; Ong, S.K.; Nee, A.Y.C. Conceptual design using functional 3D models in augmented reality. Int. J. Interact. Des. Manuf. 2015, 9, 115–133. [Google Scholar] [CrossRef]
  30. Liagkou, V.; Salmas, D.; Stylios, C. Realizing virtual reality learning environment for industry 4.0. Procedia CIRP 2019, 79, 712–717. [Google Scholar] [CrossRef]
  31. Ke, S.; Xiang, F.; Zhang, Z.; Zuo, Y. A enhanced interaction framework based on VR, AR and MR in digital twin. Procedia CIRP 2019, 83, 753–758. [Google Scholar] [CrossRef]
  32. Parizet, E.; Guyader, E.; Nosulenko, V. Analysis of car door closing sound quality. Appl. Acoust. 2008, 69, 12–22. [Google Scholar] [CrossRef]
  33. Dal Palù, D.; Buiatti, E.; Puglisi, G.E.; Houix, O.; Susini, P.; De Giorgi, C.; Astolfi, A. The use of semantic differential scales in listening tests: A comparison between context and laboratory test conditions for the rolling sounds of office chairs. Appl. Acoust. 2017, 127, 270–283. [Google Scholar] [CrossRef]
  34. Baer, T.; Coppin, G.; Porcherot, C.; Cayeux, I.; Sander, D.; Delplanque, S. “Dior, J’adore”: The role of contextual information of luxury on emotional responses to perfumes. Food Qual. Prefer. 2018, 69, 36–43. [Google Scholar] [CrossRef]
  35. Da Silva, E.S.A. Design, Technologie et Perception: Mise en Relation du Design Sensoriel, Sémantique et Émotionnel avec la Texture et les Matériaux. Ph.D. Thesis, ENSAM, Paris, France, 2016. [Google Scholar]
  36. Fenko, A.G.; Schifferstein, H.N.J.; Hekkert, P.P.M. Which senses dominate at different stages of product experience? In Proceedings of the Design Research Society Conference, Sheffield, UK, 16–19 July 2008. [Google Scholar]
  37. Fenko, A. Influencing healthy food choice through multisensory packaging design. In Multisensory Packaging; Springer International Publishing: Cham, Switzerland, 2019; pp. 225–255. [Google Scholar]
  38. Fenko, A.B. Sensory Dominance in Product Experience; VSSD: Delft, The Netherlands, 2010. [Google Scholar]
  39. Lee, W.; Park, J. Augmented foam: A tangible augmented reality for product design. In Proceedings of the Fourth IEEE and ACM International Symposium on Mixed and Augmented Reality (ISMAR’05), Vienna, Austria, 5–8 October 2005; pp. 106–109. [Google Scholar]
  40. Beckmann-Dobrev, B.; Kind, S.; Stark, R. Hybrid simulators for product service-systems—Innovation potential demonstrated on urban bike mobility. Procedia CIRP 2015, 36, 78–82. [Google Scholar] [CrossRef]
  41. Min, X.; Zhang, W.; Sun, S.; Zhao, N.; Tang, S.; Zhuang, Y. VPModel: High-fidelity product simulation in a virtual-physical environment. IEEE Trans. Vis. Comput. Graph. 2019, 25, 3083–3093. [Google Scholar] [CrossRef]
  42. Rodríguez-Parada, L.; Mayuet, P.F.; Gamez, A.J. Industrial product design: Study of FDM technology for the manufacture of thermoformed prototypes. In Proceedings of the Manufacturing Engineering Society International Conference (MESIC2019), Madrid, Spain, 19—21 June 2019; Escuela Técnica Superior de Ingeniería y Diseño Industrial; p. 7. [Google Scholar]
  43. Teklemariam, H.G.; Das, A.K. A case study of phantom omni force feedback device for virtual product design. Int. J. Interact. Des. Manuf. 2017, 11, 881–892. [Google Scholar] [CrossRef]
  44. Turumogan, P.; Baharum, A.; Ismail, I.; Noh, N.A.M.; Fatah, N.S.A.; Noor, N.A.M. Evaluating users’ emotions for kansei-based Malaysia higher learning institution website using kansei checklist. Bull. Electr. Eng. Inform. 2019, 8, 328–335. [Google Scholar] [CrossRef]
  45. Heide, M.; Olsen, S.O. Influence of packaging attributes on consumer evaluation of fresh cod. Food Qual. Prefer. 2017, 60, 9–18. [Google Scholar] [CrossRef]
  46. Iosifyan, M.; Korolkova, O. Emotions associated with different textures during touch. Conscious. Cogn. 2019, 71, 79–85. [Google Scholar] [CrossRef]
  47. Eklund, A.A.; Helmefalk, M. Seeing through touch: A conceptual framework of visual-tactile interplay. J. Prod. Brand Manag. 2018, 27, 498–513. [Google Scholar] [CrossRef]
  48. Takahashi, C.; Watt, S.J. Optimal visual–haptic integration with articulated tools. Exp. Brain Res. 2017, 235, 1361–1373. [Google Scholar] [CrossRef]
  49. Tsetserukou, D.; Neviarouskaya, A. Emotion telepresence: Emotion augmentation through affective haptics and visual stimuli. J. Phys. Conf. Ser. 2012, 352, 012045. [Google Scholar] [CrossRef]
  50. Karjalainen, T.-M.; Snelders, D. Designing visual recognition for the brand. J. Prod. Innov. Manag. 2010, 27, 6–22. [Google Scholar] [CrossRef]
  51. Karjalainen, T.-M. Semantic Transformation in Design: Communicating Strategic Brand Identity through Product Design References; University of Art and Design in Helsinki: Helsinki, Finland, 2004; ISBN 9515581567. [Google Scholar]
  52. Tsai, T.; Chang, H.; Yu, M. Universal Access in Human-Computer Interaction. Interact. Technol. Environ. 2016, 9738, 198–205. [Google Scholar]
  53. Stark, R. Fraunhofer IPK: Smart Hybrid Prototyping. Available online: https://www.ipk.fraunhofer.de/en/divisions/virtual-product-creation/technologies-and-industrial-applications/smart-hybrid-prototyping/ (accessed on 16 July 2019).
  54. Microsoft HoloLens Commercial Suite. Available online: https://www.microsoft.com/es-es/p/microsoft-hololens-commercial-suite/944xgcf64z5b?activetab=pivot:techspecstab (accessed on 19 October 2019).
  55. Farooq, A.; Evreinov, G.; Raisamo, R. Enhancing Multimodal Interaction for Virtual Reality Using Haptic Mediation Technology. In Proceedings of the International Conference on Applied Human Factors and Ergonomics, Washington, DC, USA, 24–28 July 2019; pp. 377–388. [Google Scholar]
  56. Krippendorff, K.; Butter, R. Product Semantics: Exploring the Symbolic Qualities of Form; Departmental Papers; ASC: Philadelphia, PA, USA, 1984. [Google Scholar]
  57. Gibson, J.J. The Perception of the Visual World; Greenwood Press: Westport, CT, USA, 1974; ISBN 0837178363. [Google Scholar]
  58. West, C.K.; Gibson, J.J. The senses considered as perceptual systems. J. Aesthetic Educ. 2006, 3, 142. [Google Scholar] [CrossRef]
  59. Karjalainen, T.-M. Semantic mapping of design processes. In Proceeding of the 6th International Conference of the European Academy of Design, Bremen, Germany, 29–31 March 2005. [Google Scholar]
Figure 1. Pathways leading to the creation of haptic hybrid prototyping (HHP).
Applsci 09 05081 g001
Figure 2. HHP method overview.
Applsci 09 05081 g002
Figure 3. Design of moulds for thermoforming. (a) Model A mould with sawtooth relief; (b) Model B mould with relief formed by a dot pattern; (c) Model C mould with ribs; (d) Model D mould with undulating relief.
Applsci 09 05081 g003
Figure 4. Images of the experiment: (a) Image of the real packaging and (b) packaging in augmented reality (AR) superimposed with the real one.
Applsci 09 05081 g004
Figure 5. Nomenclature of containers and samples used in the experiment: (a) Sample A-AR, with sawtooth relief; (b) Sample B-AR, with dot pattern texture; (c) Sample D-AR, with undulated relief; (d) Packaging A, with reliefs in the form of saw teeth; (e) Packaging B, with dot pattern texture; (f) Packaging C, with relief in the form of ribs.
Applsci 09 05081 g005
Figure 6. A-AR relief sample with QR code and support.
Applsci 09 05081 g006
Figure 7. Manipulation of sample A.
Applsci 09 05081 g007
Figure 8. Manipulation of the sample A and vision of the AR through a tablet.
Applsci 09 05081 g008
Figure 9. Cumulative coincidence of responses for product type A.
Applsci 09 05081 g009
Figure 10. Cumulative match of responses for product type B.
Applsci 09 05081 g010
Figure 11. Percentage of responses that show total coincidence or ±1 between products A and B.
Applsci 09 05081 g011
Figure 12. Increase in accuracy between products A and B considering the total coincidence and ±1.
Applsci 09 05081 g012
Figure 13. Percentage of responses and match levels for products A and B and their trendline.
Applsci 09 05081 g013
Table 1. Number of accumulated responses according to the degree of coincidence of product A.
SilkyDirtyAbrasiveRoughSoftSharp-EdgeCleanSlipperyAdherentSmoothΣ
C24223224141225181119201
C±119191826242418243014216
C±2984215169111116101
C±3461434334436
C±401100010036
Table 2. Number of cumulative responses according to the degree of coincidence for product type B.
SilkyDirtyAbrasiveRoughSoftSharp-EdgeCleanSlipperyAdherentSmoothΣ
C3131322316833181517224
C±118181523332512292728228
C±27597515979780
C±3010327224425
C±401000100103
Table 3. Number of cumulative responses according to the degree of coincidence for products A and B.
SilkyDirtyAbrasiveRoughCleanSlipperyAdherentΣ%
C5553644758362633943.2%
C±13737334930535729637.8%
C±2161313918182010713.6%
C±34717558374.7%
C±4021010150.6%

