A Novel Localization Technique Using Luminous Flux

 ,
,  , , and
Abstract
:1. Introduction
- The configurations of the LED lattice are devised by using the Lambertian model for individual LEDs.
- According to our knowledge, no specific research has been performed using PDoP attributes prior to visible light-based indoor localization.
- We analyze PDoP with respect to channel impulse response time, considering both direct and multipath reflections, which has not been done before.
- Novel positioning algorithms are used to compute PDoP on each LED, along with a comparison of root mean square error (RMS) based on the simulated RSS values, the RMS errors, and the SSE errors are computed with two different LED lattices to estimate the positioning error.
2. System Configuration Method
2.1. Working Principle of VLC Channel
2.2. Indoor VLC Channel Modeling
2.2.1. Impulse Response for Line of Sight (LoS) Model
2.2.2. Impulse Response for Non-LoS Model or Multiple Bounces
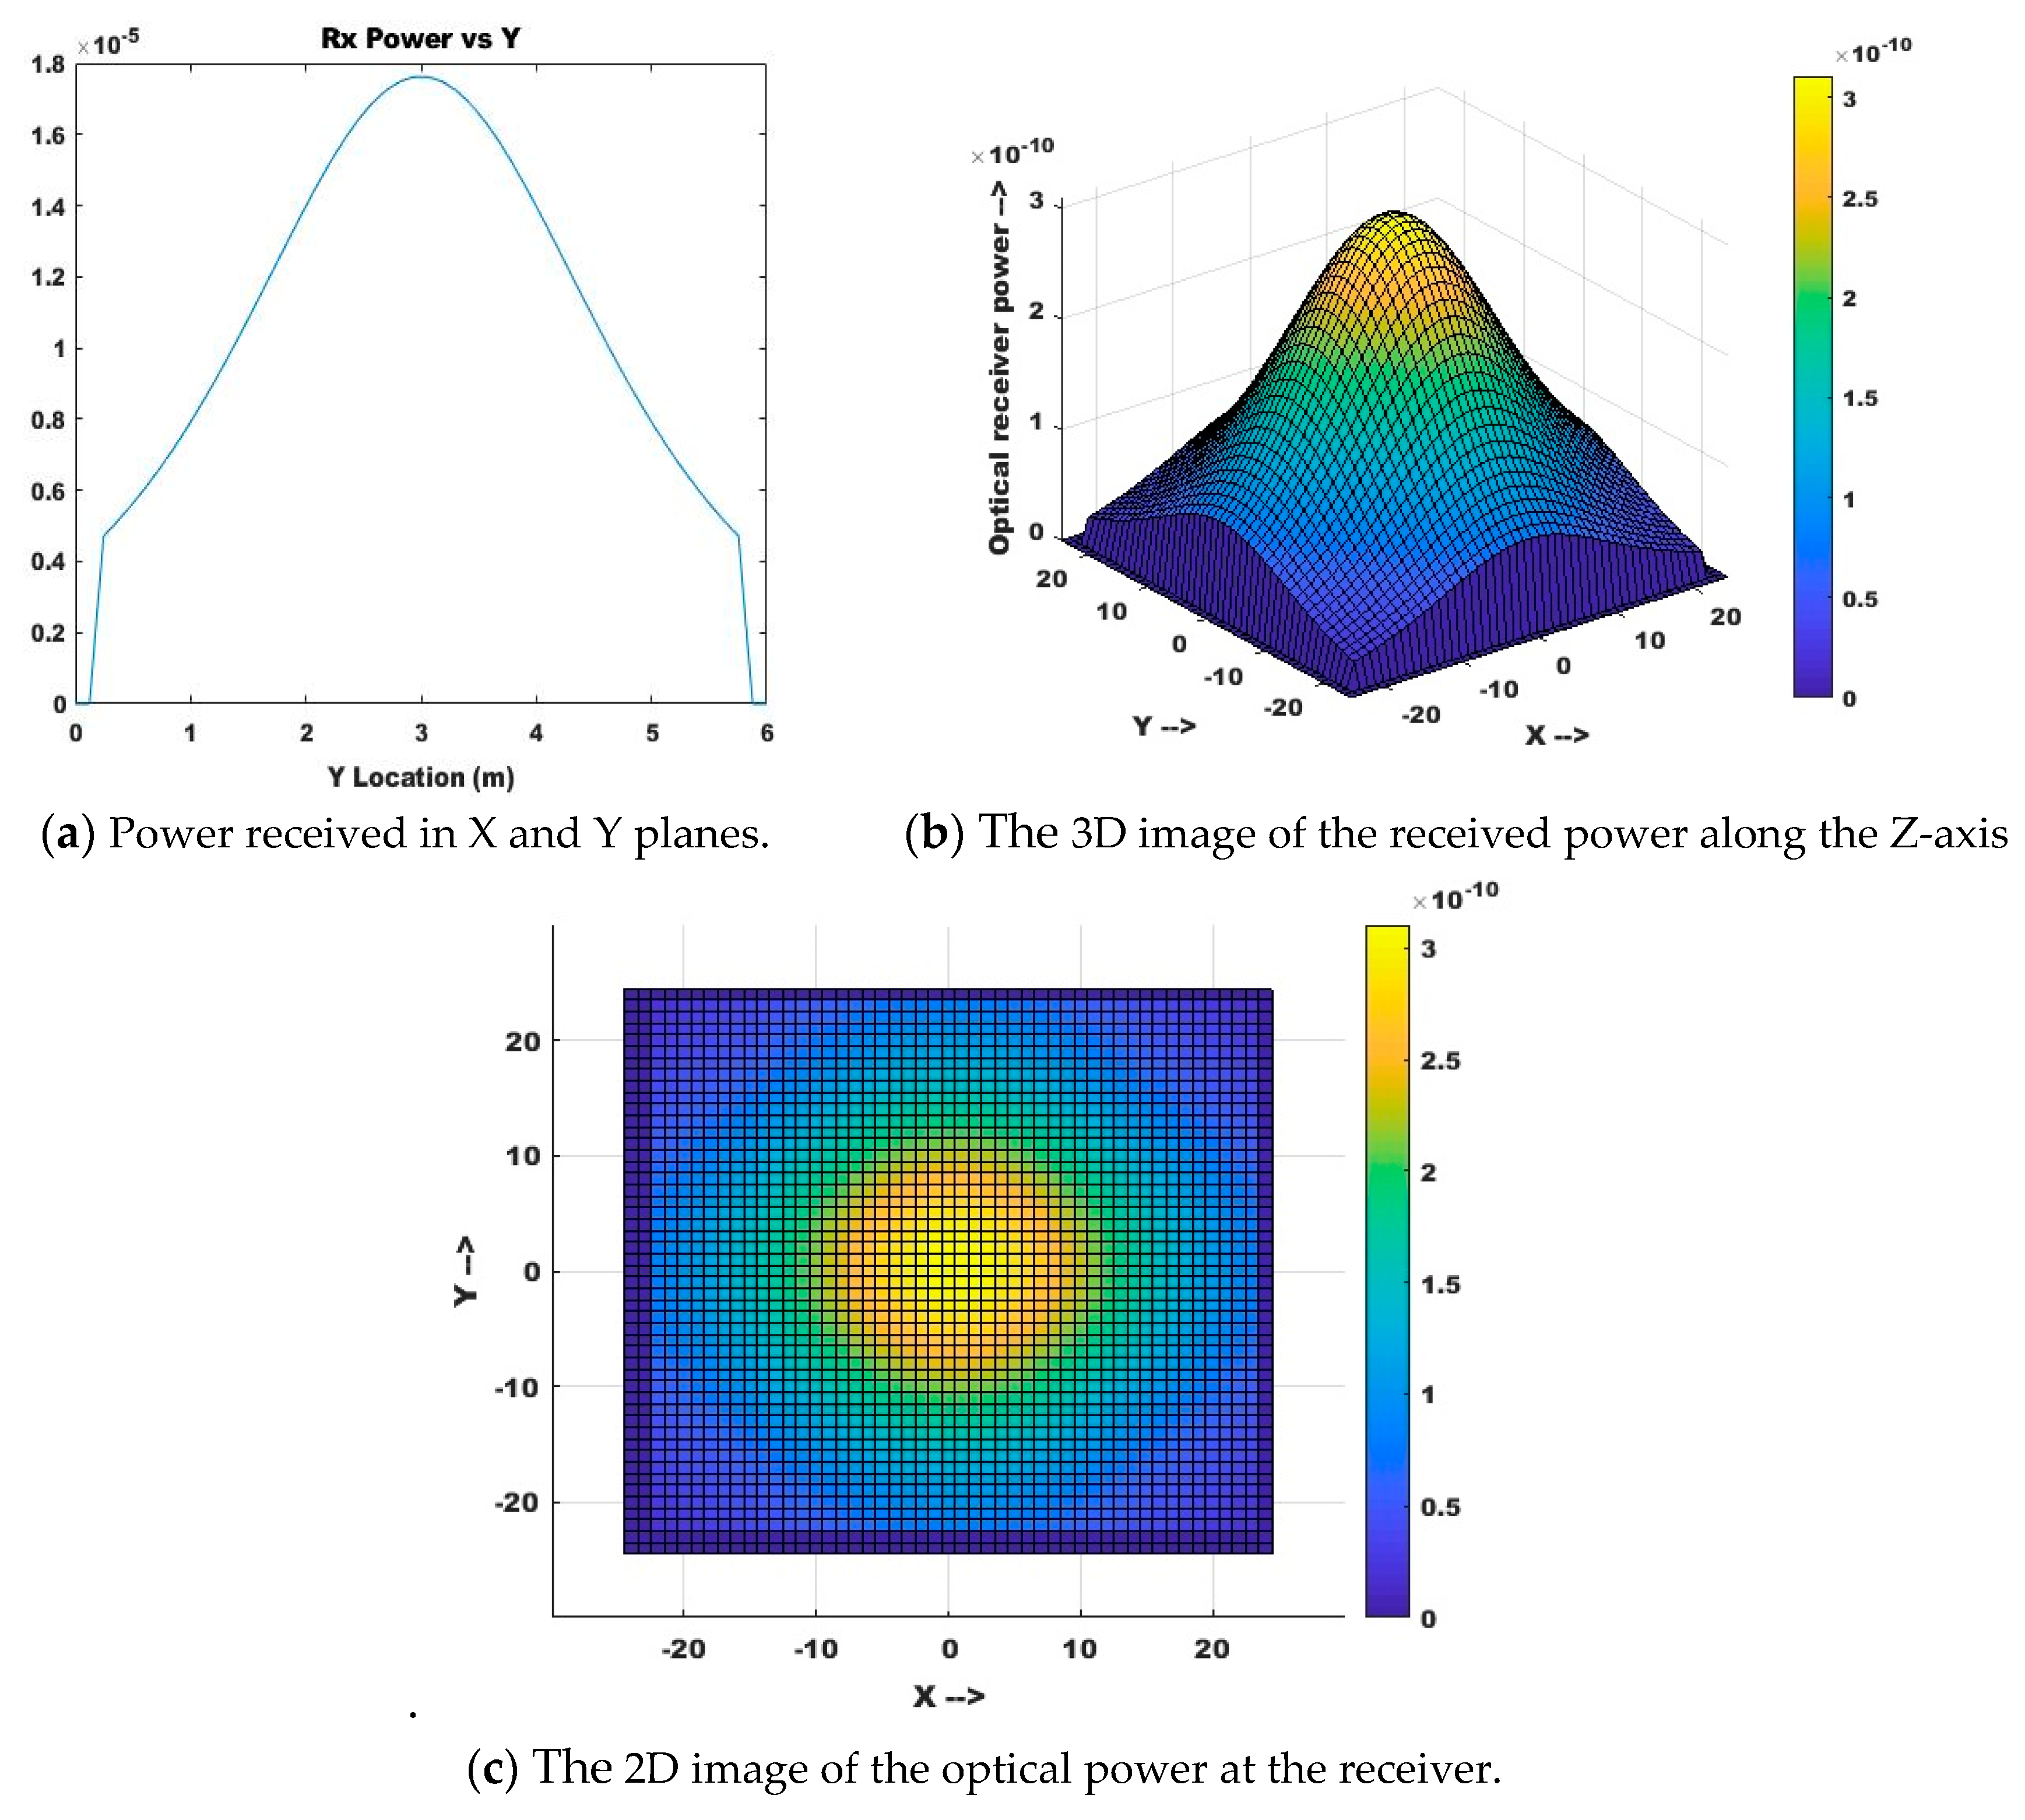
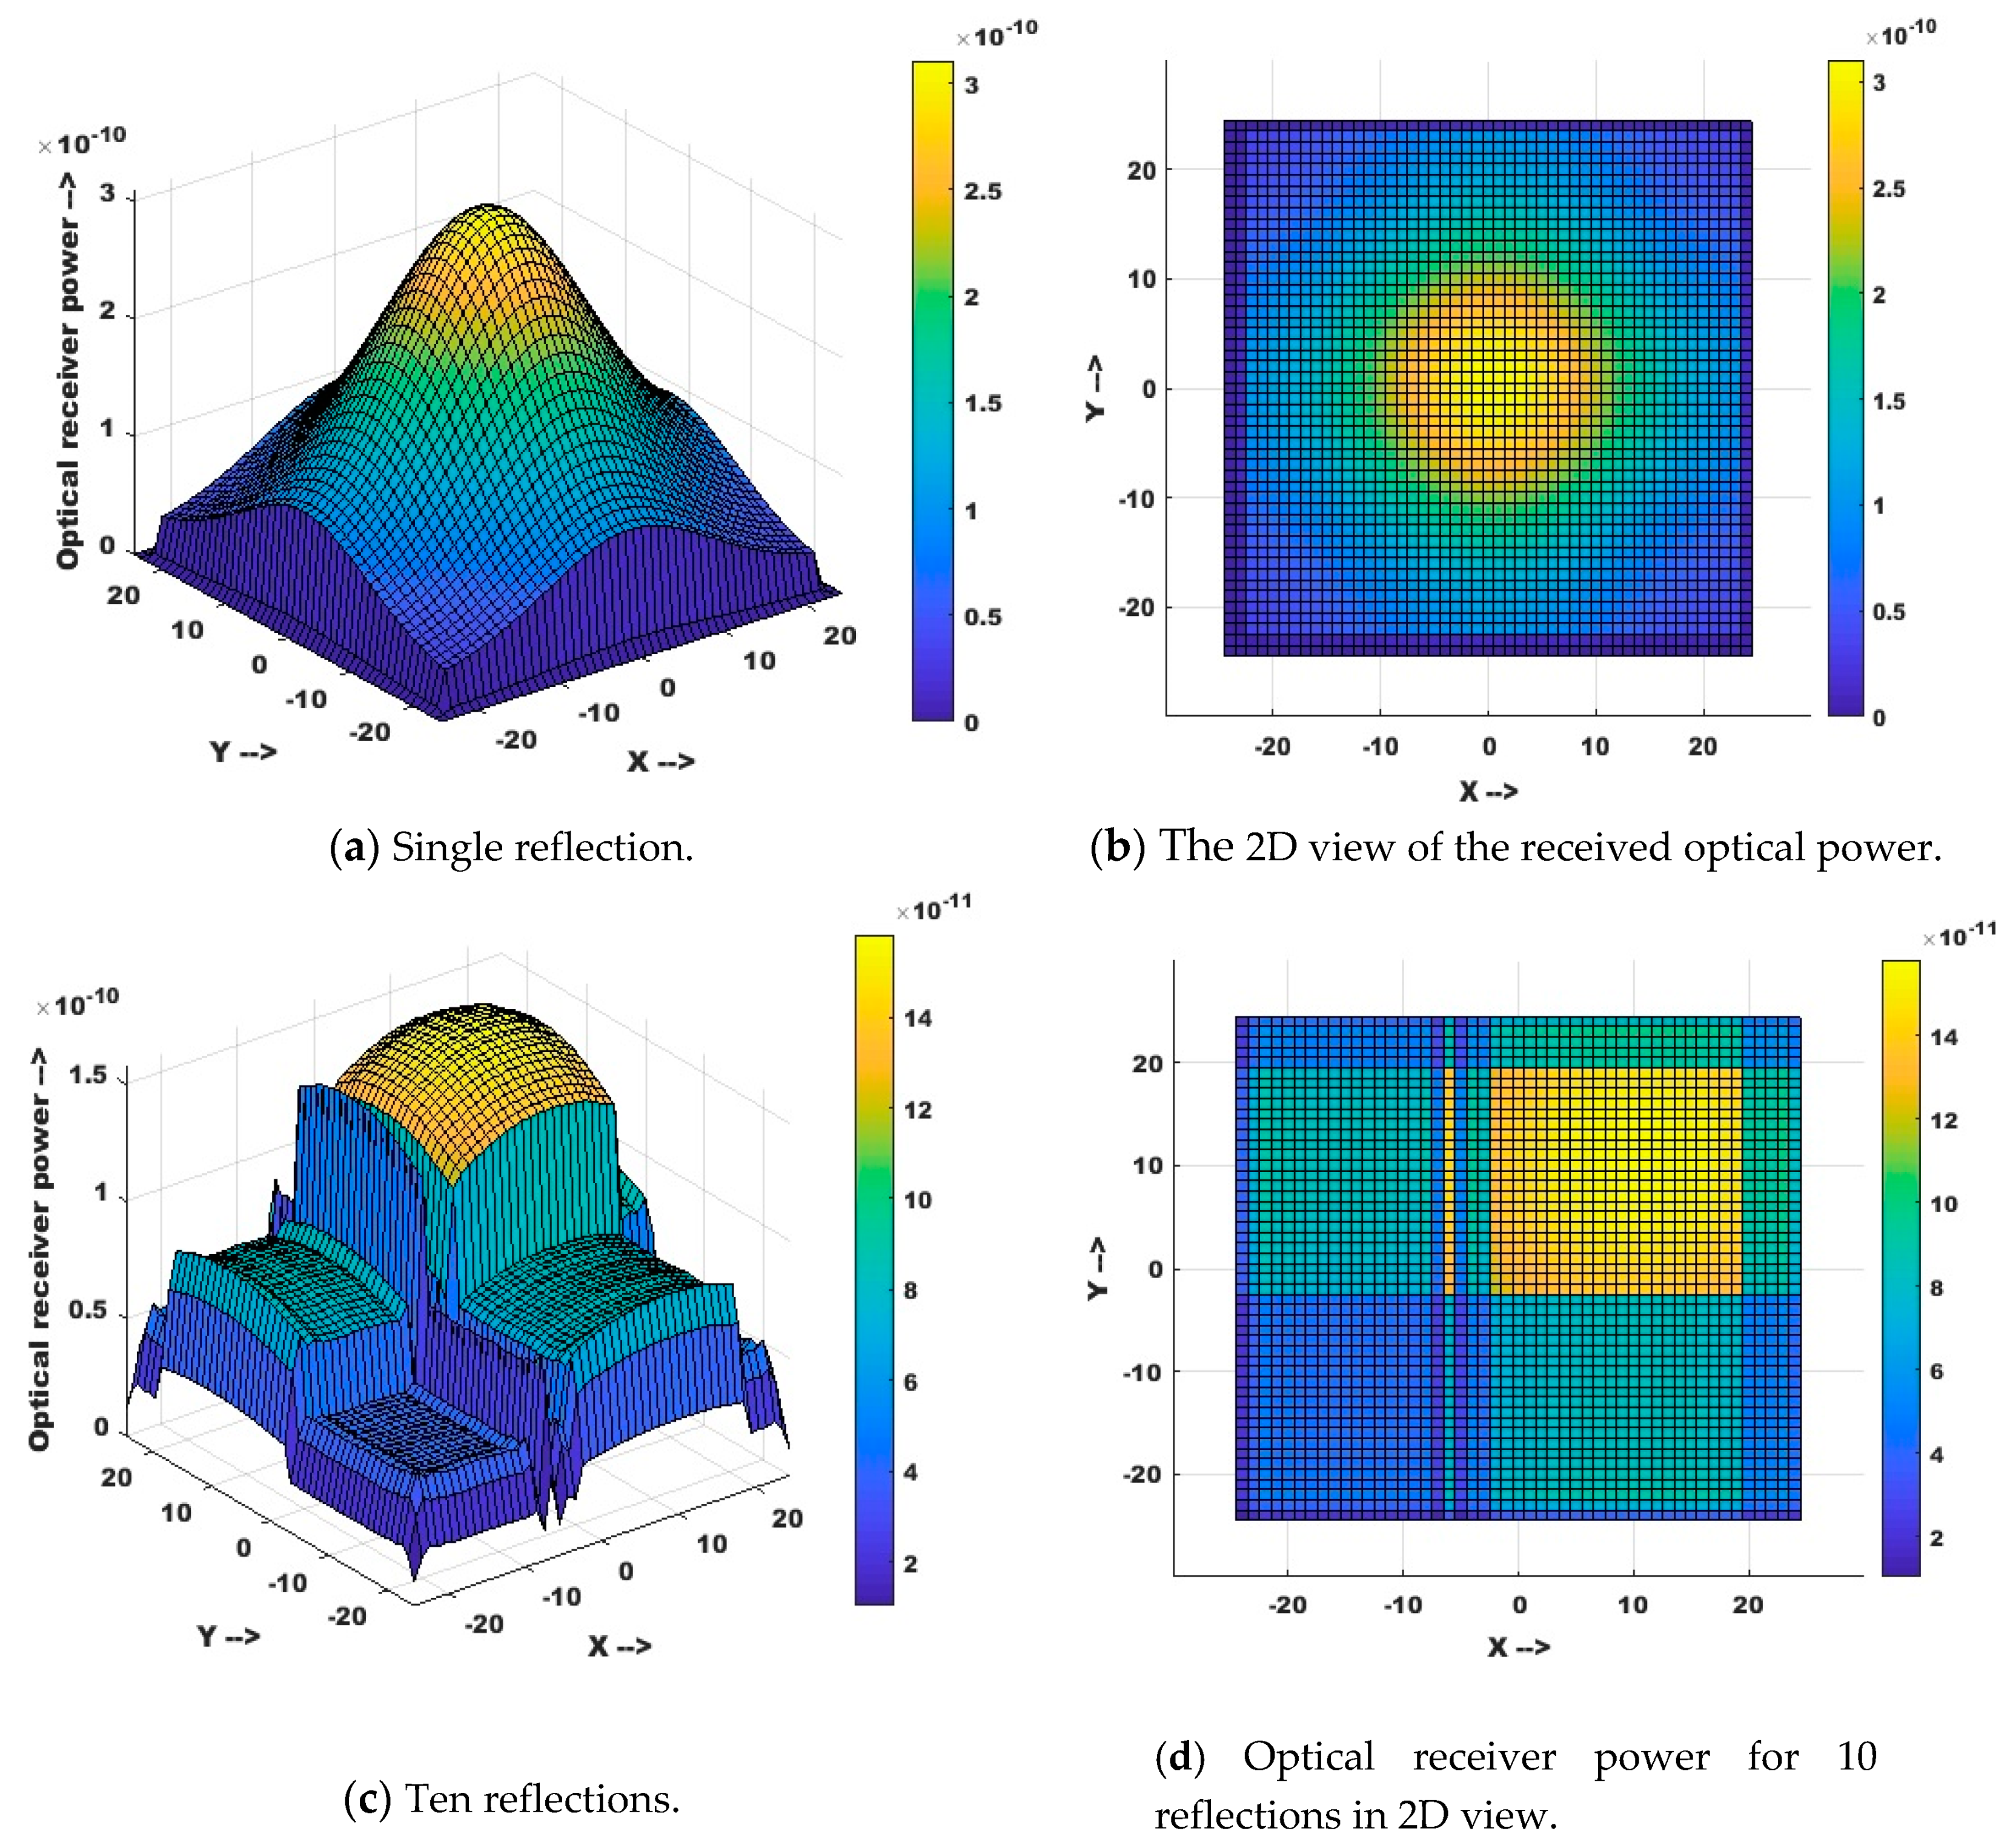
3. Power Measurement for Both LoS and NLoS Models
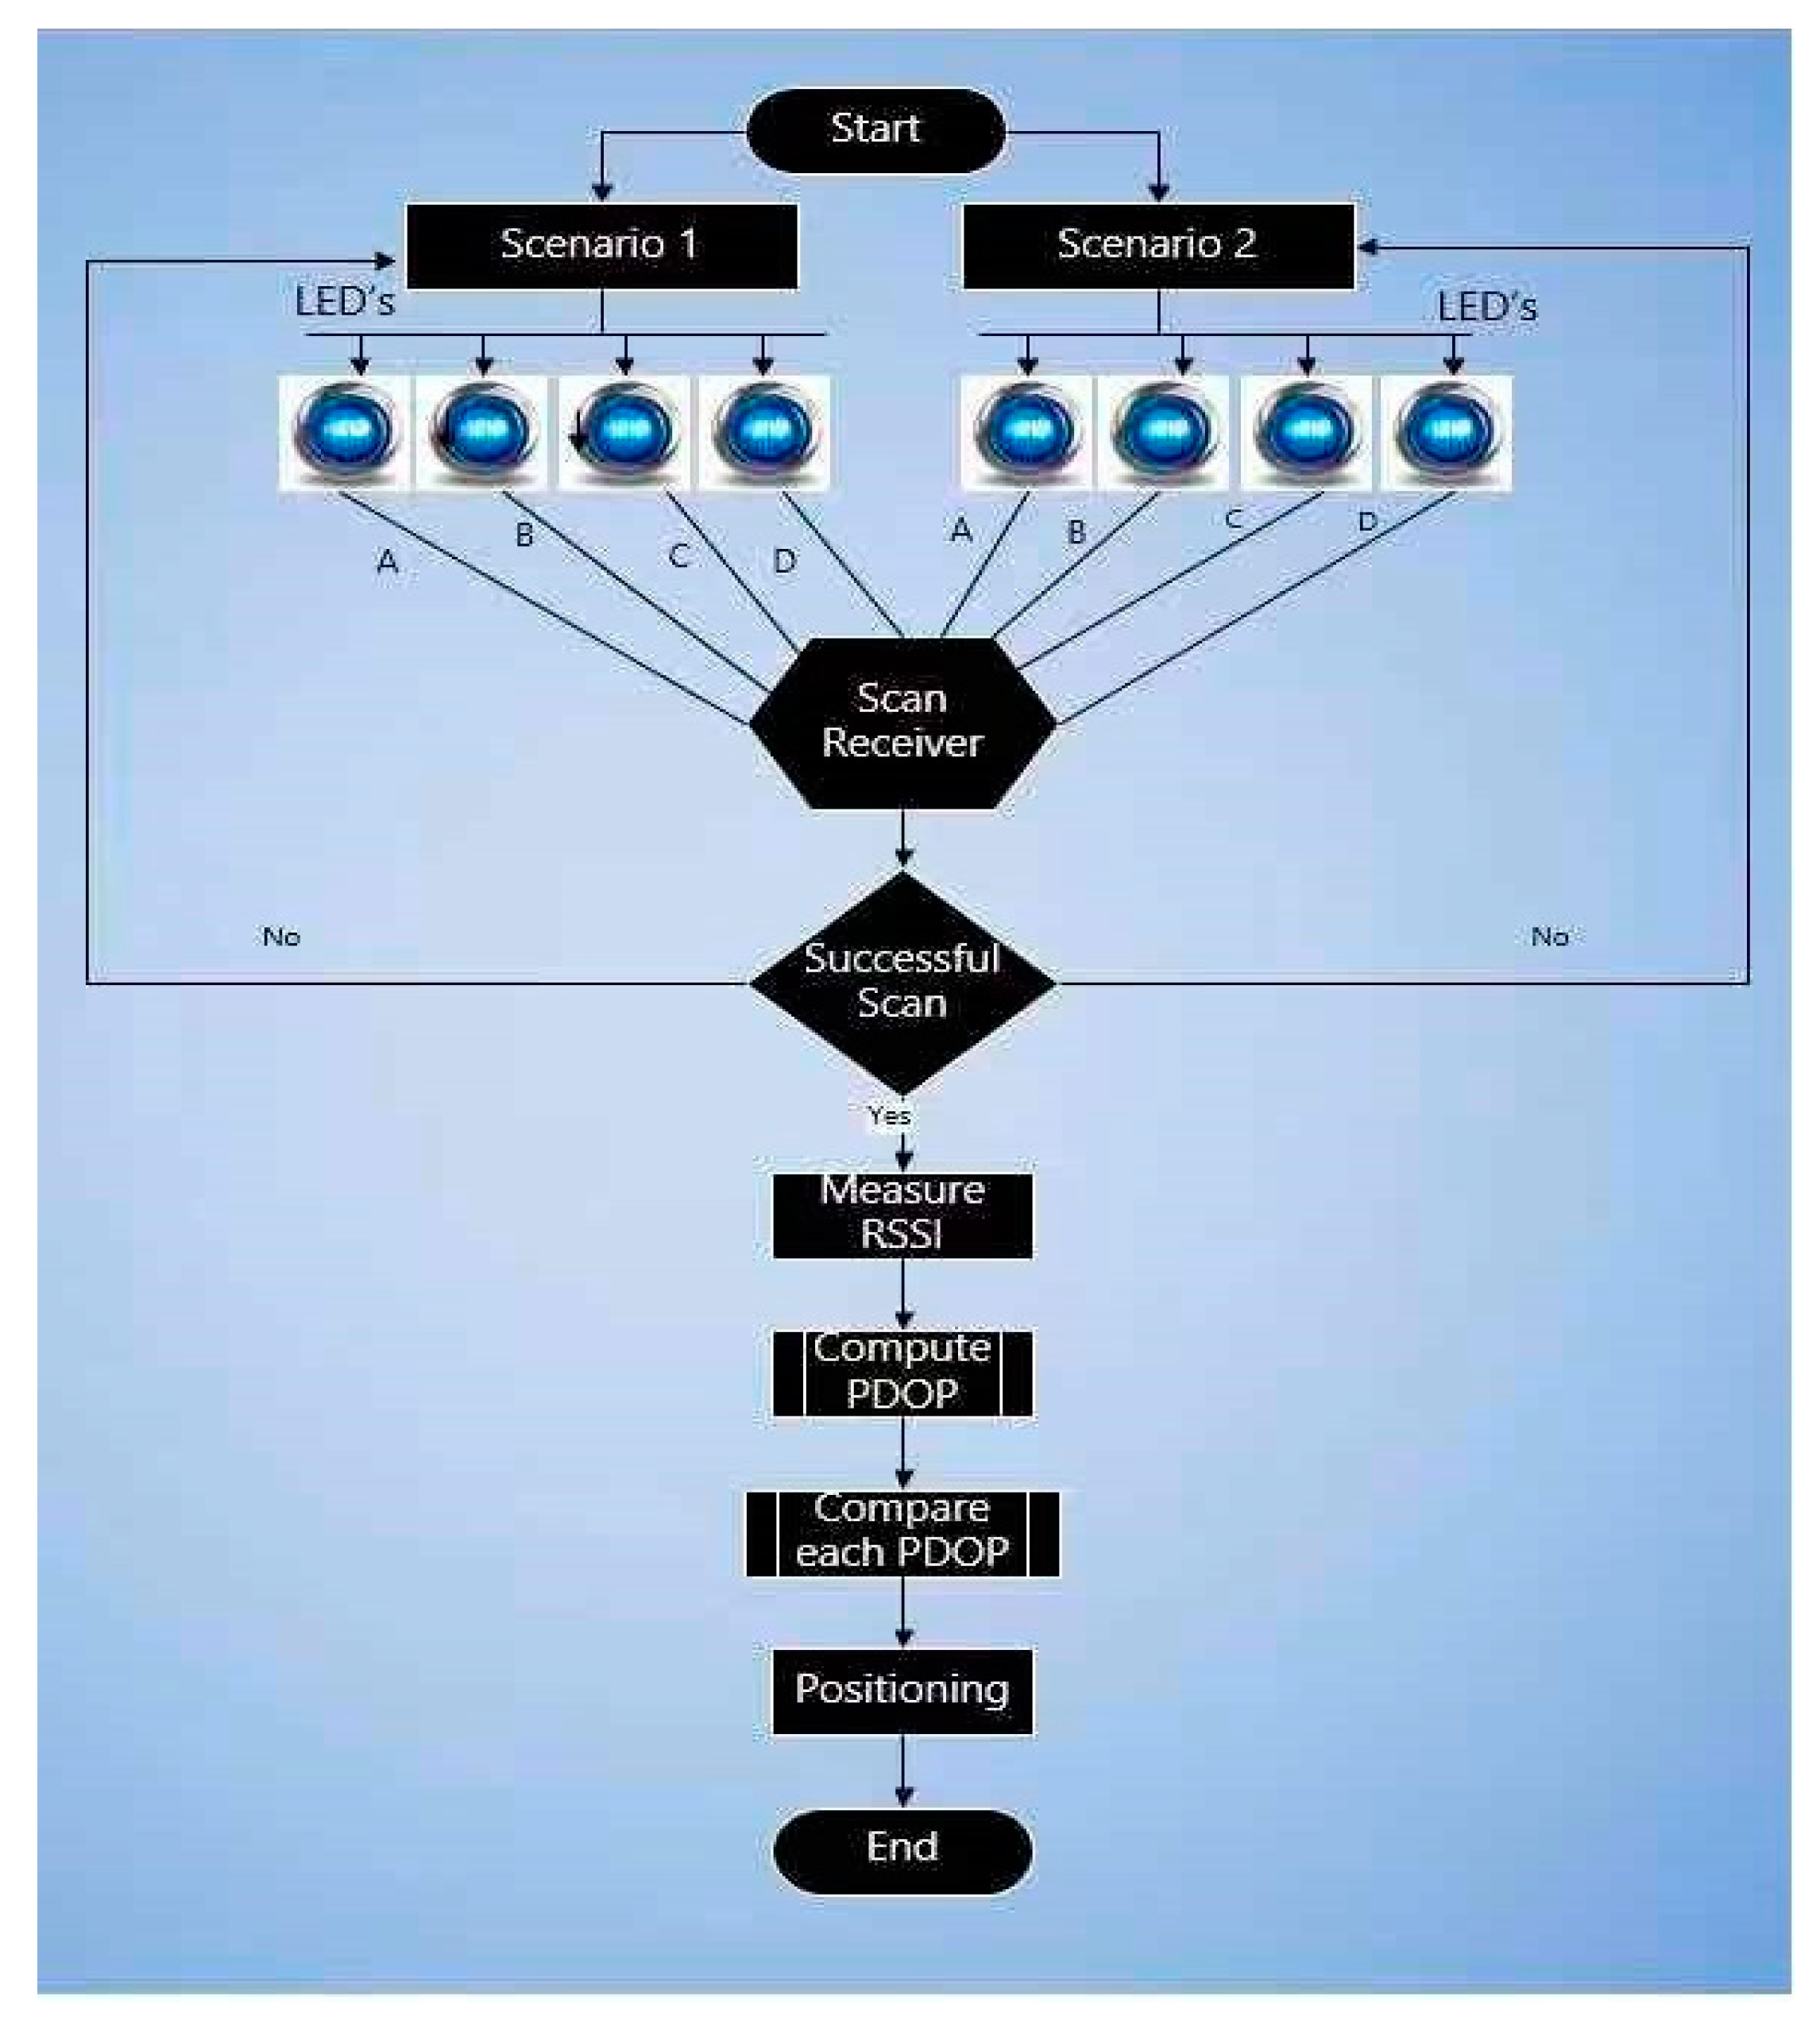
4. Adaptive Collaboration Positioning
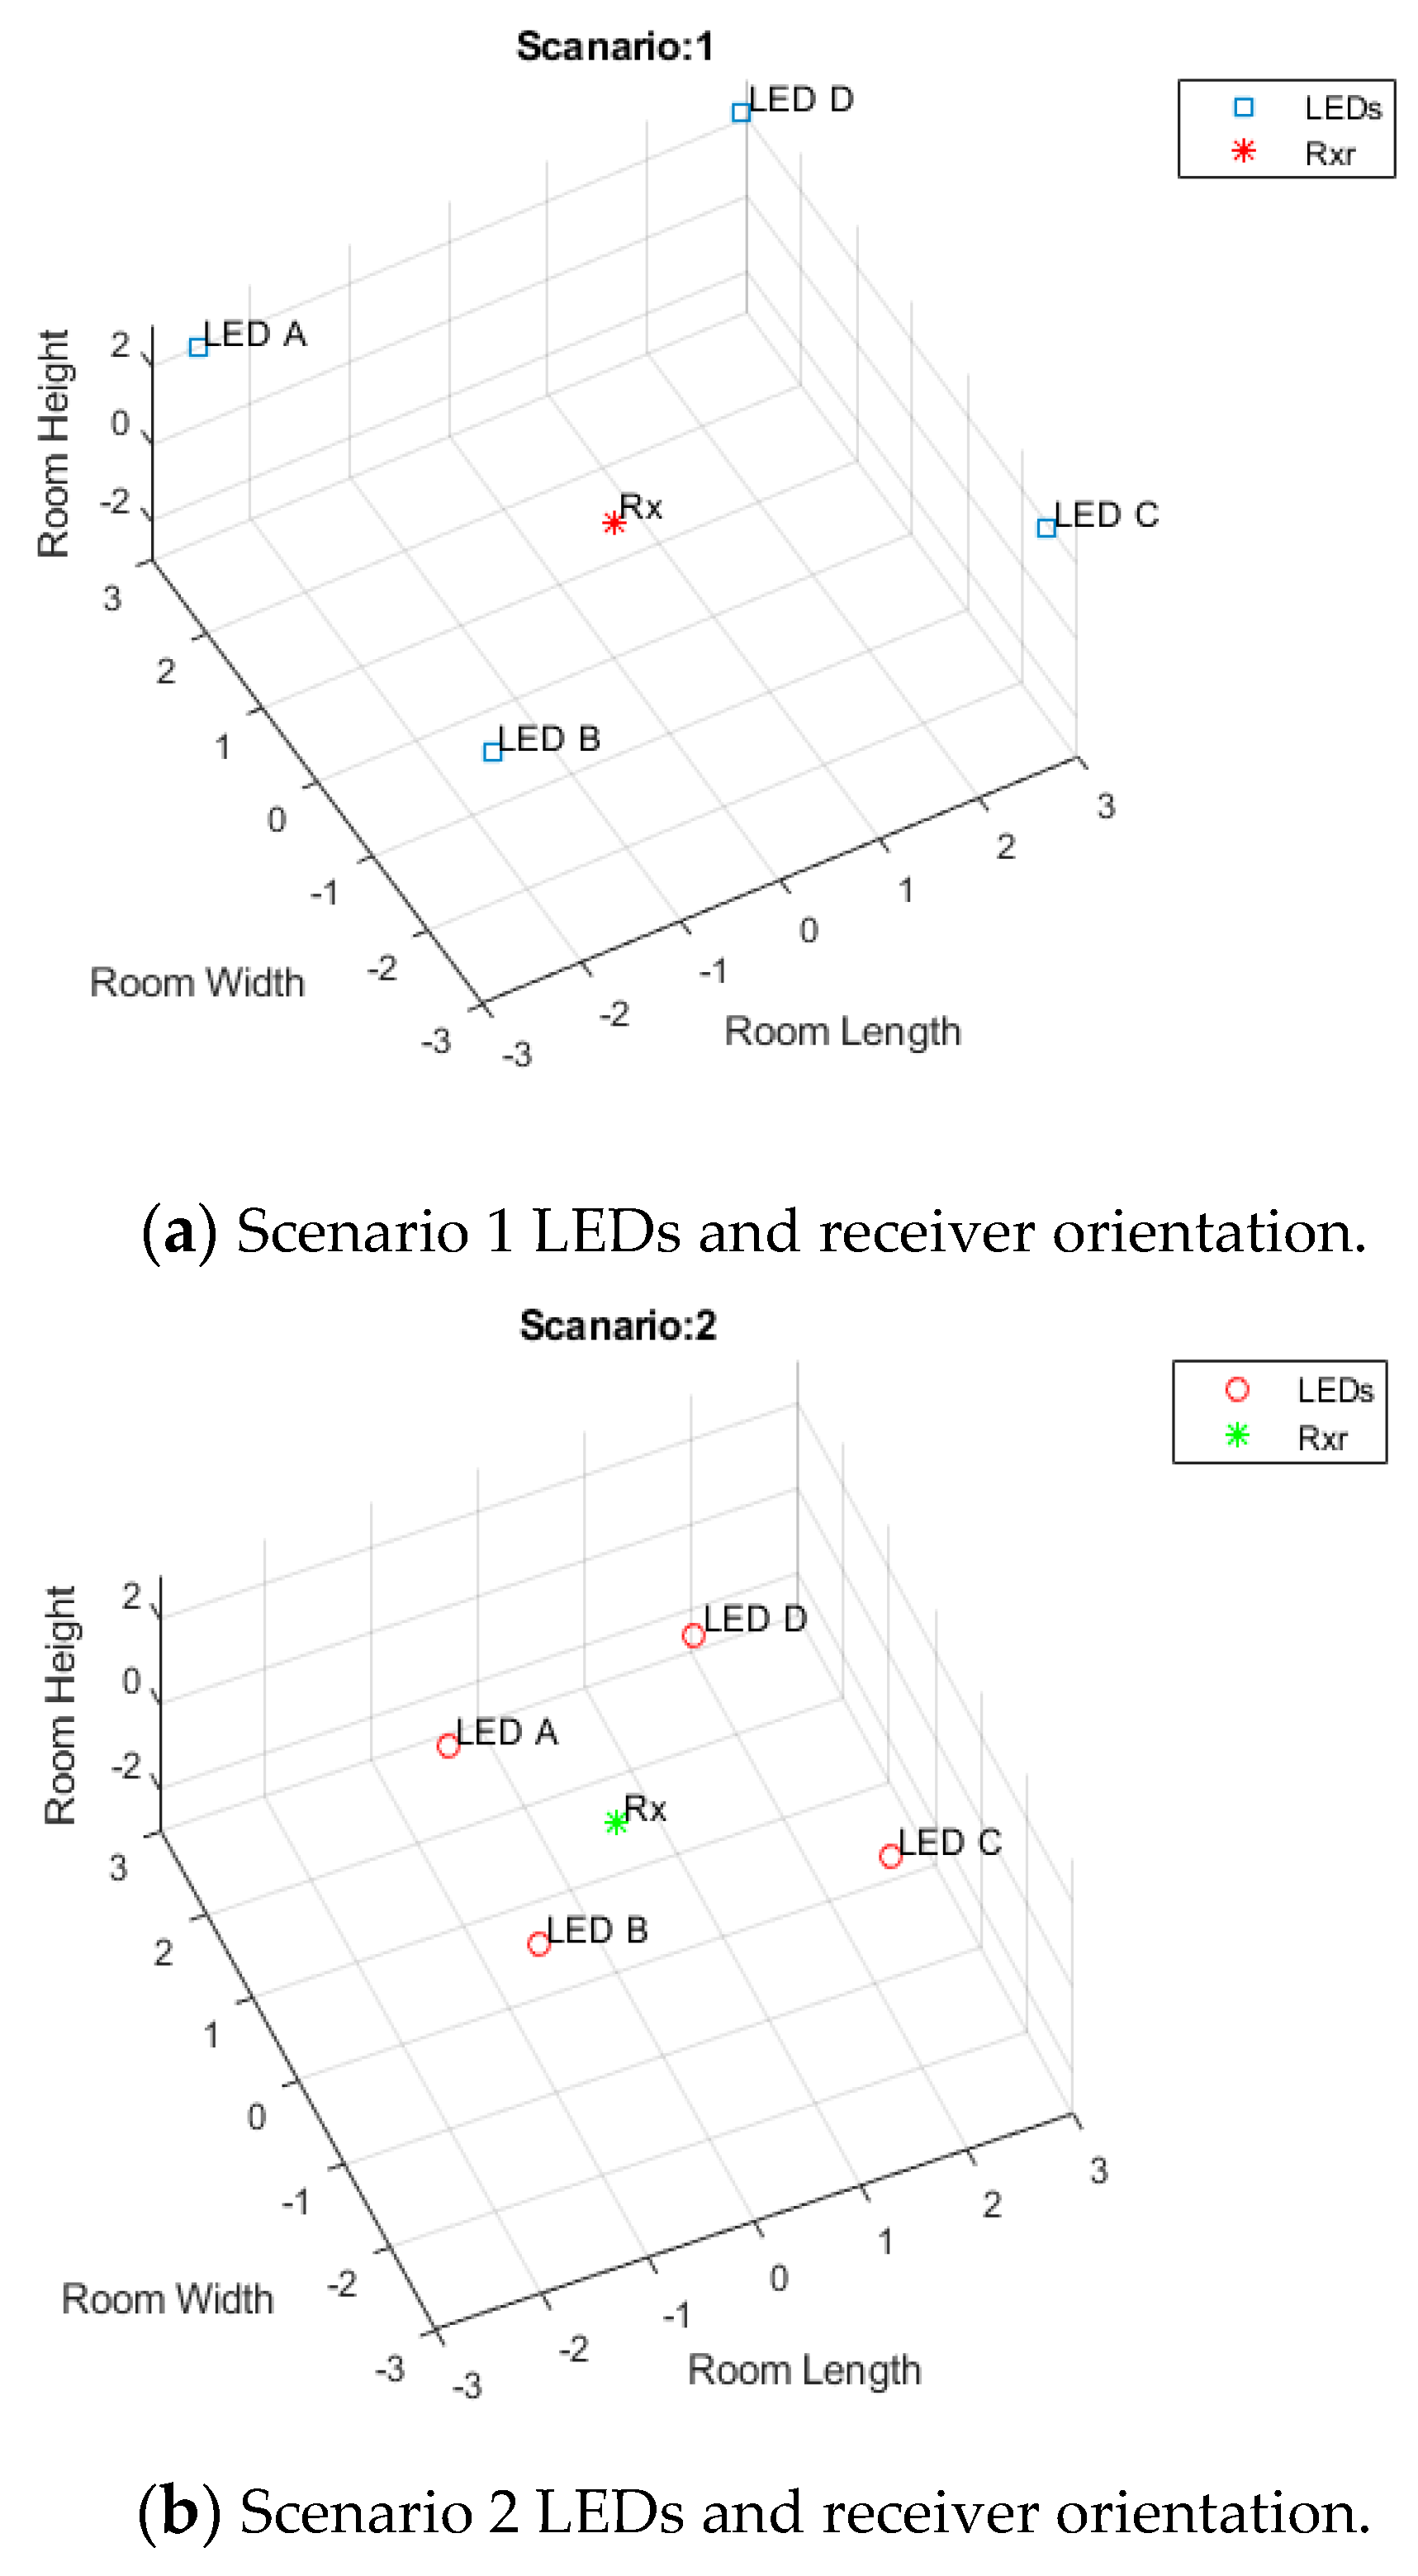
5. Simulation Setup, Results, and Discussion
6. Conclusions
Author Contributions
Funding
Acknowledgments
Conflicts of Interest
Appendix A
References
- Dilution of Precision in Angle-of-Arrival Positioning Systems—IET Journals & Magazine. 2006. Available online: https://ieeexplore.ieee.org/document/1604871 (accessed on 10 December 2018).
- Do, T.-H.; Yoo, M. An in-Depth Survey of Visible Light Communication Based Positioning Systems. Sensors 2016, 16, 678. [Google Scholar] [CrossRef] [PubMed]
- Irshad, M.; Liu, W.; Wang, L.; Shah, S.B.H.; Sohail, M.N.; Uba, M.M. Li-local: Green communication modulations for indoor localization. In Proceedings of the 2nd International Conference on Future Networks and Distributed Systems, Amman, Jordan, 26–27 June 2018; pp. 1–6. [Google Scholar]
- Seybold, K.S. Intorduction to RF Propagation; John Wiley & Sons: Hoboken, NJ, USA, 2005. [Google Scholar]
- Centenaro, M.; Vangelista, L.; Zanella, A.; Zorzi, M. Long-range communications in unlicensed bands: The rising stars in the IoT and smart city scenarios. IEEE Wirel. Commun. 2016, 23, 60–67. [Google Scholar] [CrossRef]
- Adame, T.; Bel, A.; Bellalta, B.; Barcelo, J.; Oliver, M. IEEE 802.11AH: The WiFi approach for M2M communications. IEEE Wirel. Commun. 2014, 21, 144–152. [Google Scholar] [CrossRef]
- Jiang, Y.; Pan, X.; Li, K.; Lv, Q.; Dick, R.P.; Hannigan, M.; Shang, L. Ariel: Automatic wi-fi based room fingerprinting for indoor localization. In Proceedings of the ACM Conference on Ubiquitous Computing, Pittsburgh, PA, USA, 5–8 September 2012. [Google Scholar]
- Kumar, S.; Gil, S.; Katabi, D.; Rus, D. Accurate indoor localization with zero start-up cost. In Proceedings of the 20th Annual International Conference on Mobile Computing and Networking, Maui, HI, USA, 7–11 September 2014. [Google Scholar]
- Liu, H.; Darabi, H.; Banerjee, P.; Liu, J. Survey of Wireless Indoor Positioning Techniques and Systems. IEEE Trans. Syst. Man Cybern. 2007, 37, 1067–1080. [Google Scholar] [CrossRef]
- Wang, X.; Gao, L.; Mao, S.; Pandey, S. CSI-based Fingerprinting for Indoor Localization: A Deep Learning Approach. IEEE Trans. Veh. Technol. 2016, 66, 763–776. [Google Scholar] [CrossRef]
- Gjengset, J.; Xiong, J.; McPhillips, G.; Jamieson, K. Phaser: Enabling phased array signal processing on commodity WiFi access points. In Proceedings of the 20th Annual International Conference on Mobile Computing and Networking, Maui, HI, USA, 7–11 September 2014. [Google Scholar]
- Hoang, M.K.; Haeb-Umbach, R. Parameter estimation and classification of censored Gaussian data with application to WiFi indoor positioning. In Proceedings of the IEEE International Conference on Acoustics, Speech and Signal Processing, Vancouver, BC, Canada, 26–31 May 2013. [Google Scholar]
- Kotaru, M.; Joshi, K.; Bharadia, D.; Katti, S. Spotfi: Decimeter Level Localization Using Wifi. In ACM SIGCOMM Computer Communication Review; ACM: New York, NY, USA, 2015. [Google Scholar]
- Arshad, J.; Younas, T.; Jiandong, L.; Suryani, A. Study on MU-MIMO Systems in the Perspective of Energy Efficiency with Linear Processing. In Proceedings of the 10th International Conference on Communication Software and Networks (ICCSN), Chengdu, China, 6–9 July 2018. [Google Scholar]
- Woo, S.; Jeong, S.; Mok, E.; Xia, L.; Choi, C.; Pyeon, M.; Heo, J. Application of WiFi-based indoor positioning system for labor tracking at construction sites: A case study in Guangzhou MTR. Autom. Constr. 2011, 20, 3–13. [Google Scholar] [CrossRef]
- Xiao, J.; Wu, K.; Yi, Y.; Wang, L.; Ni, L.M. Pilot: Passive device-free indoor localization using channel state information. In Proceedings of the IEEE 33rd International Conference on Distributed Computing Systems, Philadelphia, PA, USA, 8–11 July 2013. [Google Scholar]
- Xiong, J.; Jamieson, K. Arraytrack: A fine-grained indoor location system. In Proceedings of the 10th {USENIX} Symposium on Networked Systems Design and Implementation ({NSDI} 13), Lombord, IL, USA, 2–5 April 2013. [Google Scholar]
- Zou, H.; Jiang, H.; Lu, X.; Xie, L. An online sequential extreme learning machine approach to WiFi based indoor positioning. In Proceedings of the IEEE World Forum on Internet of Things (WF-IoT), Seoul, Korea, 6–8 March 2014. [Google Scholar]
- Bilal, M.M.; Bi, W.; Jaleel, F.; Luwen, Y.; Sohail, M.N.; Irshad, M. Magnetic fluid-based photonic crystal fiber for temperature sensing. Opt. Eng. 2019, 58, 072008. [Google Scholar] [CrossRef]
- Kang, W.; Nam, S.; Han, Y.; Lee, S. Improved heading estimation for smartphone-based indoor positioning systems. In Proceedings of the IEEE 23rd International Symposium on Personal, Indoor and Mobile Radio Communications (PIMRC), Sydney, Australia, 9–12 September 2012. [Google Scholar]
- Sohail, M.N.; Jiadong, R.; Uba, M.M.; Irshad, M.; Iqbal, W.; Arshad, J.; John, A.V. A hybrid Forecast Cost Benefit Classification of diabetes mellitus prevalence based on epidemiological study on Real-life patient’s data. Sci. Rep. 2019, 9, 10103. [Google Scholar] [CrossRef]
- Ding, G.; Tan, Z.; Wu, J.; Zeng, J.; Zhang, L. Indoor Fingerprinting Localization and Tracking System Using Particle Swarm Optimization and Kalman Filter. IEICE Trans. Commun. 2015, 98, 502–514. [Google Scholar] [CrossRef]
- Carrera, J.L.V.; Zhao, Z.; Braun, T.; Luo, H.; Zhao, F. Discriminative Learning-based Smartphone Indoor Localization. arXiv 2018, arXiv:1804.03961. [Google Scholar]
- Ridolfi, M.; Van de Velde, S.; Steendam, H.; De Poorter, E. WiFi ad-hoc mesh network and MAC protocol solution for UWB indoor localization systems. In Proceedings of the Symposium on Communications and Vehicular Technologies (SCVT), Mons, Belgium, 22 November 2016. [Google Scholar]
- Xi, R.; Liu, D.; Hou, M.; Li, Y.; Li, J. Using Acoustic Signal and Image to Achieve Accurate Indoor Localization. Sensors 2018, 18, 2566. [Google Scholar] [CrossRef] [PubMed]
- House, S.; Connell, S.; Milligan, L.; Austin, D.L.; Hayes, T.; Chiang, P. Indoor localization using pedestrian dead reckoning updated with RFID-based fiducials. In Proceedings of the 2011 Annual International Conference of the IEEE Engineering in Medicine and Biology Society, Boston, MA, USA, 1 December 2011. [Google Scholar]
- Islam, B.; Uddin, M.; Mukherjee, S.; Nirjon, S. Rethinking ranging of unmodified ble peripherals in smart city infrastructure. In Proceedings of the 9th ACM Multimedia Systems Conference, Amsterdam, The Netherlands, 12–15 June 2018. [Google Scholar]
- Buyukcorak, S.; Kurt, G.K. A Bayesian Perspective on RSS Based Localization for Visible Light Communication With Heterogeneous Networks Extension. IEEE Access 2017, 5, 17487–17500. [Google Scholar] [CrossRef]
- Irshad, M.; Liu, W.; Wang, L.; Khalil, M.U.R. Cogent Machine Learning Algorithm for Indoor and Underwater Localization Using Visible Light Spectrum. Wirel. Pers. Commun. 2019. [Google Scholar] [CrossRef]
- Nguyen, H.Q.; Choi, J.H.; Kang, T.G.; Lim, S.K.; Kim, D.H.; Kang, M.; Lee, C.G. Effect of LED emission cross-section in indoor visible light communication systems. EURASIP J. Wirel. Commun. Netw. 2012, 1, 286. [Google Scholar] [CrossRef]
- Ayyalasomayajula, R.; Vasisht, D.; Bharadia, D. BLoc: CSI-based accurate localization for BLE tags. In Proceedings of the 14th International Conference on emerging Networking EXperiments and Technologies, Heraklion, Greece, 4–7 December 2018. [Google Scholar]
- Shawky, S.; El-Shimy, M.A.; El-Sahn, Z.A.; Rizk, M.R.M.; Aly, M.H. Simple and highly accurate indoor visible light positioning system: Regression- and interpolation-based approaches. Opt. Eng. 2019, 58, 055101. [Google Scholar]
- Groves, P.D.; Jiang, Z.; Rudi, M.; Strode, P. A Portfolio Approach to NLOS and Multipath Mitigation in Dense Urban Areas. In Proceedings of the 26th International Technical Meeting of the Satellite Division of The Institute of Navigation (ION GNSS+ 2013), Nashville, TN, USA, 16–19 September 2013; pp. 3231–3247. [Google Scholar]
- Langley, R.B. Dilution of precision. GPS World 1999, 10, 52–59. [Google Scholar]
- Huang, B.; Yao, Z.; Cui, X.; Lu, M. Angle-of-arrival assisted GNSS collaborative positioning. Sensors 2016, 16, 918. [Google Scholar] [CrossRef]
- Applying Geometric Dilution Of Precision Approximation To Adaptive Neural Network Learning For Precise Mobile Station Positioning—IEEE Conference Publication. 2018. Available online: https://ieeexplore.ieee.org/document/8526984 (accessed on 7 March 2019).
- Analytical Solutions for Passive Source Positioning and Geometric Dilution of Precision—IEEE Conference Publication. 2015. Available online: https://ieeexplore.ieee.org/abstract/document/7279697 (accessed on 5 March 2019).
- Zirari, S.; Canalda, P.; Spies, F. Geometric and signal strength dilution of precision (dop) wi-fi. arXiv 2009, arXiv:0909.2377. [Google Scholar]
- Rodríguez, S.P.; Jiménez, R.P.; Mendoza, B.R. Simulation of impulse response for indoor visible light communications using 3D CAD models. EURASIP J. Wirel. Commun. Netw. 2013, 1, 7. [Google Scholar] [CrossRef]
- Zafari, F.; Gkelias, A.; Leung, K.K. A Survey of Indoor Localization Systems and Technologies. IEEE Commun. Surv. Tutor. 2019, 21, 2568–2599. [Google Scholar] [CrossRef]
- Rahaim, M.B.; Borogovac, T.; Carruthers, J.B. CandlES: Communication and lighting emulation software. In Proceedings of the Fifth ACM International Workshop on Wireless Network Testbeds, Experimental Evaluation and Characterization, Chicago, IL, USA, 20 September 2010; pp. 9–14. [Google Scholar]
- Gu, W.; Aminikashani, M.; Deng, P.; Kavehrad, M. Impact of Multipath Reflections on the Performance of Indoor Visible Light Positioning Systems. J. Light. Technol. 2016, 34, 2578–2587. [Google Scholar] [CrossRef]
- Ghassemlooy, Z.; Popoola, W.; Rajbhandari, S. Optical Wireless Communications, 1st ed.; CRC Press: Boca Raton, FL, USA, 2017. [Google Scholar]
- Kumar, S.; Hegde, R.M. Indoor node localization using geometric dilution of precision in ad-hoc sensor networks. In Proceedings of the 48th Asilomar Conference on Signals, Systems and Computers, Pacific Grove, CA, USA, 2–5 November 2014. [Google Scholar]
- Zou, C.; Kim, A.; Hwang, J.; Park, J. Enhanced Positioning Method Using WLAN RSSI Measurements Considering Dilution of Precision of AP Configuration. In Proceedings of the ICSNC: The Seventh International Conference on Systems and Networks Communications, Lisbon, Portugal, 18–23 November 2012. [Google Scholar]
- Schroeder, J.; Galler, S.; Kyamakya, K.; Jobmann, K. Practical considerations of optimal three-dimensional indoor localization. In Proceedings of the IEEE International Conference on Multisensor Fusion and Integration for Intelligent Systems, Heidelberg, Germany, 3–6 September 2006. [Google Scholar]

| Parameters | Values |
|---|---|
| Room Size | 6 m × 6 m × 6 m |
| Reflectance (ρ) of ceiling | 0.35 |
| Reflectance (ρ) of wall | 0.8 |
| Reflectance (ρ) of floor | 0.60 |
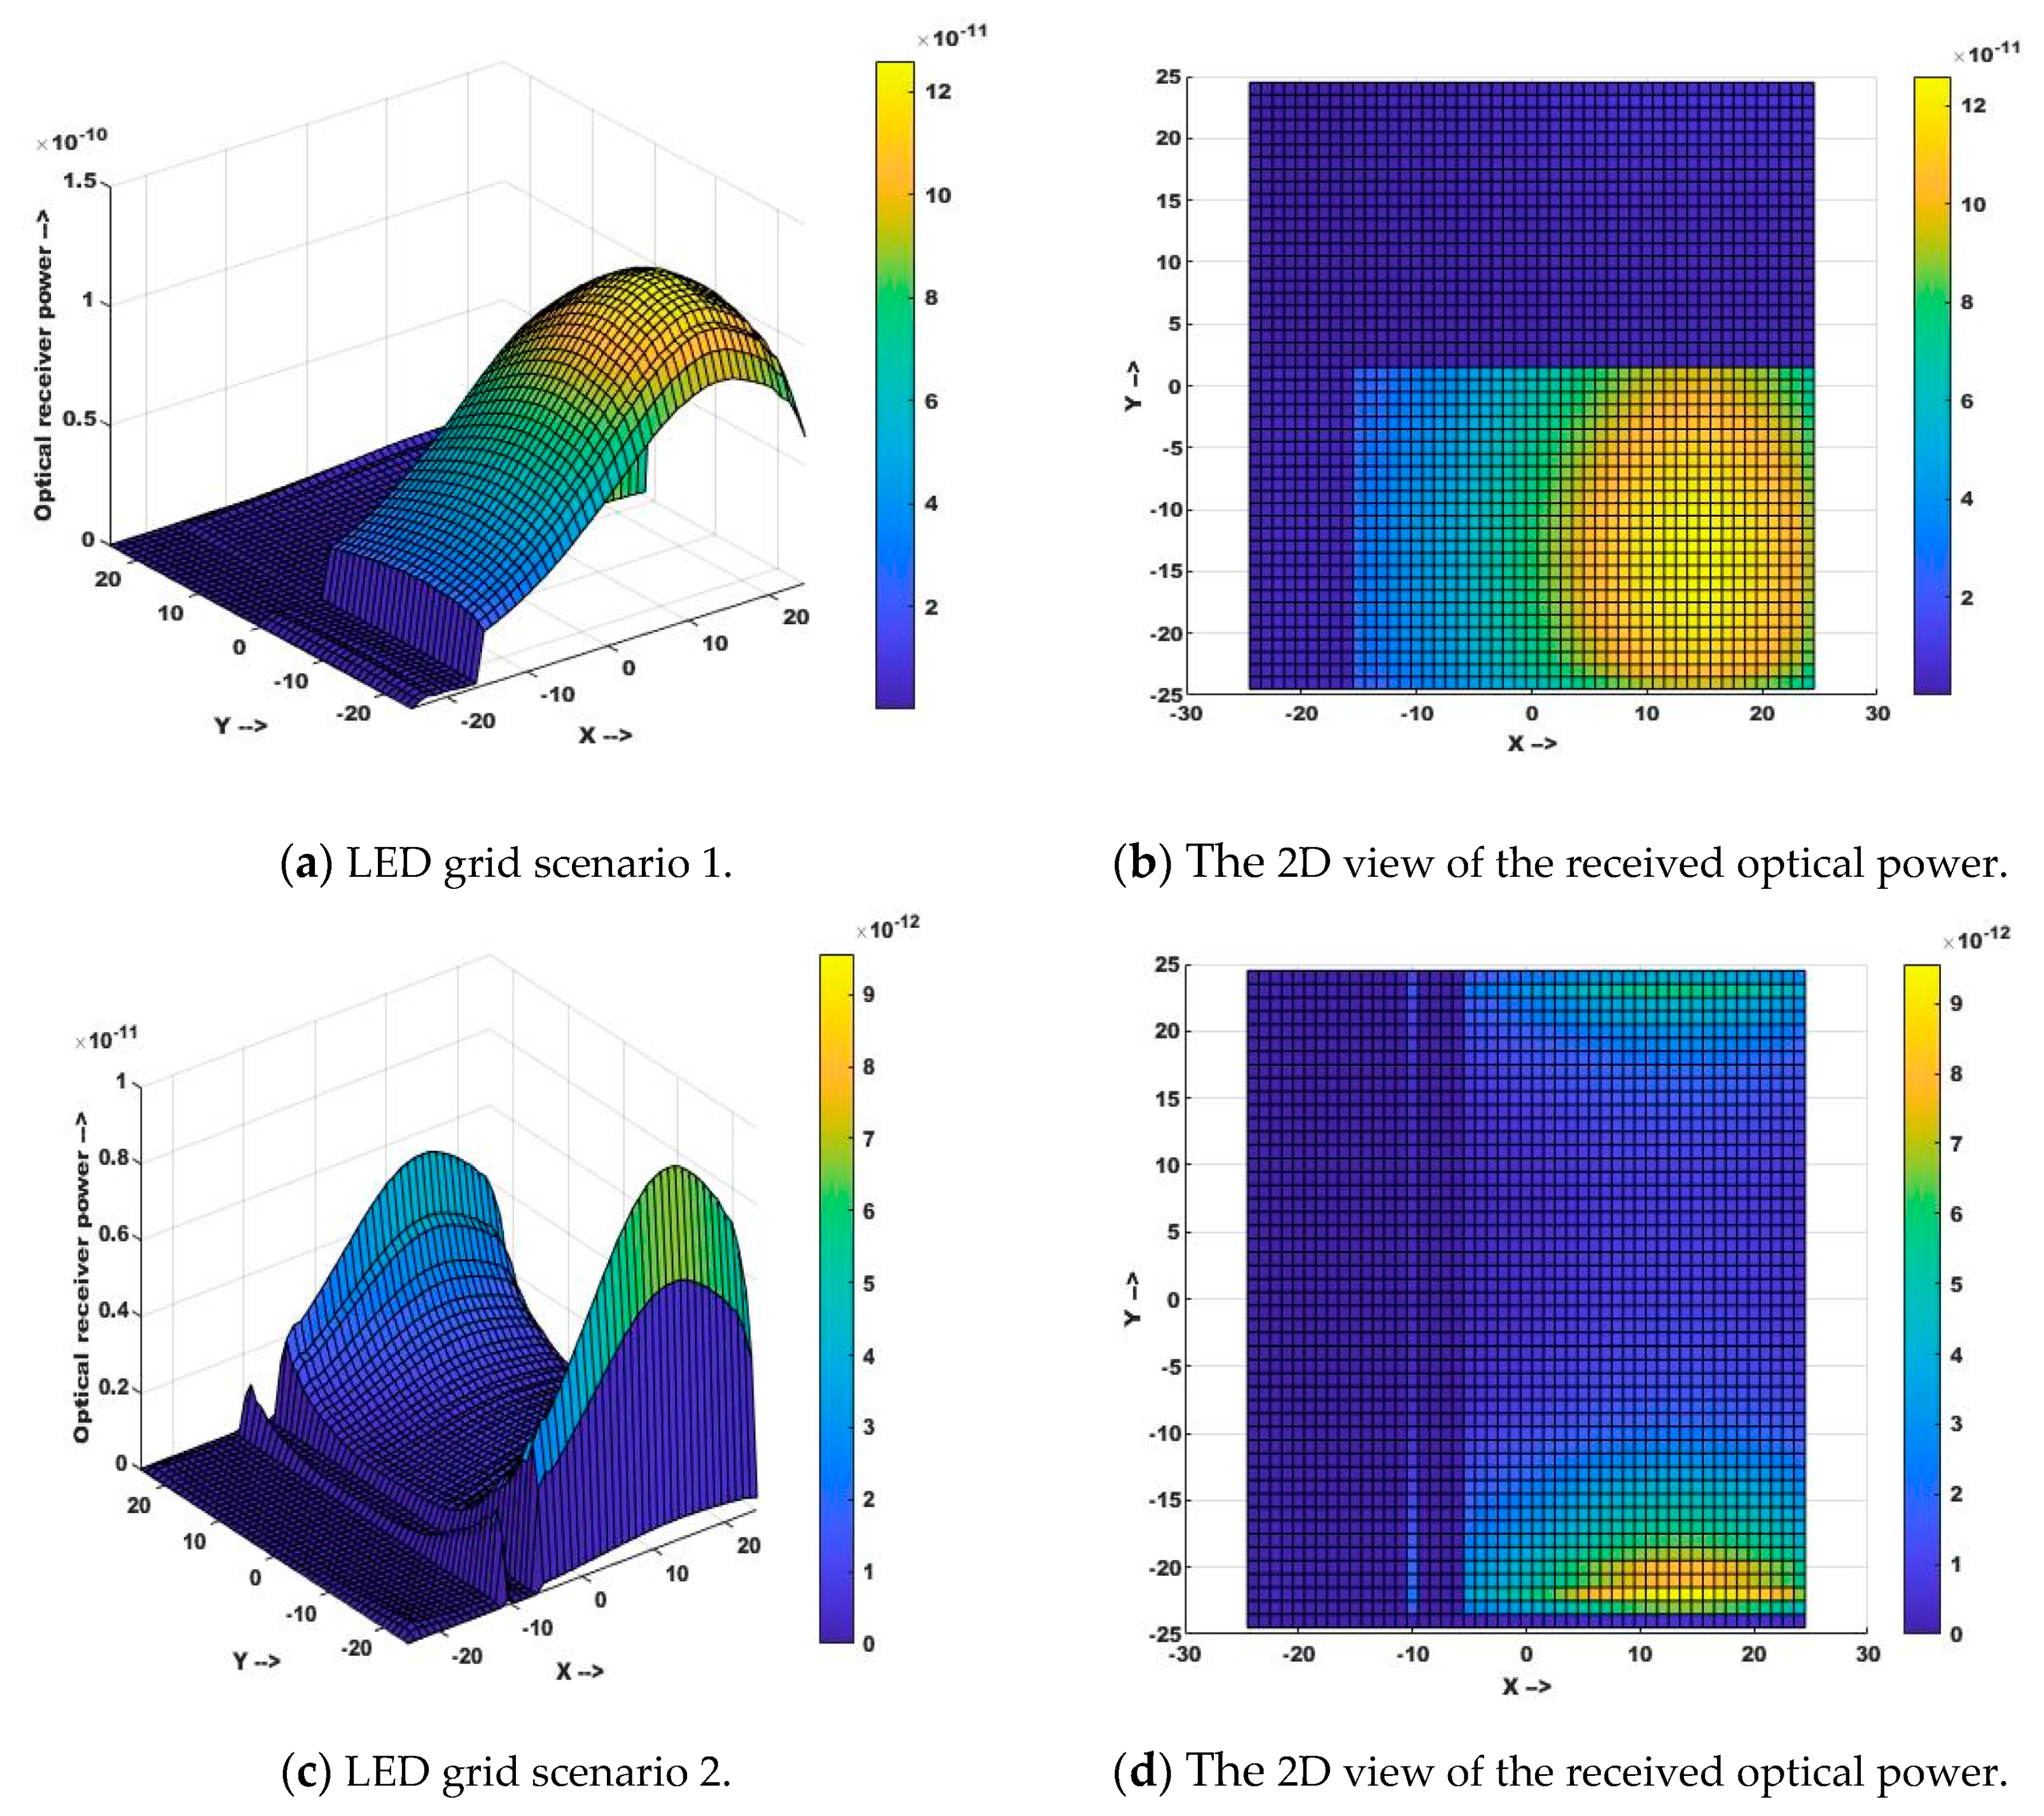
| Coordinates of LED Sources for Scenario 1 | A (0,0,6), B (6,0,6) C (0,6,6), D (6,6,6,) |
| Coordinates of LED Sources for Scenario 2 | A (2,2,6), B (4,2,6) C (0,6,6), D (6,6,6) |
| Transmitted power | 16 w |
| Center luminous flux | 300 lm |
| Height of LED source | 5.15 m |
| Receiver detection area | 100 m2 |
| Height of receiver | 0.085 m |
| FOV of receiver | 70° |
| Elevation of receiver | 90° |
| Parameters | LED-A | LED-B | LED-C | LED-D |
|---|---|---|---|---|
| SSE | 0 | 0.3492 | 0.1845 | 0.2814 |
| t | −2.4217 | −1.6456 | 0.8489 | 2.5946 |
| p | 0.0193 | 0.1064 | 0.4002 | 0.0125 |
| RMSE | 1.4054 × 10⁻⁶ |
| Parameters | LED-A | LED-B | LED-C | LED-D |
|---|---|---|---|---|
| SSE | 0 | 126.4352 | 0.0646 | 168.92 |
| t | −1.3585 | −2.3785 | 17.8397 | 2.3303 |
| p | 0.1807 | 0.0214 | 0 | 0.024 |
| RMSE | 1.13 × 10⁻⁶ |
| Evaluation of Frame Work | |||||
|---|---|---|---|---|---|
| References | DoP (Indoor Positioning) | Cost | Availability | Energy Efficiency | Complexity |
| [44] | GDoP | High | Low | Low | High |
| [45] | DoP | Moderate | High | Low | High |
| [46] | HDoP, VDoP | High | Low | Moderate | Moderate |
| This work | PDoP | Low | Moderate | High | Low |
© 2019 by the authors. Licensee MDPI, Basel, Switzerland. This article is an open access article distributed under the terms and conditions of the Creative Commons Attribution (CC BY) license (http://creativecommons.org/licenses/by/4.0/).
Share and Cite
Irshad, M.; Liu, W.; Arshad, J.; Sohail, M.N.; Murthy, A.; Khokhar, M.; Uba, M.M. A Novel Localization Technique Using Luminous Flux. Appl. Sci. 2019, 9, 5027. https://doi.org/10.3390/app9235027
Irshad M, Liu W, Arshad J, Sohail MN, Murthy A, Khokhar M, Uba MM. A Novel Localization Technique Using Luminous Flux. Applied Sciences. 2019; 9(23):5027. https://doi.org/10.3390/app9235027
Chicago/Turabian StyleIrshad, Muhammad, Wenyuan Liu, Jehangir Arshad, M. Noman Sohail, Aparna Murthy, Maryam Khokhar, and M Musa Uba. 2019. "A Novel Localization Technique Using Luminous Flux" Applied Sciences 9, no. 23: 5027. https://doi.org/10.3390/app9235027
APA StyleIrshad, M., Liu, W., Arshad, J., Sohail, M. N., Murthy, A., Khokhar, M., & Uba, M. M. (2019). A Novel Localization Technique Using Luminous Flux. Applied Sciences, 9(23), 5027. https://doi.org/10.3390/app9235027