Article

WiFi-Based Gesture Recognition for Vehicular Infotainment System—An Integrated Approach

Faculty of Electronic Information and Electrical Engineering, Dalian University of Technology, Dalian 116023, China
*
Author to whom correspondence should be addressed.
Appl. Sci. 2019, 9(24), 5268; https://doi.org/10.3390/app9245268
Submission received: 10 November 2019 / Revised: 26 November 2019 / Accepted: 29 November 2019 / Published: 4 December 2019
(This article belongs to the Special Issue Indoor Localization Systems: Latest Advances and Prospects)

Abstract

:
In the realm of intelligent vehicles, gestures can be characterized for promoting automotive interfaces to control in-vehicle functions without diverting the driver’s visual attention from the road. Driver gesture recognition has gained more attention in advanced vehicular technology because of its substantial safety benefits. This research work demonstrates a novel WiFi-based device-free approach for driver gestures recognition for automotive interface to control secondary systems in a vehicle. Our proposed wireless model can recognize human gestures very accurately for the application of in-vehicle infotainment systems, leveraging Channel State Information (CSI). This computationally efficient framework is based on the properties of K Nearest Neighbors (KNN), induced in sparse representation coefficients for significant improvement in gestures classification. In this typical approach, we explore the mean of nearest neighbors to address the problem of computational complexity of Sparse Representation based Classification (SRC). The presented scheme leads to designing an efficient integrated classification model with reduced execution time. Both KNN and SRC algorithms are complimentary candidates for integration in the sense that KNN is simple yet optimized, whereas SRC is computationally complex but efficient. More specifically, we are exploiting the mean-based nearest neighbor rule to further improve the efficiency of SRC. The ultimate goal of this framework is to propose a better feature extraction and classification model as compared to the traditional algorithms that have already been used for WiFi-based device-free gesture recognition. Our proposed method improves the gesture recognition significantly for diverse scale of applications with an average accuracy of 91.4%.

1. Introduction

Distracted driving is one of the main concerns that compromise road safety. A large number of road accidents are reported because of driver’s engagement in performing conventional secondary tasks using visual-manual interfaces. With the advancements in vehicular technology and the introduction of human computer interaction (HCI), gesture-based touchless automotive interfaces are being incorporated in vehicle designs to reduce driver visual distraction. Therefore, driver gesture recognition has become the most interesting research topic in recent years. Human gestures recognition has been widely explored in the literature for a variety of applications to reduce the complexity of human interaction with computers and other digital interfaces [1,2,3,4].
Existing research on in-vehicle gesture recognition is mainly focused on sensors, radars, or cameras [5,6,7], which have their own limitations in practical scenarios [8,9]. Subjectively, haptified gestures with ultrasound are being incorporated in the automotive domain [10]. During the last decades, WiFi-based human gesture recognition systems have gained more attention, exploiting Channel State Information (CSI). Because of its simplicity and easy deployment, these systems are numerously used in various human-centric applications including emergency surveillance, health monitoring and assisted living [11,12,13,14,15]. WiFi-based device-free approach opened a new window for the researchers to further integrate wireless human gestures recognition in vehicular technology. We are motivated to investigate WiFi-based in-vehicle human gestures to control automotive secondary functions, which is device-free and non-intrusive to driver.
This research is relevant to the ability of an intelligent vehicle to better characterize driver gestures for automotive infotainment (information and entertainment) system such as adjusting radio volume, fan speed and so on. We utilize device-free human-gestures based on the motion of the driver’s hand, finger and head, as shown in Table 1. In this novel research, we particularly identify sixteen common gestures, of which ten are hand gestures (swipe left, swipe right, hand going up, hand going down, flick, grab, push hand forward, pull hand backward, rotate hand clock-wise, rotate hand anti-clock-wise), while four are finger gestures (swipe V, swipe X, swipe +, swipe −) and the remaining two are head gestures (head tilting down, head tilting right). The key challenge is how to extend the robust gesture recognition rate for the application of an in-vehicle infotainment system using WiFi signals. In order to address the problem, we are inspired to fill in this research gap using an integrated classification approach leveraging CSI measurements. In this paper, we present a device-free wireless innovative framework to address the problem of driver gesture recognition by integrating Sparse Representation based Classification (SRC) and a modified variant of the K Nearest Neighbors (KNN) algorithm for classification. To achieve this goal, we have to face several challenges because an uncontrolled in-vehicle environment is quite different from indoor environments. We perform extensive experiments and design our prototype to combat these challenges.
The classification algorithm plays a vital role in the gesture recognition framework. Most of the existing CSI-based gesture recognition systems rely on a single classification algorithm, which cannot be guaranteed for maximum performance in vehicular technology. Carefully integrating two or more classification algorithms may enhance the recognition performance of a classifier for automotive interfaces. In this context, both KNN and SRC classifiers have been efficiently used as stand-alone, to solve various classification problems in WiFi-based device-free localization and activity or gesture recognition [13,16,17,18].
In our proposed scheme, the superiority of SRC is applied on a nearest neighbor rule, to further improve the performance of SRC with reduced computational cost. Therefore, the advanced classification is based on the integrated properties of SRC and modified-KNN to produce efficient results. We utilize the Mean of Nearest Neighbors (MNN); a variant of KNN. The concept of the mean-based algorithm was originally proposed by Mitani and Hamamoto [19] to classify query patterns, using a local mean-based non-parametric classifier. The idea of local mean-based KNN has been successfully applied in various pattern recognition systems [20,21]. Our prototype is based on multiple variants of KNN and SRC algorithms in the literature [22,23,24,25,26]. Different from others, we incorporate MNN with SRC for significant improvement in device-free gesture recognition for the application of automotive infotainment system, exploiting CSI. The combination of MNN and SRC has a computational advantage over using only SRC. We integrate MNN and SRC to overcome the computational complexity of SRC.
Our proposed system leverages off-the-shelf WiFi devices to collect channel information, which are readily available in the form of CSI measurements on commercial WiFi devices. Our algorithm utilizes the change in WiFi channel information caused by driver gestures. The driver needs to perform specific gestures in the WiFi coverage area. As far as we know, this is the first attempt towards CSI-based device-free driver gesture recognition using nearest neighbor induced sparse representation for the application of automotive interface.
Our contributions can be summarized as follows:
  • We present a WiFi-based device-free innovative framework to address the problem of driver gesture recognition for the application of vehicle infotainment systems leveraging CSI measurements.
  • We demonstrate a novel classification model by integrating SRC and a variant of the KNN algorithm to overcome the problem of expensive computational cost.
  • To evaluate the performance of our proposed framework, we perform comprehensive experiments in promising application scenarios.
  • To validate the results, we compare our system performance with state-of-the-art methods.
The rest of the paper is organized as follows; Section 2, demonstrates the traditional techniques that are relevant to our work. In Section 3, we provide an overview of our proposed system. Section 4 presents the detailed system flow with the methodology of our proposed solution. Section 5 highlights the experimental settings and validates our results by way of performance evaluation. In Section 6, we discuss important aspects and limitations of the proposed framework. Finally, we conclude our work with some future suggestions in Section 7.

2. Related Work

In this section, we will briefly review the CSI-based activity and gesture recognition systems that exploit different classification methods including KNN and SRC algorithms. Fine-grained physical layer CSI holds pervasive indoor localization and has attracted many researchers because of its potential for accurate indoor localization. With the advancement in wireless technology and the ubiquitous deployment of indoor wireless systems, indoor localization has been permeated into a new era of modern life [27]. Recently, a WiFi-based training-free localization system has been presented with good performance [28].
WiSee [29] is a WiFi based system that can recognize nine different gestures in line-of-sight (LOS), non line-of-sight (NLOS) and through-the-wall scenarios via Doppler shifts. Through-wall motion detection was investigated by WiVi [30] using multi antenna techniques. However, traditional solutions have been prototyped with special software or hardware to capture OFDM (Orthogonal Frequency Division Multiplexing) signals. As compared to these conventional methods, our proposed solution leverages off-the-shelf WiFi devices without any change in infrastructure.
The emerging device-free localization and activity recognition relies on CSI for better characterization of WiFi signals influenced by the human activities [31,32,33,34]. In recent years, CSI based micro-activity recognition [35] and intrusion detection [36,37,38] systems have emerged with good recognition results.
WiG [11] focused on WiFi-based gesture recognition for both LOS and NLOS scenarios. CSI-based gesture detection was presented in Reference [12] leveraging packet transmission and the recognition of gestures was performed by distinguishing their strengths. WiGer [39] demonstrated a WiFi-based gesture recognition system by designing a fast dynamic time warping algorithm to classify hand gestures. Recently, Reference [40] presented the writing in air with WiFi signals for virtual reality devices with more complexity and increased diversity as compared to simple gestures.
Most of existing CSI-based systems rely on single classification algorithms. During the previous decade, KNN and SRC algorithms have been numerously used in various CSI-based device-free activity recognition models, as a stand-alone classifier. WiCatch [41] proposed WiFi-based hand gesture recognition system utilizing weak signals reflected from hands and the recognition is based on support vector machines (SVMs). Wi-Key [16] recognized keystrokes via CSI-waveform using the KNN classifier. WiFinger [13] leverages WiFi signals for finger gesture recognition by examining the unique patterns of CSI using the KNN classifier. The effect of Doppler shifts on CSI for health-care applications using the SRC classification algorithm was described in Reference [17]. Human activity recognition using the SRC classifier has been successfully demonstrated in Reference [18] with high accuracy for both LOS and NLOS scenarios leveraging CSI. Different from previous work, our classification algorithm is based on the integration of modified-KNN and SRC for automotive infotainment interface.
A limited work is reported in the literature on WiFi-based driver’s in-vehicle activity or gestures recognition. In recent years, WiFi-based driver fatigue detection and driver activity recognition systems have been investigated with some constraints. In this context, WiFind [42] is suitable only for fatigue detection, while WiDriver [43] leverages a driver’s hand movements for better characterization of driver action recognition using WiFi signals. SafeDrive-Fi [44] demonstrated CSI-based dangerous driving recognition through body movements and gestures, using variance of CSI amplitude and phase measurements. Different from them, we have specifically focused on driver hand, finger and head gesture recognition for the application of in-vehicular infotainment system.

3. System Overview

In this section, we will present the overview of our proposed classification algorithm and system architecture, along with the important facts about CSI relevant to our work.

3.1. Background of SRC and MNN Algorithms

Both KNN and SRC classifiers have been efficiently used in various wireless device-free localization and recognition systems [13,16,17,18]. Conventional SRC is time consuming in the sense that a testing sample is usually represented by all training samples. The decision rule of SRC follows that if the testing sample has a great similarity with any training sample, the sparse coefficients of that specific training sample will be larger to represent the certain testing sample. SRC is efficient in a sense that all coefficients participate well in decision making. However, the computational cost of SRC increases with the increase in size of training data.
KNN is simple yet effective classifier with optimal performance. However, KNN has the issue of neighborhood size and simple majority voting for the classification, which can degrade its performance. The traditional KNN classifier chooses the K nearest neighbors from training data and majority voting is used to decide the class. Mean Nearest Neighbor (MNN) is the variant of KNN using the mean as a prototype of associated class.

3.2. Integration of SRC and MNN Algorithms

We start with traditional KNN, estimate the K nearest neighbors from all training samples of each class. Thus, we calculate the mean of K nearest neighbors within each class. We use the decision rule of SRC to supervise MNN, and sparse representation coefficients are computed from the mean vector of nearest neighbors. Finally, the class of testing sample is decided on the residual between testing sample and the mean of nearest neighbors within each class. The more details about this integrated classification algorithm are given in Section 4.3.

3.3. CSI Overview

Our prototype leverages WiFi ambient signal as information source to analyze the influence of a driver’s gesture on a wireless channel. Existing WiFi devices that exploit IEEE 802.11n/ac protocols typically consist of multiple transmitting (Tx) and receiving (Rx) antennas and thus support the widely used Multiple-Input Multiple-Output (MIMO) technology. CSI refers to fine-grained signal containing physical layer information based on Orthogonal Frequency-Division Multiplexing (OFDM).
In our experiment, an IEEE 802.11n enabled Access Point (AP) was used as a transmitter and Intel 5300 NIC was used as a receiver to collect CSI data from the physical layer of the WiFi system, which supports 30 subcarriers for each CSI Tx-Rx antenna pair. It records the channel properties of each Tx-Rx antenna pair in OFDM subcarriers. The channel variations are readily available in the form of CSI measurements on commercial WiFi devices [45]. A typical narrowband flat-fading channel for packet index i, exploiting MIMO and OFDM technology can be modeled as:
Y i = H i X i + N i i [ 1 , N ] ,
where H i is the CSI channel matrix for packet index i, N i denotes the Gaussian noise vector, Y i and X i are the received and transmitted signals respectively, N refers to the total number of received packets.
Let N T x and N R x be the number of transmitting and receiving antennas respectively, then the CSI matrix consists of N T x × N R x × 30 complex values for each CSI stream. CSI matrix H for each Tx-Rx antenna pair can be written as:
H i = [ h 1 , h 2 , , h 30 ] i [ 1 , N ] .
Each h is a complex value, which carries the information for both amplitude and phase response; estimated as:
h = | h | e j s i n { h } ,
where | h | denotes the amplitude and h indicates the phase information. CSI information on multiple channels is correlated, whereas all streams behave independently. We utilize both the amplitude and phase information to unleash the full potential of CSI measurements.

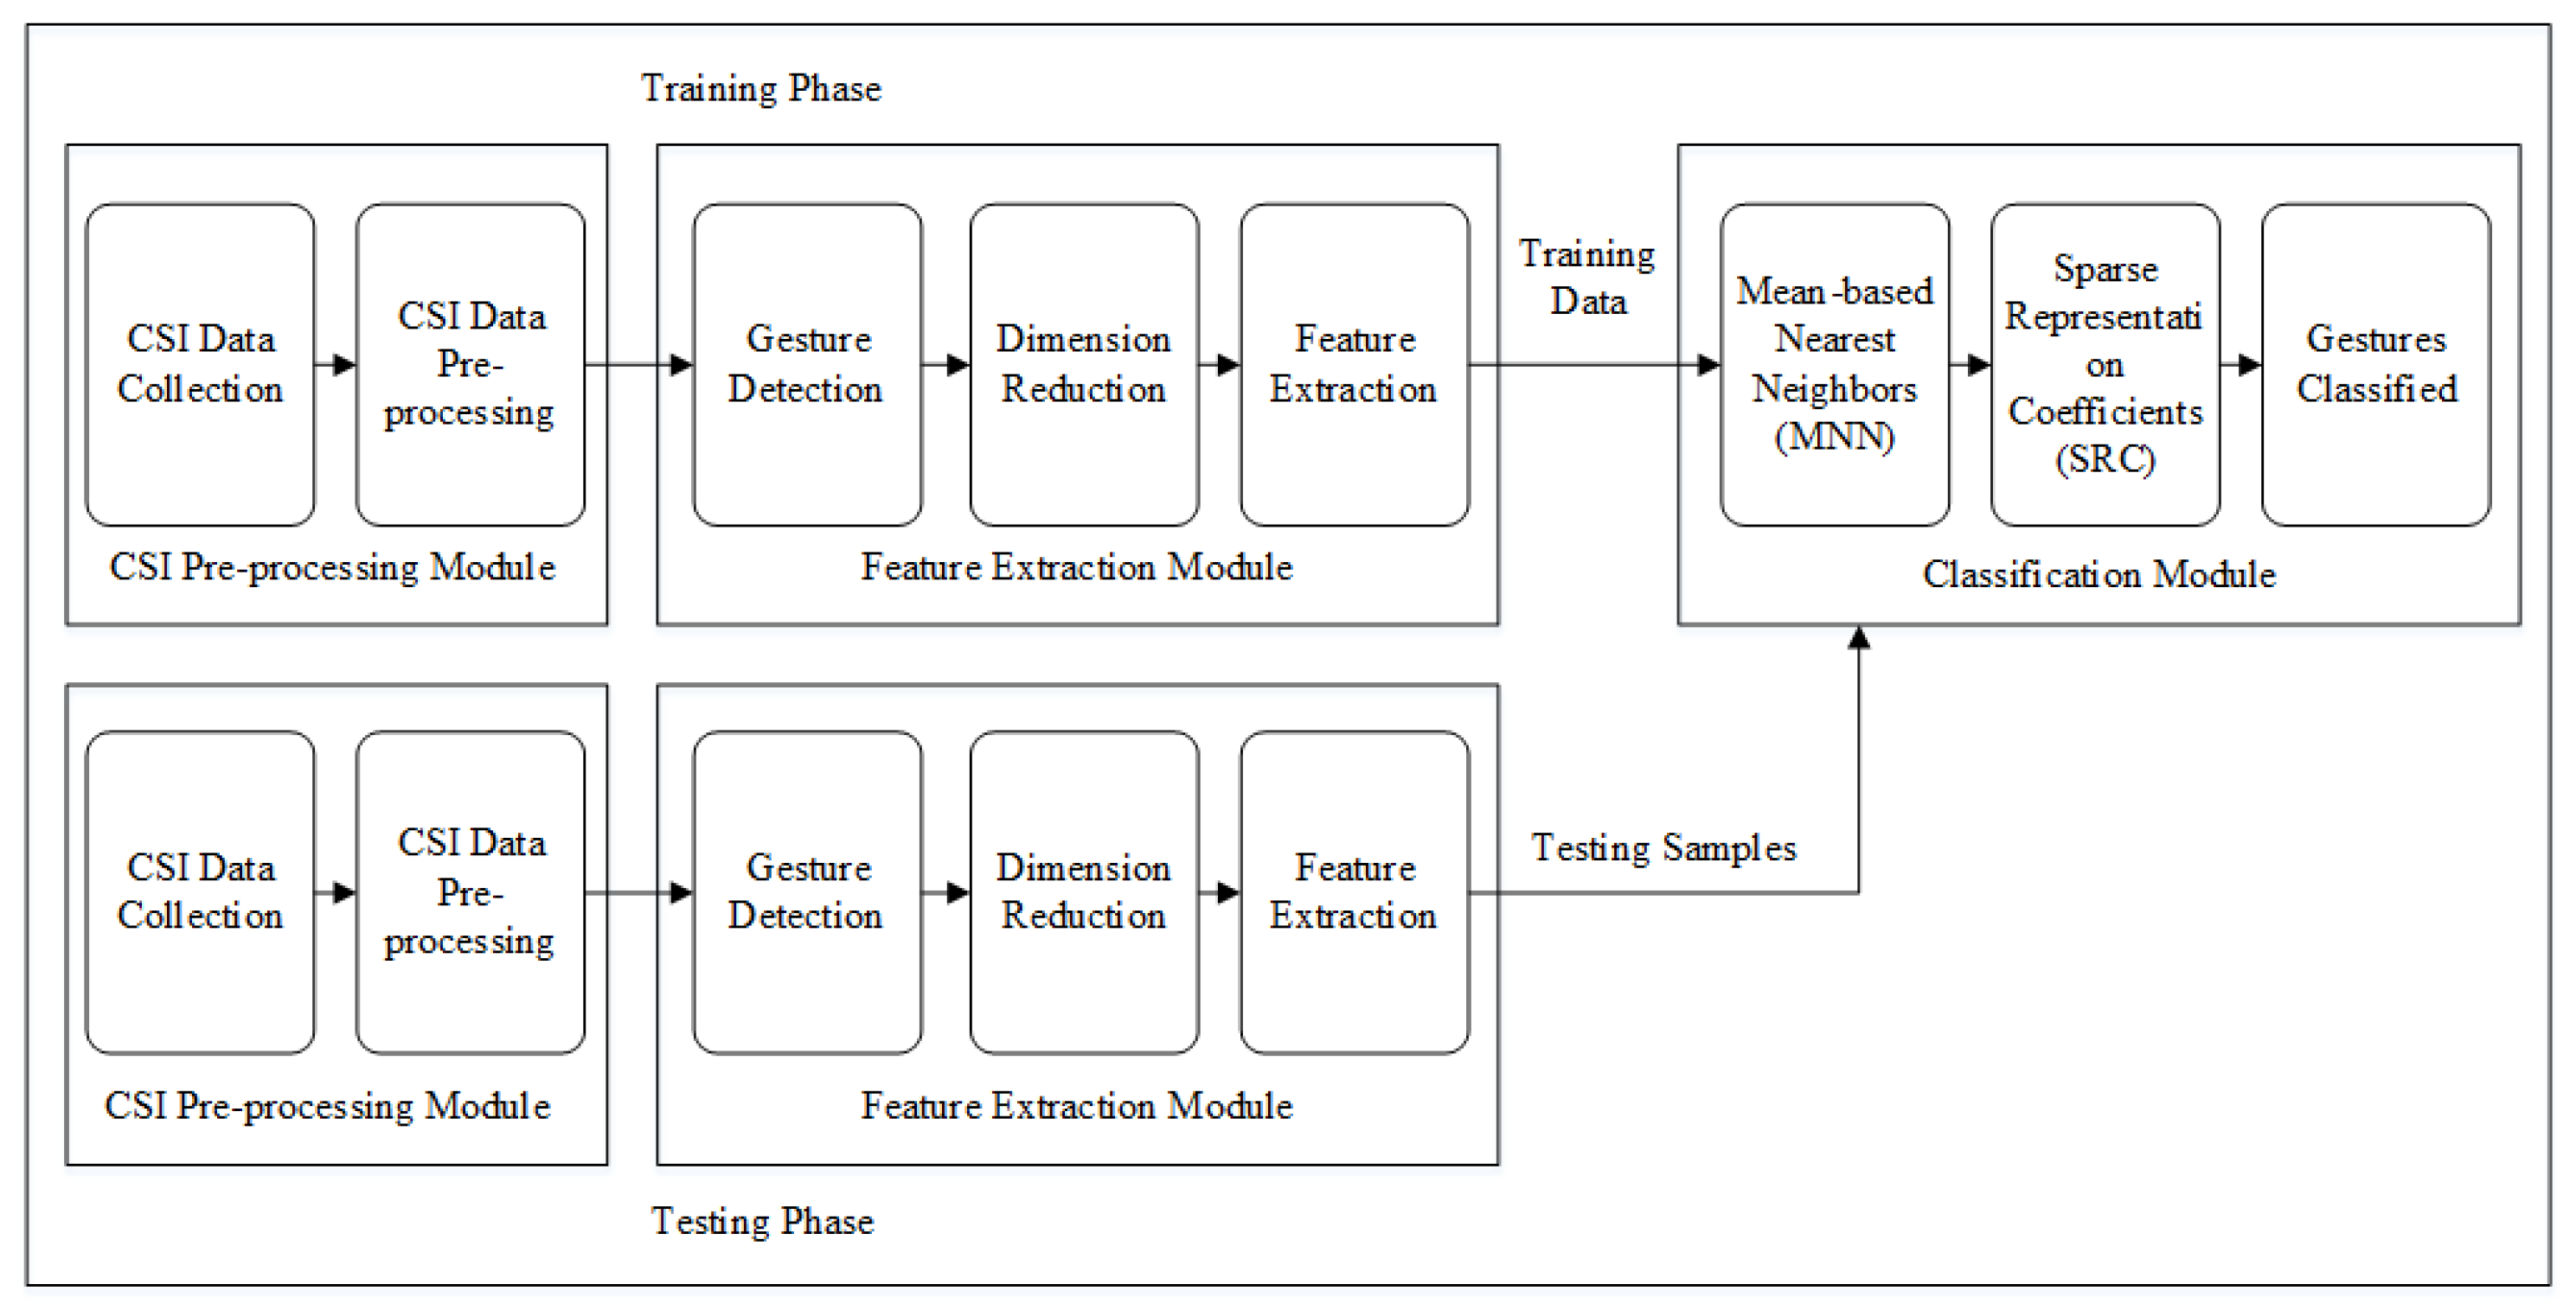
3.4. System Architecture

Our device-free driver gesture recognition system is comprised of following three basic modules—(1) CSI pre-processing module, (2) feature extraction module and (3) classification module, as illustrated in Figure 1. CSI pre-processing module; collects and pre-processes CSI measurements using basic filtering techniques. The feature extraction module is responsible for gesture detection, dimension reduction and feature extraction. Recognition is performed in the classification module, which relies on the integrated classification method. In Section 4, we will explain the function of each module in detail.

4. Methodology

In this section, we will explain complete flow of our system methodology.

4.1. CSI Pre-Processing

The CSI received signal is a combination of useful information as well as undesirable noises embedded in the signal. It is essential to filter and calibrate CSI amplitude and phase measurements, respectively. The human gestures have a relatively low frequency as compared to noise frequency. To remove high frequency noise, we apply a second order low pass Butterworth filter. We adjusted packets sampling rate ( F s ) at 80 packets/s, the same as the normalized cutoff frequency w n = 2 π f / F s = 0.025 π rad/s. CSI raw phase measurements behave extremely randomly because of the unsynchronized time clock of transmitter and receiver. In order to extract the actual phase and eliminate channel frequency offset; phase calibration and linear transformation are performed by following [46].

4.1.1. Phase Calibration

CSI raw phase measurements behave extremely randomly because of the unsynchronized time clock of transmitter and receiver. The relation between measured phase and true phase can be written as:
h j ^ = h j + 2 π n j N Δ t + β + z ,
where h j ^ indicates the measured phase of jth subcarrier and h j denotes the actual phase, Δ t represents the time lag, n j denotes the subcarrier index, N stands for the size of FFT, β indicates the unknown phase offset and z is random noise. We cannot measure the exact value of β and Δ t for each packet. However, we can get the same value of β and Δ t each time by using a simple transformation. Phase error 2 π n j N Δ t + β is linear function of subcarrier index n j . We can define two parameters a and b for calibration of phase error such that:
a = h ^ j N h ^ j 1 j N j 1
b = 1 N k = 1 N h ^ j k ,
subtracting a j k + b from raw phase h ^ j k to get the sanitized phase h ˜ j k as:
h ˜ j k = h ^ j k a j k b .
The phase sanitization is performed on all the subcarriers and re-assembled according to the corresponding amplitudes.

4.1.2. Amplitude Information Processing

CSI amplitude measurements are very noisy for gesture extraction because of environmental noise and signal interference. We propose applying the weighted moving average (WMA) over CSI amplitude streams to eliminate the outliers and avoid false anomaly by the following procedure [47].
Let | h t | denotes the amplitude information at time interval t, then the expression for WMA can be written as:
| h t | = [ m × | h m | + ( m 1 ) × | h ( m 1 ) | + + 1 × | h 1 | ] m + ( m 1 ) + + 1 ,
where | h t | is the averaged amplitude at time t. New amplitude | h t | has the weight value of m, which decides to what degree the current value relates to historical data. The value of m can be empirically selected based on the experiments.
Figure 2, shows the comparison of the original signal and the signal processed after WMA implementation. It is clear that WMA can make the subcarrier waveform much smoother by reducing noise level.

4.2. Gesture Detection

In the CSI data, both amplitude and phase information have the capability to be used for gesture detection [48]. Our gesture detection algorithm is based on the variance of amplitude and phase to characterize gestures from CSI filtered data. In this scheme, all subcarriers are aggregated to evaluate the variance. We normalized the variance and estimated the corresponding energy of CSI amplitude and phase over a specific time window.
Let ν i indicate the variance of a single link for all the subcarriers belonging to packet index i. For N number of received packets, variance ν = { ν 1 , ν 2 , , ν N } obeys Gaussian distribution with ν N ( μ , σ 2 ) . We normalized ν to represent normalized amplitude and phase as V A and V P , respectively. Let E A and E P are the corresponding energy of normalized amplitude ( V A ) and phase ( V P ), respectively. We can estimate the energy over a length of time window τ and compare it with the threshold η t h as:
E A = k = 1 l e n g t h ( τ ) ( V A ( k ) ) 2
and
E P = k = 1 l e n g t h ( τ ) ( V P ( k ) ) 2 .
We set a threshold ( η t h = 100 ) for gesture detection based on our preliminary measurements depending on different conditions and scenarios. Corresponding to this threshold, the gesture is detected as:
ϕ = m a x ( V ) , E η t h 0 , o t h e r w i s e .
If the energy E is greater than or equal to the threshold η t h , the system takes it as a gesture and records the maximum value of normalized variance over this window, and when it goes lower than the threshold it is considered as a non-gesture.

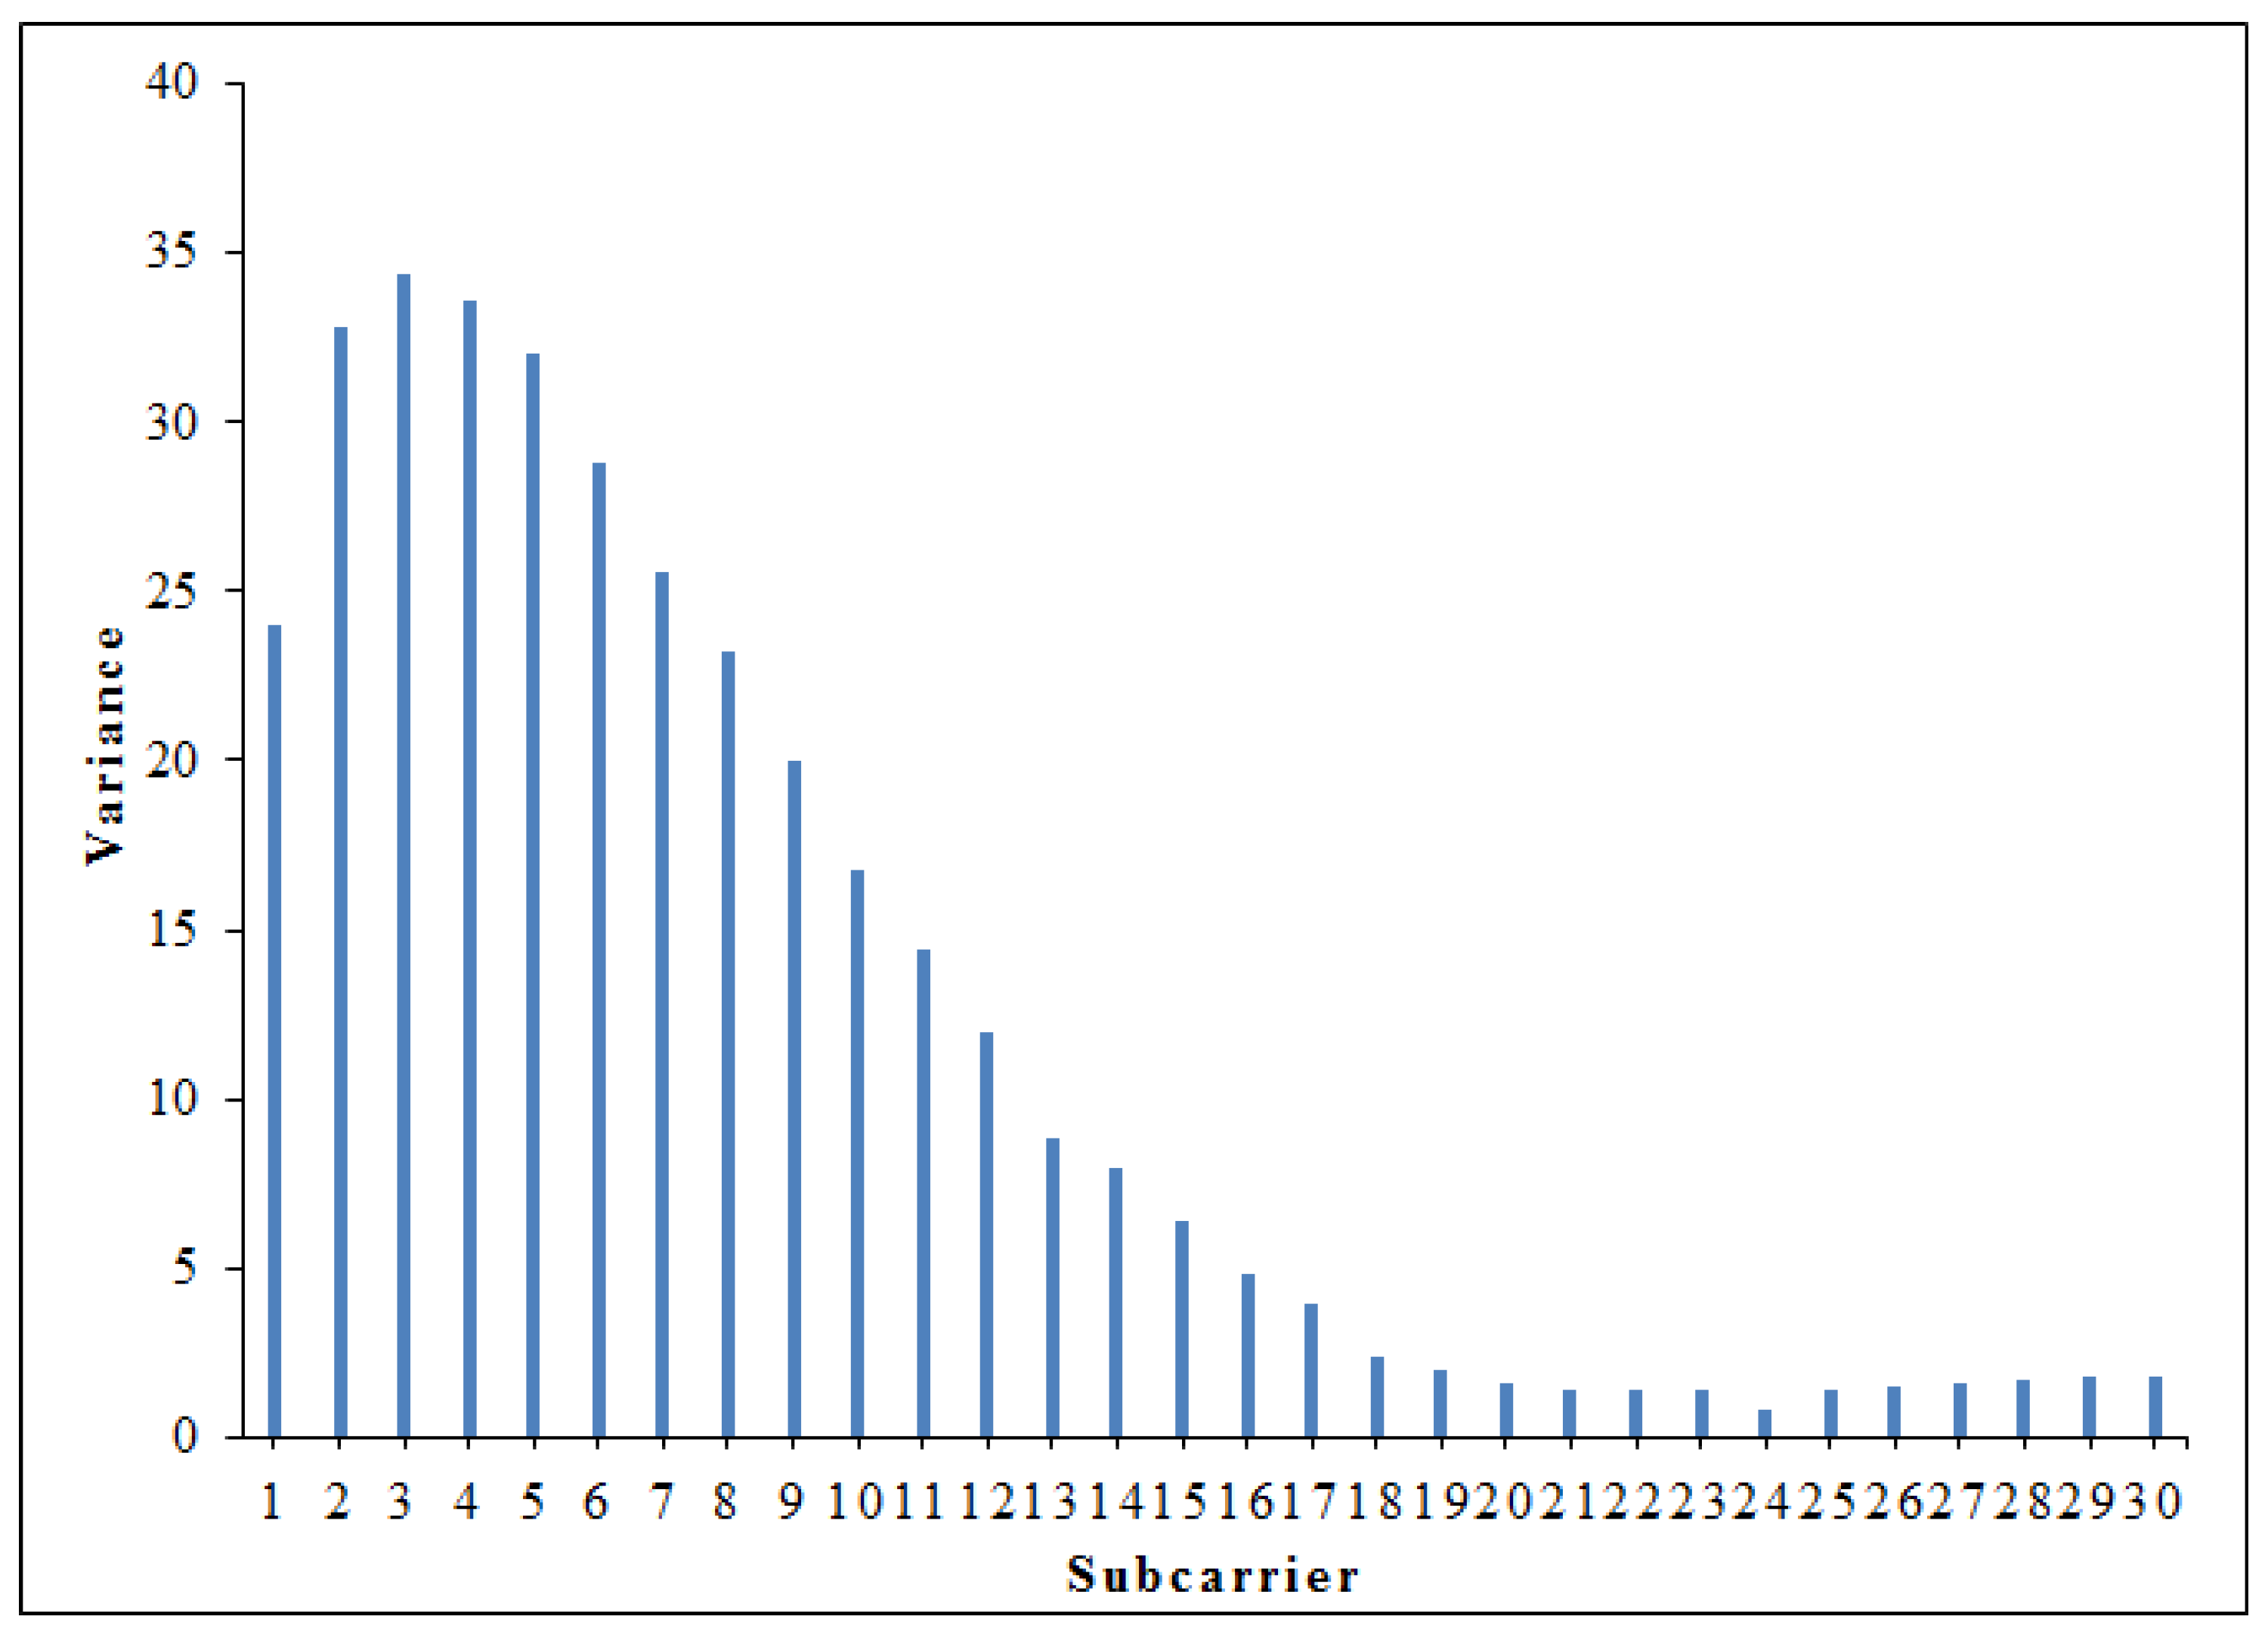
4.2.1. Dimensionality Reduction

In CSI data, some subcarriers are very sensitive to noise but non-significant for gesture sensitivity. From Figure 3, it is clear that the sensitivity of different subcarriers varies for the same gesture. Therefore, we suggest Principal Component Analysis (PCA) to reduce the dimensionality and eliminate such types of unpredictable subcarriers.
PCA is commonly used to extract most representative components and removes background noise [49]. In the PCA scheme, new variables are being generated by the linear combination of the original data, called principal components. These principal components organize the original variables in orthogonal form in order to eliminate redundant information.
In our experiment, PCA is applied to each packet received to extract p principal components. Based on our observations, we particularly select the second, third and fourth principal components that is, p = 3 for both the amplitude and phase of the CSI signal. Finally, we obtain a matrix with p × N a dimensions, where N a denotes the number of anomalous packets.
First, we normalized CSI matrix H and static components were removed. Let H n represent the normalized matrix after the subtraction of the average CSI value from each column of CSI matrix H. We then calculated the corresponding correlation matrix as H n × H n T . After eigen decomposition of the correlation matrix, we compute eigen vectors q = q 1 , q 2 , , q i and simultaneously p = p 1 , p 2 , , p i principal components are structured. For ith packet, it can be expressed as:
p i = H n × q i ,
where q i and p i stand for ith eigen vector and ith principal component, respectively.

4.2.2. Feature Extraction

Let H c ( s ) be the first CSI packet detected by our algorithm and S c stands for the number of subcarriers between a single link of antenna pair T x R x . We can extract N c successive CSI packets for any activity profile.
Based on our preliminary experimental investigations and detailed analysis of extracted CSI, we particularly selected six statistical features that is, mean, standard deviation, median absolute deviation, maximum value, 25th percentile and 75th percentile. Mathematically, these features are defined as [50]:
(1) Mean: The mean μ ( j ) is defined as the average CSI of all packets H c belonging to jth subcarrier written as:
μ ( j ) = [ H c j ( s ) + H c j ( s + 1 ) + + H c j ( s + N c ) ] N c
where N c is the total number of successive CSI packets for activity profile and j [ 1 , S c ] .
(2) Standard Deviation: The standard deviation σ ( j ) of jth subcarrier is basically the square root of variance. Assume j [ 1 , S c ] , then σ ( j ) can be expressed as:
σ ( j ) = 1 N c k = s k = s + N c ( H c j ( k ) μ ( j ) ) 2 .
(3) Median Absolute Deviation: A robust way to quantify CSI variations for any activity segment is Median Absolute Deviation (MAD). Mathematically, median absolute deviation M A D ( j ) for jth subcarrier is defined as:
M A D ( j ) = m e d i a n ( | H c j ( k ) H ˜ c j | ) s . t . j [ 1 , S c ] a n d k [ 1 , N c ]
where H ˜ c j is the median of H c j .
(4) Maximum Value: The maximum value is a unique number, that is the highest value of all other values in the CSI data set. Maximum value M A X ( j ) of jth subcarrier with j [ 1 , S c ] is mathematically calculated as:
M A X ( j ) = m a x ( [ H c j ( s ) | H c j ( s + 1 ) | | H c j ( s + N c ) ] ) .
(5) 25th Percentile: If 25 is the ordinal rank, the 25 t h percentile of a data set is defined as the value at which 25 percent of distribution is below it. Mathematically, 25 t h percentile P 25 t h ( j ) for j [ 1 , S c ] is explained as:
P 25 t h ( j ) = H c j ( 25 100 * N c ) .
(6) 75th Percentile: Similarly, 75 t h percentile P 75 t h ( j ) can be formulated as:
P 75 t h ( j ) = H c j ( 75 100 * N c ) .
In order to differentiate between multiple gesture profiles, we integrate all features into a feature vector. We propose constituting a tuple F of integrated features utilizing both magnitude and phase, defined as:
F = { f 1 , f 2 , , f n } F ,
where f i is a feature and F stands for the dataset consisting of all gesture features. We get twelve features in total (6-amplitude features and 6-phase features).

4.3. Classification Module

In the classification module, MNN and SRC algorithms were integrated. We started with traditional KNN, estimated the K nearest neighbors from all training samples of each class [26]. Thus, we calculated the mean of K nearest neighbors within each class.

4.3.1. K Nearest Neighbor

Assume our classification problem has t number of classes. Let F i be a set comprising of training samples for class index i represented as:
F i = { f i j | j = 1 , , N i } , i = 1 , , t ,
where N i is the total number of training samples for class index i. Assume f i r is the prototype for ith class. For any testing sample y, let us find its nearest neighbor f i r from training samples in each class. We adopt squared Euclidean distance to measure the similarity between nearest neighbor f i r and testing sample y, defined as:
d i ( y ) = y f i r 2 .
The Nearest Neighbor (NN) algorithm estimates the nearest training sample based on the distance measure and designate that class to testing sample y which has the minimal distance. Mathematically,
c l a s s ( y ) = min i d i ( y ) .
The KNN algorithm is the extension of 1-NN by taking K nearest neighbors from all the training data. In KNN, the class assignment to y is based on the rule of majority voting. Assuming ith class has k i samples, the testing sample y belongs to the class which has a maximum number of nearest neighbors as:
c l a s s ( y ) = max i k i .
Such that, y is designated to the class based on maximum number of nearest neighbors. In general, the class of the testing sample is normally decided on the basis of majority voting of K nearest neighbors that are specifically chosen from training samples with a certain minimum distance.

4.3.2. Mean of Nearest Neighbor (MNN)

We implemented the mean of the nearest neighbor rule in our proposed algorithm because it may be a meaningful compromise between the nearest neighbor and minimum distance. Assume K nearest neighbors of testing sample y for class index i are represented as F i = { f i 1 , f i 2 , , f i K i } . The mean vector of nearest neighbors for testing sample y in class i is defined as:
μ y i = 1 K r = 1 K f i r
After estimating the mean vector per class, we can determine the class of y. For this purpose, we find the distance from the mean vector as:
d i ( y ) = y μ y i 2 .
Thus, the class is estimated as follows:
c l a s s ( y ) = min i d i ( y ) .

4.3.3. Sparse Representation Based Classification (SRC)

In SRC, a testing sample is expressed as a linear sparse combination of all the training samples [22]. The sparse representation coefficients can be obtained by solving L 1 optimization problem. We characterise the training samples for ith class as F i = { f i 1 , f i 2 , , f i N i } , such that N = i = 1 t N i . Now assume a matrix F = { F 1 , F 2 , , F t } in which all training samples of entire activity classes are being concatenated.
The testing sample y is defined as y = F v for the sparsest solution. The coefficient vector v has nonzero values only for the entries that are associated to class i. The sparse solution for coefficient vector v may be optimized with L 0 norm constraint as:
v 0 ^ = a r g m i n v 0 s . t . F v = y .
Assuming the solution of L 0 norm constraint is equivalent to L 1 norm constraint, we obtain
v 1 ^ = a r g m i n v 1 s . t . F v = y .
After getting the optimal v 1 ^ solution for sparsity, SRC can be designed for class specific reconstruction residual.
Let δ i ( v ) is the vector associated with ith class that selects non-zero entries corresponding to v. Based on the coefficients of ith class, we can reconstruct the test sample y as:
y ^ i = F δ i ( v ) ,
where y i ^ indicates the reconstructed testing sample. The residual of reconstructed class can be obtained as:
r i ( y ) = y y i ^ 2 = y F δ i ( v ) 2 .
The decision of class is based on the following principle:
c l a s s ( y ) = min i r i ( y ) .
In our proposed framework, we used the decision rule of SRC to supervise MNN and sparse representation coefficients were computed from the mean vector of nearest neighbors.

4.3.4. MNN Induced SRC (MNN-SRC)

Our proposed MNN-SRC method is much faster as compared to conventional SRC. The mean of K nearest neighbors is much smaller in comparison to the total number of training samples. In our proposed framework, the mean of K nearest neighbors is computed from all training samples. The testing sample is represented according to the mean vector of K nearest neighbors. Sparse representation based classification is applied on the mean vector of nearest neighbors instead of all the training samples. The residuals are estimated between the testing sample and the mean vector of nearest neighbors for each class. The class of the testing sample is decided on the residual between testing sample and the mean of nearest neighbors within each class.
Suppose we have K i nearest neighbors for F ^ i = { f ^ i 1 , f ^ i 2 , , f ^ i K i } belonging to ith class with K = i = 1 t K i . We find K nearest neighbors for each class corresponding to testing sample and estimate its mean. The mean vector of nearest neighbors for testing sample y in class i is defined as:
m = 1 K r = 1 K f ^ i r .
Assume M ^ is a matrix comprising of mean vectors of each class. The sparse representation coefficients were calculated using M ^ to estimate y. Mathematically,
m i n v 1 s . t . y = M ^ v .
In some situations, y cannot be exactly equal to M ^ v for any coefficient. To overcome this constraint, a Lagrange factor λ is imposed by the following:
m i n v 1 + λ y M ^ v 2 .
Let δ ^ i ( v ) be the vector associated with ith class that selects non-zero entries corresponding to v. Based on the coefficients of ith class, we can reconstruct the test sample y as:
y ^ i = M ^ δ ^ i ( v ) ,
where y i ^ indicates the reconstructed testing sample. The residual of the reconstructed class is obtained as:
r i ( y ) = y y i ^ 2 = y M ^ δ ^ i ( v ) 2 .
The class i has residual r i , which can determine the class of the testing sample. The decision for class designation is based on the following principle:
c l a s s ( y ) = min i r i ( y ) .

5. Experimentation and Evaluation

In this section, we will describe the experimental settings and evaluate the performance of our proposed framework.

5.1. Experimentation Settings

We conducted experiments using 802.11n enabled off-the-shelf WiFi devices. Specifically, we used a Lenovo laptop as a receiver equipped with an Intel 5300 network interface card and an Ubuntu 11.04 LTS operating system to collect CSI data. The laptop connects to a commercial WiFi Access Point (AP); TP-Link router as transmitter operating at 2.4 GHz. The receiver can ping the AP at rate of 80 packets/s. The transmitter has single antenna, whereas the receiver has three antennas, that is, N T x = 1 and N R x = 3 ( 1 × 3 MIMO system) generating 3 CSI streams of 30 subcarriers each. We run 802.11n CSI Tool [45] on the receiver to acquire and record CSI measurements on 30 subcarriers of 20 MHz channel. The required signal processing is performed using MATLAB R2016a.
To evaluate the robustness of our proposed scheme, we choose following three scenarios:
  • Scenario-I (Indoor environment)—In this scenario, all prescribed gestures are performed in an empty room of size 11 × 12 feet, while sitting on a chair between Tx and Rx, separated by a distance of 2 m.
  • Scenario-II (Vehicle standing in a garage)—In this scenario, all gestures are performed in a vehicle standing in a garage of size 14 × 16 feet.
  • Scenario-III (Actual driving)—In this scenario, all prescribed gestures are performed while driving a vehicle on a straight road of 30 km inside university campus, with average speed of 20 km/h. During gesture performance, no other activity is performed to avoid interference.
For in-vehicle scenarios, we set up our testbed in a local manufactured vehicle which was not equipped with pre-installed WiFi devices. Due to the unavailability of the WiFi access point in our test vehicle, we configured the commercial TP-Link router as AP, placed on the dashboard in front of the driver. The receiver was placed at the co-pilot’s seat to collect CSI data.
In each experiment, 16 possible human gestures, as shown in Table 1, were performed by five volunteers (2-females and 3-males university students). Each volunteer repeated all gestures 20 times for each experiment, and a single gesture was performed within a window of 5 s. In total, the data set comprised of 1600 samples (5-volunteers × 16-gestures × 20-times repeated) for each experiment; of which 50 % were used for training and 50 % for testing. In our experiments, the training data do not contain the samples from the testing data, and we keep the testing samples out for cross validation. Furthermore, we also tested the generalization of our model using an unbiased Leave-One-Participant-Out Cross-Validation (LOPO-CV) scheme.

5.2. Performance Evaluation

First, we tested the usefulness of our extracted features, that is, mean ( μ ), standard deviation ( σ ), median absolute deviation (MAD), maximum value (MAX), 25th percentile ( P 25 t h ) and 75th percentile ( P 75 t h ). Table 2 represents some prominent values of each calculated feature extracted for different gestures. One can notice that all features are distinctively different, indicating that these features can achieve high recognition accuracy.
The recognition performance of the proposed method was observed by conducting extensive experiments. For simplicity, we use abbreviated terms for our proposed prototype, that is, MNN integrated with SRC as MNN-SRC, similarly KNN with SRC as KNN-SRC.
We particularly selected a confusion matrix and recognition accuracy as metrics for performance evaluation. The occurrence of the actual gesture performed is represented by the column of the confusion matrix, whereas the occurrence of the gesture classified was represented by the rows. The confusion matrix in Figure 4 reveals the fact that our proposed method can recognize sixteen different gestures very accurately with an average accuracy of 91.4 % , 90.6 % and 88.7 % for scenarios I, II and III respectively.
To ensure the reliability and efficacy of proposed framework, we analyzed the results by adopting different evaluation metrics including precision, recall and F 1 -score. These evaluation metrics are presented as:
1. Precision is defined as positive predictive value, mathematically described as:
P r e c i s i o n = T P T P + F P
where T P and F P are true positive and false positive respectively. True Positive (TP) is the probability that a model correctly predicts the positive class. Whereas, False Positive (FP) is the probability of that a model incorrectly predicts the positive class.
2. Recall is defined as the True Positive Rate (TPR) and measures the sensitivity of system as follows:
R e c a l l = T P T P + F N ,
where F N is a false negative and is defined as the probability that the model incorrectly predicts the negative class. We will also evaluate our proposed method with False Negative Rate (FNR), defined as:
F N R = F N T P + F N .
3. F-measure or F 1 -score is defined as the weighted average of precision and recall, calculated as:
F 1 = 2 × P r e c i s i o n × R e c a l l P r e c i s i o n + R e c a l l .
Figure 5 shows the results related to precision, recall and F 1 -score for all three scenarios, using our proposed scheme. Table 3 summarizes the performance of our MNN-SRC algorithm using TPR and FNR, for each gesture. In general, the MNN-SRC algorithm has an average TPR of over 88.9%, with average FNR less than 11.1% for all three scenarios.
In order to determine the efficacy of the integrated classification algorithm, some experiments were performed with each classifier separately and the results are presented in Figure 6. As can be seen, the average recognition accuracy of stand-alone MNN (Mean Nearest Neighbor) or SRC (Sparse Representation based Classification) method is less as compared to the integrated MNN-SRC algorithm.
We have compared the performance of MNN-SRC with KNN-SRC as shown in Figure 7. It is obvious that the average recognition accuracy of MNN-SRC algorithm is higher as compared to KNN-SRC.
Figure 8 ensures the reliability of our feature extraction method. The model was evaluated using state-of-the-art classifiers including SVM, NB, KNN, MNN and SRC algorithms. One can notice that all classifiers show a satisfactory recognition results. However, our proposed MNN-SRC classification model outperforms other classification algorithms.
The overall performance comparison of particular state-of-the-art classifiers is illustrated in Table 4. From the experimental results, it can be concluded that our proposed MNN-SRC method is much better as compared to KNN-SRC or stand-alone conventional classification methods including MNN, KNN, SRC, SVM and NB.
From Figure 9, we can observe that the proposed system could achieve reasonable performance even using only the amplitude or phase information. However, the recognition accuracy will be significantly better when we are combining both the amplitude and phase information.
To study the impact of nearest neighbors, we performed experiments with varying K values. From Figure 10, it is clear that MNN-SRC outperforms KNN-SRC for almost all K values. However, optimal values K = 20 and K = 5 were used for MNN and KNN, respectively, throughout our experiments. The detailed results with different K values of MNN-SRC are illustrated in Table 5.
We have proven our results by calculating the execution time as illustrated in Figure 11. It is clear that the computational cost of our proposed algorithm MNN-SRC is much less with an execution time of 141.5 ms as compared to the SRC alone with an execution time of 761.8 ms. Furthermore, the execution time of MNN-SRC is less as compared to KNN-SRC. This is due to the fact that we are using the mean of nearest neighbors, which takes much less time to calculate its sparse coefficients as compared to traditional KNN. Although the execution time of MNN-SRC is a little higher as compared to MNN alone; however, as a compromise the recognition accuracy of MNN-SRC is comparatively better. The execution time of KNN is 130.7 ms, which is again higher as compared to MNN.
In order to present the practical performance of our proposed framework, we perform a user independence test. We particularly adopt the Leave-One-Participant-Out Cross-Validation (LOPO-CV) scheme, in which the training data do not know about the test user. LOPO-CV is an effective technique for evaluating the generalization of results for unseen data [51]. In this experiment, all data are treated as the training data set, except a particular personś data that is selected as the test data. This process is repeated for each person. Figure 12, reveals the fact that our proposed method has acceptable performance even using LOPO-CV scheme with a recognition accuracy of 84.7%, 82.8% and 82.1% for scenarios I, II and III respectively. It can be concluded that our presented model is capable for the generalization of new users. The unbiased LOPO-CV estimator is difficult to implement due to its large amount of computation. However, it is suggested to acquire a large amount of training data from a variety of entities to get more better results.

6. Discussion

In this section, we discuss the limitations and potential results obtained from the experiments. We observe that all gestures are classified with a very good recognition performance using our MNN-SRC classification algorithm, however several factors may influence the accuracy. In this context, some gestures have a great resemblance to each other, such as flick, which has great resemblance with grab and push hand forward. Similarly, push hand backward has great resemblance with grab and push hand forward which degrades the recognition accuracy. Although, all these types of limitations degrade the system performance; however, the overall performance of MNN-SRC is still better as compared to other algorithms.
Although CSI-based systems can achieve a reasonable performance, but there are still some limitations. Firstly, the CSI measurements are much more sensitive to moving objects. As a result, the recognition accuracy may suffer a degradation in performance when there is any other vehicle’s motion in the testing area. Moreover, the system is designed by considering only a single person, that is, the driver. However, in real vehicle scenarios there may exist more than one person which can degrade system performance accordingly by making the recognition much more complex. In general, other vehicles on the road and people outside the vehicle may have a very slight influence [42]. Thus, additional signal processing may overcome these issues which we will consider in future.
Despite these limitations, our CSI-based device-free driver gesture recognition system is more scalable and easy to deploy as compared to other models. It should be noted that our proposed classification method is a general solution to solve any device-free localization and activity or gesture recognition problem. In this paper, we have utilized this method for in-vehicle driver gesture recognition.

7. Conclusions

In this paper, we have presented a novel framework for device-free robust driver gesture recognition. It can be concluded that the recognition rate is significantly improved by leveraging an integrated classification algorithm. Experimental results show that the mean of nearest neighbors based sparse representation coefficients framework can achieve remarkable performance in terms of gestures recognition and execution time. Our proposed integrated classifier is a promising algorithm for driver gesture recognition in the field of automotive vehicle infotainment systems.
This integrated classification approach opens a new direction for a diverse scale of potential applications. There are still several aspects that need be considered. In the future, we are interested in more complex driving scenarios based on the findings presented in this paper.

Author Contributions

Conceptualization, Z.U.A.A., H.W.; methodology, Z.U.A.A., H.W.; software, Z.U.A.A., H.W.; validation, Z.U.A.A., H.W.; formal analysis, Z.U.A.A.; investigation, Z.U.A.A.; resources, H.W.; data curation, Z.U.A.A., H.W.; writing–original draft preparation, Z.U.A.A.; writing–review and editing, H.W.; visualization, Z.U.A.A., H.W.; supervision, H.W.; project administration, H.W.; funding acquisition, H.W.

Funding

This work is supported by the National Natural Science Foundation of China under grant number 61671103.

Conflicts of Interest

The authors declare no conflict of interest.

References

  1. Haseeb, M.A.A.; Parasuraman, R. Wisture: Touch-Less Hand Gesture Classification in Unmodified Smartphones Using Wi-Fi Signals. IEEE Sens. J. 2019, 19, 257–267. [Google Scholar] [CrossRef]
  2. Li, Y.; Huang, J.; Tian, F.; Wang, H.A.; Dai, G.Z. Gesture interaction in virtual reality. Virtual Real. Intell. Hardw. 2019, 1, 84–112. [Google Scholar] [CrossRef]
  3. Vuletic, T.; Duffy, A.; Hay, L.; McTeague, C.; Campbell, G.; Grealy, M. Systematic literature review of hand gestures used in human computer interaction interfaces. Int. J. Hum.-Comput. Stud. 2019, 129, 74–94. [Google Scholar] [CrossRef] [Green Version]
  4. Grifa, H.S.; Turc, T. Human hand gesture based system for mouse cursor control. Procedia Manuf. 2018, 22, 1038–1042. [Google Scholar] [CrossRef]
  5. Suchitra, T.; Brinda, R. Hand Gesture Recognition Based Auto Navigation System for Leg Impaired Persons. Int. J. Adv. Res. Electr. Electron. Instrum. Eng. 2017, 6, 251–257. [Google Scholar]
  6. Ahmed, S.; Khan, F.; Ghaffar, A.; Hussain, F.; Cho, S.H. Finger-Counting-Based Gesture Recognition within Cars Using Impulse Radar with Convolutional Neural Network. Sensors 2019, 19, 1429. [Google Scholar] [CrossRef] [Green Version]
  7. Zengeler, N.; Kopinski, T.; Handmann, U. Hand Gesture Recognition in Automotive Human-Machine Interaction Using Depth Cameras. Sensors 2019, 19, 59. [Google Scholar] [CrossRef] [Green Version]
  8. Khan, F.; Leem, S.K.; Cho, S.H. Hand-Based Gesture Recognition for Vehicular Applications Using IR-UWB Radar. Sensors 2017, 17, 833. [Google Scholar] [CrossRef]
  9. Cao, Z.; Xu, X.; Hu, B.; Zhou, M.; Li, Q. Real-time gesture recognition based on feature recalibration network with multi-scale information. Neurocomputing 2019, 347, 119–130. [Google Scholar] [CrossRef]
  10. Large, D.R.; Harrington, K.; Burnett, G.; Georgiou, O. Feel the noise: Mid-air ultrasound haptics as a novel human-vehicle interaction paradigm. Appl. Ergon. 2019, 81, 102909. [Google Scholar] [CrossRef]
  11. He, W.; Wu, K.; Zou, Y.; Ming, Z. WiG: WiFi-Based Gesture Recognition System. In Proceedings of the 24th International Conference on Computer Communication and Networks (ICCCN), Las Vegas, NV, USA, 3–6 August 2015. [Google Scholar]
  12. Xiong, H.; Gong, F.; Qu, L.; Du, C.; Harfoush, K. CSI-based Device-free Gesture Detection. In Proceedings of the 12th International Conference on High-Capacity Optical Networks and Enabling/Emerging Technologies (HONET), Islamabad, Pakistan, 21–23 December 2015. [Google Scholar]
  13. Li, H.; Yang, W.; Wang, J.; Xu, Y.; Huang, L. WiFinger: Talk to Your Smart Devices with Finger-grained Gesture. In Proceedings of the 2016 ACM International Joint Conference on Pervasive and Ubiquitous Computing, Heidelberg, Germany, 12–16 September 2016; pp. 250–261. [Google Scholar]
  14. Abdelnasser, H.; Harras, K.; Youssef, M. A Ubiquitous WiFi-based Fine-Grained Gesture Recognition System. IEEE Trans. Mob. Comput. 2018, 18, 2474–2487. [Google Scholar] [CrossRef]
  15. Zhou, Q.; Xing, J.; Chen, W.; Zhang, X.; Yang, Q. From Signal to Image: Enabling Fine-Grained Gesture Recognition with Commercial Wi-Fi Devices. Sensors 2018, 18, 3142. [Google Scholar] [CrossRef] [PubMed] [Green Version]
  16. Ali, K.; Liu, A.X.; Wang, W.; Shahzad, M. Recognizing Keystrokes Using WiFi Devices. IEEE J. Sel. Areas Commun. 2017, 35, 1175–1190. [Google Scholar] [CrossRef]
  17. Tan, B.; Chen, Q.; Chetty, K.; Woodbridge, K.; Li, W.; Piechocki, R. Exploiting WiFi Channel State Information for Residential Healthcare Informatics. IEEE Commun. Mag. 2018, 56, 130–137. [Google Scholar] [CrossRef] [Green Version]
  18. Al-qaness, M.A.A.; Li, F.; Ma, X.; Zhang, Y.; Liu, G. Device-Free Indoor Activity Recognition System. Appl. Sci. 2016, 6, 329. [Google Scholar] [CrossRef] [Green Version]
  19. Mitani, Y.; Hamamoto, Y. A local mean-based nonparametric classifier. Pattern Recognit. Lett. 2006, 27, 1151–1159. [Google Scholar] [CrossRef]
  20. Gou, J.; Ma, H.; Ou, W.; Zeng, S.; Rao, Y.; Yang, H. A generalized mean distance-based k-nearest neighbor classifier. Expert Syst. Appl. 2019, 115, 356–372. [Google Scholar] [CrossRef]
  21. Gou, J.; Qiu, W.; Yi, Z.; Xu, Y.; Mao, Q.; Zhan, Y. A Local Mean Representation-based K-Nearest Neighbor Classifier. ACM Trans. Intell. Syst. Technol. 2019, 10, 29. [Google Scholar] [CrossRef]
  22. Zou, J.; Li, W.; Du, Q. Sparse Representation-Based Nearest Neighbor Classifiers for Hyperspectral Imagery. IEEE Geosci. Remote Sens. Lett. 2015, 12, 2418–2422. [Google Scholar]
  23. Yang, J.; Zhang, L.; Yang, J.Y.; Zhang, D. From classifiers to discriminators: A nearest neighbor rule induced discriminant analysis. Pattern Recognit. 2011, 44, 1387–1402. [Google Scholar] [CrossRef]
  24. Bulut, F.; Amasyali, M.F. Locally adaptive k parameter selection for nearest neighbor classifier: One nearest cluster. Pattern Anal. Appl. 2017, 20, 415–425. [Google Scholar] [CrossRef]
  25. Zhang, S.; Li, X.; Zong, M.; Zhu, X.; Wang, R. Efficient kNN Classification With Different Numbers of Nearest Neighbors. IEEE Trans. Neural Netw. Learn. Syst. 2018, 29, 1774–1785. [Google Scholar] [CrossRef] [PubMed]
  26. Zhang, N.; Yang, J. K Nearest Neighbor Based Local Sparse Representation Classifier. In Proceedings of the 2010 Chinese Conference on Pattern Recognition (CCPR), Chongqing, China, 21–23 October 2010. [Google Scholar]
  27. Xiao, J.; Zhou, Z.; Yi, Y.; Ni, L.M. A Survey on Wireless Indoor Localization from the Device Perspective. ACM Comput. Surv. (CSUR) 2016, 49, 25. [Google Scholar] [CrossRef]
  28. Zhang, L.; Gao, Q.; Ma, X.; Wang, J.; Yang, T.; Wang, H. DeFi: Robust Training-Free Device-Free Wireless Localization With WiFi. IEEE Trans. Veh. Technol. 2018, 67, 8822–8831. [Google Scholar] [CrossRef]
  29. Pu, Q.; Gupta, S.; Gollakota, S.; Patel, S. Whole-home gesture recognition using wireless signals. In Proceedings of the 19th Annual International Conference on Mobile Computing & Networking, Miami, FL, USA, 30 September–4 October 2013. [Google Scholar]
  30. Adib, F.; Katabi, D. See through walls with WiFi. ACM SIGCOMM Comput. Commun. Rev. 2013, 43, 75–86. [Google Scholar] [CrossRef]
  31. Liu, M.; Zhang, L.; Yang, P.; Lu, L.; Gong, L. Wi-Run: Device-free step estimation system with commodity Wi-Fi. J. Netw. Comput. Appl. 2019, 143, 77–88. [Google Scholar] [CrossRef]
  32. Li, F.; Al-qaness, M.A.A.; Zhang, Y.; Zhao, B.; Luan, X. A Robust and Device-Free System for the Recognition and Classification of Elderly Activities. Sensors 2016, 16, 2043. [Google Scholar] [CrossRef] [Green Version]
  33. Dong, Z.; Li, F.; Ying, J.; Pahlavan, K. Indoor Motion Detection Using Wi-Fi Channel State Information in Flat Floor Environments Versus in Staircase Environments. Sensors 2018, 18, 2177. [Google Scholar] [CrossRef] [Green Version]
  34. Yang, X.; Xiong, F.; Shao, Y.; Niu, Q. WmFall: WiFi-based multistage fall detection with channel state information. Int. J. Distrib. Sens. Netw. 2018, 14, 1550147718805718. [Google Scholar] [CrossRef]
  35. Al-qaness, M.A.A. Device-free human micro-activity recognition method using WiFi signals. Geo-Spat. Inf. Sci. 2019, 22, 128–137. [Google Scholar] [CrossRef]
  36. Lv, J.; Man, D.; Yang, W.; Gong, L.; Du, X.; Yu, M. Robust Device-Free Intrusion Detection Using Physical Layer Information of WiFi Signals. Appl. Sci. 2019, 9, 175. [Google Scholar] [CrossRef] [Green Version]
  37. Wang, T.; Yang, D.; Zhang, S.; Wu, Y.; Xu, S. Wi-Alarm: Low-Cost Passive Intrusion Detection Using WiFi. Sensors 2019, 19, 2335. [Google Scholar] [CrossRef] [PubMed] [Green Version]
  38. Ding, E.; Li, X.; Zhao, T.; Zhang, L.; Hu, Y. A Robust Passive Intrusion Detection System with Commodity WiFi Devices. J. Sens. 2018, 2018, 8243905. [Google Scholar] [CrossRef]
  39. Al-qaness, M.A.A.; Li, F. WiGeR: WiFi-Based Gesture Recognition System. ISPRS Int. J. Geo-Inf. 2016, 5, 92. [Google Scholar] [CrossRef] [Green Version]
  40. Fu, Z.; Xu, J.; Zhu, Z.; Liu, A.X.; Sun, X. Writing in the Air with WiFi Signals for Virtual Reality Devices. IEEE Trans. Mob. Comput. 2019, 18, 473–484. [Google Scholar] [CrossRef]
  41. Tian, Z.; Wang, J.; Yang, X.; Zhou, M. WiCatch: A Wi-Fi Based Hand Gesture Recognition System. IEEE Access 2018, 6, 16911–16923. [Google Scholar] [CrossRef]
  42. Jia, W.; Peng, H.; Ruan, N.; Tang, Z.; Zhao, W. WiFind: Driver Fatigue Detection with Fine-Grained Wi-Fi Signal Features. IEEE Trans. Big Data (Early Access) 2018. [Google Scholar] [CrossRef]
  43. Duan, S.; Yu, T.; He, J. WiDriver: Driver Activity Recognition System Based on WiFi CSI. Int. J. Wirel. Inf. Netw. 2018, 25, 146–156. [Google Scholar] [CrossRef]
  44. Arshad, S.; Feng, C.; Elujide, I.; Zhou, S.; Liu, Y. SafeDrive-Fi: A Multimodal and Device Free Dangerous Driving Recognition System Using WiFi. In Proceedings of the 2018 IEEE International Conference on Communications (ICC), Kansas City, MO, USA, 20–24 May 2018. [Google Scholar]
  45. Halperin, D.; Hu, W.; Sheth, A.; Wetherall, D. Tool release: Gathering 802.11n traces with channel state information. ACM SIGCOMM Comput. Commun. Rev. 2011, 41, 53. [Google Scholar] [CrossRef]
  46. Sen, S.; Radunovic, B.; Choudhury, R.R.; Minka, T. You are facing the Mona Lisa: Spot localization using PHY layer information. In Proceedings of the ACM 10th International Conference on Mobile Systems, Applications, and Services, Lake District, UK, 25–29 June 2012. [Google Scholar]
  47. Wang, Y.; Wu, K.; Ni, L.M. WiFall: Device-Free Fall Detection by Wireless Networks. IEEE Trans. Mob. Comput. 2016, 16, 581–594. [Google Scholar] [CrossRef]
  48. Feng, C.; Arshad, S.; Yu, R.; Liu, Y. Evaluation and Improvement of Activity Detection Systems with Recurrent Neural Network. In Proceedings of the 2018 IEEE International Conference on Communications (ICC), Kansas City, MO, USA, 20–24 May 2018. [Google Scholar]
  49. Wang, W.; Liu, A.X.; Shahzad, M.; Ling, K.; Lu, S. Device-Free Human Activity Recognition Using Commercial WiFi Devices. IEEE J. Sel. Areas Commun. 2017, 35, 1118–1131. [Google Scholar] [CrossRef]
  50. Arshad, S.; Feng, C.; Liu, Y.; Hu, Y.; Yu, R.; Zhou, S. Wi-chase: A WiFi based human activity recognition system for sensorless environments. In Proceedings of the 2017 IEEE 18th International Symposium on a World of Wireless, Mobile and Multimedia Networks (WoWMoM), Macau, China, 12–15 June 2017. [Google Scholar]
  51. Wu, C.T.; Dillon, D.G.; Hsu, H.C.; Huang, S.; Barrick, E.; Liu, Y.H. Depression Detection Using Relative EEG Power Induced by Emotionally Positive Images and a Conformal Kernel Support Vector Machine. Appl. Sci. 2018, 8, 1244. [Google Scholar] [CrossRef]
Figure 1. System architecture.
Applsci 09 05268 g001
Figure 2. Implementation of weighted moving average (WMA) on single subcarrier.
Applsci 09 05268 g002
Figure 3. Variance of different subcarriers for the same gesture.
Applsci 09 05268 g003
Figure 4. Confusion matrix of activity recognition using our proposed algorithm. (a) Scenario-I. (b) Scenario-II. (c) Scenario-III.
Applsci 09 05268 g004
Figure 5. Precision, recall and F-1 score. (a) Scenario-I. (b) Scenario-II. (c) Scenario-III.
Applsci 09 05268 g005
Figure 6. Comparison of accuracy using SRC and MNN separately. (a) Scenario-I. (b) Scenario-II. (c) Scenario-III.
Applsci 09 05268 g006
Figure 7. Comparison of accuracy using KNN-SRC and MNN-SRC. (a) Scenario-I. (b) Scenario-II. (c) Scenario-III.
Applsci 09 05268 g007
Figure 8. Comparison of accuracy using state-of-the-art classifiers. (a) Scenario-I. (b) Scenario-II. (c) Scenario-III.
Applsci 09 05268 g008
Figure 9. Average accuracy using amplitude and phase information. (a) Scenario-I. (b) Scenario-II. (c) Scenario-III.
Applsci 09 05268 g009aApplsci 09 05268 g009b
Figure 10. Effect of nearest neighbors.
Applsci 09 05268 g010
Figure 11. Comparison of execution time.
Applsci 09 05268 g011
Figure 12. Accuracy test using leave-one-participant-out cross-validation (LOPO-CV) scheme. (a) Scenario-I. (b) Scenario-II. (c) Scenario-III.
Applsci 09 05268 g012
Table 1. Proposed gestures utilized for different secondary tasks.
Gesture TypeGesture PerformedAssociated TaskGesture Label
Hand GestureSwipe left(+) Change channelSL
Swipe right(−) Change channelSR
Hand going up(+) VolumeHU
Hand going down(−) VolumeHD
FlickZoom inFK
GrabZoom outGB
Push hand forward(+) Temperature settingPF
Pull hand backward(−) Temperature settingPB
Rotate hand clock-wise(+) Fan speedRC
Rotate hand anti-clock-wise(−) Fan speedRA
Finger GestureSwipe VOpen functionSV
Swipe XClose functionSX
Swipe +Play next trackSP
Swipe −Play previous trackSN
Head GestureHead tilting downPick phone callHM
Head tilting rightDo not pick callHR
Table 2. Features test result.
Feature TypeGesture Class
SLSRHUHDFKGBPFPBRCRASVSXSPSNHMHR
μ 1.541.330.810.741.422.162.253.520.960.911.631.492.281.712.132.66
σ 0.730.960.680.661.891.971.201.140.620.761.271.351.731.161.811.46
M A D 0.480.640.450.431.371.310.830.760.410.500.840.901.150.731.210.97
M A X 3.583.975.886.318.246.047.739.028.856.574.967.225.946.397.635.99
P 25 t h 0.690.600.270.370.580.820.981.220.350.440.640.510.770.650.950.91
P 75 t h 2.111.830.860.921.762.572.933.711.011.341.951.552.351.982.882.73
Table 3. Performance evaluation for each gesture.
ExperimentGestureSLSRHUHDFKGBPFPBRCRASVSXSPSNHMHR
Scenario-ITPR (%)92.791.095.996.989.089.187.485.689.390.193.888.287.696.895.096.0
FNR (%)7.39.04.13.111.010.912.614.410.79.96.211.812.43.25.04.0
Scenario-IITPR (%)94.695.896.793.089.789.185.086.486.987.688.290.087.593.793.193.9
FNR (%)5.44.23.37.010.310.915.013.613.112.411.810.012.56.36.96.1
Scenario-IIITPR (%)92.592.793.692.886.786.586.782.985.184.689.988.080.491.694.893.0
FNR (%)7.57.36.47.213.313.513.317.114.915.410.112.019.68.45.27.0
Table 4. Comparison of accuracy with state-of-the-art classification methods.
ExperimentAverage Recognition Accuracy (%)
NBSVMKNNMNNSRCKNN-SRCMNN-SRC
Scenario-I85.988.587.187.589.590.791.4
Scenario-II84.186.685.486.28890.190.6
Scenario-III82.585.184.384.586.688.188.7
Table 5. Classification accuracy (%) of MNN-SRC with varying K.
K ValueGesture Class
SLSRHUHDFKGBPFPBRCRASVSXSPSNHMHR
K = 188.390.590.489.387.187.788.387.991.489.390.690.192.390.396.094.5
1 < K < 5 <88.8<90.8<91.8<90.5<87.7<88.6<89.2<88.2<91.8<90.4<89.5<90.3<91.9<90.1<95.8<94.7
K = 589.291.093.191.788.389.490.188.592.191.590.190.292.190.295.994.6
5 < K < 10 <89.2<90.8<92.8<91.7<88.7<89.1<89.8<88.2<92.0<90.9<90.4<89.7<92.0<89.5<94.7<94.1
K = 1089.190.692.491.689.188.889.587.991.890.289.389.591.289.195.394.0
10 < K < 15 <88.7<90.9<92.7<92.0<89.0<89.3<89.8<87.7<92.1<90.4<90.0<90.0<91.9<89.8<95.5<94.4
K = 1588.291.193.092.388.989.890.187.592.390.590.290.192.089.895.795.1
15 < K < 20 <88.6<91.3<93.4<92.7<89.1<89.8<90.2<88.1<92.4<90.6<90.7<89.8<92.2<89.5<95.6<95.2
K = 2088.991.493.793.189.289.790.388.692.490.791.189.692.389.695.995.2
20 < K < 25 <89.4<91.3<93.4<93.0<89.4<89.4<90.5<87.9<92.2<90.5<90.2<89.9<92.6<90.1<96.0<94.6
K = 2589.891.193.192.889.689.190.687.292.090.490.289.792.089.895.694.6
25 < K < 30 <89.0<91.1<93.0<92.4<89.7<88.8<89.9<87.5<92.1<90.3<90.1<89.9<92.2<89.7<95.0<94.8
K = 3088.291.092.891.989.788.589.187.792.290.390.289.992.189.895.494.7
30 < K < 40 <88.5<90.9<92.7<91.8<89.4<88.3<88.8<87.5<92.4<90.3<89.9<89.6<91.8<89.8<95.6<94.3
K = 4088.790.892.691.789.188.188.587.392.590.388.389.191.689.595.393.9
40 < K < 50 <88.5<90.5<91.5<91.0<88.3<87.6<88.1<87.2<91.5<89.7<88.1<89.0<91.3<88.7<94.9<94.6
K = 5088.390.190.390.287.487.187.787.090.489.188.288.791.188.394.593.7

