Article

Geo-Sensor Framework and Composition Toolbox for Efficient Deployment of Multiple Spatial Context Service Platforms in Sensor Networks

Department of Computer Engineering, Jeju National University, Jeju 63243, Korea
*
Author to whom correspondence should be addressed.
Appl. Sci. 2019, 9(23), 4993; https://doi.org/10.3390/app9234993
Submission received: 11 October 2019 / Revised: 5 November 2019 / Accepted: 6 November 2019 / Published: 20 November 2019
(This article belongs to the Special Issue Recent Advances in Geographic Information System for Earth Sciences)

Abstract

:
Geo-sensor is the term used for the deployment of a wireless sensor network (WSN) in a real environment, which can be a hideous task due to many influential variables in a given environment. The spatial context of a sensor in a smart environment can be of huge significance and can also play an important role in improving the smart services provision. In this work, we propose a DIY geo-sensor framework and data composition toolbox for the deployment of sensors data in smart IoT environments along with geographical context. A geo-sensor framework is deployed, which enables the registration of multiple geo-sensor networks by providing multiple geo-sensor platforms. The framework’s logic is based on the combination of a geo-sensor service registry, geo-sensor composition toolbox, and geo-sensor platforms. A geo-sensor platform provides the content to the toolbox, enabling relaxed real-time geo-sensor data management. Our proposed work is two-fold. Firstly, we propose the design details for the geo-sensor framework and composition toolbox. The proposed design for the geo-sensor framework aims to provide a DIY platform for multiple geo-sensor networks and services deployment, giving access to multiple users resulting in reuse of resources and reduction in deployment costs by avoiding duplicate deployments. Secondly, we implement the proposed design based on RESTful web services and SOAP web services. Performance comparison analysis is then performed among the two web services to find the best suited implementation for given scenarios. The results of the performance analysis prove that RESTful web services are the better choice for ease of implementation, access, and light-weightiness.

1. Introduction

A system designed to integrate and display the spatial data of “things” is called a geographical information system (GIS) [1]. GIS also enables the user to store, edit, analyze, and share the geographical data of a given entity. GIS represents data in a useful and meaningful way for users to understand and utilize, also enabling the users to process large amounts of data. Wireless sensors networks (WSN) produce large amounts of data, which is processed for different purposes and intelligent decision making. Integrating the WSN with GIS can make the task of analyzing the data gathered by WSN more evocative for the users to process and analyze [1].
Geo-sensor is the deployment of a wireless sensor network (WSN) in a real environment, which can be a hideous task due to many influential variables in a given environment. A wireless sensor network is a combination of spatially distributed wireless devices that are deployed to monitor physical or environmental conditions such as temperature, light, sound, and humidity. These wireless devices have sensors to collect data from the surrounding environment and pass the data onto some main location. Each wireless device also has a transmitter and a receiver, which are used to communicate with other wireless devices or gateways within a network. The gateway, also known as middleware, transfers the sensed data to the main location, which logs in the data, and the data is then available to view, process, and analyze via the user interface [2].
Physical sensors from sensor networks are uploaded as virtual sensor objects with sensor profiles created and stored in the databases. These sensor profiles are then used to extract the sensors’ types, values, and environmental scenario contexts along with the geographical contexts based on the physical locations and location based constraints and parameters. The geo-sensing services are then created by combining the sensors’ contextual information and geographical contextual information; based on each systems requirements and scenarios. Figure 1 shows the conceptual overview of the geo-sensor networks’ services formation.
Geo-sensor applications and services are of huge significance and are applied to multiple scenarios and environments based on the contextual information. We can conclude from our literature review study, presented in Section 2, that little effort is made in proposing standard designs for geo-sensor frameworks for multiple geo-sensor network deployment and service creation; where the user gets the freedom of uploading their networks based on multiple locations and contextual information and creating and using the services accordingly.
Such systems where more freedom is given to the users are termed as DIY (do-it-yourself) systems. Recently, DIY approaches for IoT (Internet of Things) applications have gained much hype. The concept of IoT can be simply put as connecting “things”, such as objects and entities, to the internet and making them smart. The concept of DIY was first proposed in 2011 [3], and multiple approaches have been proposed in recent years for DIY virtual services in IoT networks [3,4,5,6,7,8,9,10]. Specifically in the geo-sensing category, not much work has been done for DIY implementation except for one recently started project named as community-centered urban sensing (CCUS) and DIY sensing devices [11], which collects environmental sensing data, visualizes the data and aims to develop customized digital infrastructure for empowering communities for better sensing their environments, and voicing their opinions by taking part in feedback process. The project is still limited in visualization and analysis of sensing data and in its preliminary stages.
Hence, a DIY geo-sensor framework for the deployment of geo-sensor networks, where multiple users could upload their geo-sensor platforms and extend access of use to other users, can pave ways for unlimited potential in geo-sensor applications and research fields.
In this work, we propose a geo-sensor framework that can be used by multiple clients to deploy their own geo-sensor networks, bind their sensor objects to desired locations based on DIY, generate geo-sensor services for the uploaded networks, and manage the services with a geo-sensor composite toolbox. The availability of such a platform will allow the ease of deployment and management for the geo-sensor networks and also the reuse of geo-sensor services. The deployed geo-sensor platform and its services can be reused by authorized users in different scenarios, with the online availability of the geo-sensor framework. This also reduces the deployment cost in scenarios where such deployed networks and services can be reused, as an alternative to additional deployments. It will also reduce the deployment redundancy. The proposed work offers the following novelty points as
  • Ease of deployment for geo-sensor networks based on DIY,
  • Multi-platform geo-sensing services generation,
  • Independent geo-sensor composite toolbox for ease of management,
  • Visualization tool for users,
  • Removing redundancy.
The multiple spatial context service platforms use the sensor profile information and geographical context of the service to create geo-sensor services. We present the detailed system design for the deployment of geo-sensor framework, geo-sensor composition toolbox, and geo-sensor multiple spatial services platforms for the wireless sensor networks. The proposed system is implemented using both the RESTful web services and SOAP web services. RESTful web services allocate URI (Uniform resource identifier) to each resource and use basic CRUD operations over HTTP for making the interface uniform throughout and are simpler to implement.
The rest of the paper is divided as follows; Section 2 gives an overview of related work. Section 3 presents the system design for a geo-sensor framework and multiple platforms deployment based on the geo-sensor framework. In Section 4, the implementation of the proposed framework is presented. In Section 5, we give a performance analysis of a system based on system queries and access times, and Section 6 concludes the paper.

2. Literature Review

The proposed work falls under the category of contextual sensing. All physical objects (e.g., sensors, actuators, things) or human beings have some context attached to them in a given scenario. The context can be defined as “any information that can be used to characterize the situation of an entity [12]. The context of an entity can be either external or internal; external contexts are perceived from the physical environment, such as sensing values from sensors or the location from GPS, whereas internal contexts are customized individual level contexts within a system [13]. In our proposed work, we focus on the external context as our scope is limited to geo-sensing services.
One of the subcategories for applications of geo-sensors is the spatiotemporal contexts based services. The term spatiotemporal means belonging to both space and time; hence, the application of spatiotemporal is not just limited to the extraction and use of physical locations contexts [14,15]. Many studies have been presented based on the applications of spatiotemporal with other attributes added to the given physical locations based on the specific time; such as effect of weather conditions at a given time at a location, such as rainfall on the mobility pattern in a city [16,17], or the effect of environmental conditions, such as air quality on the traffic flow within a city [18]. The work presented in [19], discusses and analyzes the contextual sensing based on integrating contextual information with human and technical geo-sensor information for smart cities. The authors highlight the significance of contextual information and discuss the challenges regarding spatiotemporal contextual information. Three groups of sensors are discussed along with the three dimensions of sensing as data generation, geographic phenomena, and type of sensing. The authors aim to explore the use of geo-sensing capabilities and contextual information integration for the future development of smart cities.
The sensors can be of various types, and, hence, their applications vary depending on the type of sensor and context of the sensor. Common terms used for different sub-types of sensors are mentioned as environmental sensors, mobile sensors, and pervasive sensors and people as sensors [19]. Multiple works based on sensing categories and contextual information has been presented. In environmental sensors, some contextual studies include flood monitoring [20,21], air quality monitoring [22,23,24,25,26], and weather [27,28]. In mobile sensors, some of the contextual studies presented include wearable ambient sensors applications [29,30,31,32,33,34]. In pervasive sensing, some contextual studies include smart-aware environments/homes, assisted living [35,36,37,38,39,40,41,42], healthcare [43,44,45]. In people as sensors, some of the contextual studies include flood monitoring [46,47], sensing platforms for smart cities [48,49,50,51,52,53,54], healthcare [55,56,57,58,59].
Very few studies have presented and proposed the design and implementation of a GIS toolbox. The work presented in [60] proposes an adaptive GIS toolbox for hydrological modeling. In order to increase reusability and portability, the modules are programmed in an object-oriented fashion. The tasks of modeling elements of the hydrological cycle can be done using the toolbox, and it also supports different temporal and spatial scales. The presentation of the spatial, temporal, and geographical data is done using GRASS. The work presented in [61] proposes a landscape genetics GIS toolbox. It maps the genetic landscapes and summarized multiple genetic landscapes. Genetic diversity can be visualized using these tools. Together, these tools create genetic landscape surfaces directly from tables containing genetic distance or diversity data and sample location coordinates, greatly reducing the complexity of building and analyzing these raster surfaces in a Geographic Information System. The work in [62] presents the principal strategies of object-oriented analysis, discusses how the combination with fuzzy methods allows implementing expert knowledge, and describes a representative example for the proposed workflow from remote sensing imagery to GIS. The strategies are demonstrated using the first object-oriented image analysis software on the market, e-Cognition, which provides an appropriate link between remote sensing imagery and GIS. The study in [63], demonstrates that the integration of satellite remote sensing and GIS was an effective approach for analyzing the direction, rate, and spatial pattern of land-use change. The further integration of these two technologies with Markov modeling was found to be beneficial in describing and analyzing land-use change processes. These wireless devices have sensors to collect data from the surrounding environment and pass the data onto some main location. Each wireless device also has a transmitter and receiver, which are used to communicate with other wireless devices or gateway within a network. The gateway, also known as middleware, transfers the sensed data to the main location, which logs in the data, and the data is then available to view, process, and analyze via a user interface. The work in [64], reports an investigation into the application of the integration of remote sensing and geographic information systems (GIS) for detecting urban growth and assessing its impact on surface temperature in the region. Remote sensing techniques were used to carry out land use/cover change detection by using multi-temporal Landsat Thematic Mapper data. Urban growth patterns were analyzed by using a GIS-based modeling approach. The integration of remote sensing and GIS was further applied to examine the impact of urban growth on surface temperatures.

3. Geo-Sensor Framework

In this section, we present our proposed geo-sensor framework’s design and implementation modules along with configurations.
Figure 2 shows the conceptual diagram for the geo-sensor framework for the deployment of multiple platforms. The data collected from the sensor networks is first passed onto the sensor middleware, where the sensor network’s mapping to a dedicated sensor platform is done. Then, the data is passed onto the sensor platform via sensor middleware. Each sensor network’s spatial context is managed at a Geo platform. At the geo-sensor composite toolbox, the assistance for the DIY geo-sensor network’s deployment is provided. Geo-sensor framework integrates the services provided by the geo-sensor composition toolbox and geo-sensor platform to enable the geo-sensor services provision and the network’s visualization for the client end.

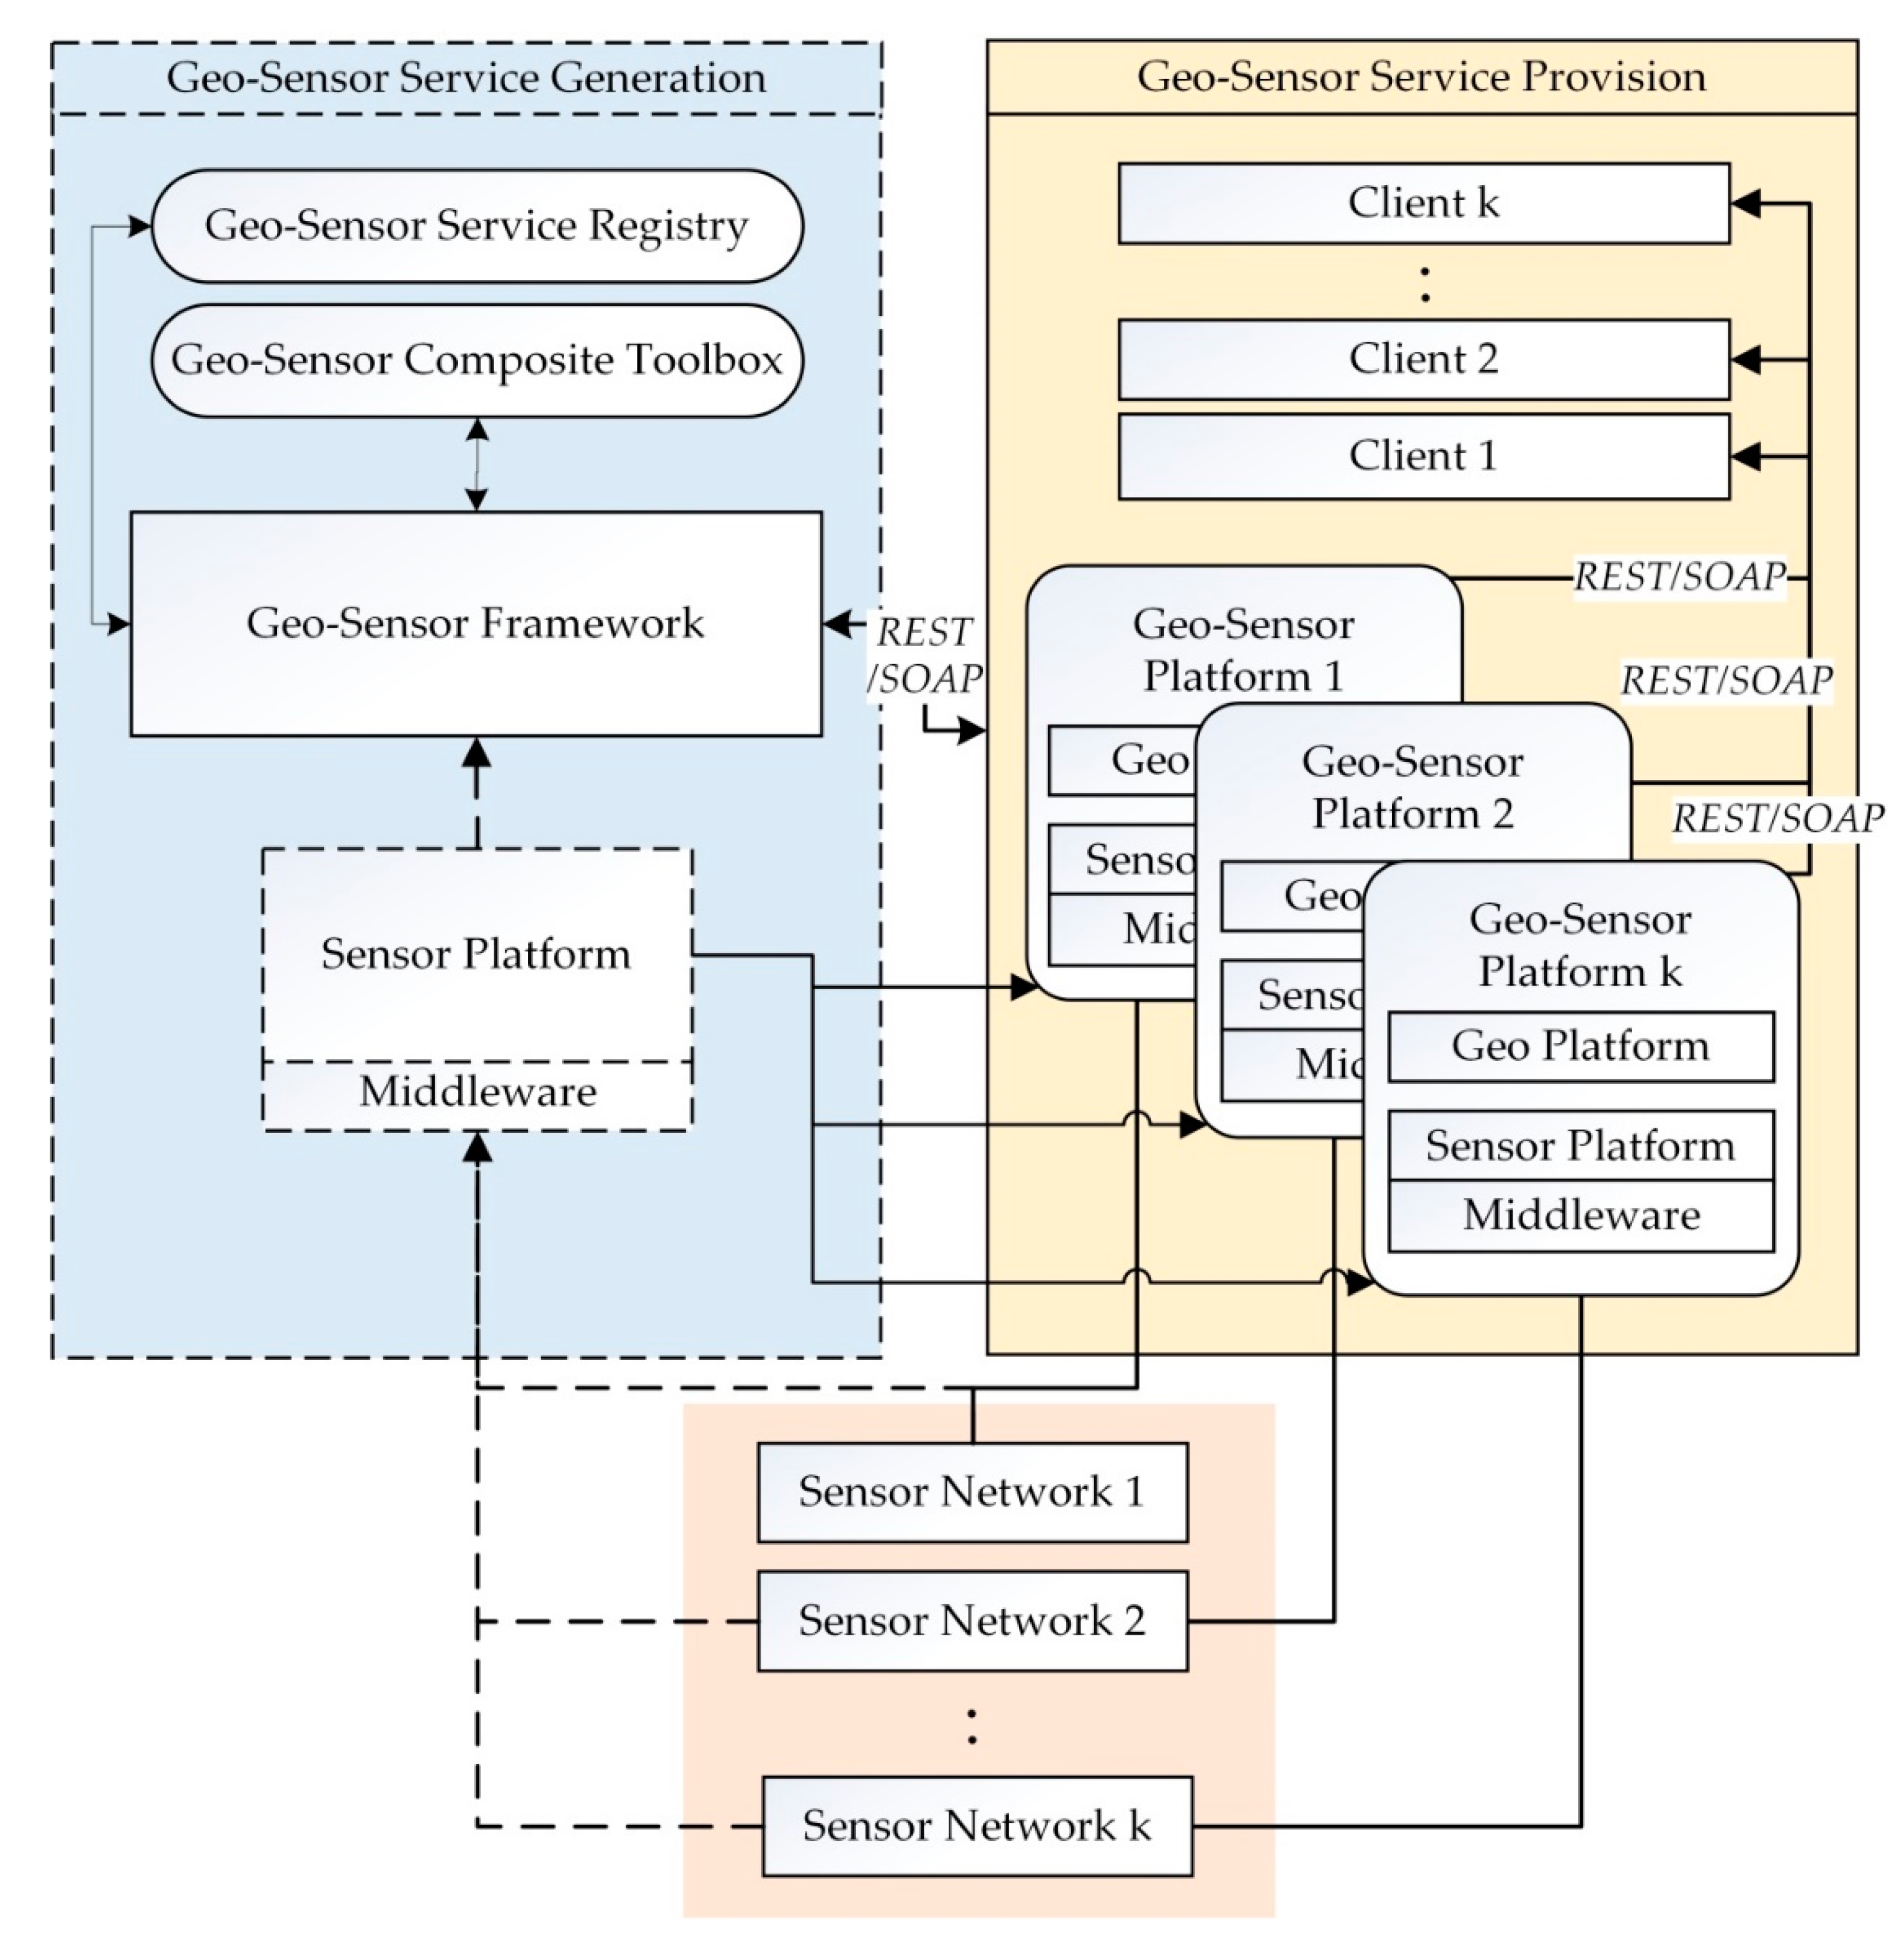
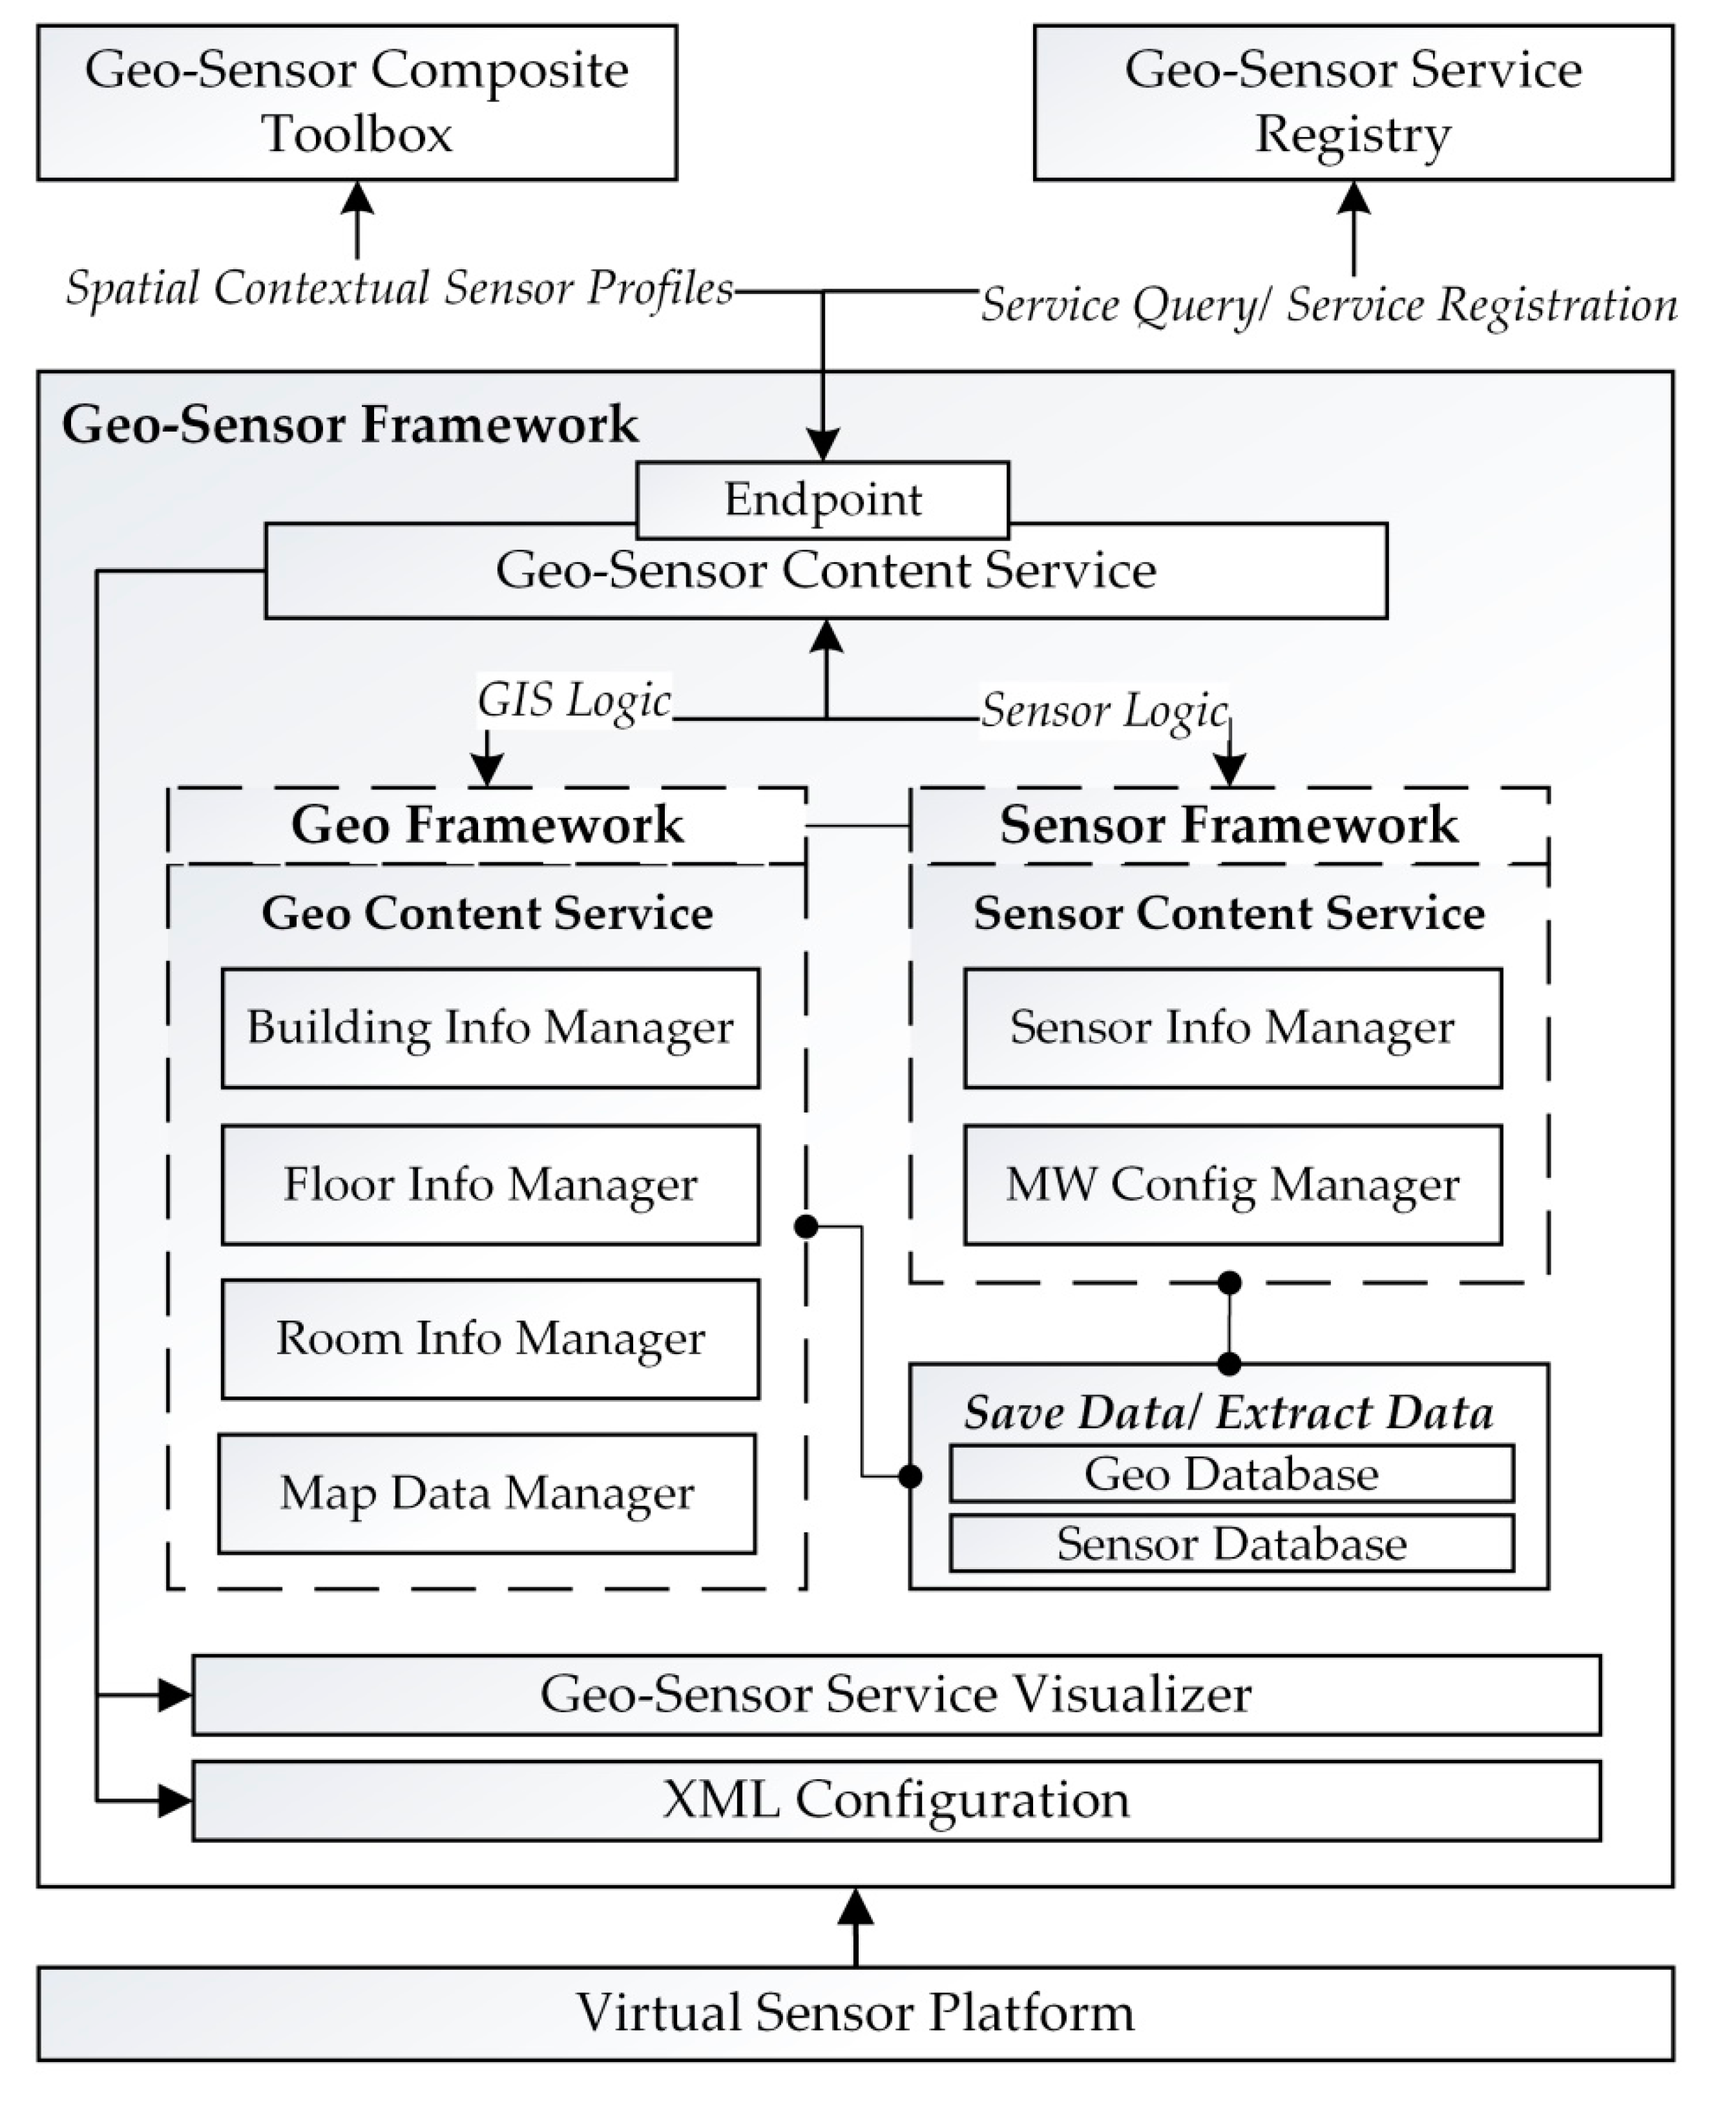
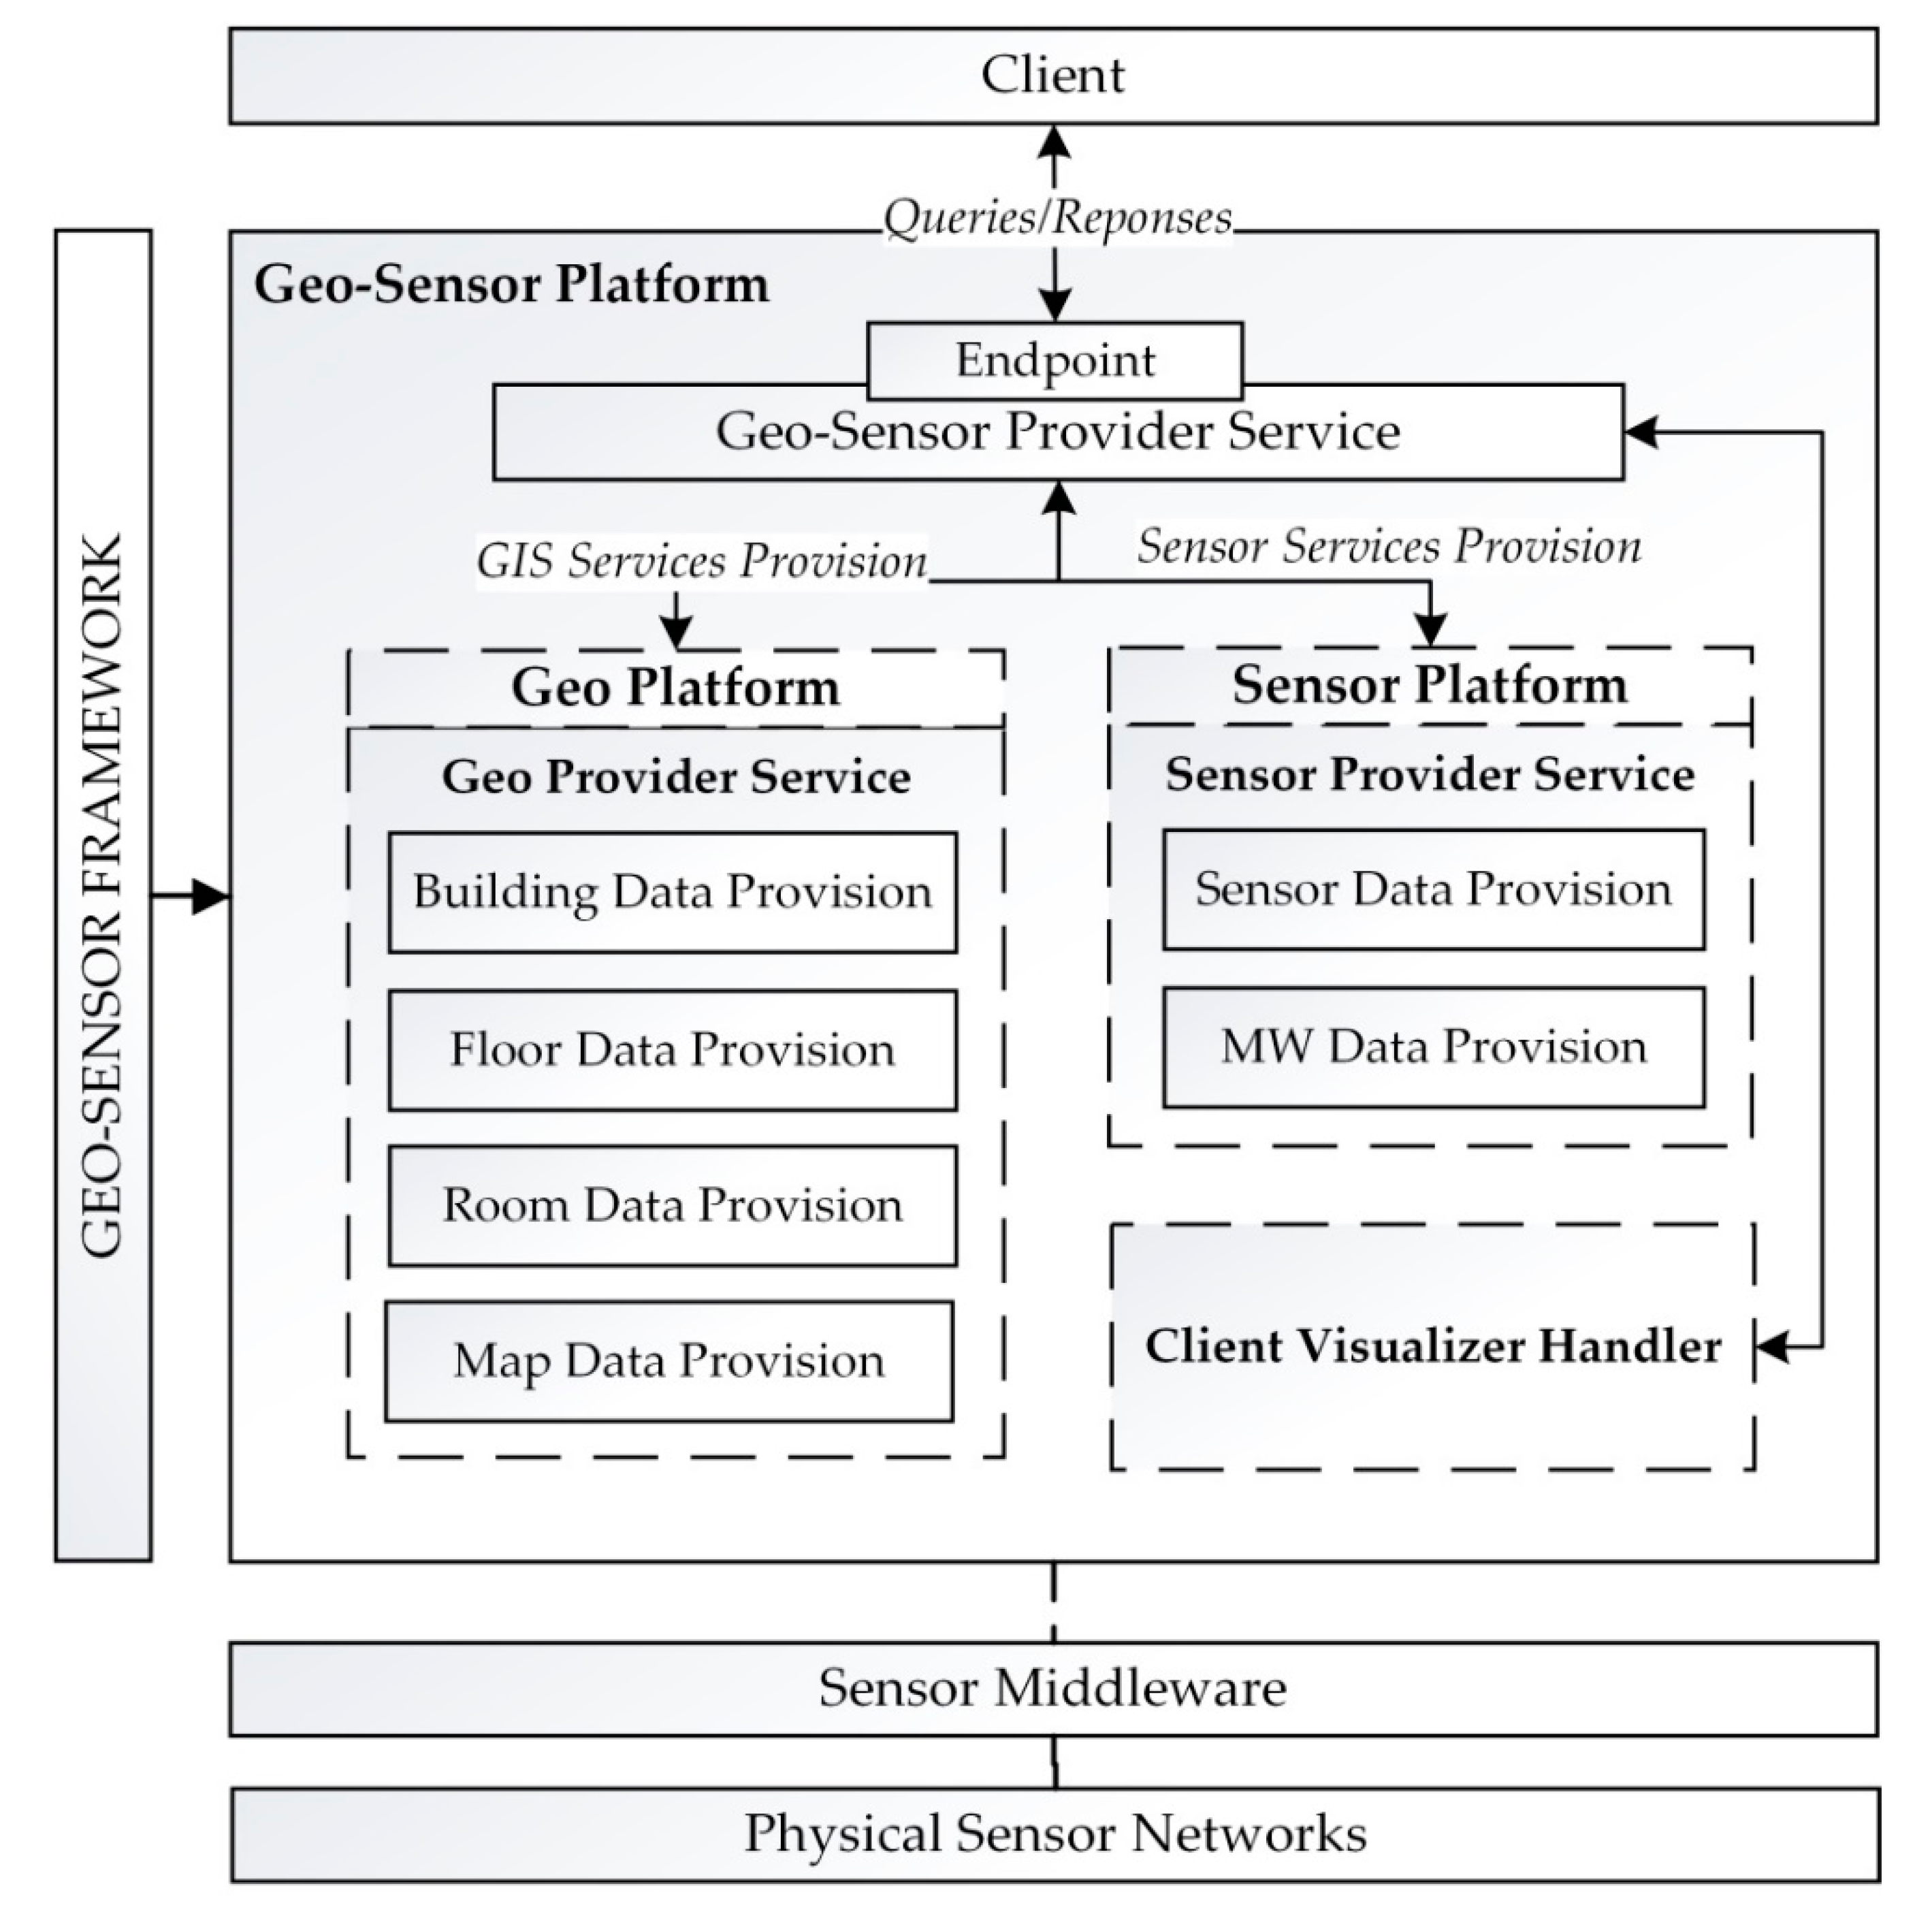
3.1. Geo-Sensor Framework and Geo-Sensor Platform Generation

In this sub-section, we present the system design for our proposed geo-sensor framework and multiple geo-sensor platform generation.
In Figure 3, we present the detailed configurations diagram for the proposed geo-sensor framework module interactions for multiple platform deployment. A geo-sensor framework offers a main service of geo-sensor content service. The geo-sensor content service has logical implementation for sensors involved in the network and geographical context of the sensors provided by sensor content service and geo content service, respectively. The sensor content service offers a sensor information manager and sensor’s middleware configuration manager. The geo-sensor framework has a virtual sensor platform at one end, from where the sensor network’s information is passed to the framework. It creates the sensors networks’ profiles using the geo-sensor composite toolbox, which is later also visualized to the client end for client-level updates. Each time a service is created at the geo-sensor framework, it has to be registered at the geo-sensor service registry to maintain each sensor network’s detailed history log. The geo-sensor framework eventually deploys the multiple geo-sensor platforms for multiple networks by mapping each of the network’s information to its respected platform using the geo and sensor content services, geo-sensor composite toolbox, and geo-sensor service registry.
Geo-sensor content service handles the deployment logic for the spatial context of the sensors in the sensor network. It then maps the spatial contextual information at the geo platform module in and sensor information at the sensor platform in order to generate an integrated geo-sensor platform for the given sensor network. The mapped information at the geo-sensor platform is processed at the geo-sensor composite toolbox for maintaining the spatial context-based sensor profile for the sensor networks. Once the spatial context-based profiles are completed, the information mapped onto the geo-sensor platform is ready for the client visualization client services’ provision. The geo-sensor provider service at the geo-sensor platform handles the GIS service provision deployed at the geo platform sub-module and sensor service provision deployed at the sensor platform sub-module. The integrated logic of both the sub-modules enables the geo-sensor profile visualization and service provision to the client; for the spatial context-based sensor networks’ profile queries (Figure 4).
Figure 5 depicts the flowchart for the generation of the geo-sensor platform. Firstly, the sensor network addition request is made by the client. Once the sensor addition request is made, the middleware allocation to the sensors involved in the network is done. The physical sensors ID mappings are done to the virtually generated IPs. Next, the spatial context profile for each sensor involved in the network is created. The spatial context-based profiles include the sensor model and type information as well as the sensor’s geographical information. After creating the profiles, the content services are registered at the service registry, and, finally, the geo-sensor platform for the added sensor network is deployed, along with the services provision, at the client view.
Figure 6 shows the sequence diagram for geo-sensor service provision based geo-content service, sensor content service, geo provision service, and content provision service. The sensor data is passed onto the content service via sensor middleware. First, the middleware configurations are performed, and then sensor readings, after a certain interval, are sent to the sensor platform. The client query regarding sensor network is passed onto the sensor provision service under a geo-sensor platform, and the client query regarding the spatial context of the sensor is passed onto the geo provision service in the geo-sensor platform. The edit queries from the client are passed onto the content service, which interacts with the geo-sensor toolbox and performs the edit operations and sends a response back.

3.2. Geo-Sensor Composite Toolbox

In this sub-section, we present the geo-sensor composite toolbox module of the proposed system.
The geo-sensor composite toolbox has a vital role in the overall system. It provides the basic functionalities, which enable the client to add a sensor network along with its’ geo-spatial context and also manages the network remotely. It has three functioning sub-modules as geo-sensor information manager, middleware information manager, and service information publishing (Figure 7). The geo-sensor information manager generates the spatial contextual based sensor profile for the sensor network and creates the geo-sensor profile handler for the content services access in the geo-sensor framework. The middleware manager generates the middleware mapping information for each sensor platform and creates the access handler for the geo-sensor framework. Service information publishing generates the service scripts for each added sensor network.
A geo-sensor profile is composed of building information, floor information, and room information with marks on a map image representing the geographical location of the physically installed sensors. It also contains the physical sensor mappings for the virtual platforms and detailed sensor information. The geo-sensor profile provides the geo-sensor query functionalities as add geo-sensor network data, access geo-sensor network data, update geo-sensor network data, or delete geo-sensor network data.
Figure 8 shows the sensor database entity relationship diagram. In the sensor database, we have sensor information, sensor type information, sensing data, sensing list, sensing category, and middleware information. Sensor_Information table saves sensor information. Sensing_List table saves the sensor’s sensing type. Sensing_Category table saves detailed information about sensing type. Type_Information table saves the sensor’s type. Sensing_Data table saves sensing data.
Figure 9 shows the geo database entity relationship diagram. In the geo database, we have map information, map percent information, map data, building information, building mark, floor information, floor percent, room information, and room mark. Map_Informaiton table saves total map information (map size, minimap, minimap size, etc.). Percent_Information table saves the percent image information for the total map image (10%–100% reduced total map image size information). Map_Data table saves the total map image data. Building_Information table saves building information. Building_Mark table saves building area information. Floor_Information table saves floor map (map size, minimap, minimap size, etc.). Floor_Percent table saves the percent image information for floor map image (10%–100% reduced floor map image size information). Floor_Data table saves floor map data. Room_Information table saves room information. Room_Mark table saves room area information.

4. Implementation

In this section, we implement the proposed architecture for the geo-sensor framework and multi-platform deployment. The sub-sections below illustrate the implementation environment, APIs (Application Program Interface) developed for the platforms, system implementation output, and benchmarking environment.

4.1. Implementation Environment

The implementation environment is shown below in Table 1. We have implemented RESTful based web-services on the windows net framework and web-based application client.

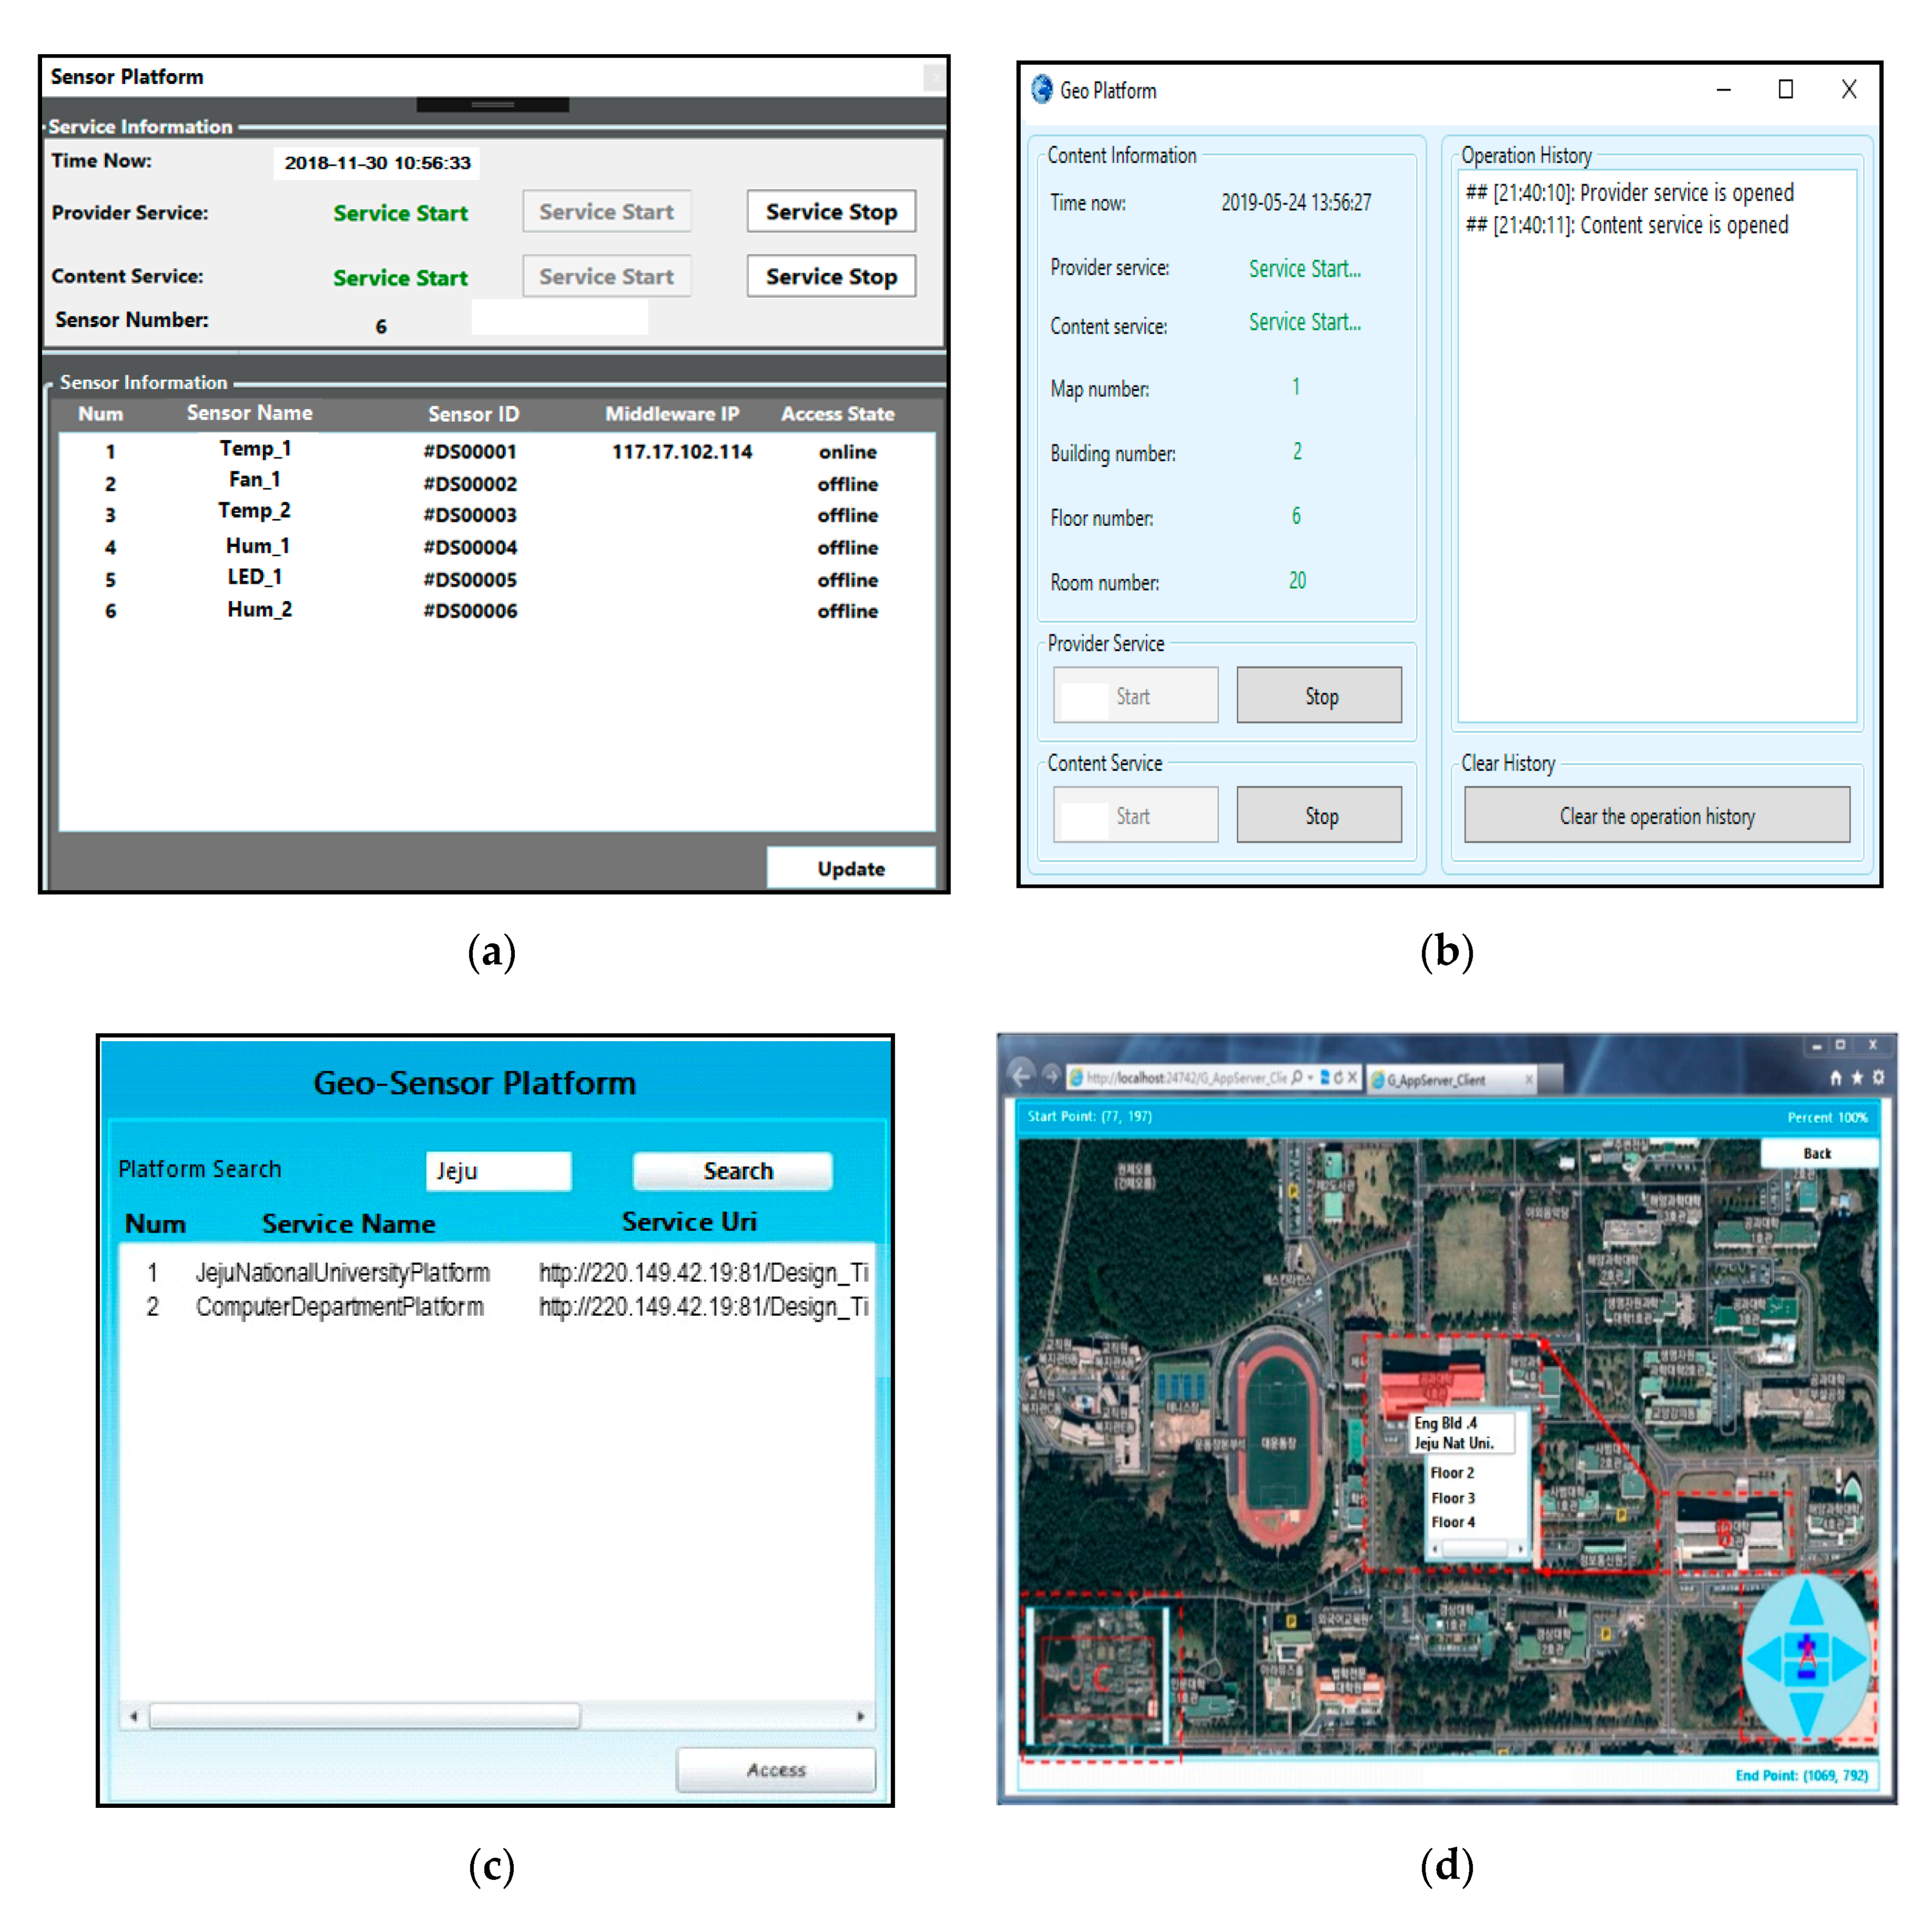
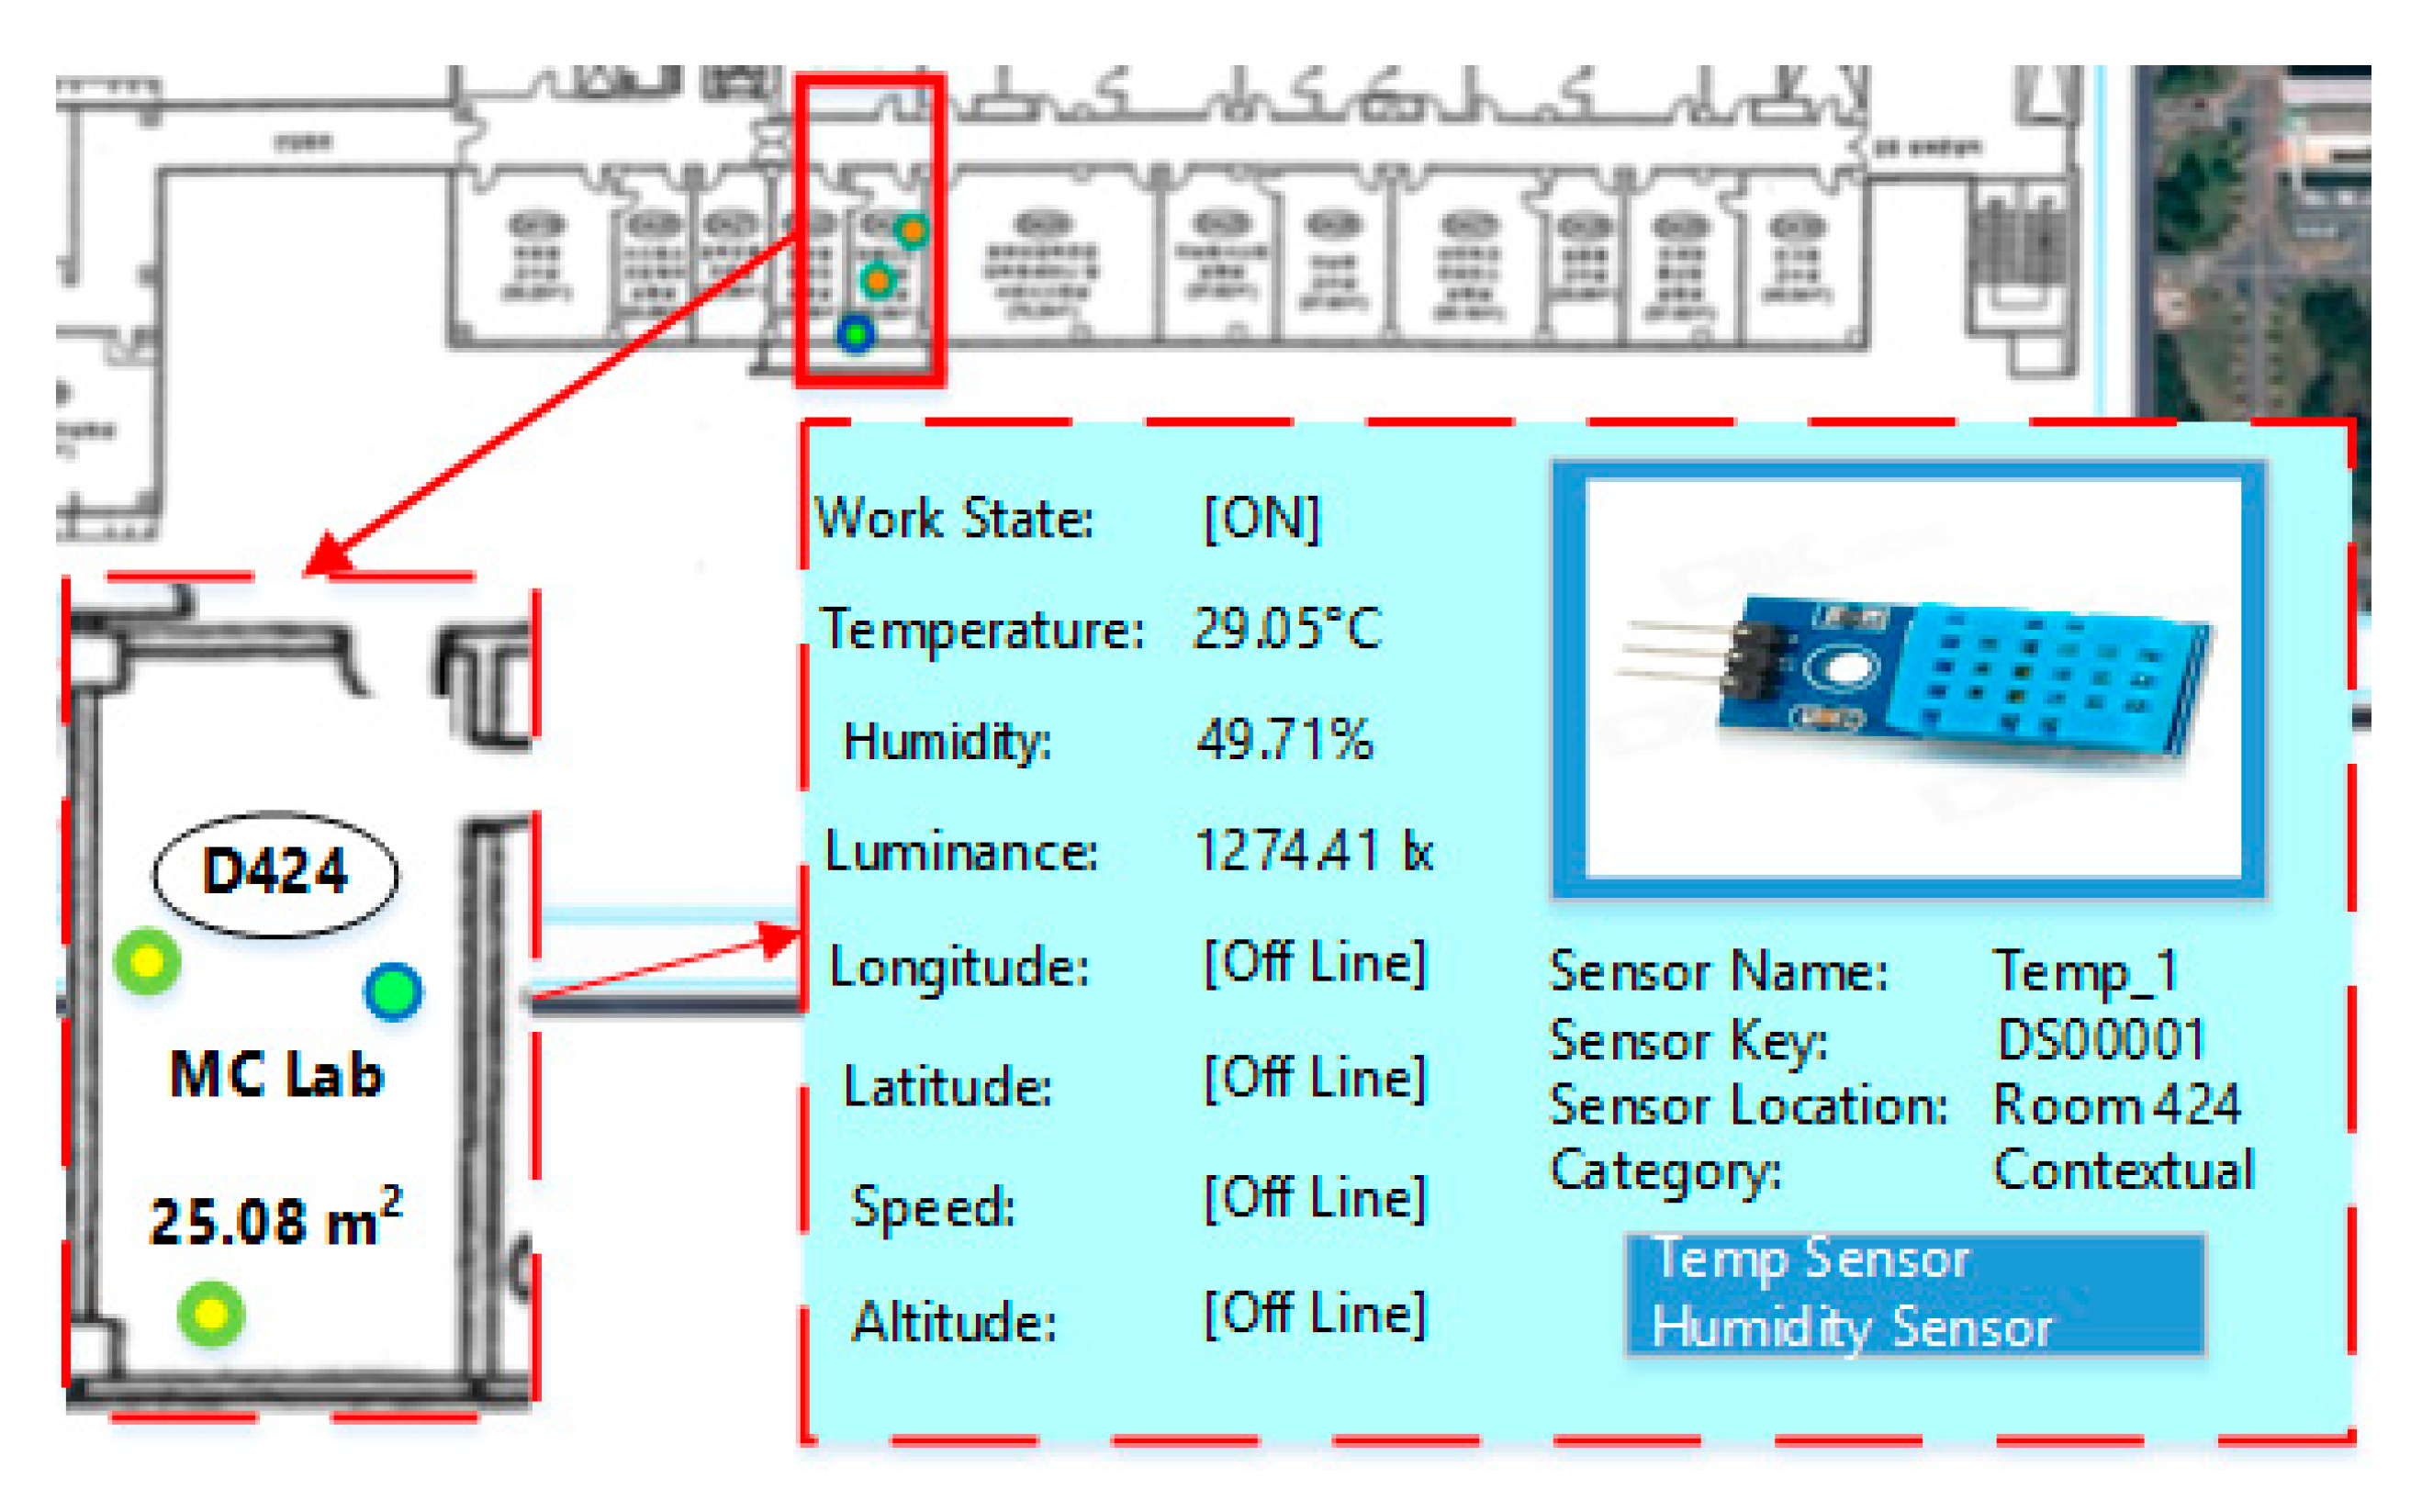
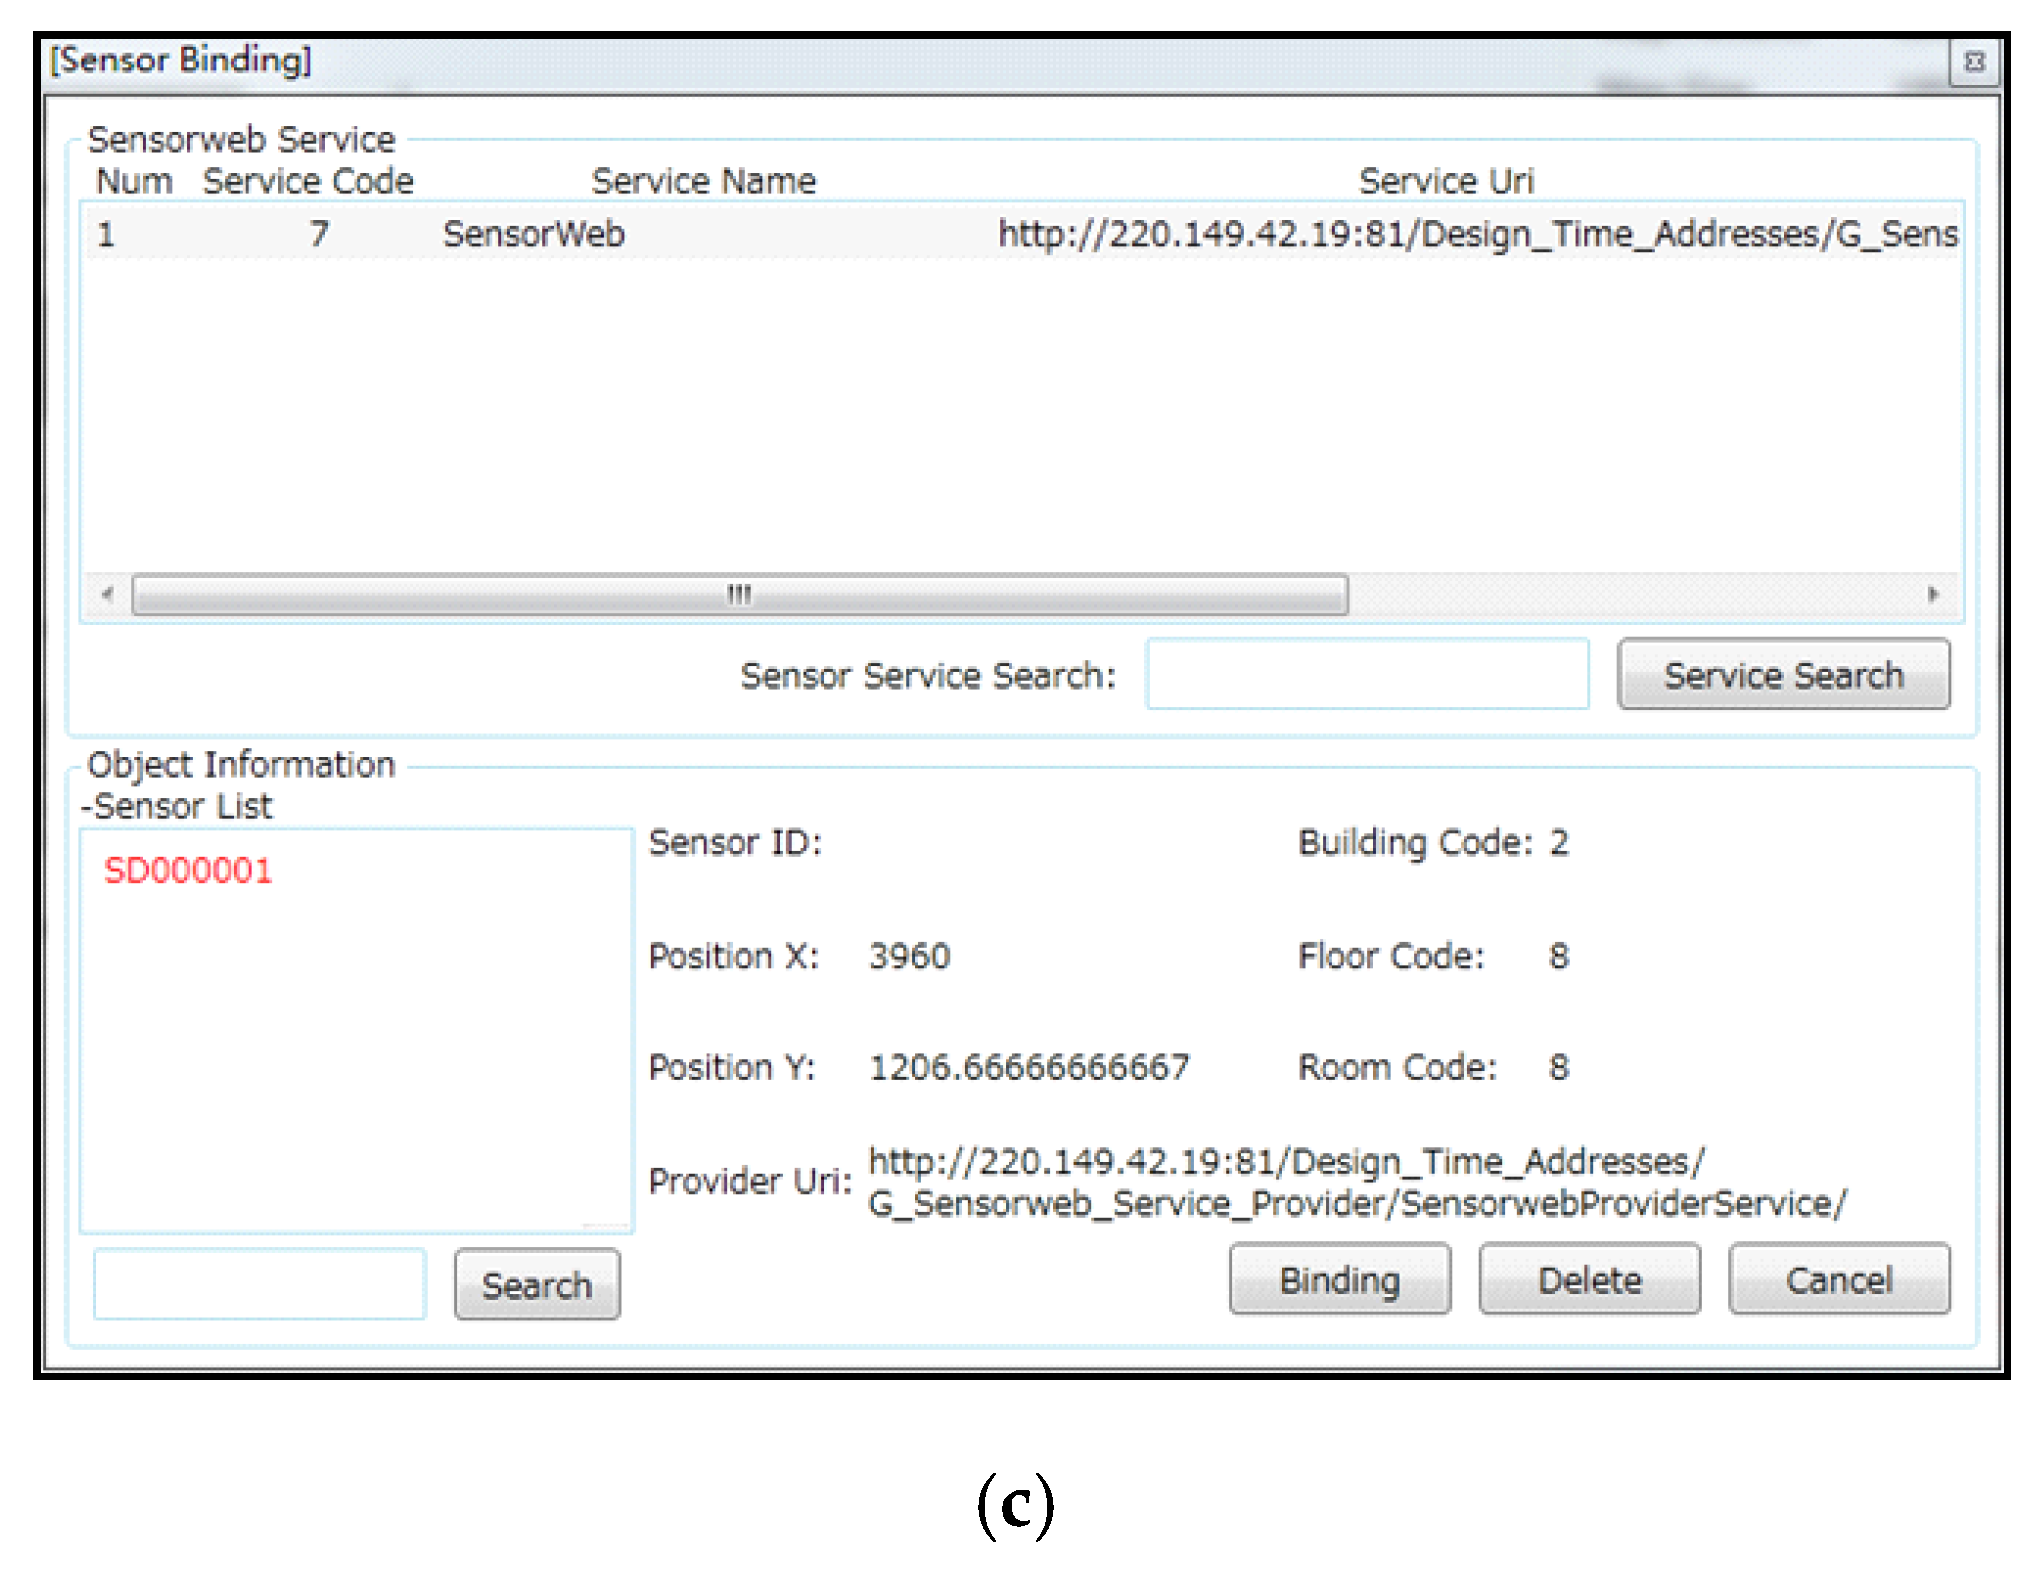
4.2. Implemented System Output

In this sub-section, we present the implementation results of our proposed geo-sensor framework and platform deployment based on the geo-sensor composite toolbox.
In Figure 10a, the execution screen for the sensor platform’s sub-module is presented, while in Figure 10b, the execution screen for the geo platform’s sub-module is presented. In Figure 10c, the geo-sensor framework’s deployed available geo-sensor platforms’ list is given. Figure 10d shows the geo-sensor platform screen after the selection of the “computer department platform” in Figure 10c. The geo-sensor platform screen shown in Figure 10d has a full map view of the Jeju National University with a selected department highlighted to navigate through its floor for accessing to geo-sensor provision services.
Once a geo-sensor platform is selected, as shown in Figure 10c, the client can either view its geographical based sensor details or head to the composition toolbox. Figure 11 shows the spatial context-based visualization of installed sensors at the selected geographical location. Once the client selects onto a specific sensor placed at a specific location onto the map, the client can view detailed sensor information, such as sensor name, sensor key, sensor location, sensor work state, and the sensor’s current readings.
Figure 12 shows the geo-sensor composite toolbox execution screen for building information management (Figure 12a) and floor information management (Figure 12b). The composition toolbox enables services for making changes, such as the addition of new sensors network, deletion of sensor or map data, or updating of sensor or map data. Figure 12a shows the building information management screen where the client can get overall building information, such as building map information or the building’s floor information. In order to navigate to a particular floor, the client would select the floor number from the building map, as shown in the highlighted region A in Figure 12a. After selecting the floor number, the client would navigate to the floor information management, as shown in Figure 12b. Within floor information management is detailed room-wise floor information along with available sensors in each room. Upon clicking a room, the client would get the option to bind a sensor onto the selected location. On clicking the binding sensor option, the client would navigate to the execution screen shown in Figure 12c. The client can bind a new sensor at the selected spot or delete/update an existing one.

5. Analysis Results

In this section, we present the performance analysis and comparisons for our proposed geo-sensor framework for IoT environments. In Section 5.1, we present the analysis for the geo-sensor framework and geo-sensor toolbox performance in terms of response times, upload execution times for virtual objects (VOs) of the sensor, and geo-sensor services access response time.
We have implemented the proposed system based on both SOAP and RESTful web services, and in Section 5.2, we present the comparisons among the RESTful and SOAP web-services based implementations.

5.1. Geo-Sensor Framework Performance

In Figure 13, we evaluate the connection request response time from the geo-sensor framework for selected geo-sensor service visualization. The service visualization will load the geo-sensor network with a loading site map along with the sensors list, details, and available controls. In order to test the geo-sensor service access and visualization response time, multiple access attempts are made to the service. It takes around 231.74 ms to access the service visualization, which seems to be a reasonable amount of time for the proposed scenario.
However, the tested services are for loading the mini-map visualization, sensors involved along with the details of each sensor, sensor images if available, and sensors’ states. For viewing the total map, a separate request is made further.
In Figure 14, we compare the execution time results for the total map size loading process in comparison to the mini-map size loading process.
Now, we test the response time for multiple services access by multiple users at the same time to evaluate the system performance under-load scenario. Figure 15 presents the comparison of the connection request response time made from multiple users to access multiple services at the same time. The service access and visualization have to be loaded for multiple requests simultaneously in this scenario. We have evaluated multiple geo-sensor service access with a varying number of requests and varying number of active services. In the graph below, we can clearly observe that as the load of access requests and active sessions increases, the delay in responses the system witnesses, and, hence, the response time also increases. In our performed evaluation scenarios, the maximum execution time under 51 requests and 10 active users turn out to be around 3880.63 ms, and the average response time for the system under varying load scenarios turn out to be 1558.16 ms. Hence, the system response time under the worst load scenarios have delays up to a maximum of around a little less than 4 s, and on average, with varying load scenarios, remains around 1.5 s. We can safely say that the overall system performance under varying loads is tolerable, considering system service load requirements.

5.2. Performance Comparisons for RESTful and SOAP Based Web Services Implementation

In this sub-section, we evaluate the performance of system operations executed based on RESTful web services in comparison to the execution based on SOAP web services.
In Figure 16, we present the comparison results for geo context-based sensor binding process between RESTful and SOAP implementations. It shows the time taken in order to bind a sensor object onto a geographical location in the specific position of the given map. We can observe a clear difference and decrease in the execution time taken by the RESTful based services as compared to SOAP, which proves the RESTful based implementation to be better in the given scenario.
In Figure 17, we present the map navigation query’s response time comparisons based on pixel movement between the REST and SOAP implementations of the proposed framework. Each time the client navigates the map view, new blocks of maps are loaded depending on the move. It shows the comparison of the experiment results for loading the map move data from the geo sub-module and sensor data onto the moved location from the sensor sub-module. The data from the geo sub-module and the sensor sub-module are loaded via the geo-sensor platform and deployed by the geo-sensor framework. Every time, both the protocols, SOAP and REST, are tested with the same interval of move operation as a move of 100 pixels, 150 pixels, 200 pixels, 250 pixels, 300 pixels, 350 pixels, and 400 pixels. The results in response to each move operation for both the web services implementations are recorded in terms of the response time by the geo-sensor platform. The results clearly show that REST based web services outperform the SOAP based web services.
In this sub-section, we can conclude that REST is better in performance in comparison to SOAP for our application. The REST web services perform better through caching the information, and REST also allows the use of JSON, which provides faster data parsing. With JSON, REST offers better service to the browser uses. Also, our proposed framework is web-based and uses JSON. Table 2 provides a comparison between REST and SOAP web services.

6. Discussion and Conclusions

In this work, we first study the geo-sensor networks and geo-sensor services and present a user flexible DIY geo-sensor framework, which can be used for virtually uploading the geo-sensor networks’ objects and services in the cyber world. The proposed work first focuses on the design of a geo-sensor framework based on multiple sensor platforms and geo platforms instances for the deployment of multiple geo-sensor services to the geo-sensor framework. Every time a user wishes to upload a geo-sensor network to the geo-sensor framework, the user gets dedicated instances of the sensor platform and geo platform for uploading of the geo-sensor network and geo-sensor services. Once uploaded, the authorized users can access the available geo-sensor services via the geo-sensor platform. The proposed framework provides real-time context data management using the geo-sensor composite toolbox. Using such a setup, it is possible to easily add other systems providing sensor nodes and map the information to the geo-sensor platform in order to make the geo-sensor networks easily accessible and manageable.
Many works and projects have been done in geo-sensing, mainly focusing on the goal of collecting real-time spatial and environmental data. Most of these studies relied on volunteers for the data collection process [65,66]. The people-centric sensing involved the data collection done by people carrying mobile sensors to various locations [67]. Many of the proposed approaches were one way or the other, solely for the benefit of specific entities, companies, or organizations trying to carry out research of data collection for their specific purposes. Zhang et al. [11] pointed out this fact and started a DIY project (CUSS) with an aim to involve people in not only the data collection process but also in the decision-making process based on the collected data. The project CUSS is in its initial stages and has limitations in its definitions and applications. The users in CUSS are also not provided with the facilities of creating their own geo-sensor services and managing them via a geo-sensing composite toolbox, instead, the CUSS is currently more focused on data collection by DIY VOs created by users. It provides a sensing visualization for a smart city’s overall environmental picture and smart city decisions. Whereas, we provide a framework that users can use to create their own scenario-based virtual geo-sensor networks by binding the objects as VOs and service creation. Table 3 shows the comparisons of our deployed framework and CUSS.
Further, in this work, we have implemented the geo-sensor services based on the RESTful protocol and SOAP protocol and drawn comparisons among both the web services performance in terms of various operation response times. In Table 4, we present the average performance result comparisons between the REST web services and SOAP web services, and we also take out the average difference between the performances of both services in terms of execution time for various geo-sensor operations evaluated above, such as sensor binding, map navigation, map viewer, and map management. Map management includes the operations of map loading, building map actions, floor map actions, map zoom in, and map zoom out. We can clearly observe from the results that the RESTful web services are better suited and efficient for the deployment of such frameworks with multiple platforms.

Author Contributions

S.M. and D.K. designed the geo-sensor system. S.M. implemented the system and performed experiments and testing. S.M. and D.K. wrote this paper.

Funding

This research was supported by the MSIT(Ministry of Science and ICT), Korea, under the ITRC(Information Technology Research Center) support program(IITP-2019-2014-1-00743) supervised by the IITP(Institute for Information & communications Technology Planning & Evaluation), and This work was supported by Institute for Information & communications Technology Planning & Evaluation(IITP) grant funded by the Korea government(MSIT) (No.2019-0-01456, AutoMaTa: Autonomous Management framework based on artificial intelligent Technology for adaptive and disposable IoT). Any correspondence related to this paper should be addressed to DoHyeun Kim.

Conflicts of Interest

The authors declare no conflict of interest.

References

  1. Ayday, C.; Safak, S. Application of wireless sensor networks with GIS on the soil moisture distribution mapping. In Proceedings of the Symposium GIS Ostrava, Ostrava, Czech Republic, 25–28 January 2009. [Google Scholar]
  2. Aldasouqi, I.; Atoum, J. Stream Processing Environmental Applications in Jordan Valley. Int. J. Comput. Sci. Secur. (IJCSS) 2011, 5, 1. [Google Scholar]
  3. Eddy, N. Gartner: 21 Billion IoT Devices to Invade by 2020—InformationWeek. Available online: http://www.informationweek.com/mobile/mobile-devices/gartner-21-billion-iot-devices-toinvade-by-2020/d/d-id/1323081 (accessed on 1 October 2019).
  4. De Roeck, D.; Slegers, K.; Criel, J.; Godon, M.; Claeys, L.; Kilpi, K.; Jacobs, A. I would DiYSE for it!: A manifesto for do-it-yourself internet-of-things creation. In Proceedings of the 7th Nordic Conference on Human-Computer Interaction: Making Sense through Design, Copenhagen, Denmark, 4–17 October 2012; pp. 170–179. [Google Scholar]
  5. Heath, N. How IBM’s Node-RED Is Hacking Together the Internet of Things. Available online: http://www.techrepublic.com/article/node-red/ (accessed on 1 October 2019).
  6. Quoc, H.N.M.; Serrano, M.; Le-Phuoc, D.; Hauswirth, M. Super stream collider–linked stream mashups for everyone. In Proceedings of the SemanticWeb Challenge Co-Located with ISWC2012, Boston, MA, USA, 11–15 November 2012. [Google Scholar]
  7. Mazzei, D.; Montelisciani, G.; Fantoni, G.; Baldi, G. Internet of Things for designing smart objects. In Proceedings of the 2014 IEEE World Forum on Internet of Things (WF-IoT), Seoul, Korea, 6–8 March 2014; pp. 293–297. [Google Scholar]
  8. Pachube—The Internet of Things Real-TimeWeb Service and Applications. Available online: http://www.appropedia.org/Pachube (accessed on 1 October 2019).
  9. Kefalakis, N.; Soldatos, J.; Anagnostopoulos, A.; Dimitropoulos, P. A Visual Paradigm for IoT Solutions Development. In Model and Data Engineering; Springer Science and Business Media LLC: Berlin, Germany, 2015; Volume 9001, pp. 26–45. [Google Scholar]
  10. Lee, H.; Sin, D.; Park, E.; Hwang, I.; Hong, G.; Shin, D. Open software platform for companion IoT devices. In Proceedings of the 2017 IEEE International Conference on Consumer Electronics (ICCE), Las Vegas, NV, USA, 8–10 January 2017; pp. 394–395. [Google Scholar]
  11. Zhang, Z.; Mondschein, A.; El Khafif, M. Human-Tool Assemblage: Designers in the Big Data World. J. Digit. Landsc. Archit. 2018, 3, 397–405. [Google Scholar] [CrossRef]
  12. Dey, A.K. Understanding and using context. Pers. Ubiquitous Comput. 2001, 5, 4–7. [Google Scholar] [CrossRef]
  13. Hong, J.; Suh, E.H.; Kim, J.; Kim, S. Context-aware system for proactive personalized service based on context history. Expert Syst. Appl. 2009, 36, 7448–7457. [Google Scholar] [CrossRef]
  14. Lukowicz, P.; Choudhury, T.; Gellersen, H. Beyond context awareness. IEEE Pervasive Comput. 2011, 10, 15–17. [Google Scholar] [CrossRef]
  15. Schmidt, A.; Beigl, M.; Gellersen, H.W. There is more to context than location. Comput. Graph. 1999, 23, 893–901. [Google Scholar] [CrossRef]
  16. Sagl, G.; Blaschke, T.; Beinat, E.; Resch, B. Ubiquitous Geo-Sensing for Context-Aware Analysis: Exploring Relationships between Environmental and Human Dynamics. Sensors 2012, 12, 9800–9822. [Google Scholar] [CrossRef]
  17. Cools, M.; Moons, E.; Creemers, L.; Wets, G. Changes in Travel Behavior in Response to Weather Conditions. Transp. Res. Rec. J. Transp. Res. Board 2010, 2157, 22–28. [Google Scholar] [CrossRef]
  18. Merbitz, H.; Buttstädt, M.; Michael, S.; Dott, W.; Schneider, C. GIS-based identification of spatial variables enhancing heat and poor air quality in urban areas. Appl. Geogr. 2012, 33, 94–106. [Google Scholar] [CrossRef]
  19. Sagl, G.; Resch, B.; Blaschke, T. Contextual Sensing: Integrating Contextual Information with Human and Technical Geo-Sensor Information for Smart Cities. Sensors 2015, 15, 17013–17035. [Google Scholar] [CrossRef]
  20. Chang, N.B.; Guo, D.H. Urban flash flood monitoring, mapping and forecasting via a tailored sensor network system. In Proceedings of the IEEE Interantional Conference on Networking, Sensing and Control 2006 (ICNSC’06), Ft. Lauderdale, FL, USA, 23–25 April 2006; pp. 757–761. [Google Scholar]
  21. Horita, F.E.; De Albuquerque, J.P.; Degrossi, L.C.; Mendiondo, E.M.; Ueyama, J. Development of a spatial decision support system for flood risk management in Brazil that combines volunteered geographic information with wireless sensor networks. Comput. Geosci. 2015, 80, 84–94. [Google Scholar] [CrossRef]
  22. Mead, M.; Popoola, O.; Stewart, G.; Landshoff, P.; Calleja, M.; Hayes, M.; Baldovi, J.; McLeod, M.; Hodgson, T.; Dicks, J.; et al. The use of electrochemical sensors for monitoring urban air quality in low-cost, high-density networks. Atmos. Environ. 2013, 70, 186–203. [Google Scholar] [CrossRef]
  23. Resch, B.; Blaschke, T.; Mittlboeck, M. Live geography: Interoperable geo-sensor webs facilitating the vision of digital earth. Int. J. Adv. Netw. Serv. 2010, 3, 323–332. [Google Scholar]
  24. Resch, B.; Mittlboeck, M.; Girardin, F.; Britter, R.; Ratti, C. Live geography—Embedded sensing for standardised urban environmental monitoring. Int. J. Adv. Syst. Meas. 2009, 2, 15–167. [Google Scholar]
  25. De Nazelle, A.; Seto, E.; Donaire-González, D.; Mendez, M.; Matamala, J.; Nieuwenhuijsen, M.J.; Jerrett, M. Improving estimates of air pollution exposure through ubiquitous sensing technologies. Environ. Pollut. 2013, 176, 92–99. [Google Scholar] [CrossRef]
  26. Brienza, S.; Galli, A.; Anastasi, G.; Bruschi, P. A Low-Cost Sensing System for Cooperative Air Quality Monitoring in Urban Areas. Sensors 2015, 15, 12242–12259. [Google Scholar] [CrossRef]
  27. Devaraju, A.; Kauppinen, T. Sensors Tell More than They Sense: Modeling and Reasoning about Sensor Observations for Understanding Weather Events. Int. J. Sens. Wirel. Commun. Control 2012, 2, 14–26. [Google Scholar] [CrossRef]
  28. Muller, C.L.; Chapman, L.; Grimmond, C.S.B.; Young, D.T.; Cai, X. Sensors and the city: A review of urban meteorological networks. Int. J. Clim. 2013, 33, 1585–1600. [Google Scholar] [CrossRef]
  29. Elen, B.; Peters, J.; Poppel, M.; Bleux, N.; Theunis, J.; Reggente, M.; Standaert, A.; Van Poppel, M. The Aeroflex: A Bicycle for Mobile Air Quality Measurements. Sensors 2012, 13, 221–240. [Google Scholar] [CrossRef]
  30. Nakamura, T.; Kikuya, Y.; Arakawa, Y.; Nakamura, M.; Higashijima, Y.; Maruo, Y.Y.; Nakamura, M. Proposal of web framework for ubiquitous sensor network and its trial application using NO2 sensor mounted on bicycle. In Proceedings of the 2012 IEEE/IPSJ 12th International Symposium, Izmir, Turkey, 16–20 July 2012; pp. 83–90. [Google Scholar]
  31. Bossche, J.V.D.; Peters, J.; Verwaeren, J.; Botteldooren, D.; Theunis, J.; De Baets, B. Mobile monitoring for mapping spatial variation in urban air quality: Development and validation of a methodology based on an extensive dataset. Atmos. Environ. 2015, 105, 148–161. [Google Scholar] [CrossRef]
  32. Peters, J.; Bossche, J.V.D.; Reggente, M.; Van Poppel, M.; De Baets, B.; Theunis, J. Cyclist exposure to UFP and BC on urban routes in Antwerp, Belgium. Atmos. Environ. 2014, 92, 31–43. [Google Scholar] [CrossRef]
  33. Thuro, K.; Singer, J.; Festl, J. A Geosensor Network Based Monitoring and Early Warning System for Landslides; Springer Science and Business Media LLC: Berlin, Germany, 2013; pp. 79–86. [Google Scholar]
  34. Chuli, H.; Nengcheng, C. Geospatial sensor web for smart disaster emergency processing. In Proceedings of the 19th International Conference on Geoinformatics 2011, Shanghai, China, 24–26 June 2011; pp. 1–5. [Google Scholar]
  35. Essa, I. Ubiquitous sensing for smart and aware environments. IEEE Wirel. Commun. 2000, 7, 47–49. [Google Scholar] [CrossRef]
  36. Mann, W.; El-Zabadani, H.; Kaddoura, Y.; Helal, S.; King, J.; Jansen, E. The Gator Tech Smart House: A programmable pervasive space. Computer 2005, 38, 50–60. [Google Scholar]
  37. Munoz, A.; Serrano, E.; Villa, A.; Valdés, M.; Botia, J.A. An Approach for Representing Sensor Data to Validate Alerts in Ambient Assisted Living. Sensors 2012, 12, 6282–6306. [Google Scholar] [CrossRef]
  38. Kim, S.C.; Jeong, Y.S.; Park, S.O. Rfid-based indoor location tracking to ensure the safety of the elderly in smart home environments. Pers. Ubiquitous Comput. 2013, 17, 1699–1707. [Google Scholar] [CrossRef]
  39. Palumbo, F.; Ullberg, J.; Štimec, A.; Furfari, F.; Karlsson, L.; Coradeschi, S. Sensor Network Infrastructure for a Home Care Monitoring System. Sensors 2014, 14, 3833–3860. [Google Scholar] [CrossRef]
  40. Forkan, A.; Khalil, I.; Tari, Z. Cocamaal: A cloud-oriented context-aware middleware in ambient assisted living. Future Gener. Comput. Syst. 2014, 35, 114–127. [Google Scholar] [CrossRef]
  41. Garcia, N.M.; Rodrigues, J.J.P. Ambient Assisted Living; CRC Press: Boca Raton, FL, USA, 2015. [Google Scholar]
  42. Bisio, I.; Lavagetto, F.; Marchese, M.; Sciarrone, A. Smartphone-centric ambient assisted living platform for patients suffering from co-morbidities monitoring. IEEE Commun. Mag. 2015, 53, 34–41. [Google Scholar] [CrossRef]
  43. Arnrich, B.; Mayora, O.; Bardram, J.; Tröster, G. Pervasive healthcare. Methods Inf. Med. 2010, 49, 67–73. [Google Scholar] [CrossRef]
  44. Keh, H.C.; Shih, C.C.; Chou, K.Y.; Cheng, Y.C.; Ho, H.K.; Yu, P.Y.; Huang, N.C. Integrating unified communications and internet of m-health things with micro wireless physiological sensors. J. Appl. Sci. Eng. 2014, 17, 319–328. [Google Scholar]
  45. Mukhopadhyay, S.; Postolache, O.A. Pervasive and Mobile Sensing and Computing for Healthcare; Springer: Berlin/Heidelberg, Germany, 2014. [Google Scholar]
  46. Schade, S.; Díaz, L.; Ostermann, F.; Spinsanti, L.; Luraschi, G.; Cox, S.; Nuñez, M.; de Longueville, B. Citizen-based sensing of crisis events: Sensor web enablement for volunteered geographic information. Appl. Geomat. 2013, 5, 3–18. [Google Scholar] [CrossRef]
  47. Poser, K.; Dransch, D. Volunteered geographic information for disaster management with application to rapid flood damage estimation. Geomatica 2010, 64, 89–98. [Google Scholar]
  48. Hayes, J.; Stephenson, M. Bridging the social and physical sensing worlds: Detecting coverage gaps and improving sensor networks. In Proceedings of the First Workshop on Pervasive Urban Applications (PURBA) in Conjunction with the Ninth International Conference on Pervasive Computing, San Francisco, CA, USA, 12–15 June 2011. [Google Scholar]
  49. Tamilin, A.; Carreras, I.; Ssebaggala, E.; Opira, A.; Conci, N. Context-aware mobile crowdsourcing. In Proceedings of the 2012 ACM Conference on Ubiquitous Computing, Pittsburgh, PA, USA, 5–8 September 2012; pp. 717–720. [Google Scholar]
  50. Roitman, H.; Mamou, J.; Mehta, S.; Satt, A.; Subramaniam, L.V. Harnessing the crowds for smart city sensing. In Proceedings of the 1st International Workshop on Multimodal Crowd Sensing, Maui, HI, USA, 29 October–2 November 2012; pp. 17–18. [Google Scholar]
  51. Koch, F.; Cardonha, C.; Gentil, J.M.; Borger, S. A Platform for Citizen Sensing in Sentient Cities. In Computer Vision—ECCV 2012; Springer Science and Business Media LLC: Berlin, Germany, 2013; Volume 7685, pp. 57–66. [Google Scholar]
  52. Doran, D.; Gokhale, S.; Dagnino, A. Human sensing for smart cities. In Proceedings of the 2013 IEEE/Acm International Conference on Advances in Social Networks Analysis and Mining, Niagara, ON, Canada, 25–28 August 2013; pp. 1323–1330. [Google Scholar]
  53. Liao, C.C.; Hou, T.F.; Lin, T.Y.; Cheng, Y.J.; Erbad, A.; Hsu, C.H.; Venkatasubramania, N. Sais: Smartphone augmented infrastructure sensing for public safety and sustainability in smart cities. In Proceedings of the 1st International Workshop on Emerging Multimedia Applications and Services for Smart Cities, Orlando, FL, USA, 3–7 November 2014; pp. 3–8. [Google Scholar]
  54. Evchina, Y.; Puttonen, J.; Dvoryanchikova, A.; Lastra, J.L.M. Context-aware knowledge-based middleware for selective information delivery in data-intensive monitoring systems. Eng. Appl. Artif. Intell. 2015, 43, 111–126. [Google Scholar] [CrossRef]
  55. Pantelopoulos, A.; Bourbakis, N.G. A survey on wearable sensor-based systems for health monitoring and prognosis. IEEE Trans. Syst. Man Cybern. Part C Appl. Rev. 2010, 40, 1–12. [Google Scholar] [CrossRef]
  56. Swan, M. Sensor mania! The internet of things, wearable computing, objective metrics, and the quantified self 2.0. J. Sens. Actuator Netw. 2012, 1, 217–253. [Google Scholar] [CrossRef]
  57. Resch, B.; Summa, A.; Sagl, G.; Zeile, P.; Exner, J.P. Urban emotions—Geo-semantic emotion extraction from technical sensors, human sensors and crowdsourced data. In Progress in Location-Based Services 2014; Springer: Cham, Germany, 2015; pp. 199–212. [Google Scholar]
  58. Garbarino, M.; Lai, M.; Bender, D.; Picard, R.W.; Tognetti, S. Empatica e3—A wearable wireless multi-sensor device for real-time computerized biofeedback and data acquisition. In Proceedings of the 4th International Conference on Wireless Mobile Communication and Healthcare (Mobihealth), Athens, Greece, 3–5 November 2014; pp. 39–42. [Google Scholar]
  59. Resch, B.; Sudmanns, M.; Sagl, G.; Summa, A.; Zeile, P.; Exner, J.P. Crowdsourcing Physiological Conditions and Subjective Emotions by Coupling Technical and Human Mobile Sensors. GI_Forum 2015, 1, 514–524. [Google Scholar] [CrossRef]
  60. Batelaan, O.; Wang, Z.M.; De Smedt, F. An adaptive GIS toolbox for hydrological modelling. IAHS Publ. Ser. Proc. Rep. Intern. Assoc. Hydrol. Sci. 1996, 235, 3–10. [Google Scholar]
  61. Vandergast, A.G.; Perry, W.M.; Lugo, R.V.; Hathaway, S.A. Genetic landscapes GIS Toolbox: Tools to map patterns of genetic divergence and diversity. Mol. Ecol. Resour. 2011, 11, 158–161. [Google Scholar] [CrossRef]
  62. Benz, U.C.; Hofmann, P.; Willhauck, G.; Lingenfelder, I.; Heynen, M. Multi-resolution, object-oriented fuzzy analysis of remote sensing data for GIS-ready information. ISPRS J. Photogramm. Remote Sens. 2004, 58, 239–258. [Google Scholar] [CrossRef]
  63. Weng, Q. Land use change analysis in the Zhujiang Delta of China using satellite remote sensing, GIS and stochastic modelling. J. Environ. Manag. 2002, 64, 273–284. [Google Scholar] [CrossRef] [Green Version]
  64. Weng, Q. A remote sensing–GIS evaluation of urban expansion and its impact on surface temperature in the Zhujiang Delta, China. Int. J. Remote Sens. 2001, 22, 1999–2014. [Google Scholar]
  65. Cuff, D.; Hansen, M.; Kang, J. Urban Sensing: Out of the Woods. Commun. ACM 2008, 51, 24. [Google Scholar] [CrossRef]
  66. Martino, M.; Britter, R.; Outram, C.; Zacharias, C.; Biderman, A.; Ratti, C. Senseable City. Available online: http://www.mamartino.com/images/senseable_city.pdf (accessed on 19 November 2019).
  67. Gabrys, J. Programming Environments: Environmentality and Citizen Sensing in the Smart City. Environ. Plan. D Soc. Space 2014, 32, 30–48. [Google Scholar] [CrossRef] [Green Version]
Figure 1. Conceptual overview of geo-sensor networks and services.
Applsci 09 04993 g001
Figure 2. Geo-sensor framework conceptual diagram for multi-platforms.
Applsci 09 04993 g002
Figure 3. Proposed geo-sensor framework configuration.
Applsci 09 04993 g003
Figure 4. Proposed geo-sensor platform configurations.
Applsci 09 04993 g004
Figure 5. Geo-sensor platform’s generation procedure flowchart.
Applsci 09 04993 g005
Figure 6. Geo-Sensor Service Provision Service Sequence Diagram.
Applsci 09 04993 g006
Figure 7. Geo-sensor composite toolbox configuration.
Applsci 09 04993 g007
Figure 8. Sensor database relationship diagram.
Applsci 09 04993 g008
Figure 9. Geo database relationship diagram.
Applsci 09 04993 g009
Figure 10. Geo-sensor platform service initiation deployed by the geo-sensor framework: (a) sensor platform sub-module; (b) geo platform sub-module; (c) geo-sensor platforms view; (d) selected geo-sensor platform.
Applsci 09 04993 g010
Figure 11. Geo-sensor visualization for Internet of Things (IoT) environments.
Applsci 09 04993 g011
Figure 12. Geo-Sensor composite toolbox execution screen: (a) building information management; (b) floor information management; (c) sensor binding.
Applsci 09 04993 g012aApplsci 09 04993 g012b
Figure 13. Execution time for geo-sensor service visualization and access request.
Applsci 09 04993 g013
Figure 14. Execution time comparisons for loading of total map vs. mini-map.
Applsci 09 04993 g014
Figure 15. Multiple geo-sensor service access analysis with varying number of requests and varying number of active services.
Applsci 09 04993 g015
Figure 16. Execution time comparisons for geo-context based sensor binding.
Applsci 09 04993 g016
Figure 17. Map navigation query based on pixels move request
Applsci 09 04993 g017
Table 1. Implementation environment of this system.
ComponentsVersion
Operation SystemMicrosoft Windows 10 pro (×64)
Microsoft Visual Studio2015
Microsoft SQL Server Management Studio2016
Intel System Studio IoT Edition2017
Putty.exe2014
Yocto Linux2014
Intel Edison with Kit for Arduino2014
Table 2. SOAP web services vs. REST web services.
WorkSOAPREST
StyleProtocolArchitectural style
FunctionFunction drivenData driven
Data FormatXMLDiverse data formats (e.g., JSON, plain text, HTML, XML)
SecurityWS-Security and SSLSSL and HTTPS
BandwidthMore resourcesFewer resources
Data CacheNoYes
Table 3. Operations and services provision comparison from user-level.
WorkBind Geo-Sensor VOsGeo-Sensor Service CreationGeo-Sensor Service ManagementGeo-Sensor Service SharingDIY
Proposed Geo-Sensor FrameworkYesYesYesYesYes
CCUS [12]LimitedLimitedNoLimitedYes
Table 4. Average performance results comparisons between REST and SOAP.
Geo-Sensor OperationAvg. REST Execution (ms)Avg. SOAP Execution (ms)Avg. Difference (ms)
Sensor Binding37.7170.7633.05
Map Navigation71.28158.7187.42
Map Viewer98.1167.7269.62
Map Management65.07115.0850.01

