Flexural and Shear Performance of Prestressed Composite Slabs with Inverted Multi-Ribs

 ,
,  , ,
, , 
Abstract
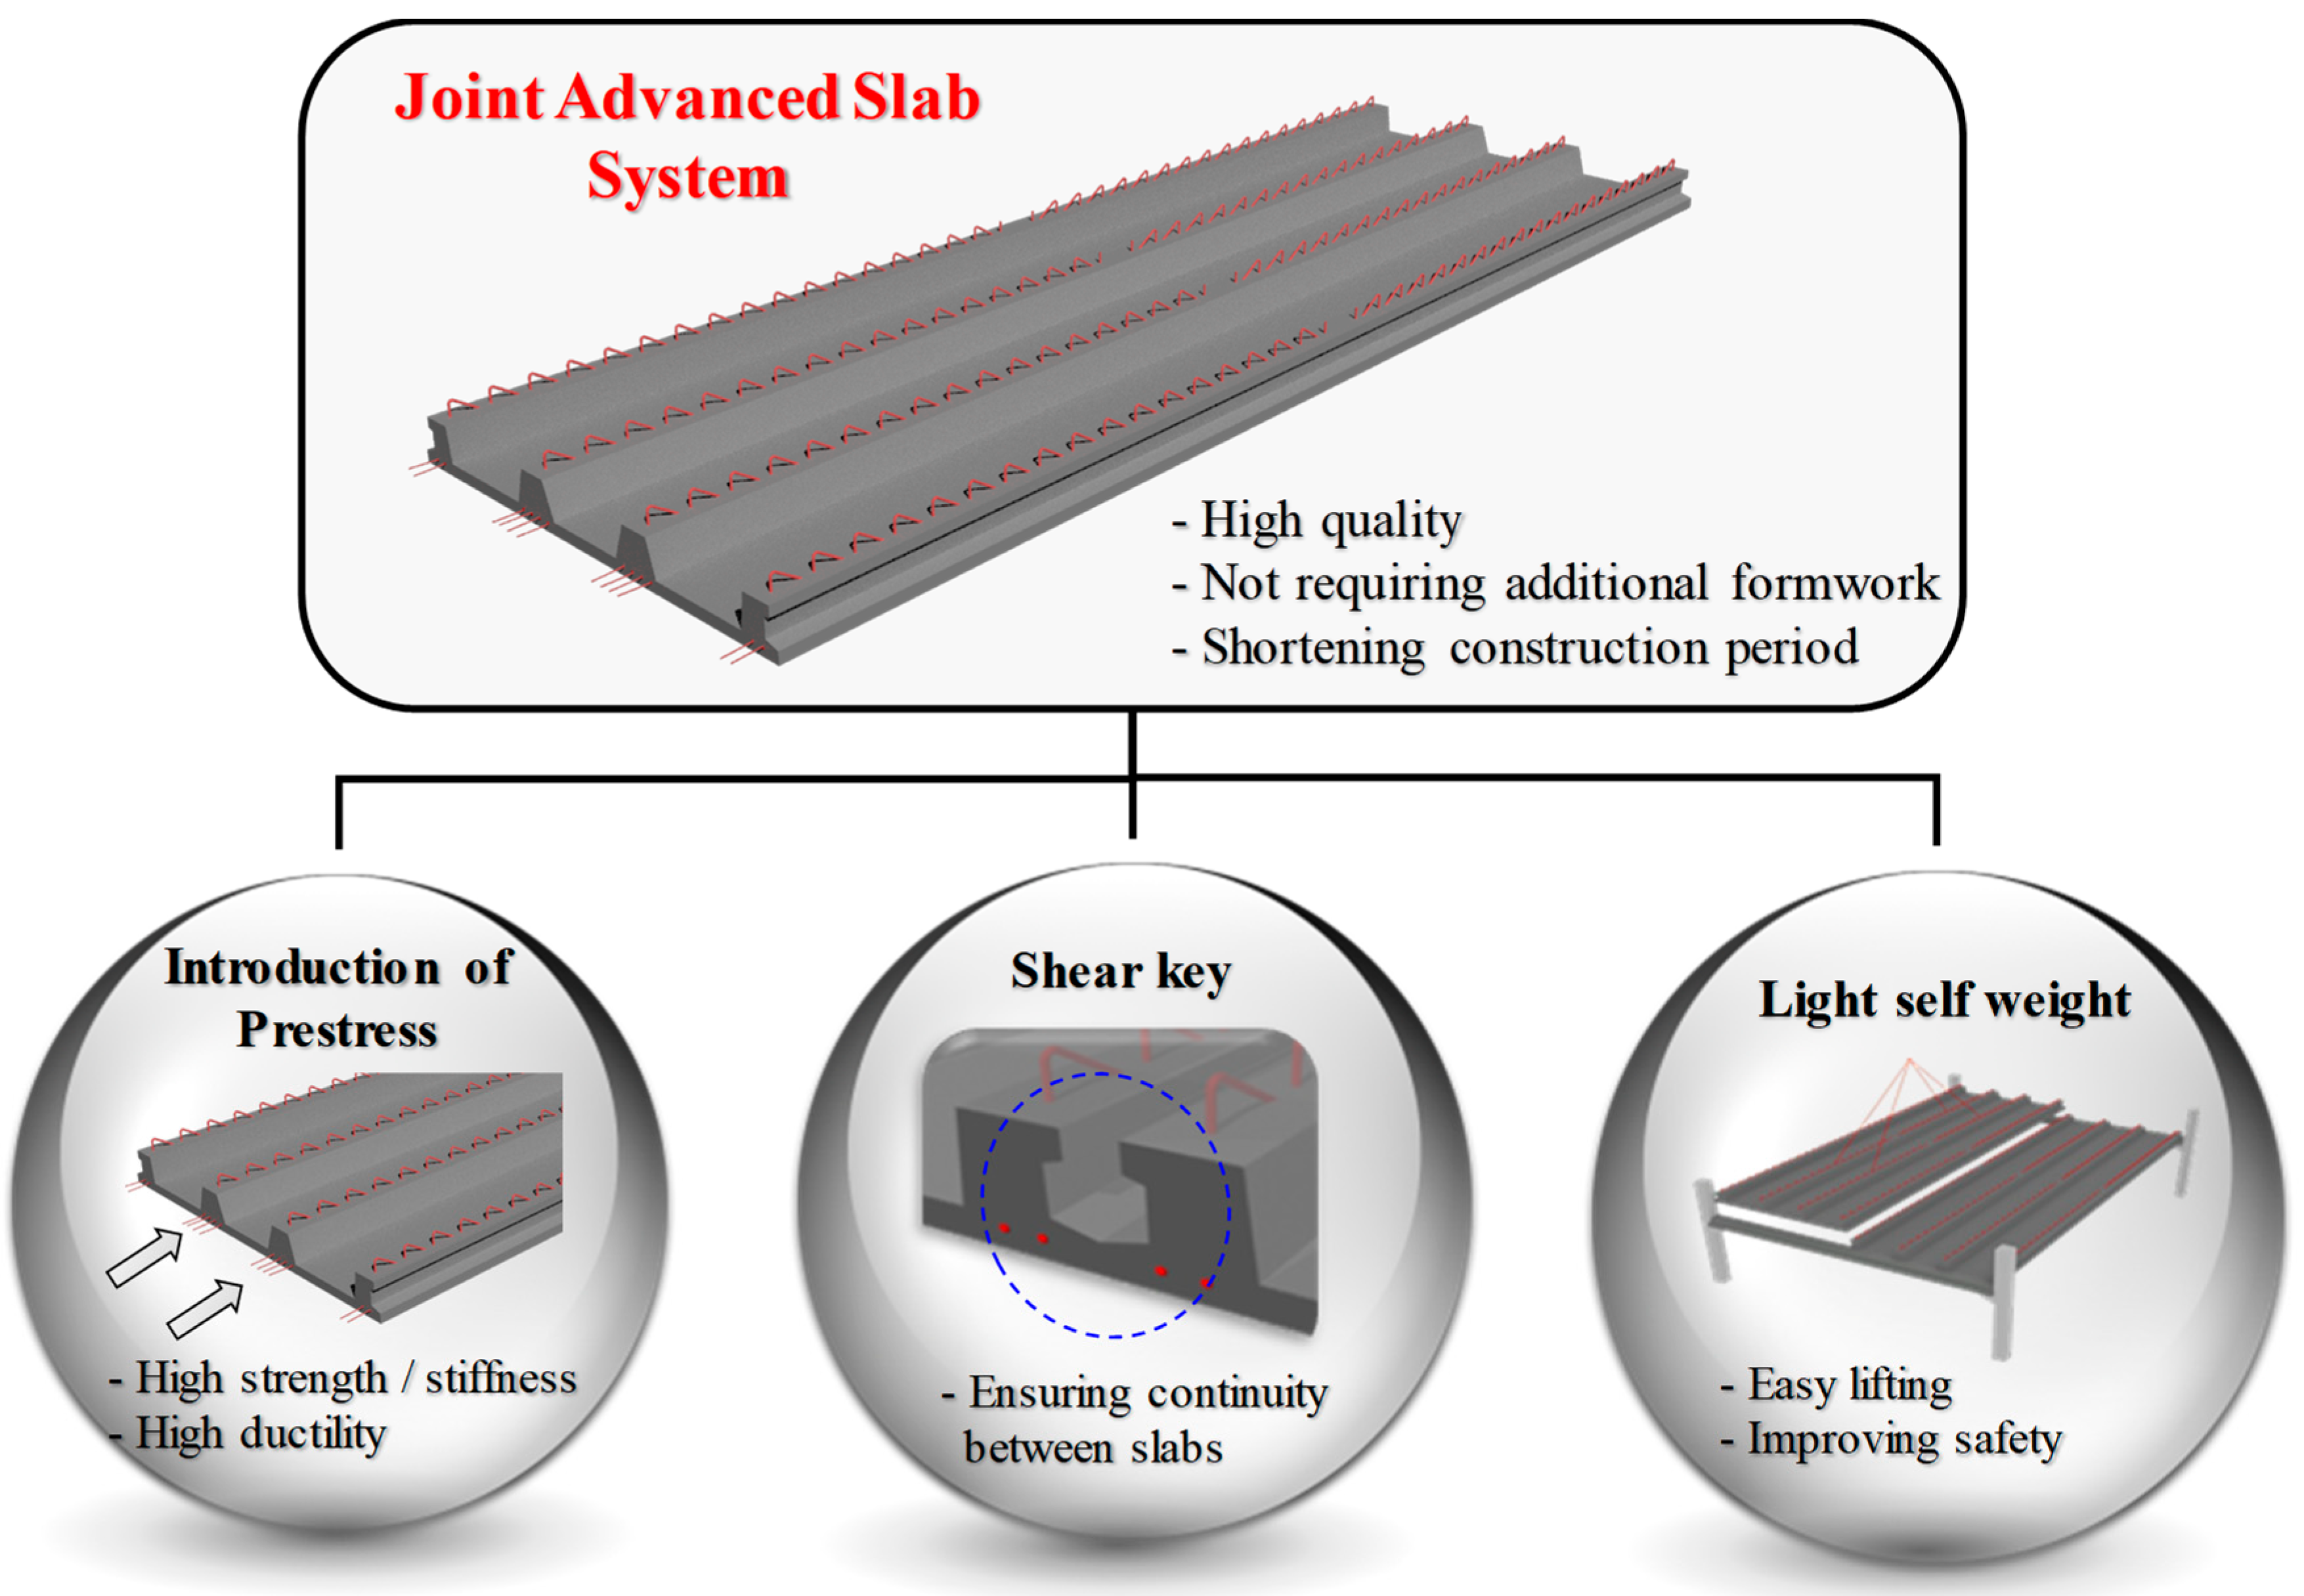
:1. Introduction
2. Experimental Program
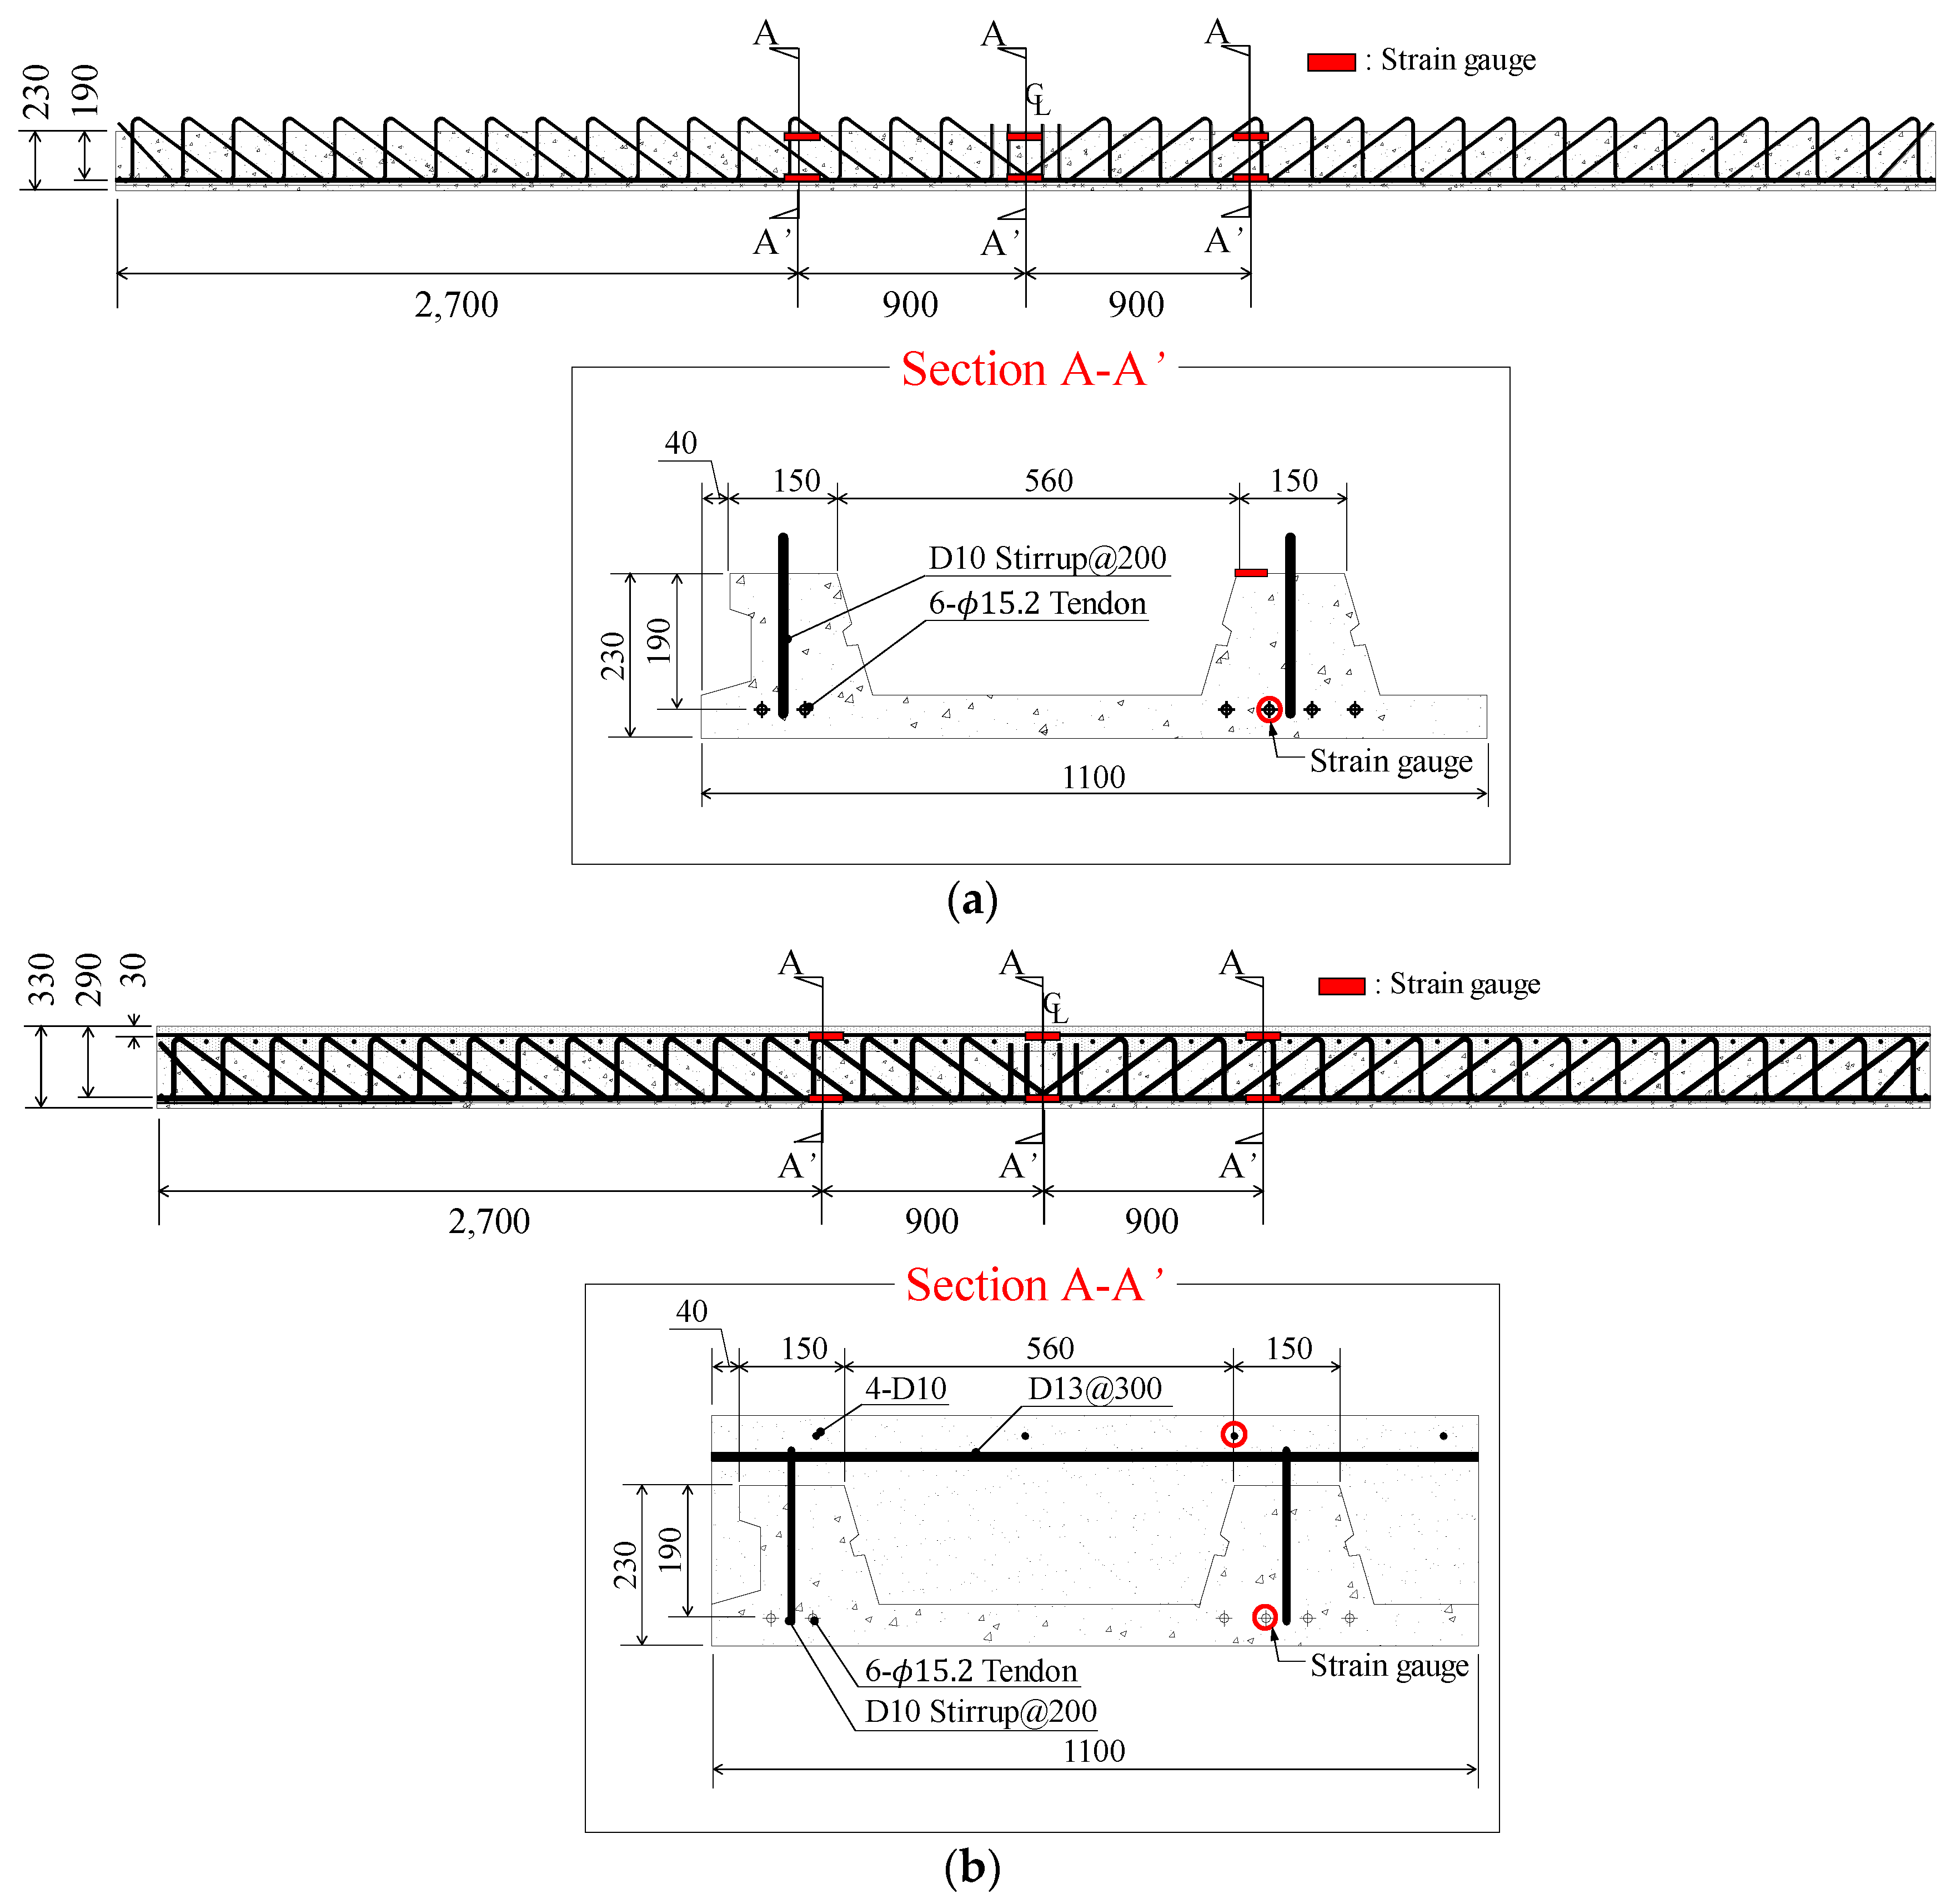
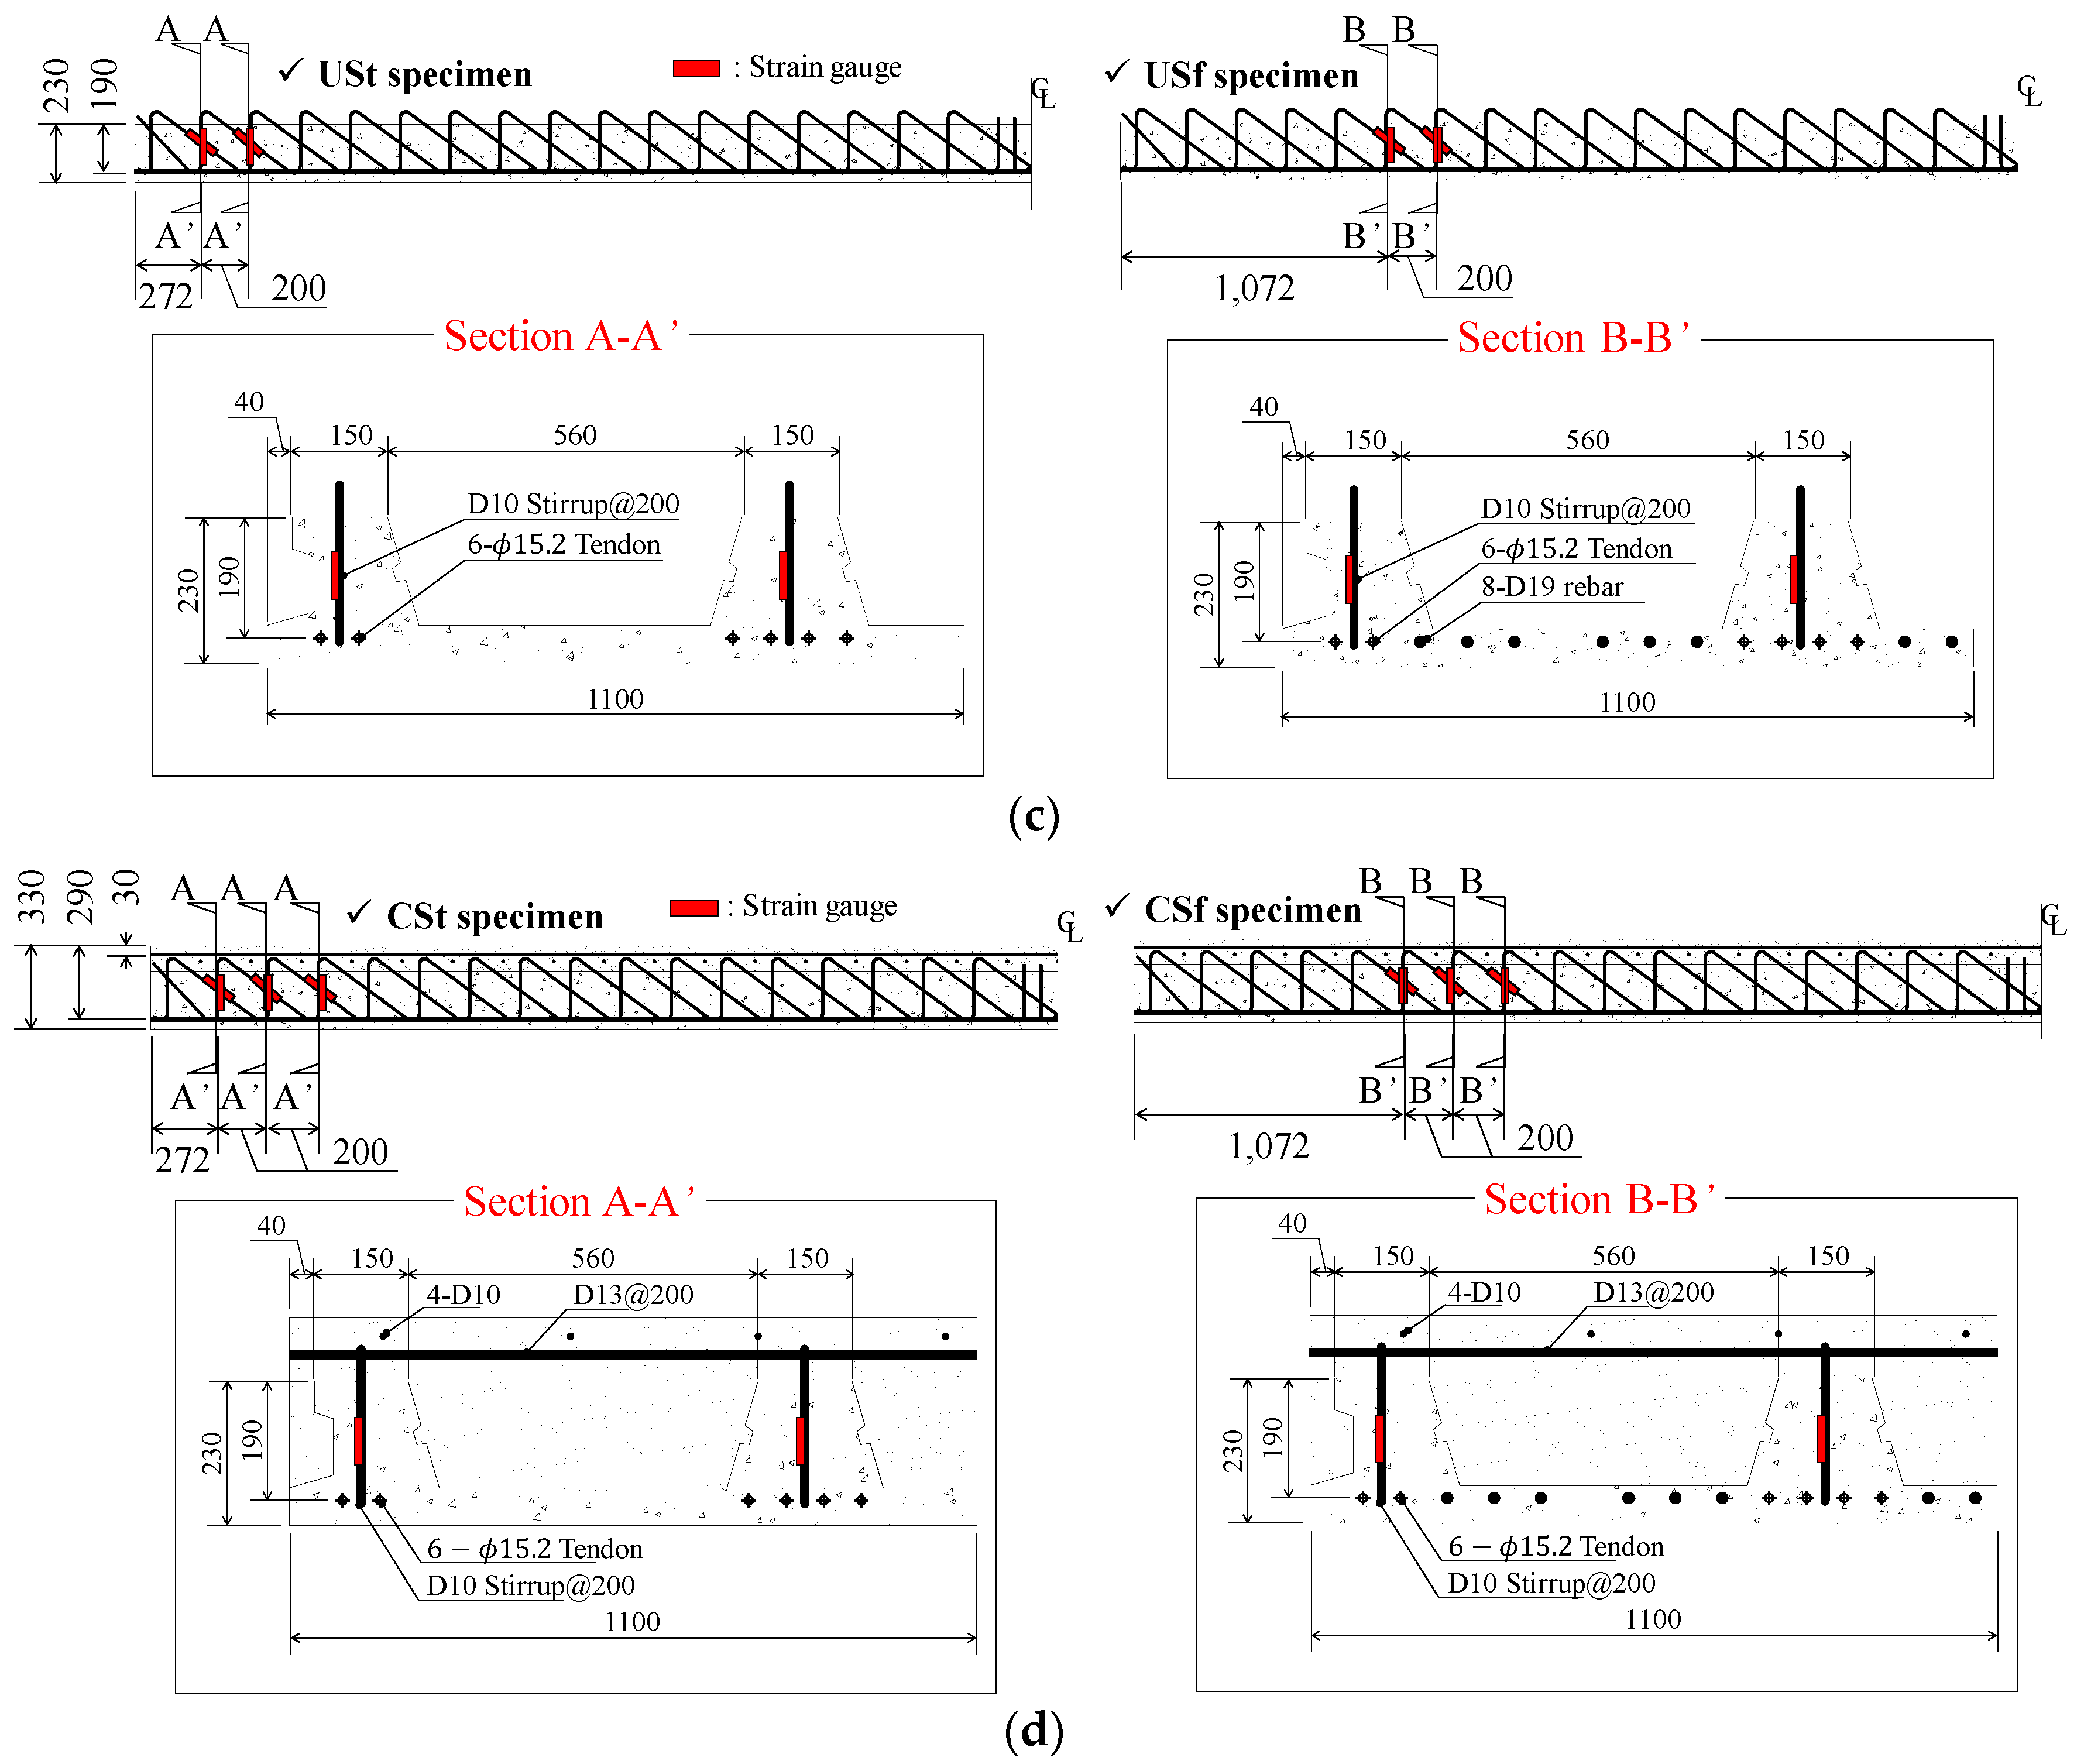
2.1. Test Specimens
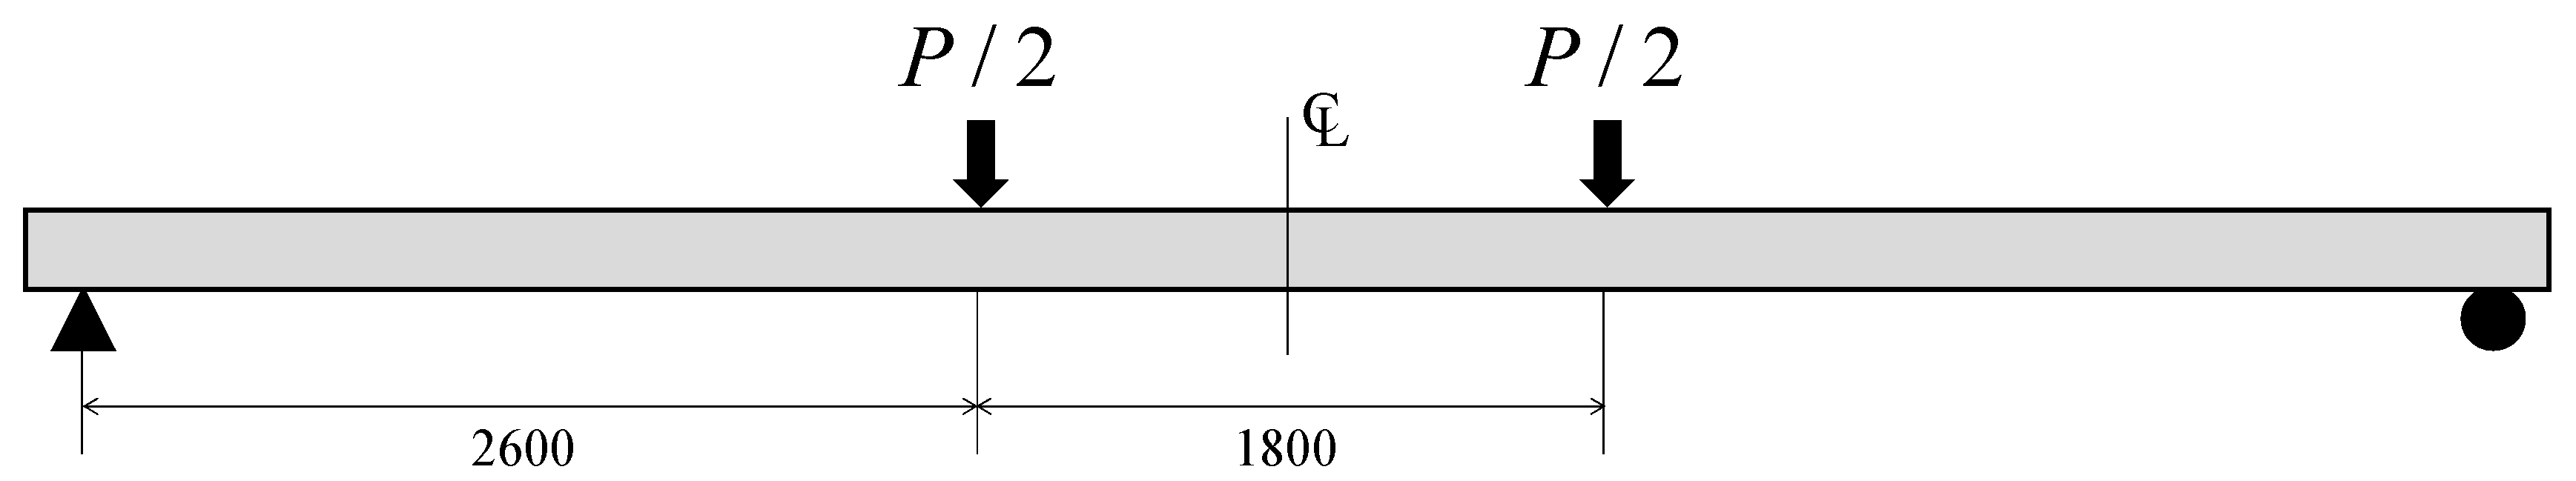
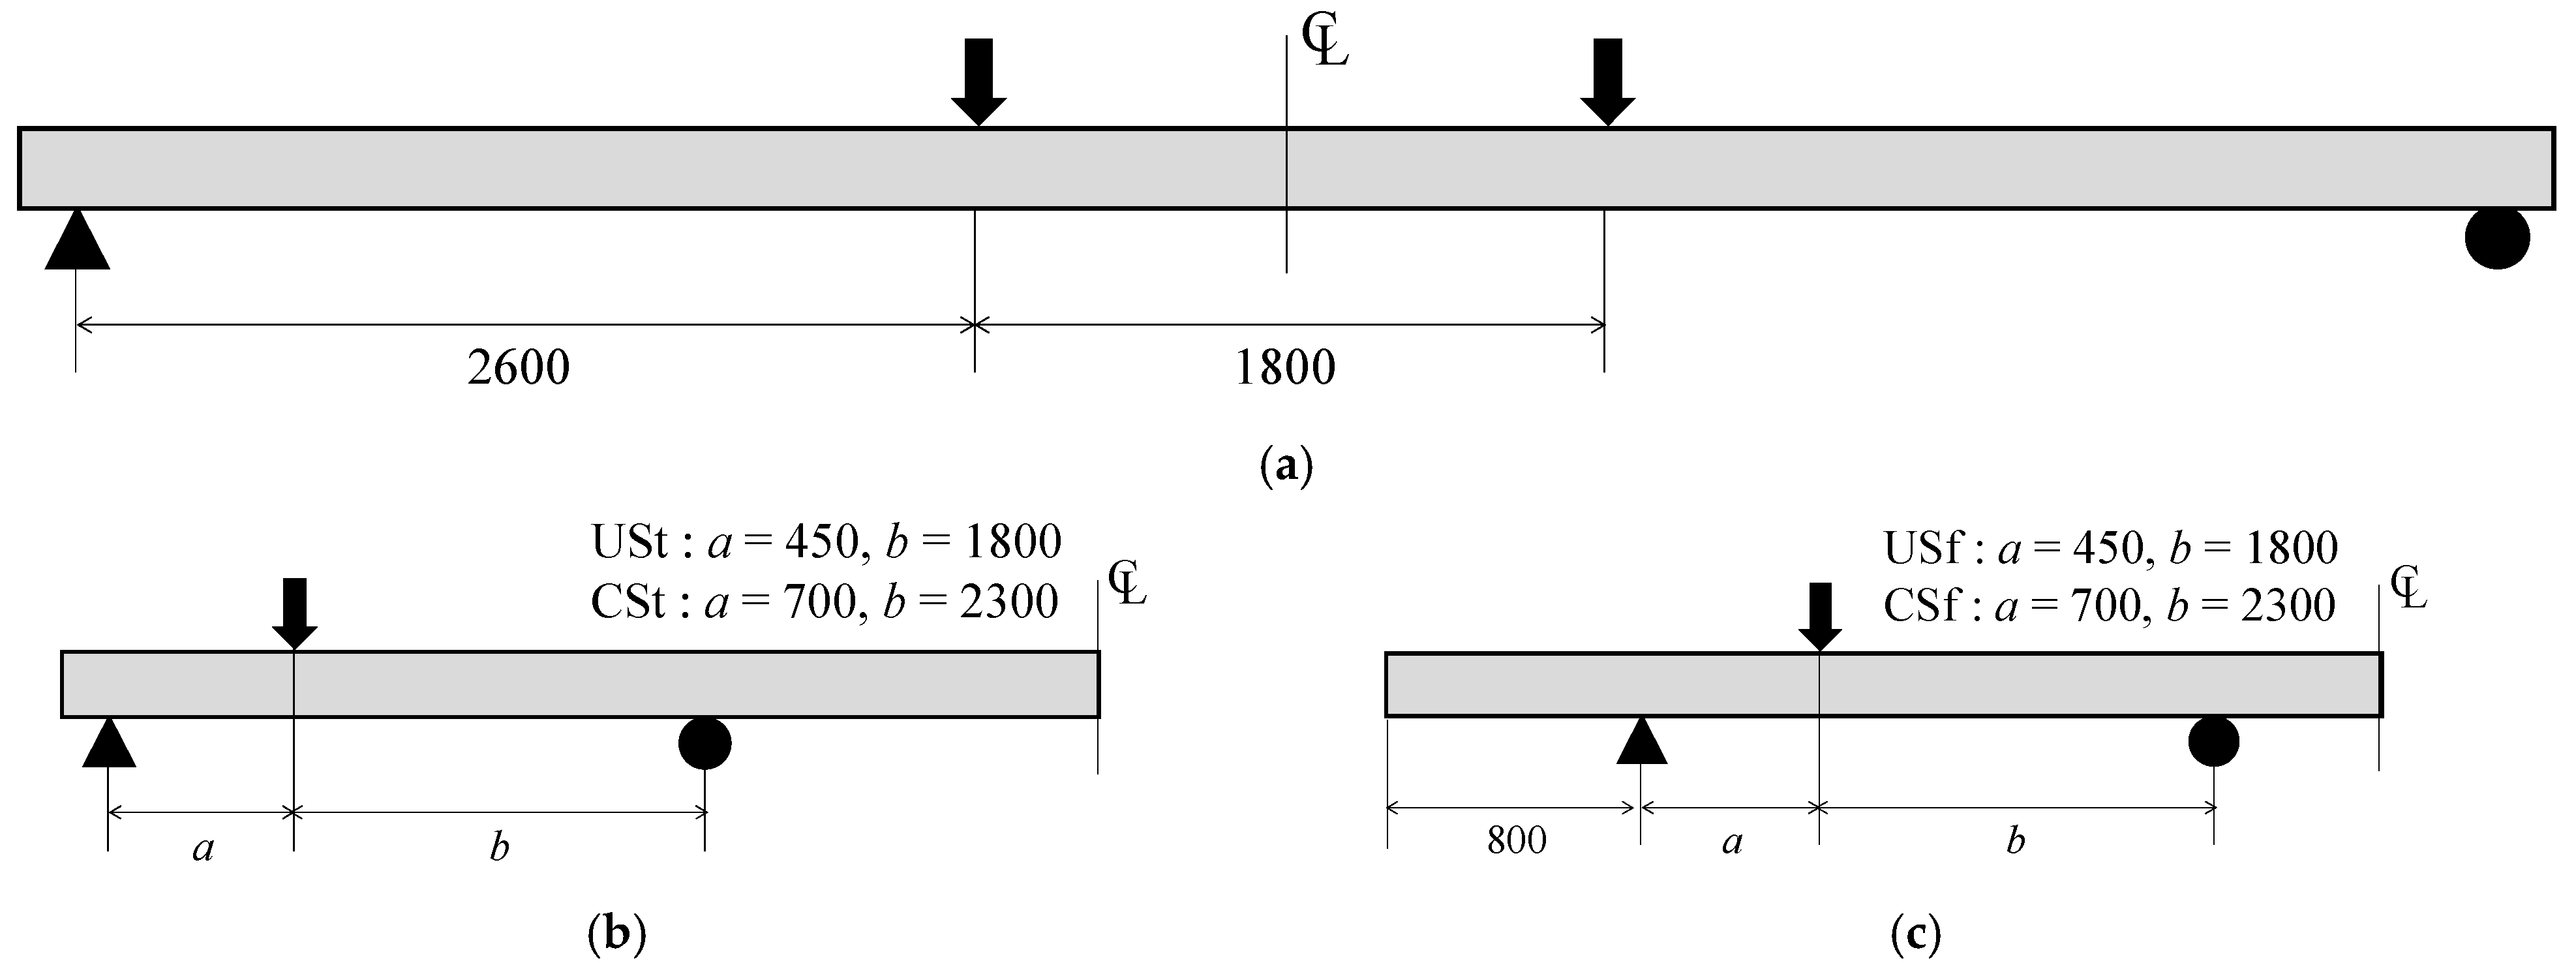
2.2. Test Set-Up
3. Experimental Results
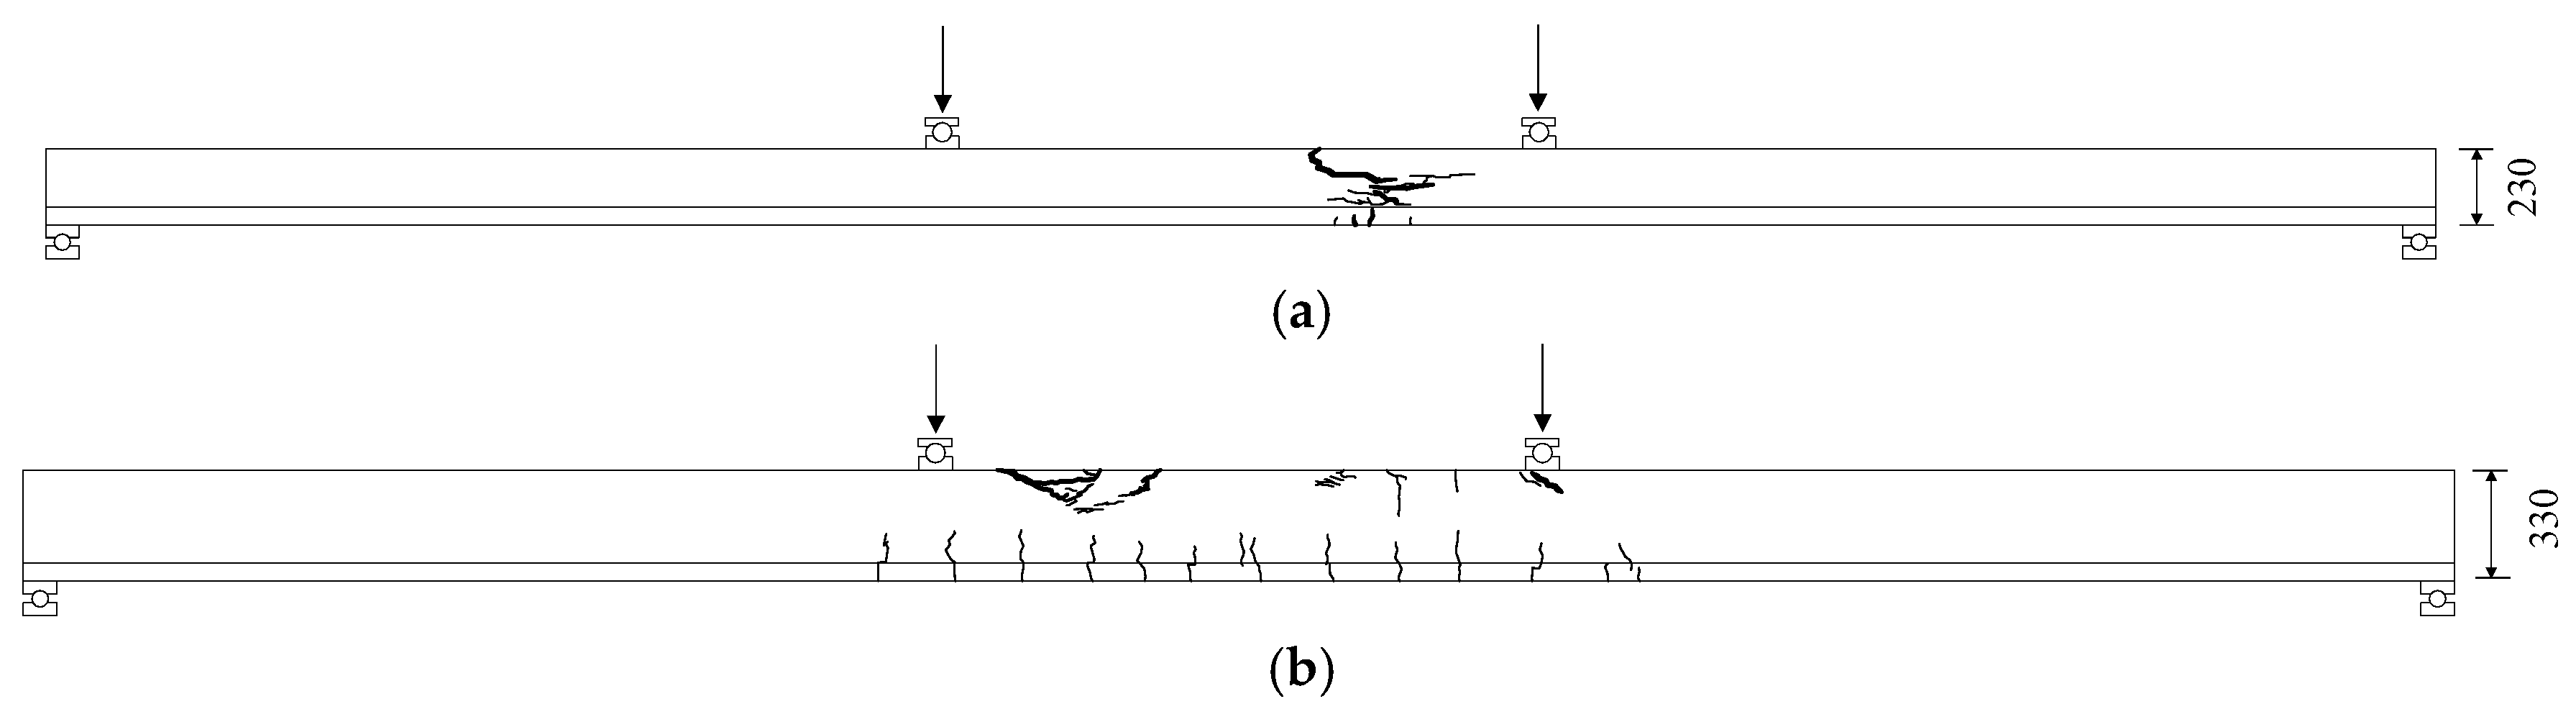
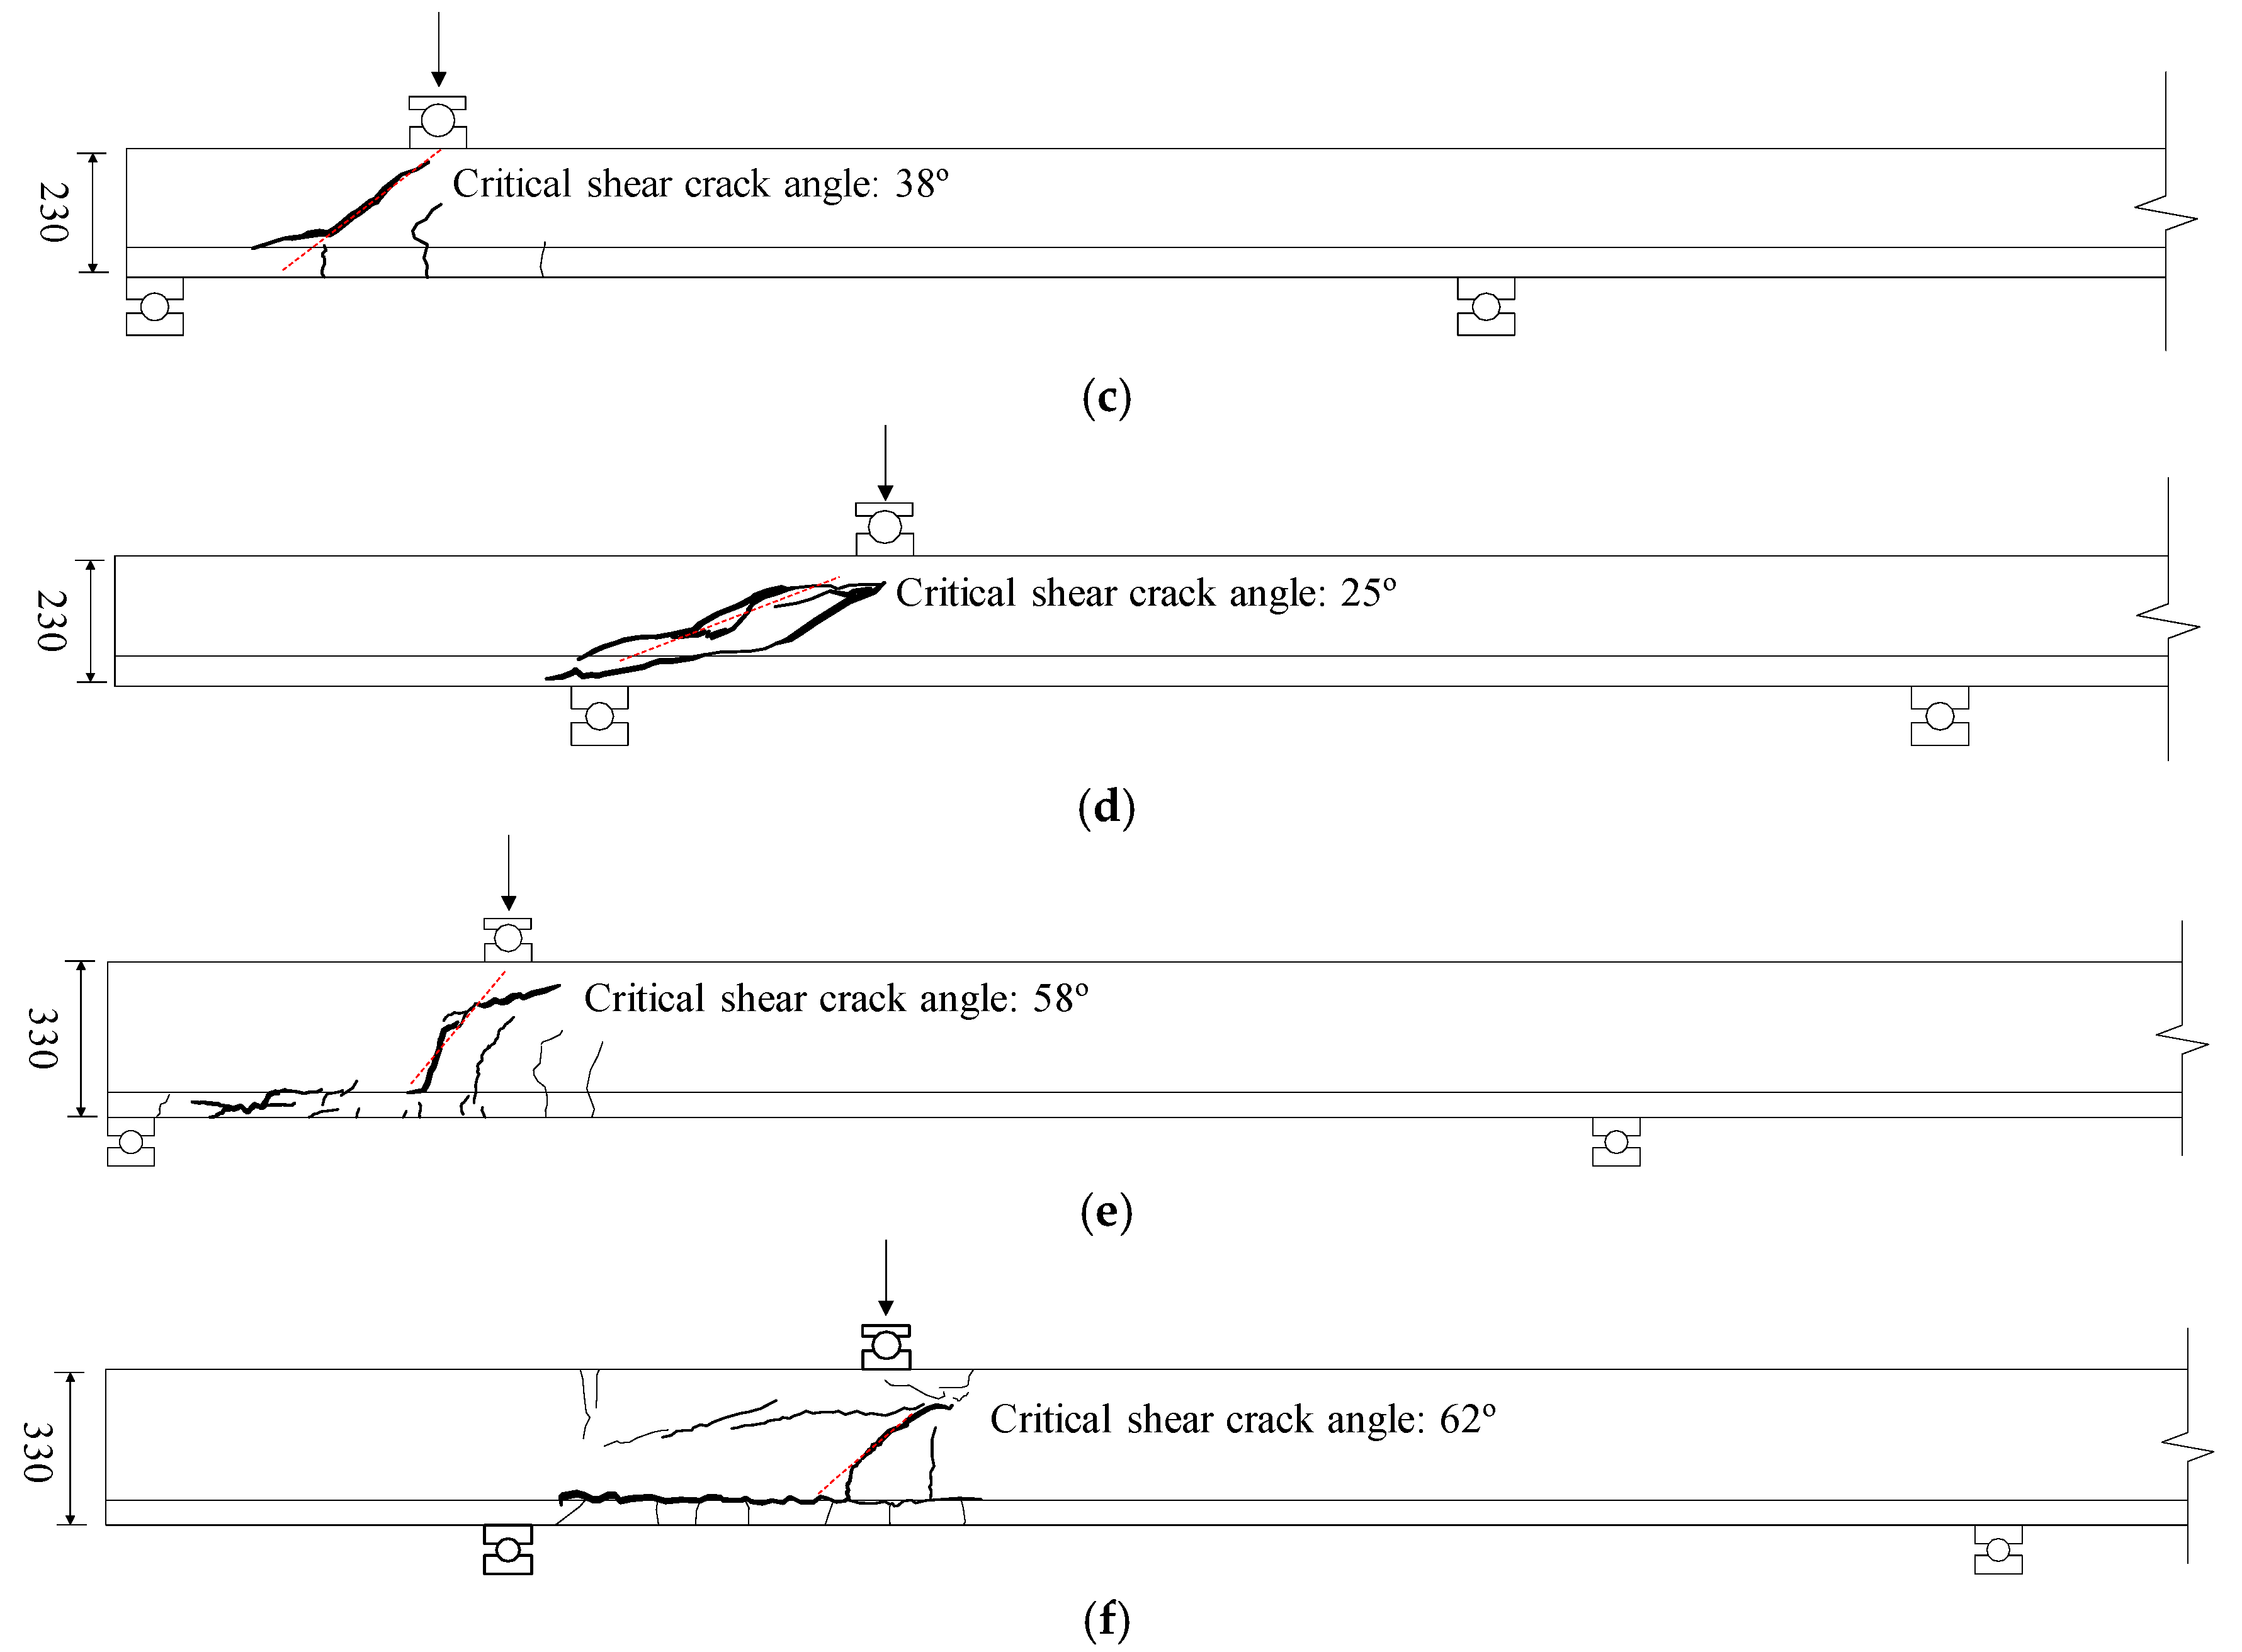
3.1. Failure Modes of the Test Specimens
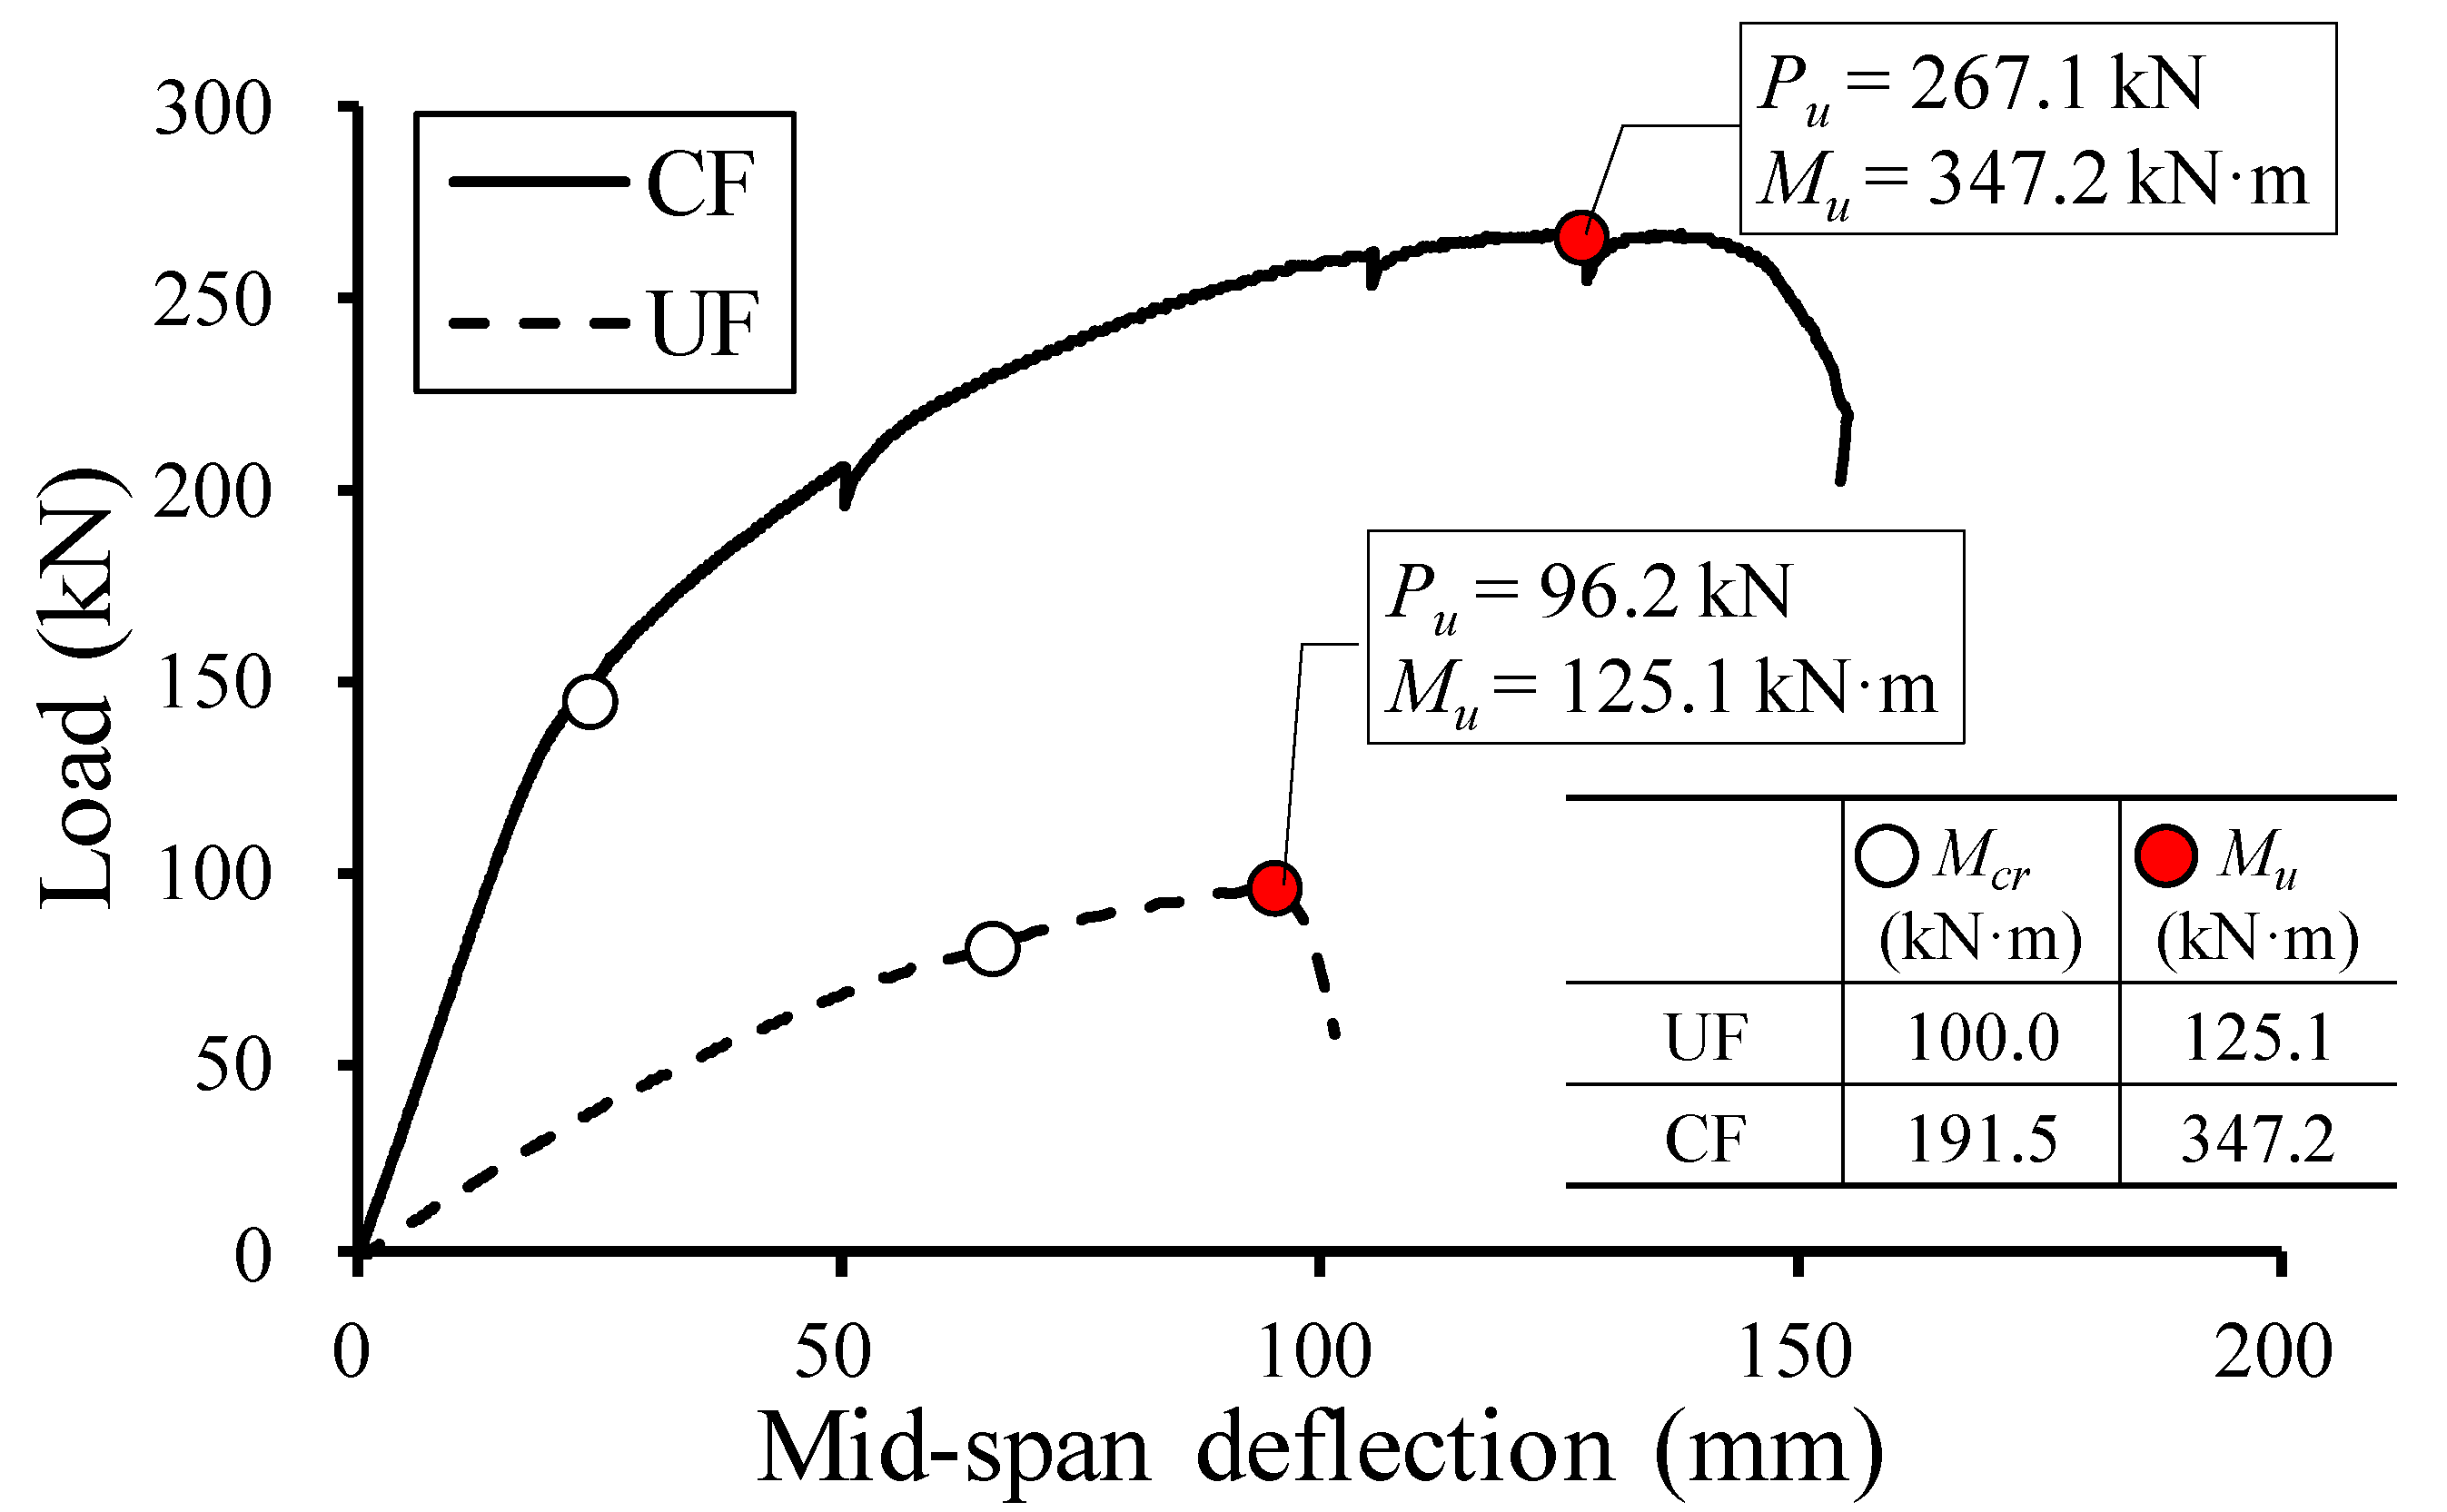
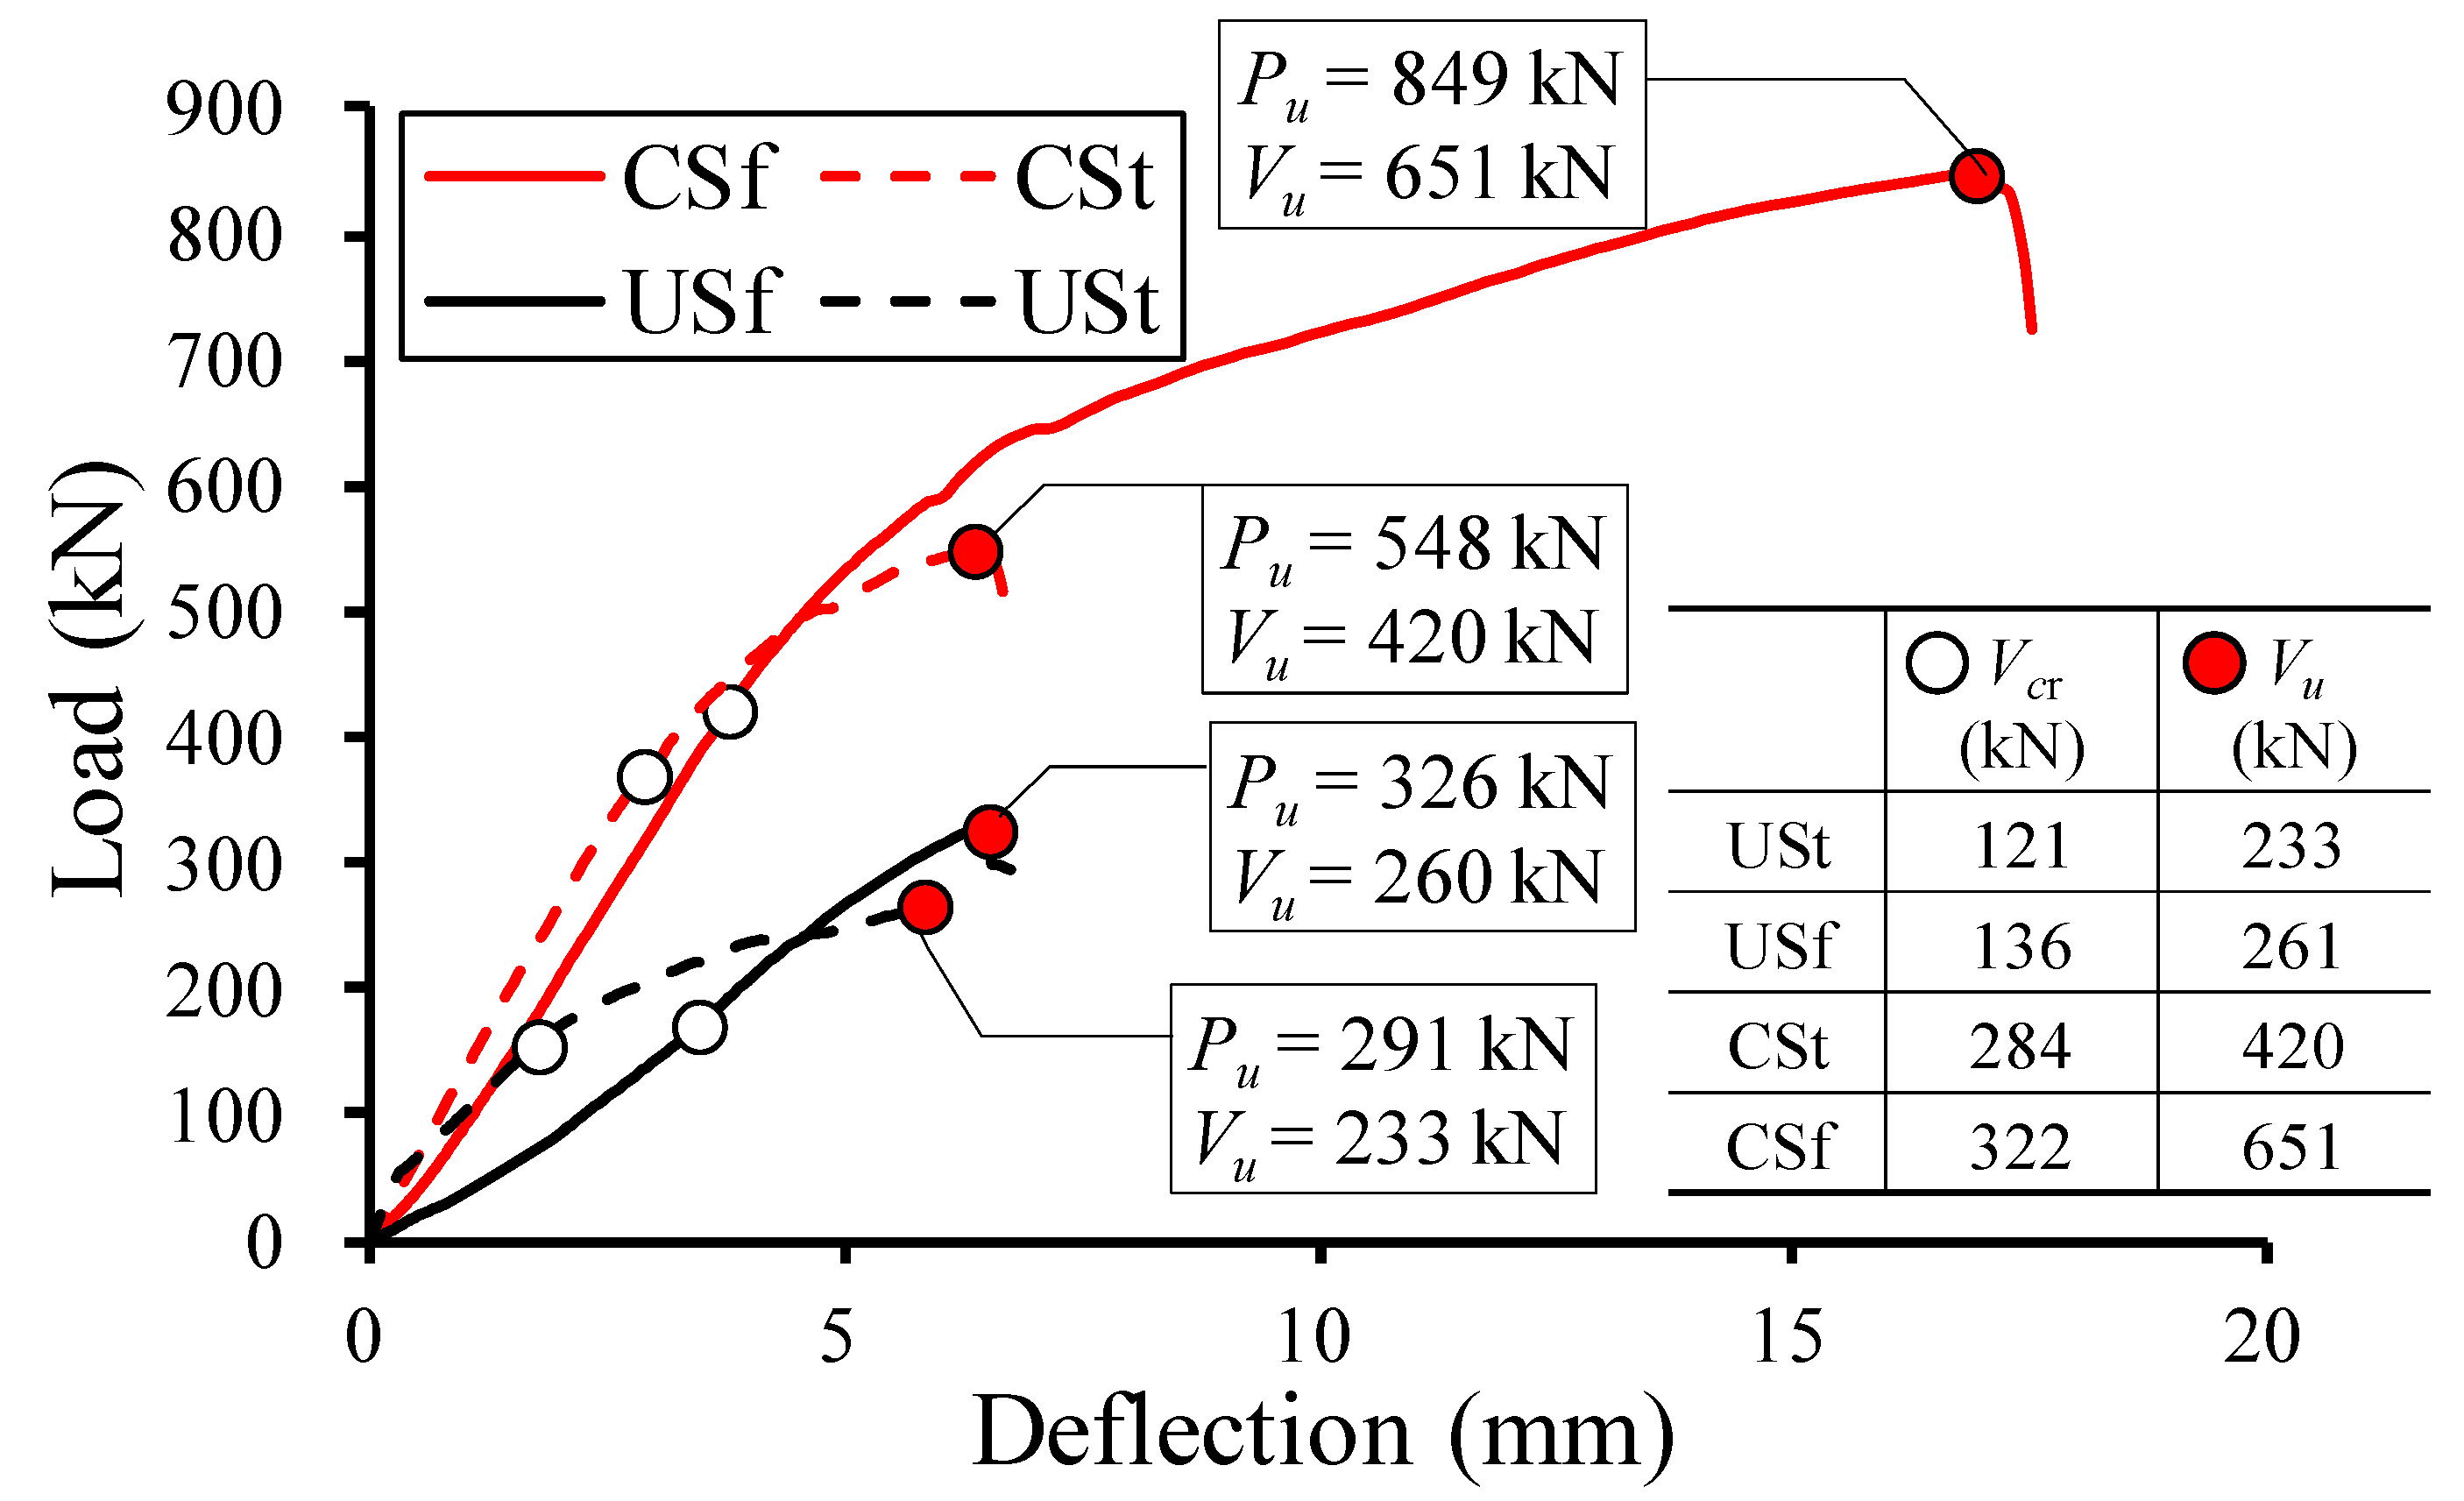
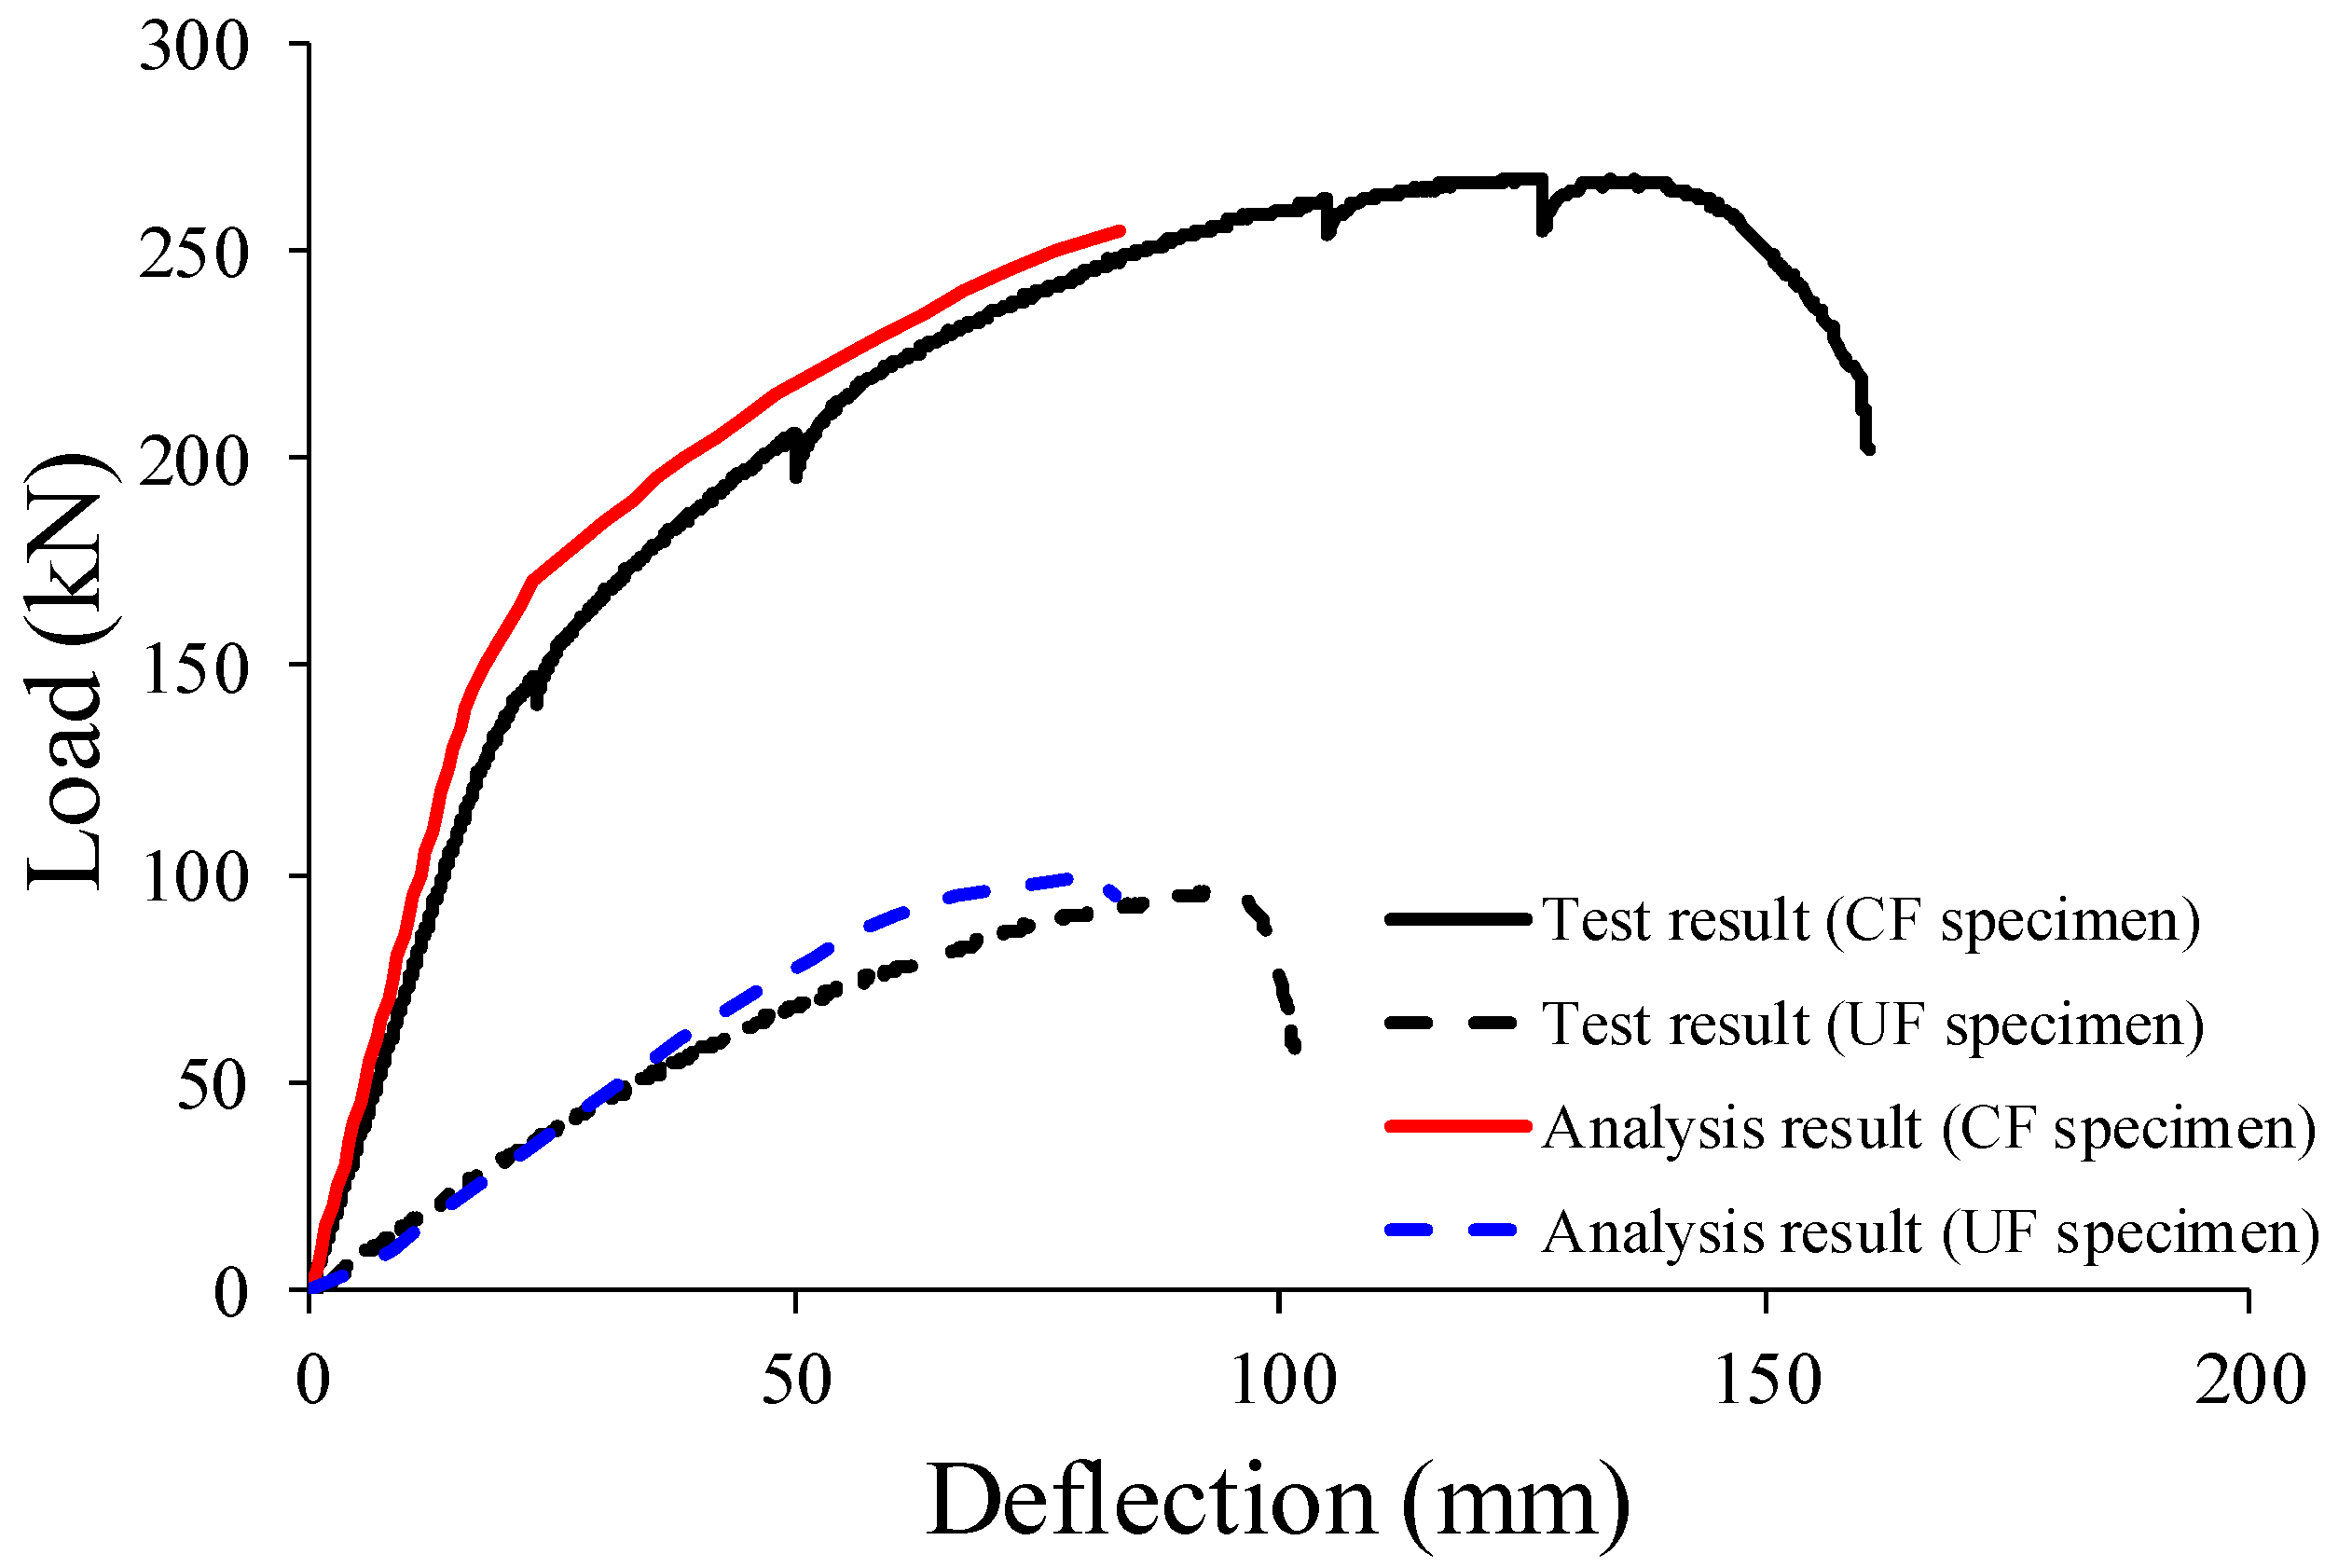
3.2. Load-Deflection Responses
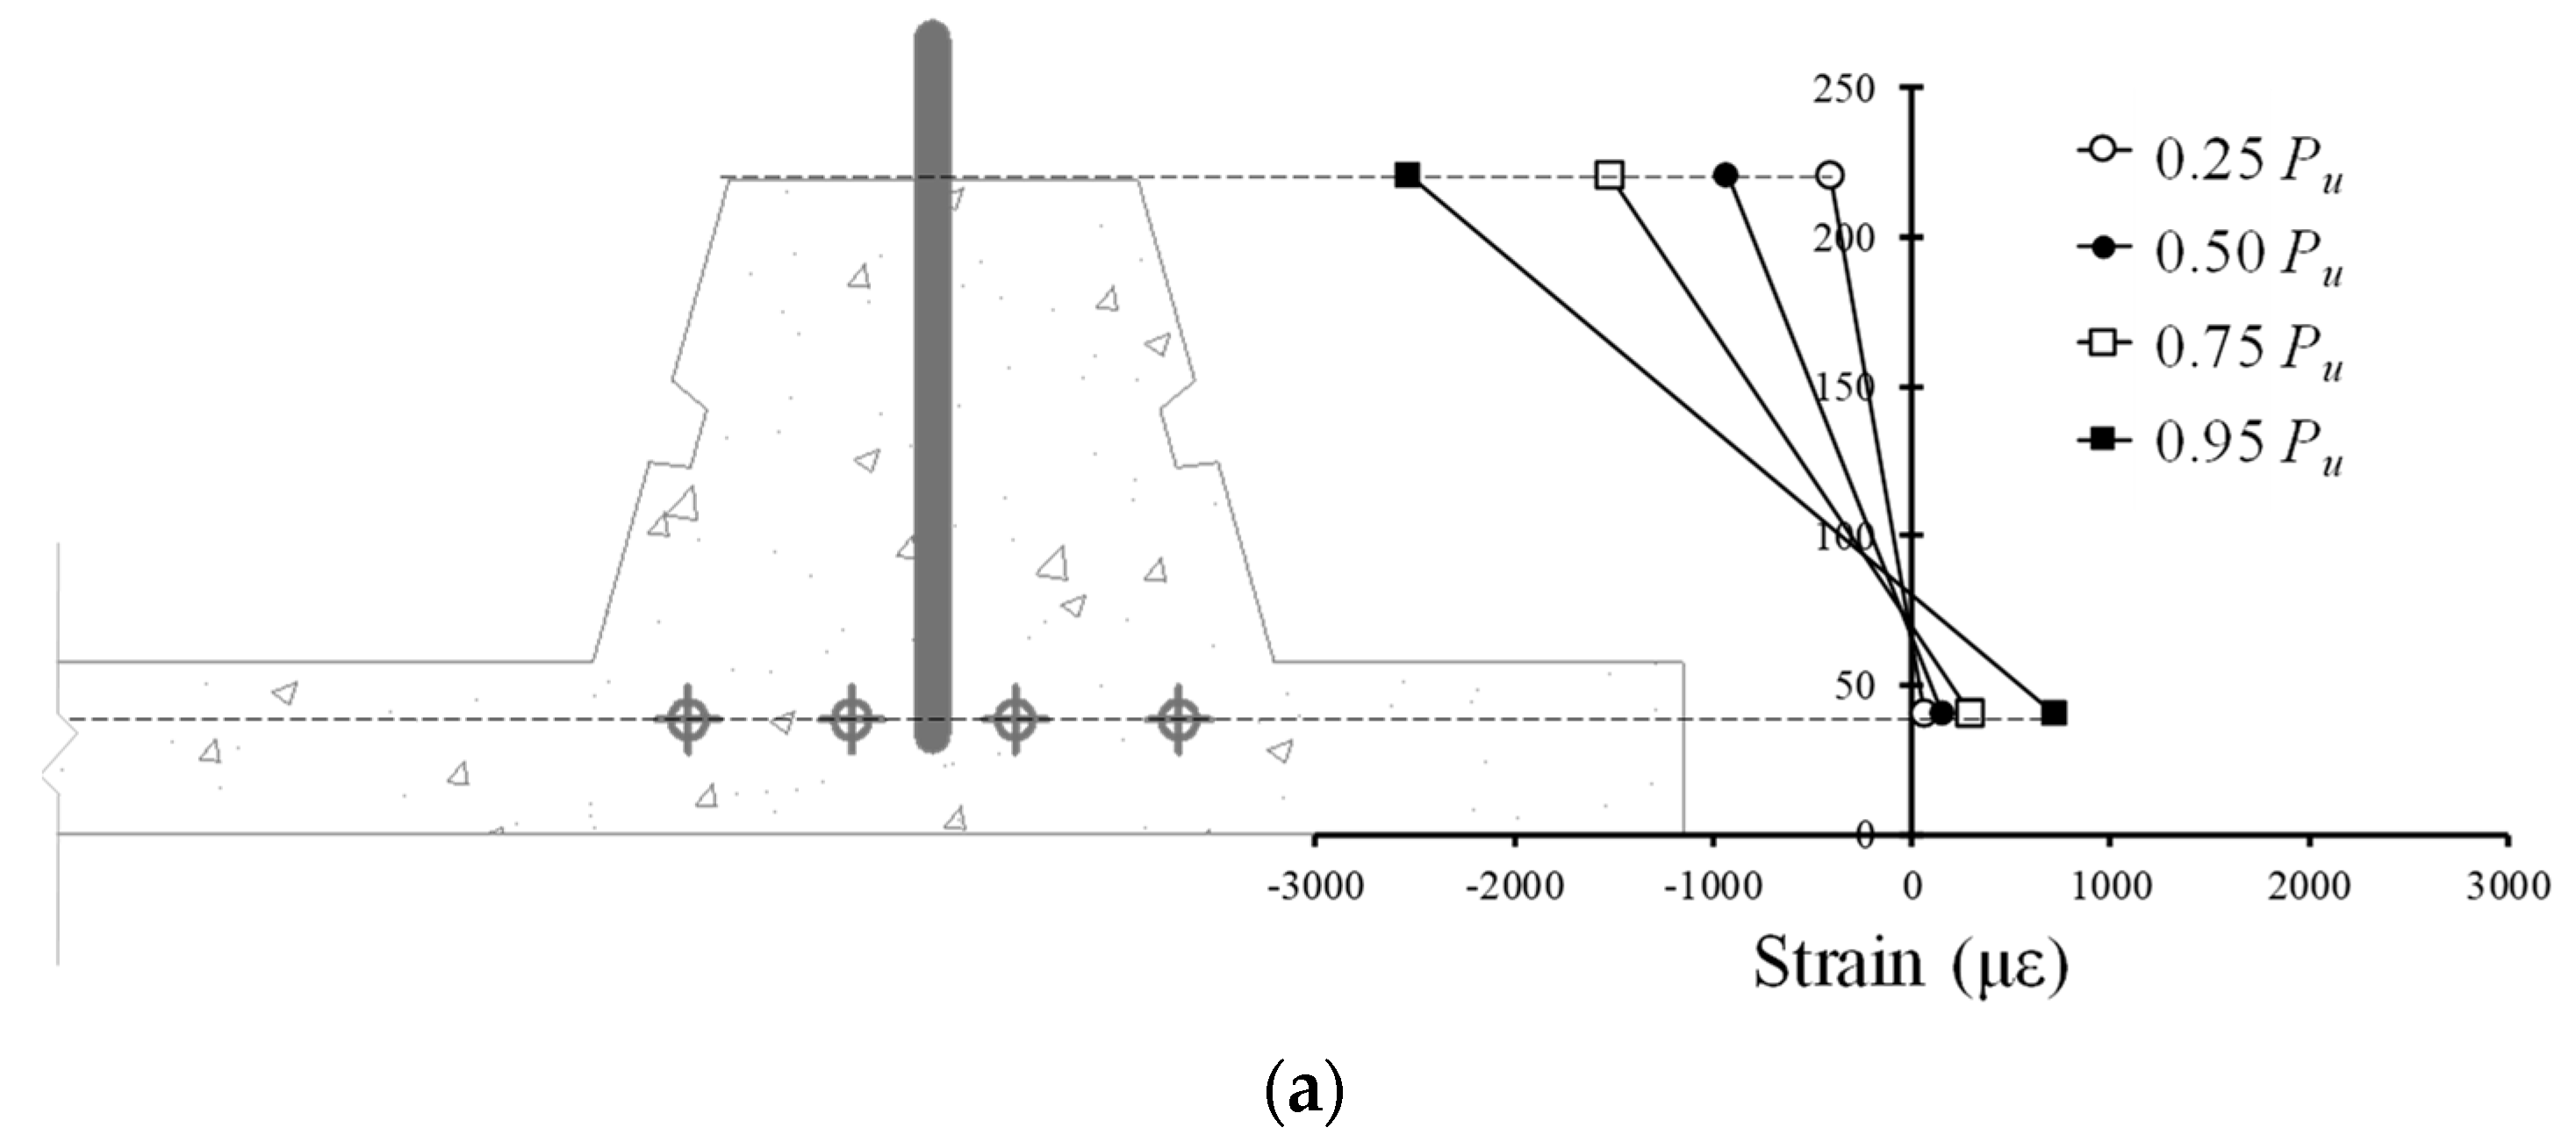
3.3. Measured Strains
4. Analysis of Flexural Behavior and Shear Strength
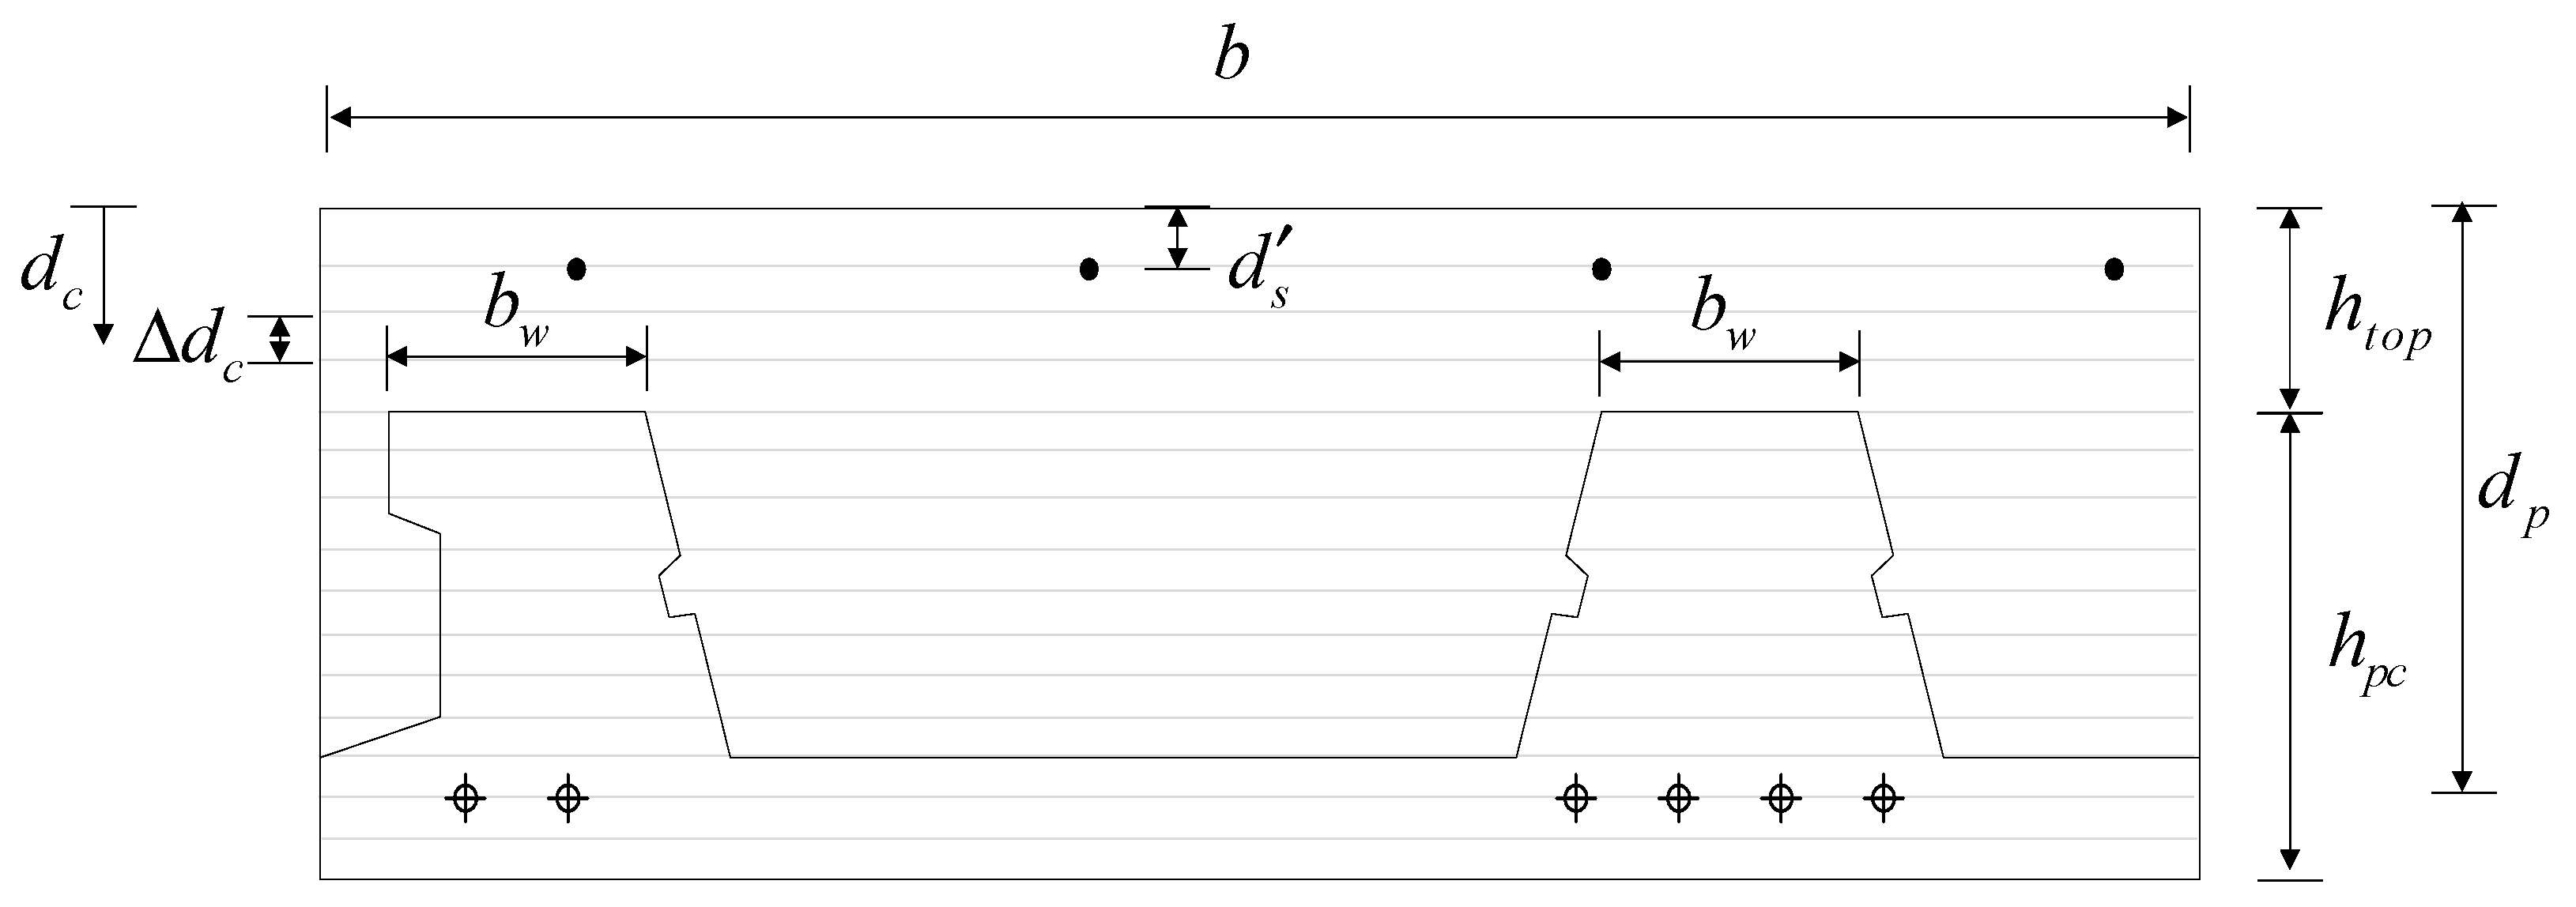
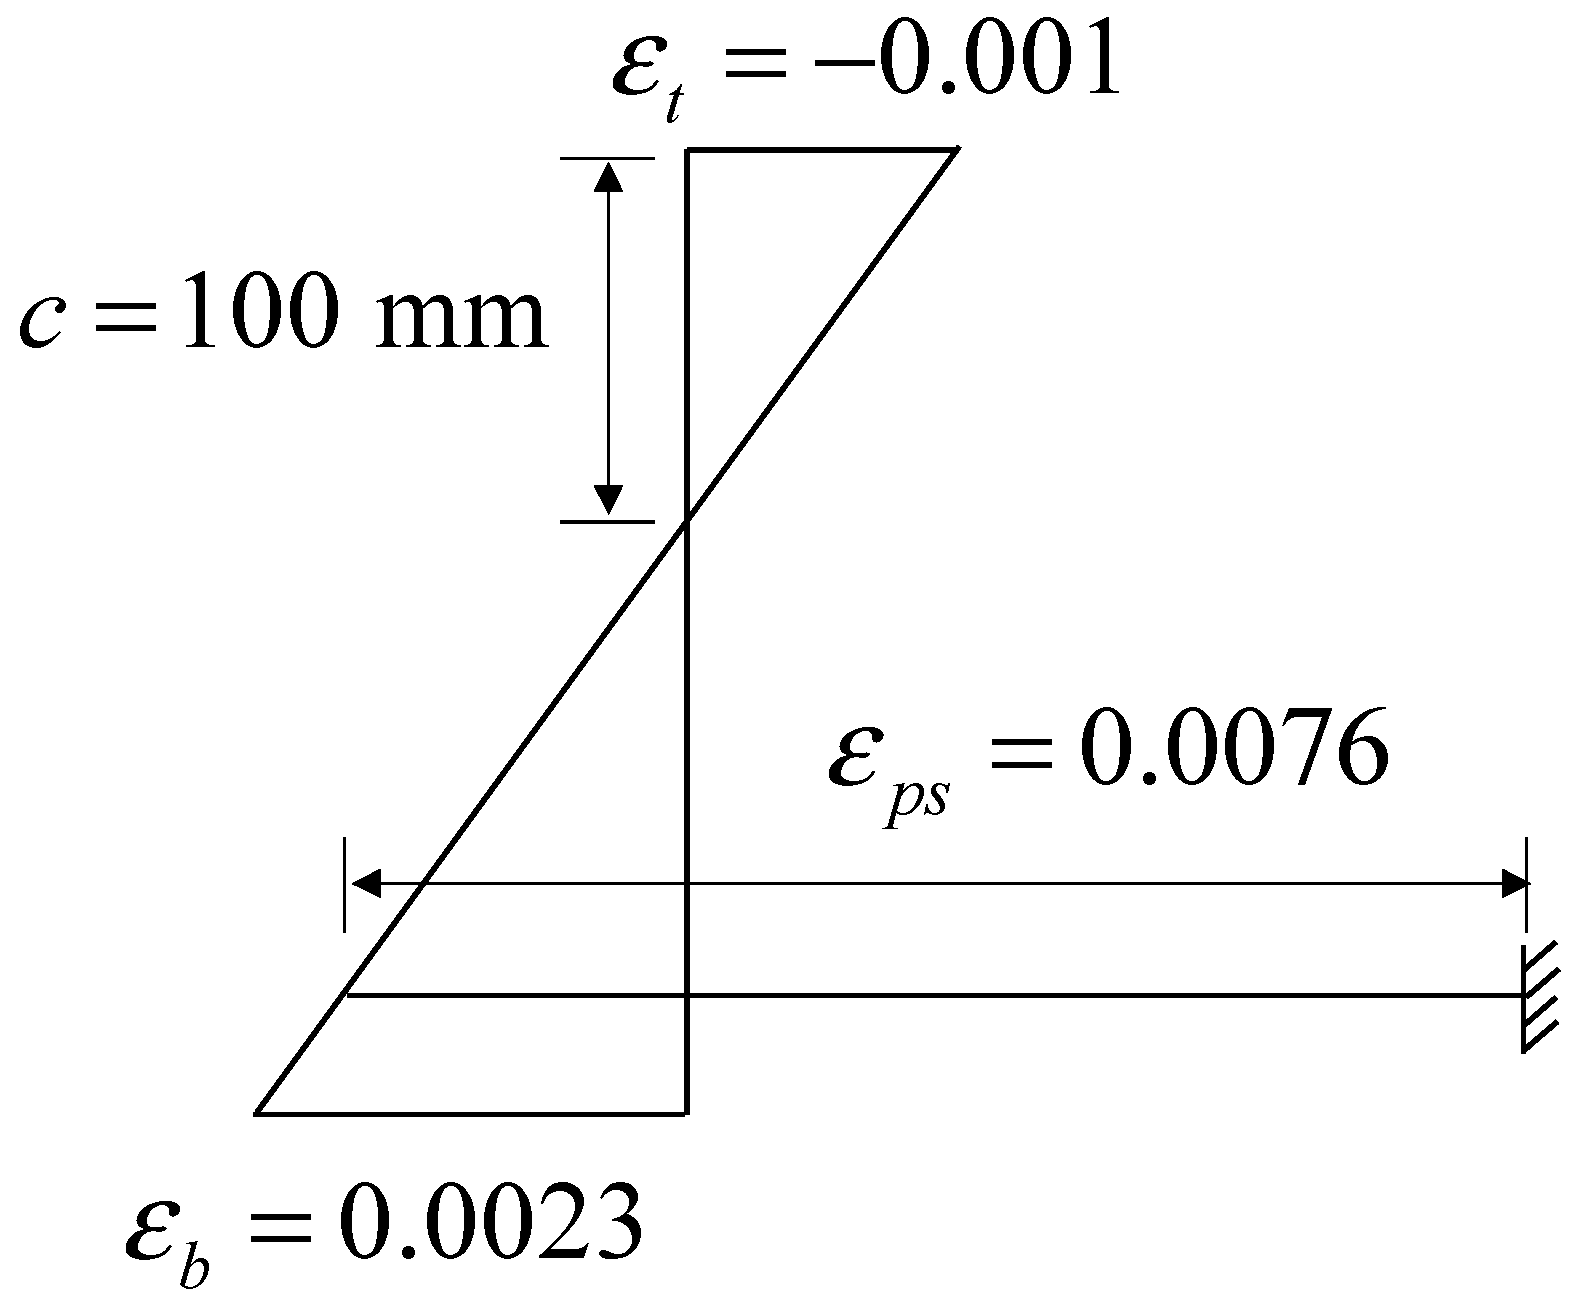
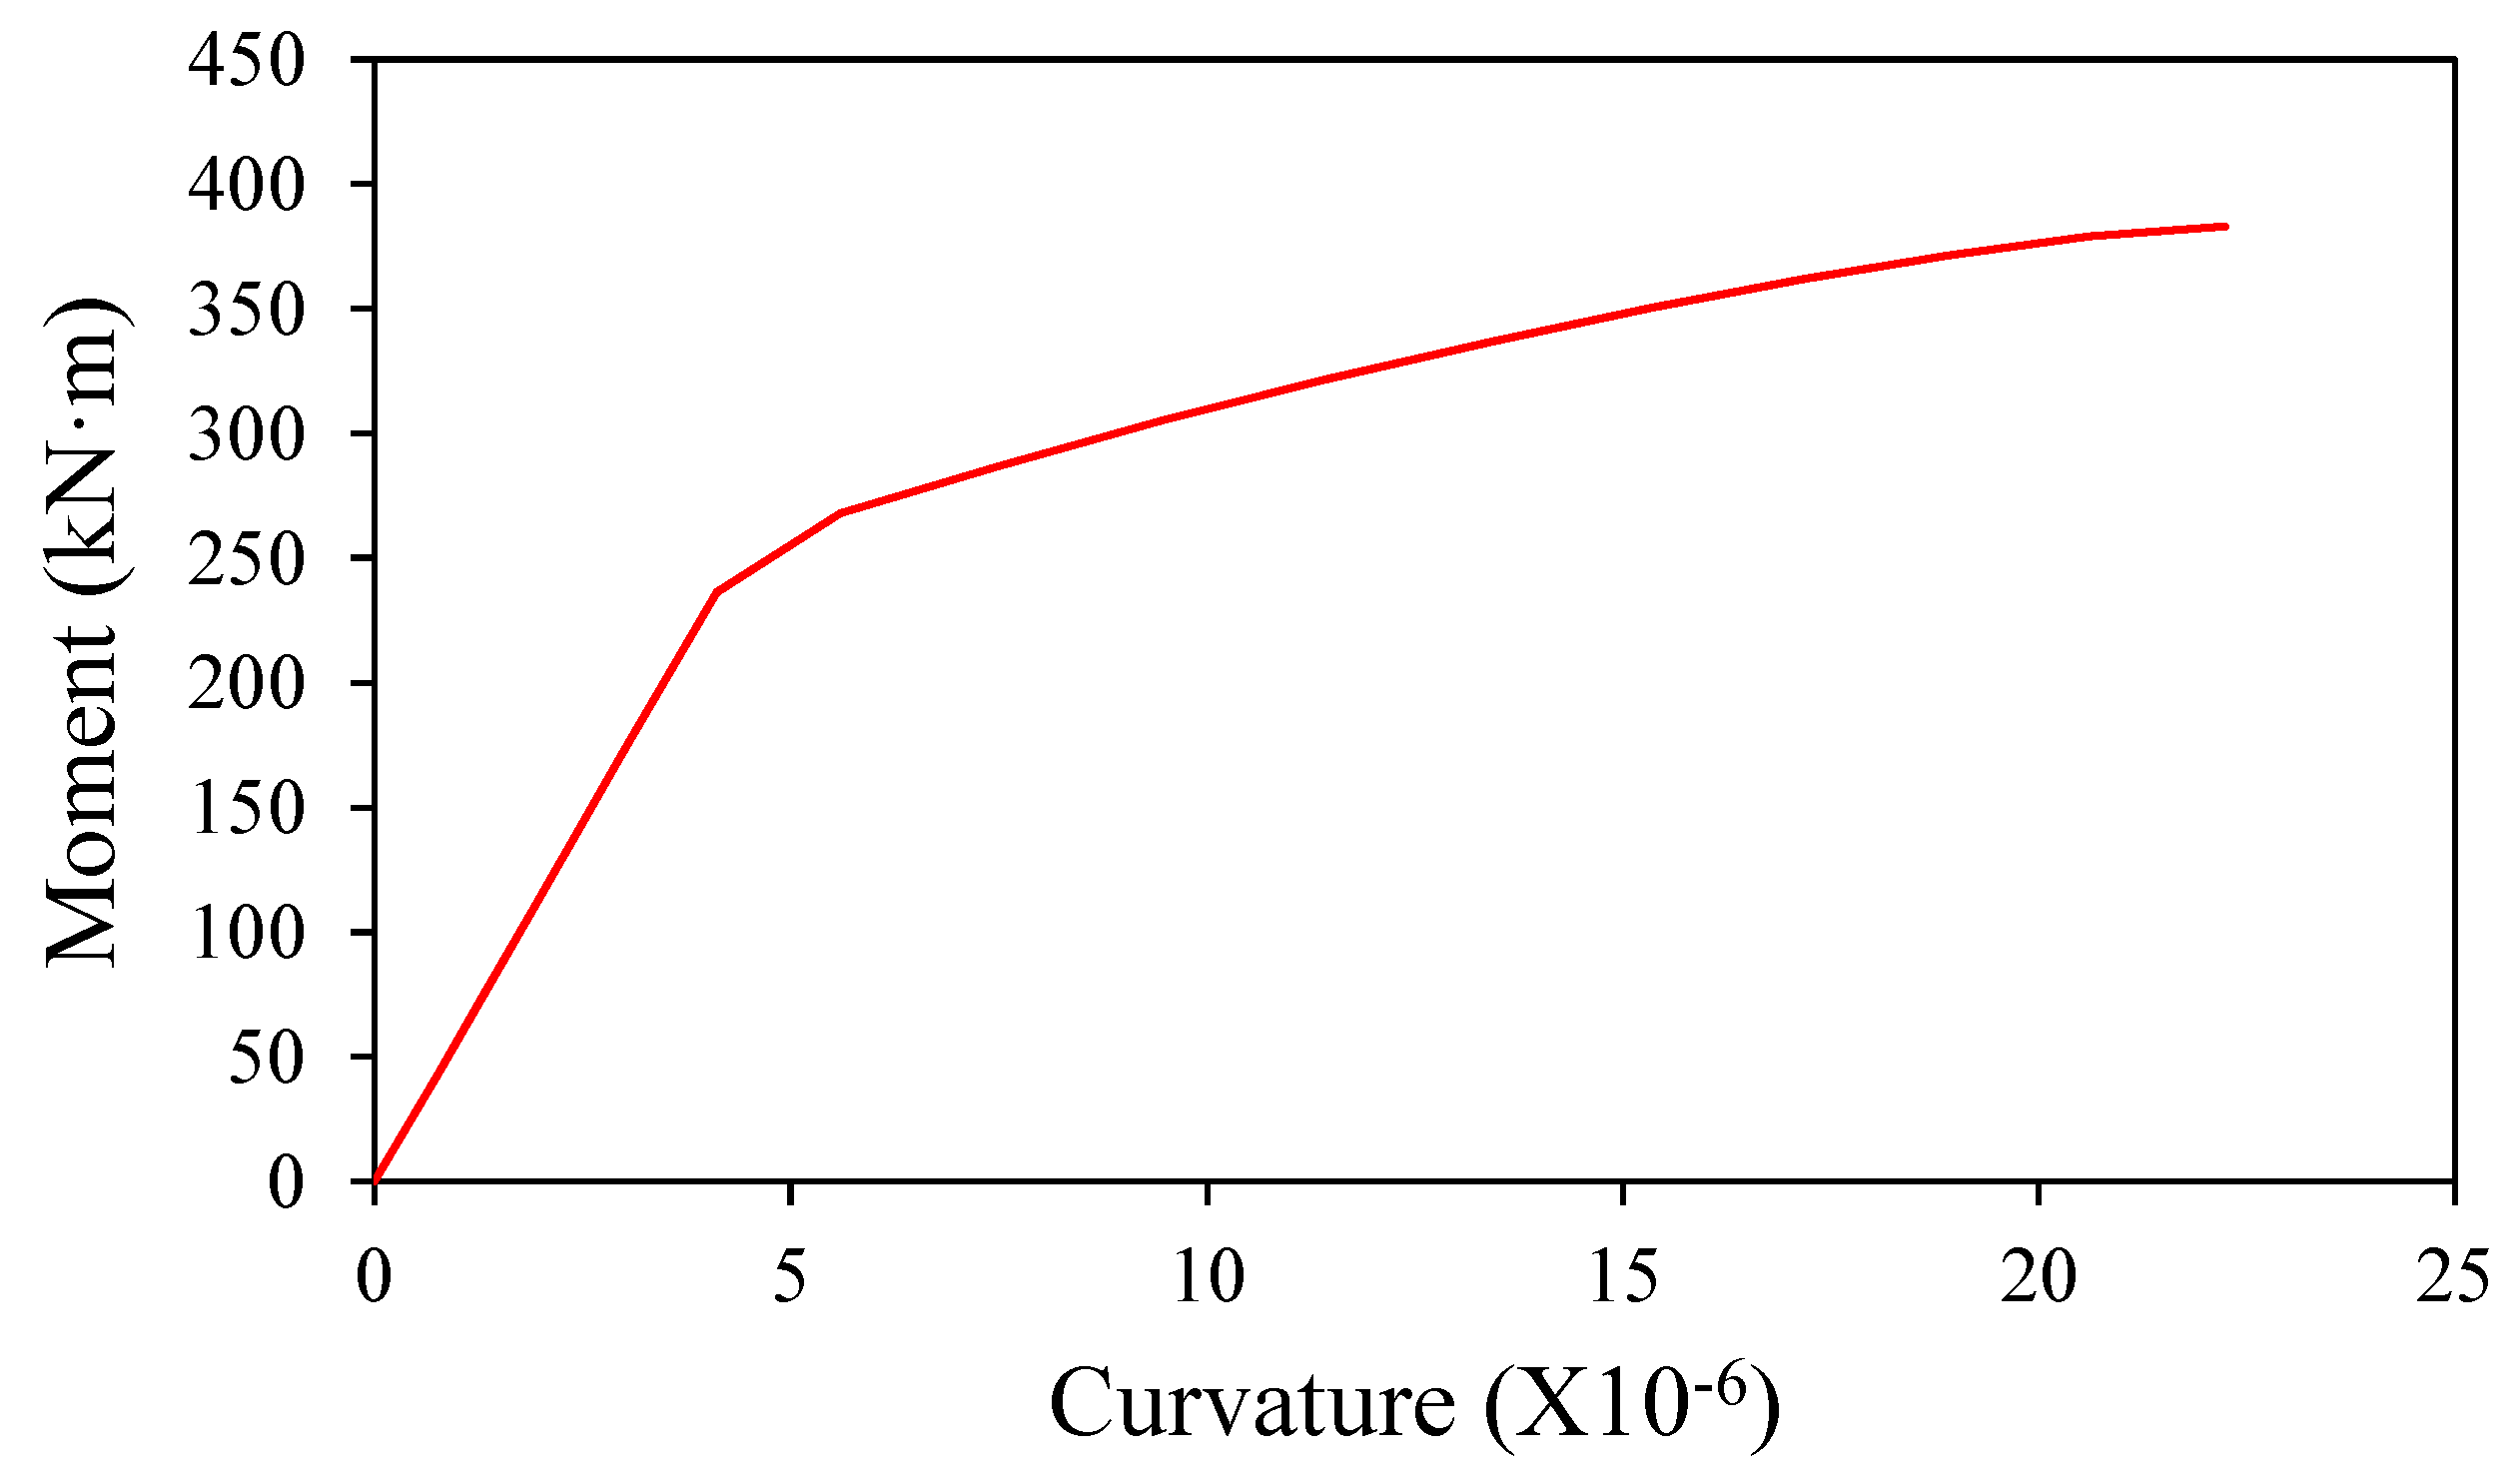
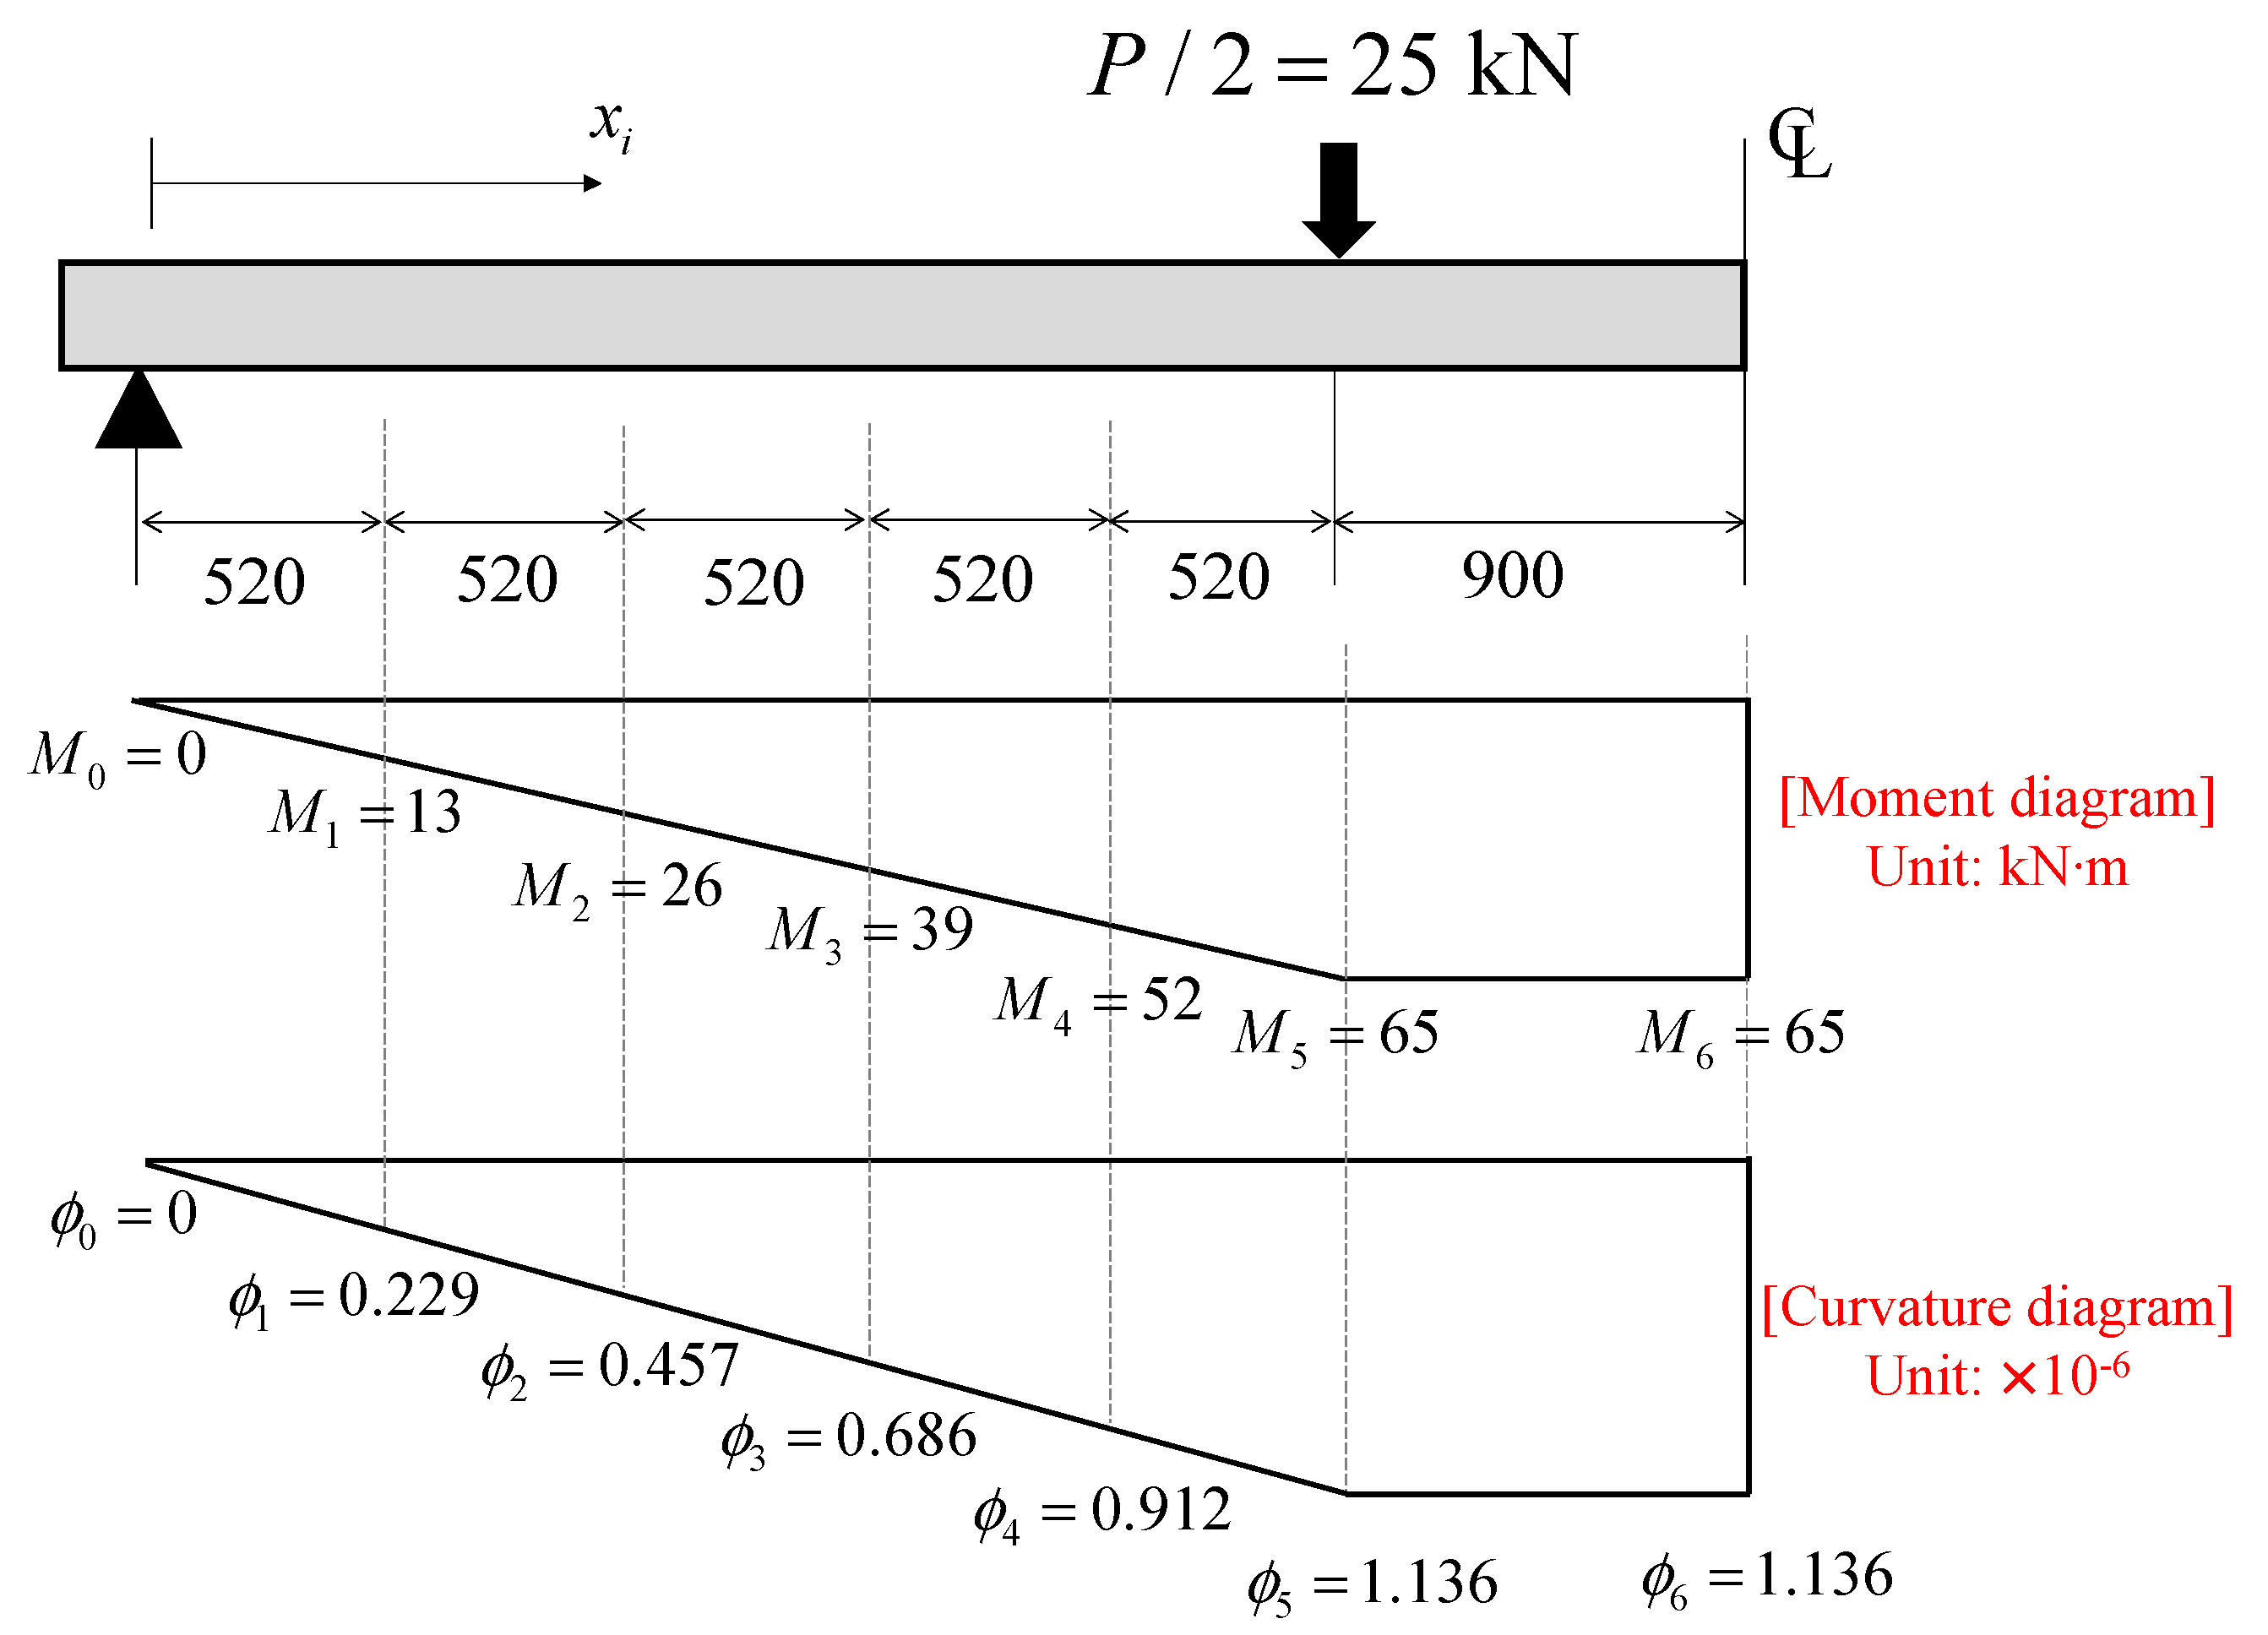
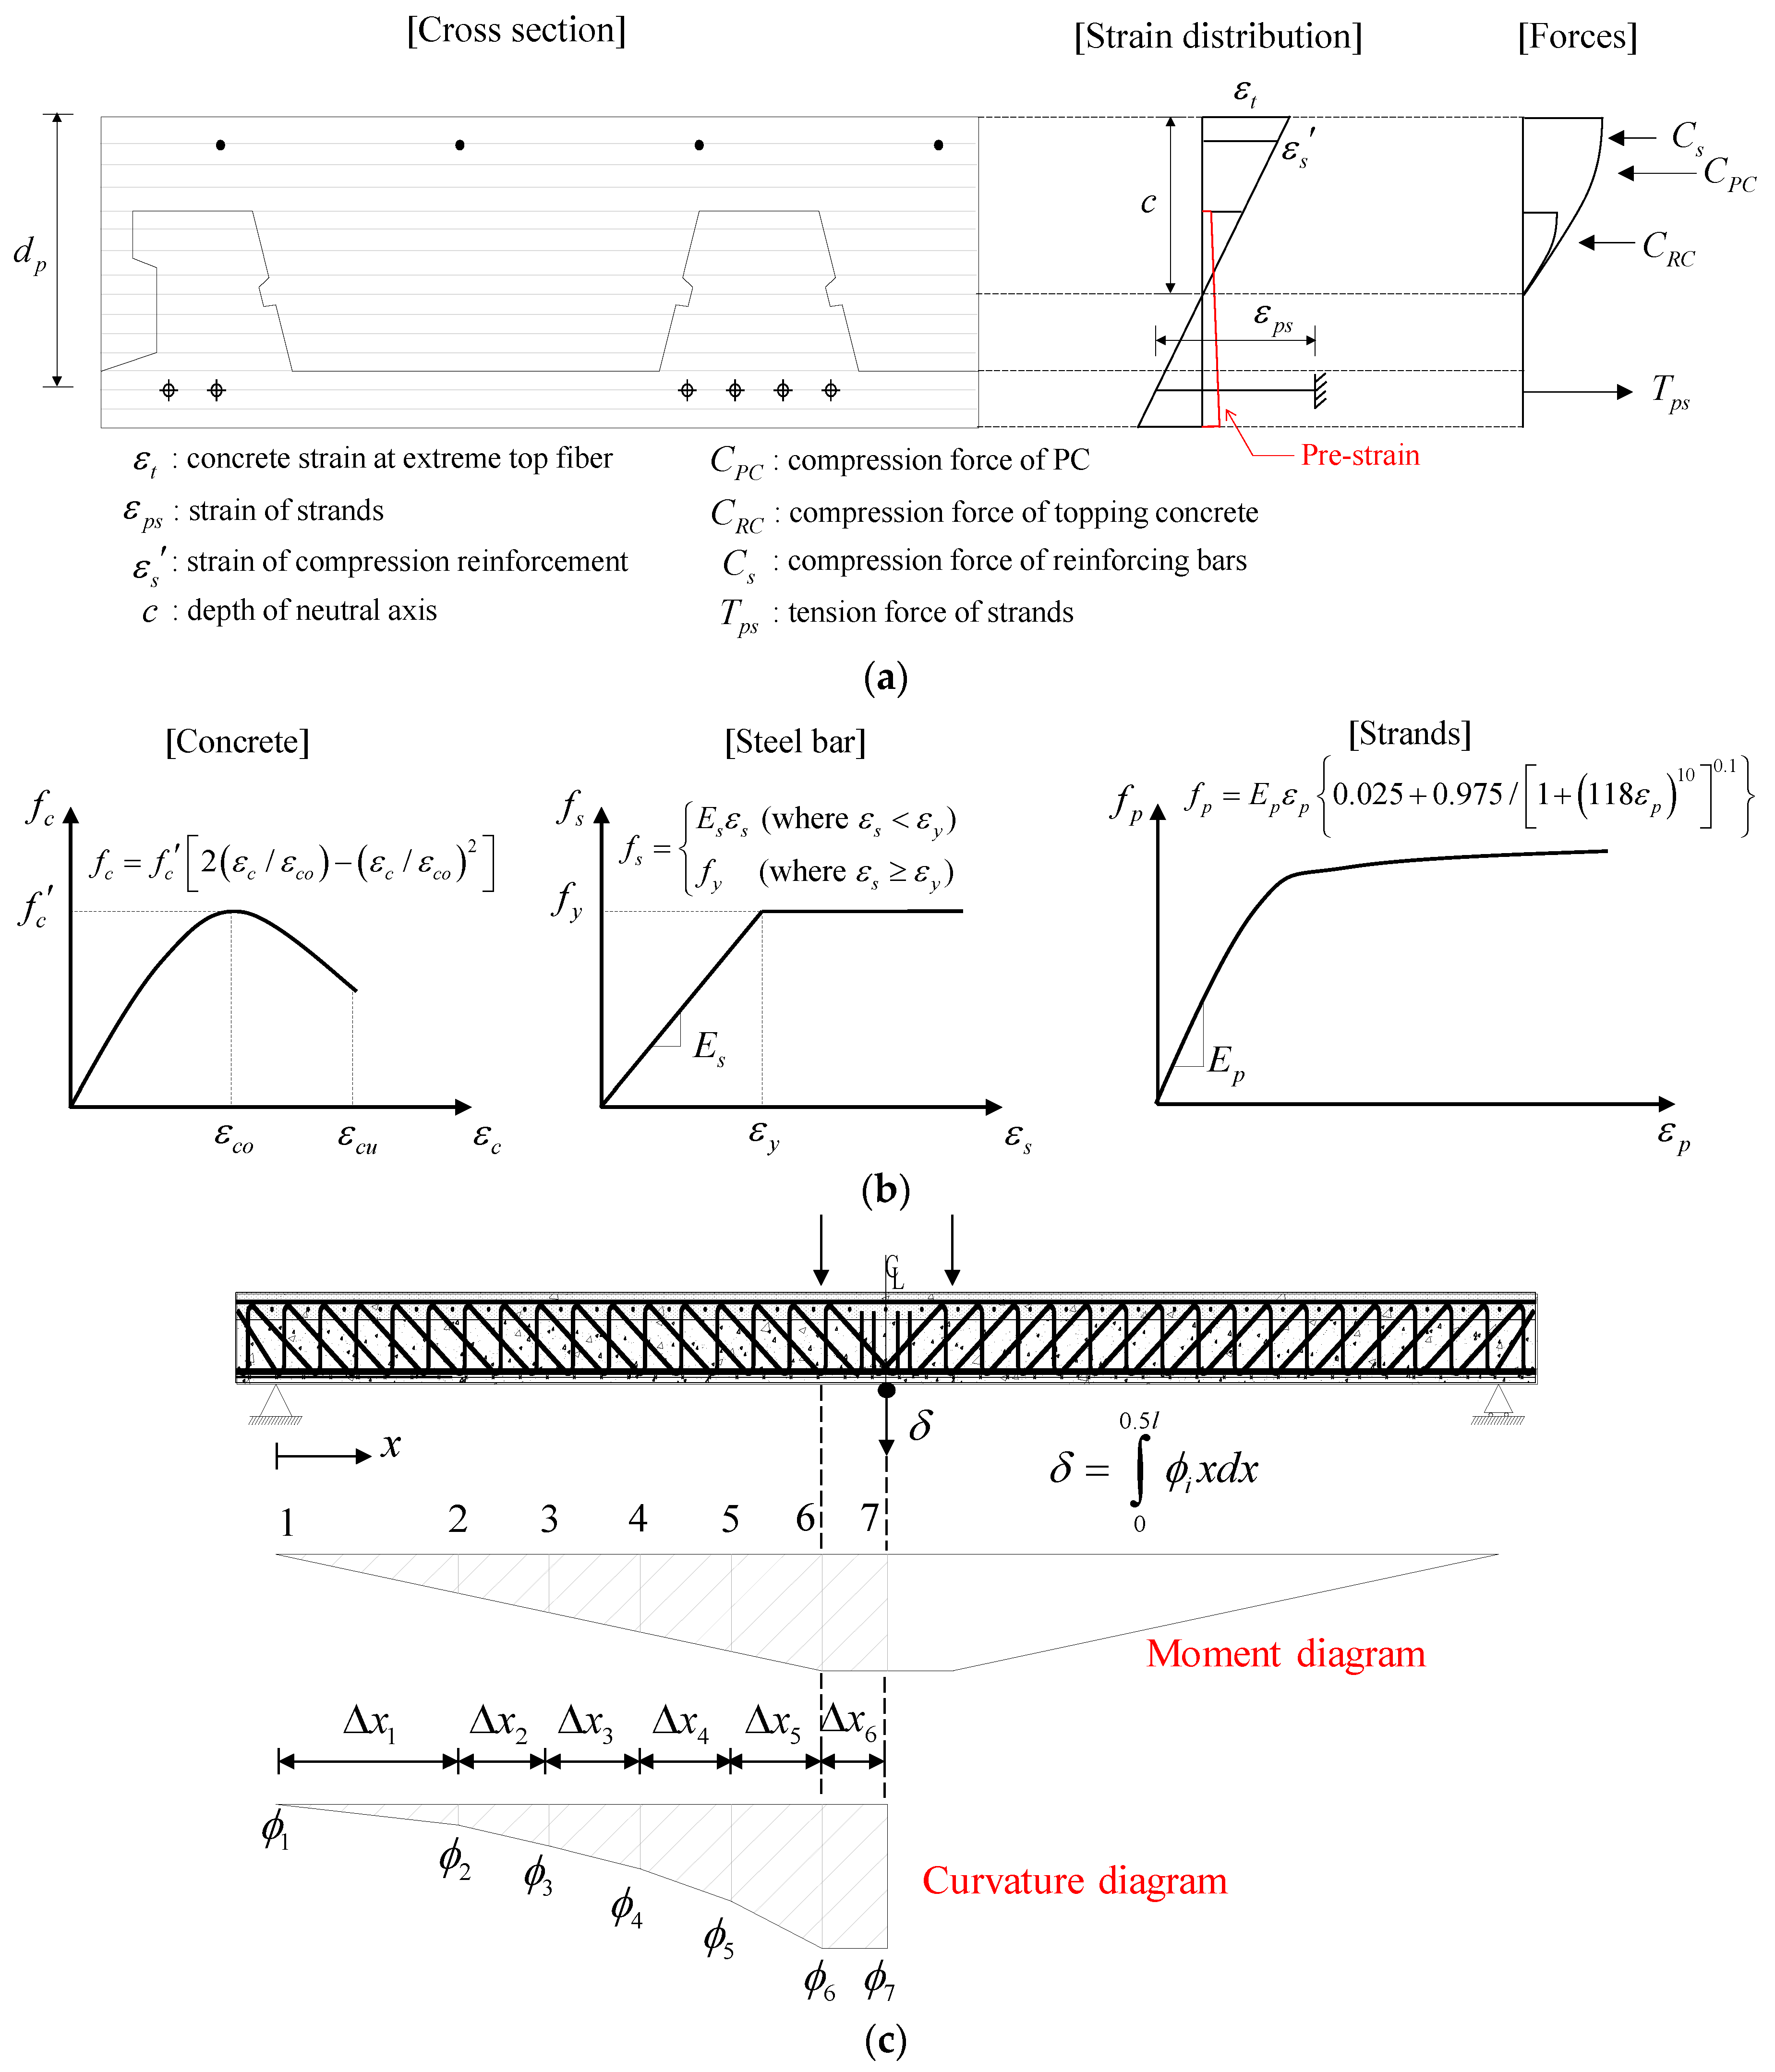
4.1. Non-Linear Flexural Analysis
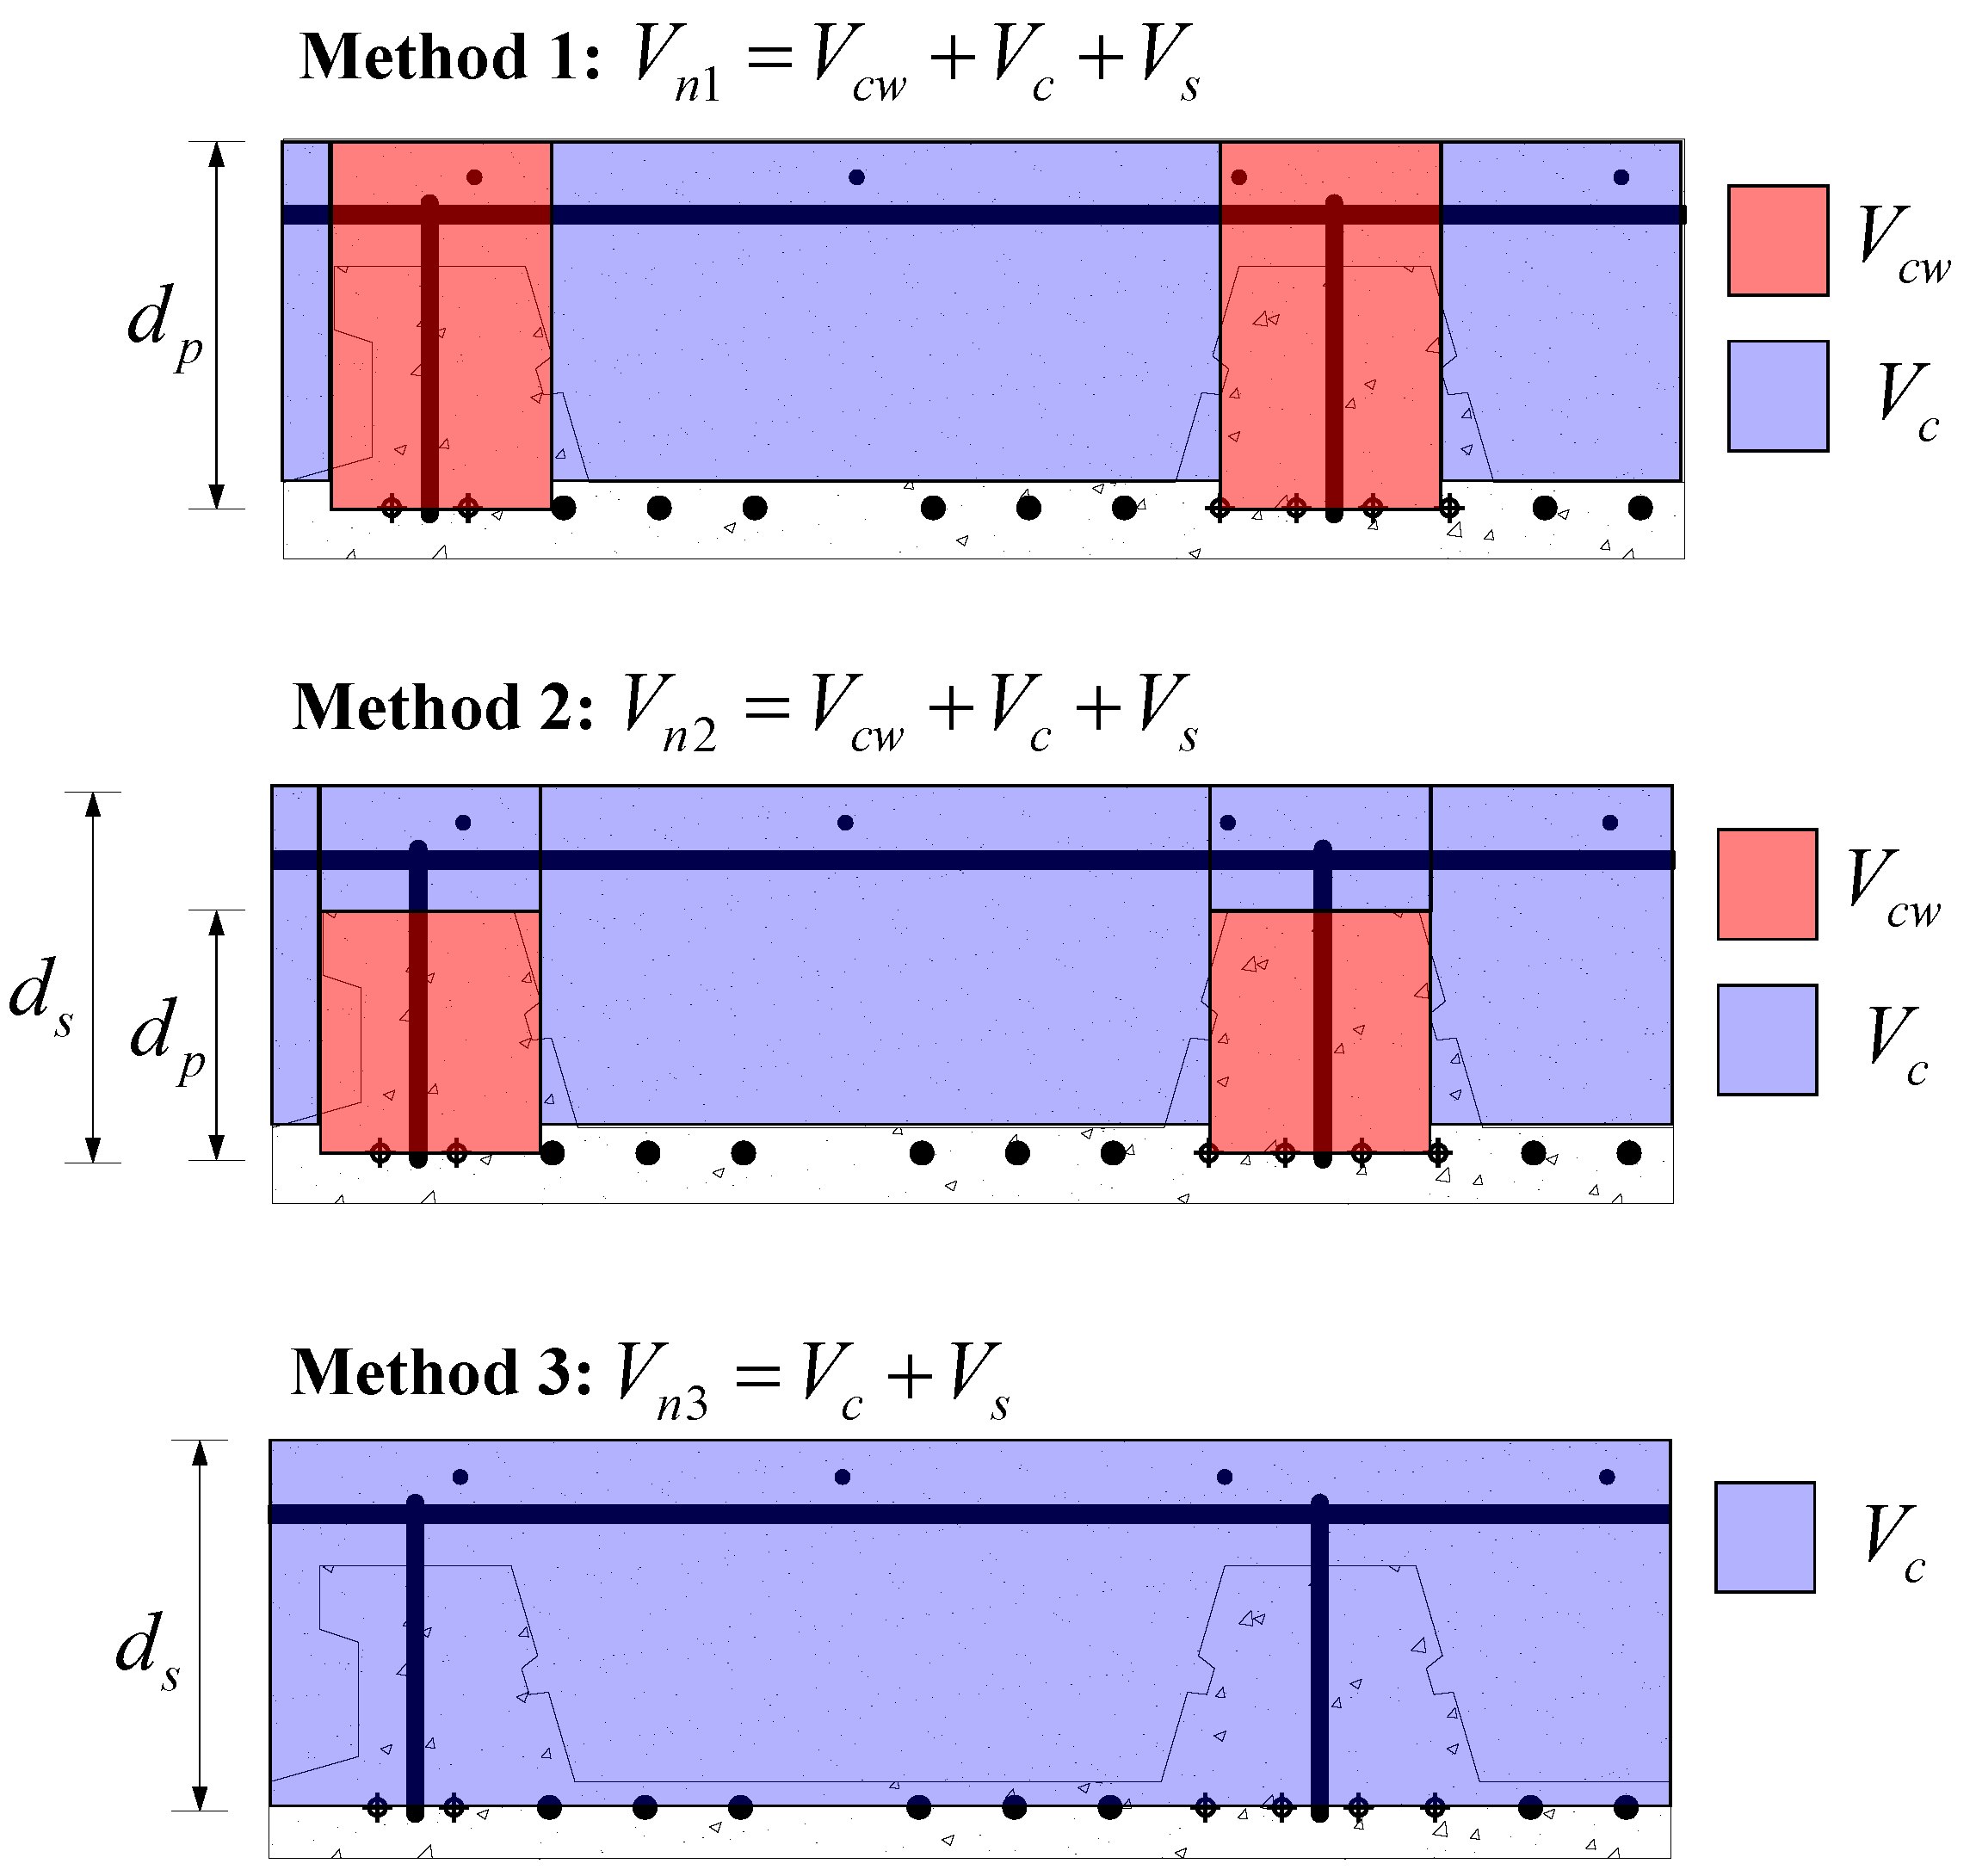
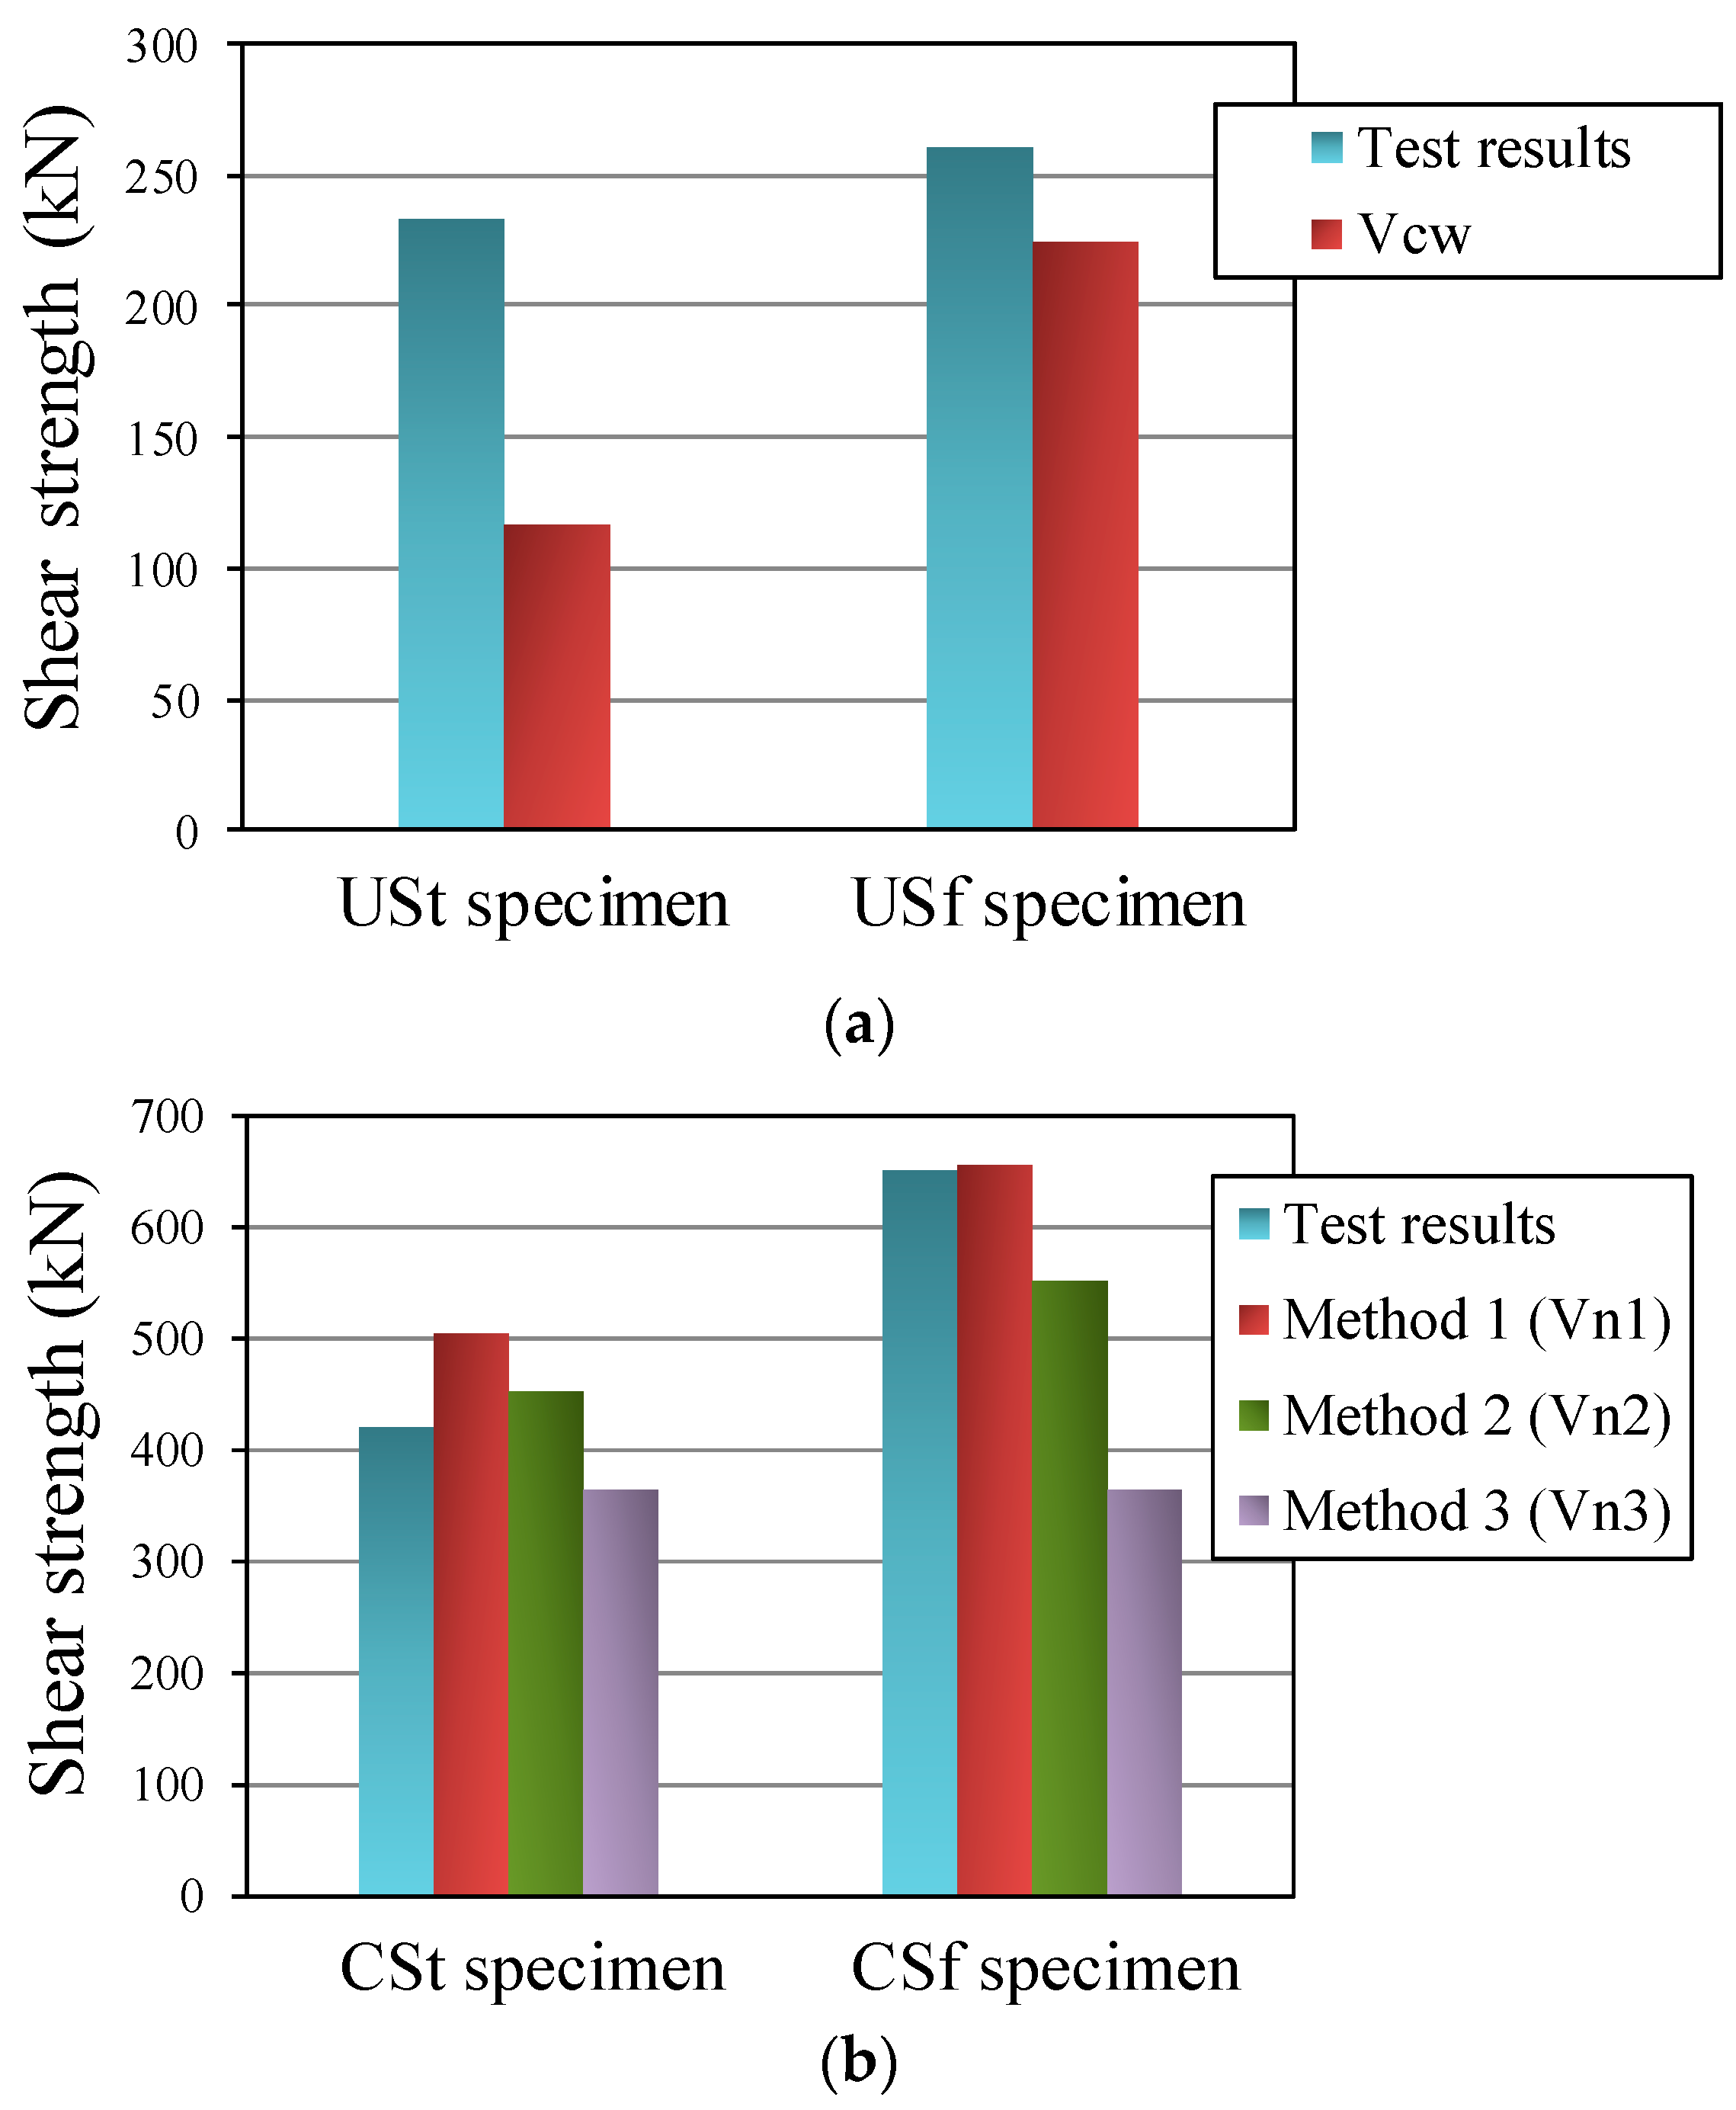
4.2. Estimation of Shear Strength
4.3. Comparison of Test and Analysis Results
5. Conclusions
- The UF specimen, a PC unit slab, exhibited a ductility slightly lower than that of the CF specimen with cast-in-place concrete; although the compressive force generated by the flexural moment should be resisted by the ribs, the rib is much narrower than the overall width of the member, and thus the position of the neural axis is relatively low.
- The non-linear flexural analysis provided very approximate evaluations of the flexural behavior and strength of the JAS, regardless of the presence of cast-in-place concrete, and thus can be applied to the flexural design of the JAS.
- The shear test results showed that the lattice reinforcement placed in composite specimens exhibited effective shear resistance performance, whereas the lattice reinforcement placed in PC unit specimens did not make a significant contribution to the shear resistance of the member. Therefore, the shear design results of the safe side can be obtained without considering the contribution of shear reinforcement () in the design of the PC unit slab.
- The shear crack angle observed in composite specimens was about 60°, which was steeper than that observed in the general PSC member. In addition, various methods for estimating the shear contributions of the PC unit and cast-in-place concrete were examined based on the ACI 318-14 code. The results confirmed that a method of calculating the contribution of shear reinforcement () by applying the crack angle () of 60°, and estimating the PC unit shear contribution () by regarding the distance from the top of the PC unit rib to the center of the strands layer as the effective depth () of the composite member, while estimating the shear strength by considering the remaining part as RC, provides the most reasonable analysis results.
Author Contributions
Funding
Acknowledgments
Conflicts of Interest
Appendix A
References
- Ju, H.; Han, S.J.; Choi, I.S.; Choi, S.; Park, M.K.; Kim, K.S. Experimental study on an optimized-section precast slab with structural aesthetics. Appl. Sci. 2018, 8, 1234. [Google Scholar] [CrossRef]
- Kim, S.E.; Colin, J. Multi-Story Precast Concrete Framed Structures, 2nd ed.; Wiley-Blackwell: Hoboken, NJ, USA, 2014; Available online: https://www.wiley.com/en-us/Multi+Storey+Precast+Concrete+Framed+Structures%2C+2nd+Edition-p-9781405106146 (accessed on 8 March 2019).
- Lee, D.H.; Park, M.K.; Oh, J.Y.; Kim, K.S.; Im, J.H.; Seo, S.Y. Web-shear capacity of prestressed hollow-core slab unit with consideration on the minimum shear reinforcement requirement. Comput. Concr. 2014, 14, 211–231. [Google Scholar] [CrossRef]
- Newell, S.; Goggins, J.; Hajdukiewicz, M.; Holleran, D. Behaviour of hybrid concrete lattice girder flat slab system using insitu structural health monitoring. In Proceedings of the Civil Engineering Research in Ireland Conference (CERI 2016), Galway, Ireland, 29–30 August 2016. [Google Scholar]
- Hou, H.; Liu, X.; Qu, B.; Ma, T.; Liu, H.; Feng, M.; Zhang, B. Experimental evaluation of flexural behavior of composite beams with cast-in-place concrete slabs on precast prestressed concrete decks. Eng. Struct. 2015, 126, 405–416. [Google Scholar] [CrossRef]
- Yang, L. Design of prestressed hollow core slabs with reference to web shear failure. J. Struct. Eng. 1994, 120, 2675–2696. [Google Scholar] [CrossRef]
- Palmer, K.D.; Schultz, A.E. Factors affecting web-shear capacity of deep hollow-core units. PCI J. 2010, 55, 123–146. [Google Scholar] [CrossRef]
- Palmer, K.D.; Schultz, A.E. Experimental investigation of the web-shear strength of deep hollow-core units. PCI J. 2011, 56, 83–104. [Google Scholar] [CrossRef]
- Pisanty, A. The shear strength of extruded hollow-core slabs. Mater. Struct. 1992, 25, 224–230. [Google Scholar] [CrossRef]
- Im, J.H.; Park, M.K.; Lee, D.H.; Kim, K.S.; Seo, S.Y. Evaluation of Web-Shear Capacity of Thick Hollow-Core Slabs; The Regional Association of Architectural Institute of Korea: Daegu, Korea, 2014; Volume 16, pp. 139–145. Available online: https://aikra.jams.or.kr/co/com/EgovMenu.kci?s_url=/sj/search/sjSereClasList.kci&s_MenuId=MENU-000000000053000 (accessed on 21 March 2019). (In Korean)
- ACI Committee 318. Building Code Requirements for Reinforced Concrete and Commentary; ACI 318-14; American Concrete Institute: Farmington Hills, MI, USA, 2014. [Google Scholar]
- Ju, H.; Han, S.J.; Joo, H.E.; Cho, H.C.; Kim, K.S.; Oh, Y.H. Shear performance of optimized-section precast slab with tapered cross section. Sustainability 2019, 11, 163. [Google Scholar] [CrossRef]
- Naito, C.; Cao, L.; Peter, W. Precast concrete double-tee connections, part 1: Tension behavior. PCI J. 2009, 54, 49–66. [Google Scholar] [CrossRef]
- Cao, L.; Naito, C. Precast concrete double-tee connectors, part 2: Shear behavior. PCI J. 2009, 54, 97–115. [Google Scholar] [CrossRef]
- Rubene, S.; Vilnitis, M. Impact of low temperatures on compressive strength of concrete. Int. J. Theor. Appl. Mech. 2017, 2, 97–101. [Google Scholar]
- Collins, M.P.; Mitchell, D. Prestressed Concrete Structures; Prentice-Hall: Upper Saddle River, NJ, USA, 1991. [Google Scholar]
- Lee, D.H.; Han, S.J.; Joo, H.E.; Kim, K.S. Control of tensile stress in prestressed concrete members under service loads. Int. J. Concr. Struct. Mater. 2018, 12, 38. [Google Scholar] [CrossRef]
- Han, S.J.; Lee, D.H.; Oh, J.Y.; Choi, S.H.; Kim, K.S. Flexural responses of prestressed hybrid wide flange composite girders. Int. J. Concr. Struct. Mater. 2018, 12, 53. [Google Scholar] [CrossRef]
- Vecchio, F.J.; Collins, M.P. The modified compression-field theory for reinforced concrete elements subjected to shear. ACI J. Proc. 1986, 83, 219–231. [Google Scholar] [CrossRef]
- Scholz, H. Ductility, redistribution, and hyperstatic moments in partially prestressed members. ACI Struct. J. 1990, 87, 341–349. [Google Scholar] [CrossRef]
- Rodriguez-Gutierrez, J.A.; Aristizabal-Ochoa, J.D. Partially and fully prestressed concrete sections under biaxial bending and axial load. ACI Struct. J. 2000, 97, 553–563. [Google Scholar] [CrossRef]
- Mattock, A.H. Flexural strength of prestressed concrete sections by programmable calculator. PCI J. 1979, 24, 32–54. [Google Scholar] [CrossRef]
- Park, H.; Cho, J.Y. Ductility analysis of prestressed concrete members with high-strength strands and code. ACI Struct. J. 2017, 114, 407–416. [Google Scholar] [CrossRef]


| Specimen | Description | Test Region | h (mm) *** | dp, ds (mm) *** | Aps, As (mm2) *** | Stirrups ** | fc’ (MPa) *** | ||
|---|---|---|---|---|---|---|---|---|---|
| Strands * | Rebar ** | PC | Topping | ||||||
| UF | Flexure (without topping) | - | 230 | 190 | 6-Φ15.2 (832.2) | - | D10@200 + D10@200 (inclined) | 27.0 | - |
| CF | Flexure (with topping) | - | 330 | 290 | 6-Φ15.2 (832.2) | - | 36.0 | 21.3 | |
| USt | Shear (without topping) | Transfer length zone | 230 | 190 | 6-Φ15.2 (832.2) | - | 27.0 | - | |
| USf | Shear (without topping) | Strain plateau zone | 230 | 190 | 6-Φ15.2 (832.2) | 8-D19 (2288) | 27.0 | - | |
| CSt | Shear (with topping) | Transfer length zone | 330 | 290 | 6-Φ15.2 (832.2) | 8-D19 (2288) | 36.0 | 18.5 | |
| CSf | Shear (with topping) | Strain plateau zone | 330 | 290 | 6-Φ15.2 (832.2) | 8-D19 (2288) | 36.0 | 18.5 | |
| Specimen | Failure Mode | Failure Loads (Pu, kN) | Flexural Strength (Mu, kN·m) | Shear Strength (Vu, kN) |
|---|---|---|---|---|
| UF | Flexure | 96.2 | 125.1 | - |
| CF | Flexure | 267.1 | 347.2 | - |
| USt | Shear | 291.0 | - | 232.8 |
| USf | Shear | 325.6 | - | 260.5 |
| CSt | Shear | 548.0 | - | 420.1 |
| CSf | Shear | 848.8 | - | 650.7 |
| Term | Equations |
|---|---|
| Shear strength of reinforced concrete () | |
| Web shear strength of prestressed concrete () | , where |
| Shear contribution of stirrups () |
| Specimen | Test Results (Vu, kN) | Calculation Results (Vn, kN) | ||
|---|---|---|---|---|
| Vn1 (Ratio, Vu/Vn1) | Vn2 (Ratio, Vu/Vn2) | Vn3 (Ratio, Vu/Vn3) | ||
| USt | 232.8 | 115.9 (2.01) | ||
| USf | 260.4 | 223.9 (1.16) | ||
| CSt | 420.3 | 504.8 (0.83) | 452.7 (0.93) | 364.7 (1.15) |
| CSf | 651.2 | 655.9 (0.99) | 551.7 (1.18) | 364.7 (1.78) |
© 2019 by the authors. Licensee MDPI, Basel, Switzerland. This article is an open access article distributed under the terms and conditions of the Creative Commons Attribution (CC BY) license (http://creativecommons.org/licenses/by/4.0/).
Share and Cite
Han, S.-J.; Jeong, J.-H.; Joo, H.-E.; Choi, S.-H.; Choi, S.; Kim, K.S. Flexural and Shear Performance of Prestressed Composite Slabs with Inverted Multi-Ribs. Appl. Sci. 2019, 9, 4946. https://doi.org/10.3390/app9224946
Han S-J, Jeong J-H, Joo H-E, Choi S-H, Choi S, Kim KS. Flexural and Shear Performance of Prestressed Composite Slabs with Inverted Multi-Ribs. Applied Sciences. 2019; 9(22):4946. https://doi.org/10.3390/app9224946
Chicago/Turabian StyleHan, Sun-Jin, Jae-Hoon Jeong, Hyo-Eun Joo, Seung-Ho Choi, Seokdong Choi, and Kang Su Kim. 2019. "Flexural and Shear Performance of Prestressed Composite Slabs with Inverted Multi-Ribs" Applied Sciences 9, no. 22: 4946. https://doi.org/10.3390/app9224946
APA StyleHan, S.-J., Jeong, J.-H., Joo, H.-E., Choi, S.-H., Choi, S., & Kim, K. S. (2019). Flexural and Shear Performance of Prestressed Composite Slabs with Inverted Multi-Ribs. Applied Sciences, 9(22), 4946. https://doi.org/10.3390/app9224946