Article

The Design of an Automated System for the Analysis of the Activity and Emotional Patterns of Dogs with Wearable Sensors Using Machine Learning

1
Institute of Digital Anti-Aging Healthcare, Inje University, Gimhae 50834, Korea
2
Department of Computer Engineering, Inje University, Gimhae 50834, Korea
3
u-HARC, Inje University, Gimhae 50834, Korea
*
Author to whom correspondence should be addressed.
Appl. Sci. 2019, 9(22), 4938; https://doi.org/10.3390/app9224938
Submission received: 23 September 2019 / Revised: 12 November 2019 / Accepted: 13 November 2019 / Published: 16 November 2019
(This article belongs to the Collection Energy-efficient Internet of Things (IoT))

Abstract

:
The safety and welfare of companion animals such as dogs has become a large challenge in the last few years. To assess the well-being of a dog, it is very important for human beings to understand the activity pattern of the dog, and its emotional behavior. A wearable, sensor-based system is suitable for such ends, as it will be able to monitor the dogs in real-time. However, the question remains unanswered as to what kind of data should be used to detect the activity patterns and emotional patterns, as does another: what should be the location of the sensors for the collection of data and how should we automate the system? Yet these questions remain unanswered, because to date, there is no such system that can address the above-mentioned concerns. The main purpose of this study was (1) to develop a system that can detect the activities and emotions based on the accelerometer and gyroscope signals and (2) to automate the system with robust machine learning techniques for implementing it for real-time situations. Therefore, we propose a system which is based on the data collected from 10 dogs, including nine breeds of various sizes and ages, and both genders. We used machine learning classification techniques for automating the detection and evaluation process. The ground truth fetched for the evaluation process was carried out by taking video recording data in frame per second and the wearable sensors data were collected in parallel with the video recordings. Evaluation of the system was performed using an ANN (artificial neural network), random forest, SVM (support vector machine), KNN (k nearest neighbors), and a naïve Bayes classifier. The robustness of our system was evaluated by taking independent training and validation sets. We achieved an accuracy of 96.58% while detecting the activity and 92.87% while detecting emotional behavior, respectively. This system will help the owners of dogs to track their behavior and emotions in real-life situations for various breeds in different scenarios.

1. Introduction

The rapid development of digital information processing technology provided an opportunity to explore the behavior of the animals aside from direct observation by humans [1]. The crucial step in understanding animal behavior, which includes the activity patterns and emotional patterns, is to create specific ethograms related to that species by monitoring the body postures and the physical movements [1,2,3]. One approach for monitoring these behaviors needs a continuous collection of data by using human observers. However, this approach is not ideal because (1) continuous observation by a human and interfering with the normal life of pets by continuous observation can have a negative impact on a pet’s behavior and health. (2) The observation process is costly and labor-intensive. The other approach for the collection of data is by leveraging an automated system without interfering with pets’ normal lives. The automated system that is available now uses sensors and it can be directly attached to dogs; or it creates an environment using the sensors for the collection of data [4]. In recent years, it has been observed that automated systems for the identification of behaviors are getting popular because the attached sensors in the automated systems have the potential to discriminate various activity patterns and emotional patterns. In the domain of biosignal processing, it is a well-known fact that comprehending the information from multiple sensors attached to one’s body allows an increased level of precision and accuracy. For the case of decision making with respect to one’s health, state of mind, activity, and emotion, there are a lot of factors to consider, and therefore, leveraging multiple body sensors in this case is deemed necessary. Additionally, fetching the data from multiple body sensors and performing a fusion with respect to the features enables much more information acquisition, as it improves the signal to noise ratio, reduces ambiguity and uncertainty, increases confidence, enhances the robustness and reliability of the data, and improves the data’ resolution [5,6,7]. However, in the last decade, the implementation of multiple body sensors for the resolution of a particular decision was a subject of debate, as there were limited resources and robust frameworks for the management of multi-sensory data. But with the advent of body sensor networks (BSN) and enterprise cloud architectures, the process of rapid prototyping and deployment has become much easier [8,9].
With respect to the case of animals, the body movement characteristics and the tail movement characteristics are important for the identification of behavioral patterns. Therefore, accelerometer and gyroscope sensors are normally used in automated systems. The accelerometer sensors can measure the static accelerations and the dynamic acceleration of the body movements and the gyroscope can measure the rotational movement of the body [10,11,12,13]. In this study, an automated system was developed to understand the activity patterns of dogs by collecting accelerometer and gyroscope data respectively, with wearable devices being placed at the neck and the tail of the dog; and their emotional patterns were studied by collecting the accelerometer and gyroscope data of the tail. Seven distinct activities—walking, sitting, “stay,” eating, “sideway” (moving sideways), jumping, and nose-work were chosen for collecting the data to automate the activity pattern, and three emotional states—positive, negative and neutral, were chosen, based on the tail wagging of the dog to automate the emotional pattern detection system. The positive behavior was indicated when the dog was wagging the tail to the right side of the body. The negative was indicated when the dog was wagging the tail to the left side of the body. The neutral position was indicated by the straight wagging position, during which it does not sway either to the right or to the left of the body [14]. Our system was developed based on the data collected from 10 different dogs of various sizes, breeds, and ages. The objective of this study was to develop an automated system that could accept accelerometer and gyroscope data as input and distinguish different activity patterns and emotional patterns using supervised machine learning algorithms. An evaluation of the system was performed using supervised machine learning algorithms—an ANN (artificial neural network), a random forest, a SVM (support vector machine), KNN (k nearest neighbors), and a naïve Bayes classifier. Most of the past studies focused on the activity detection of different animals using wearable accelerometers but very few have considered both accelerometer and gyroscope sensors for activity detection. On the other hand, various studies in the past found the relationship between the tail wagging and emotional response by using visual stimulation. The visual stimulation creates an abnormal behavior in the body that changes the cardiac activity, that in turn changes the emotional responses. As the tail wagged towards the right, higher cardiac activity was observed in the dog, and with the tail wagged to the left, lower cardiac activity was observed in the dog [15]. Past studies provide enough evidence that heart rate has a direct relationship with the emotions of human beings and animals [16]. Based on the evidence, few studies used electroencephalogram (EEG), electrocardiogram (ECG), and photoplethysmography (PPG) signals to detect the emotional pattern of human beings [17]. At the same time, a few other studies considered accelerometer data for emotional detection, and so far nobody has considered the combination of accelerometer and gyroscope sensors for emotion-detection. After getting lot of evidence from past studies, we decided to use neck-wearable and tail-worn sensors for detecting the activity patterns and emotional patterns of household pets. In this study, we made the first attempt to develop an automated system that uses neck and tail-worn sensors data for activity and emotion pattern classifications, respectively. We used conventional machine learning techniques and incremental machine learning techniques for the performance comparison. We also tested our system with validation sets of data and received optimum prediction performance from the machine learning models, which indicates that our system has the potential to be used in real-life situations.
The structure of the paper is organized as follows: Section 2 describes the related work regarding the study, where all the state-of-the-art methods in the wearable sector and activity detection are duly discussed. Section 3 provides a behavioral understanding with regard to the data collection procedure and the experimental procedure. Section 4 provides the methodology of the complete work and also includes the featured engineering process and gives an overview of the usage of classification algorithms for solving our particular problem. Section 5 provides the results that were generated from the complete work. Section 6 discusses study overall, and its future implications. Finally, Section 7 concludes the paper.

2. Related Work

The previous studies on wearable sensor-based activity detection and emotion detection are mentioned in Table 1. The literature mentioned in Table 1 describes successful uses of wearable devices, especially accelerometers, gyroscopes, PPG and ECG sensors for detecting behavioral patterns that include the activity detection and the emotion detection of different animals. However, we have seen that past studies mostly focused on accelerometer data for the detection of activities, and PPG and ECG data for emotion detection. Except for a few studies, most of the studies did not consider the combination of accelerometer and gyroscope data together for activity detection; at the same time, most studies did not consider the acceleration and gyroscope data together for emotion detection. One more point that is worth noting from the previous studies is that most of them considered the collar or back of the animal for fixing the sensor for data collection. Past authors gave their specific recommendations on sensor locations. Therefore, in this paper we decided to explore the locations of the neck and tail at the same time considering both accelerometer and gyroscope data to develop a robust model for activity detection. Additionally, the previous literature [14,15] mentioned that emotional stimulation can be observed through tail wagging; therefore, in this study, we used the tail accelerometer data and gyroscope data for emotion detection.

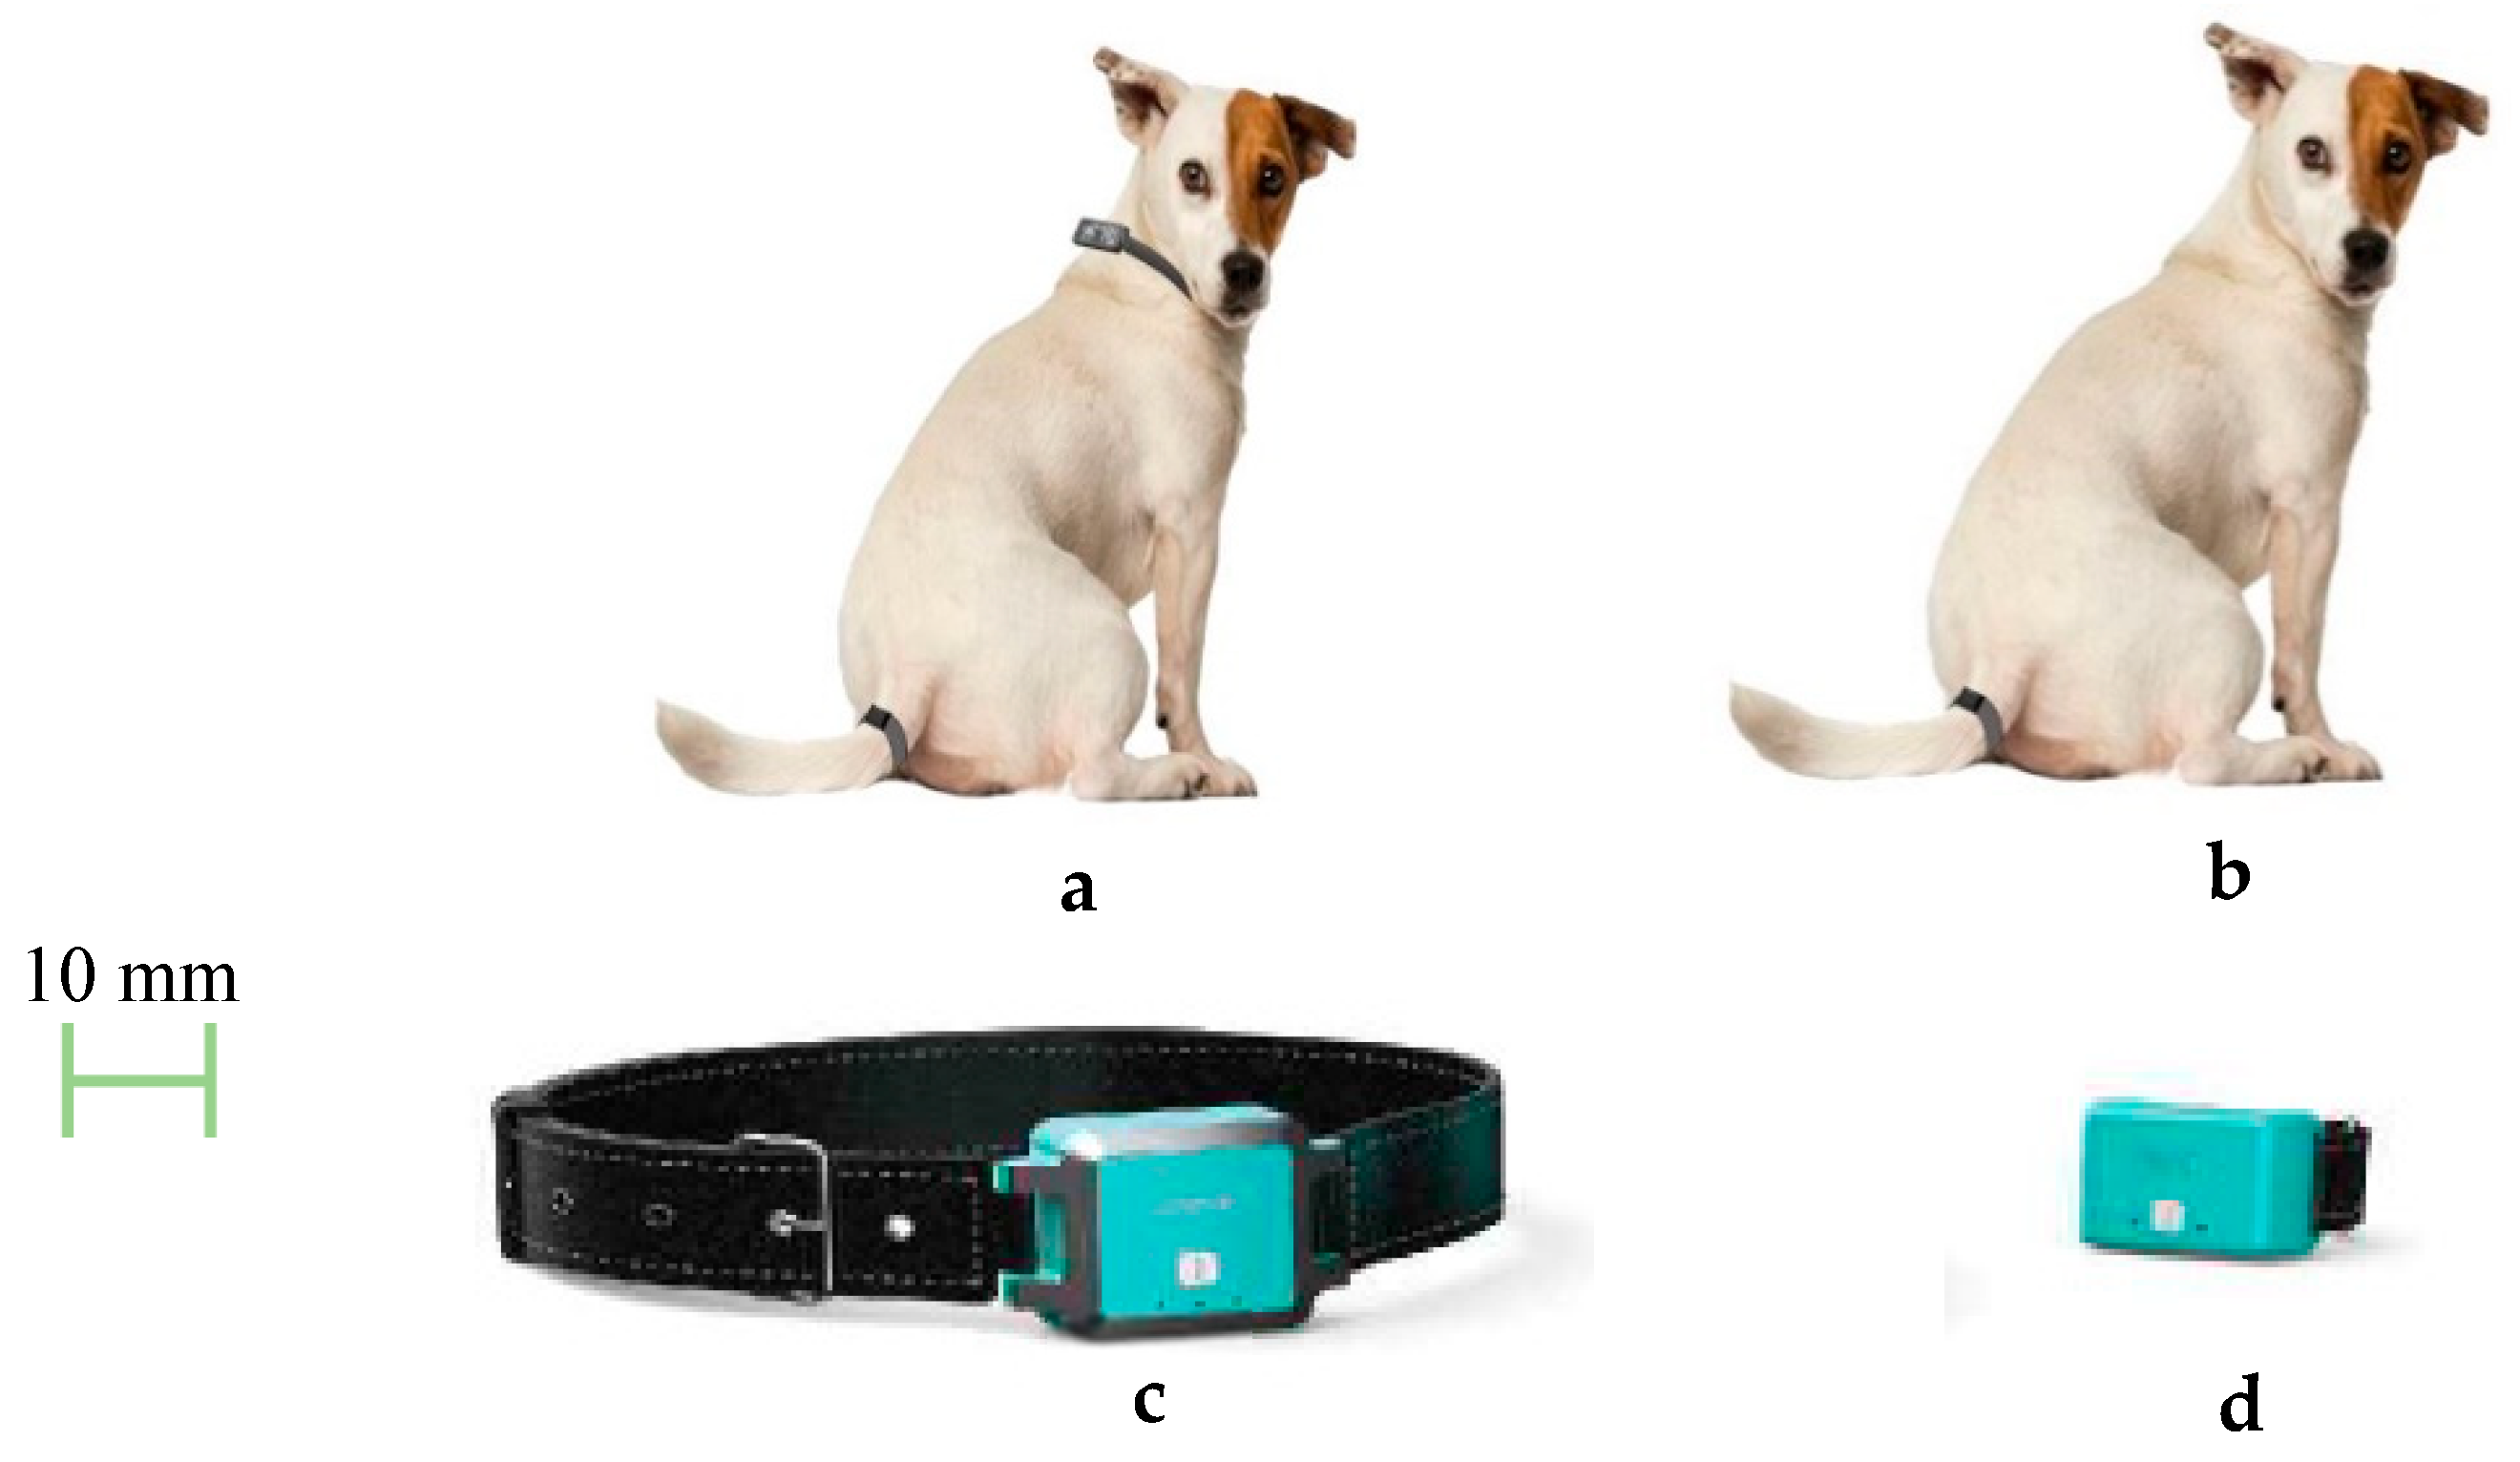
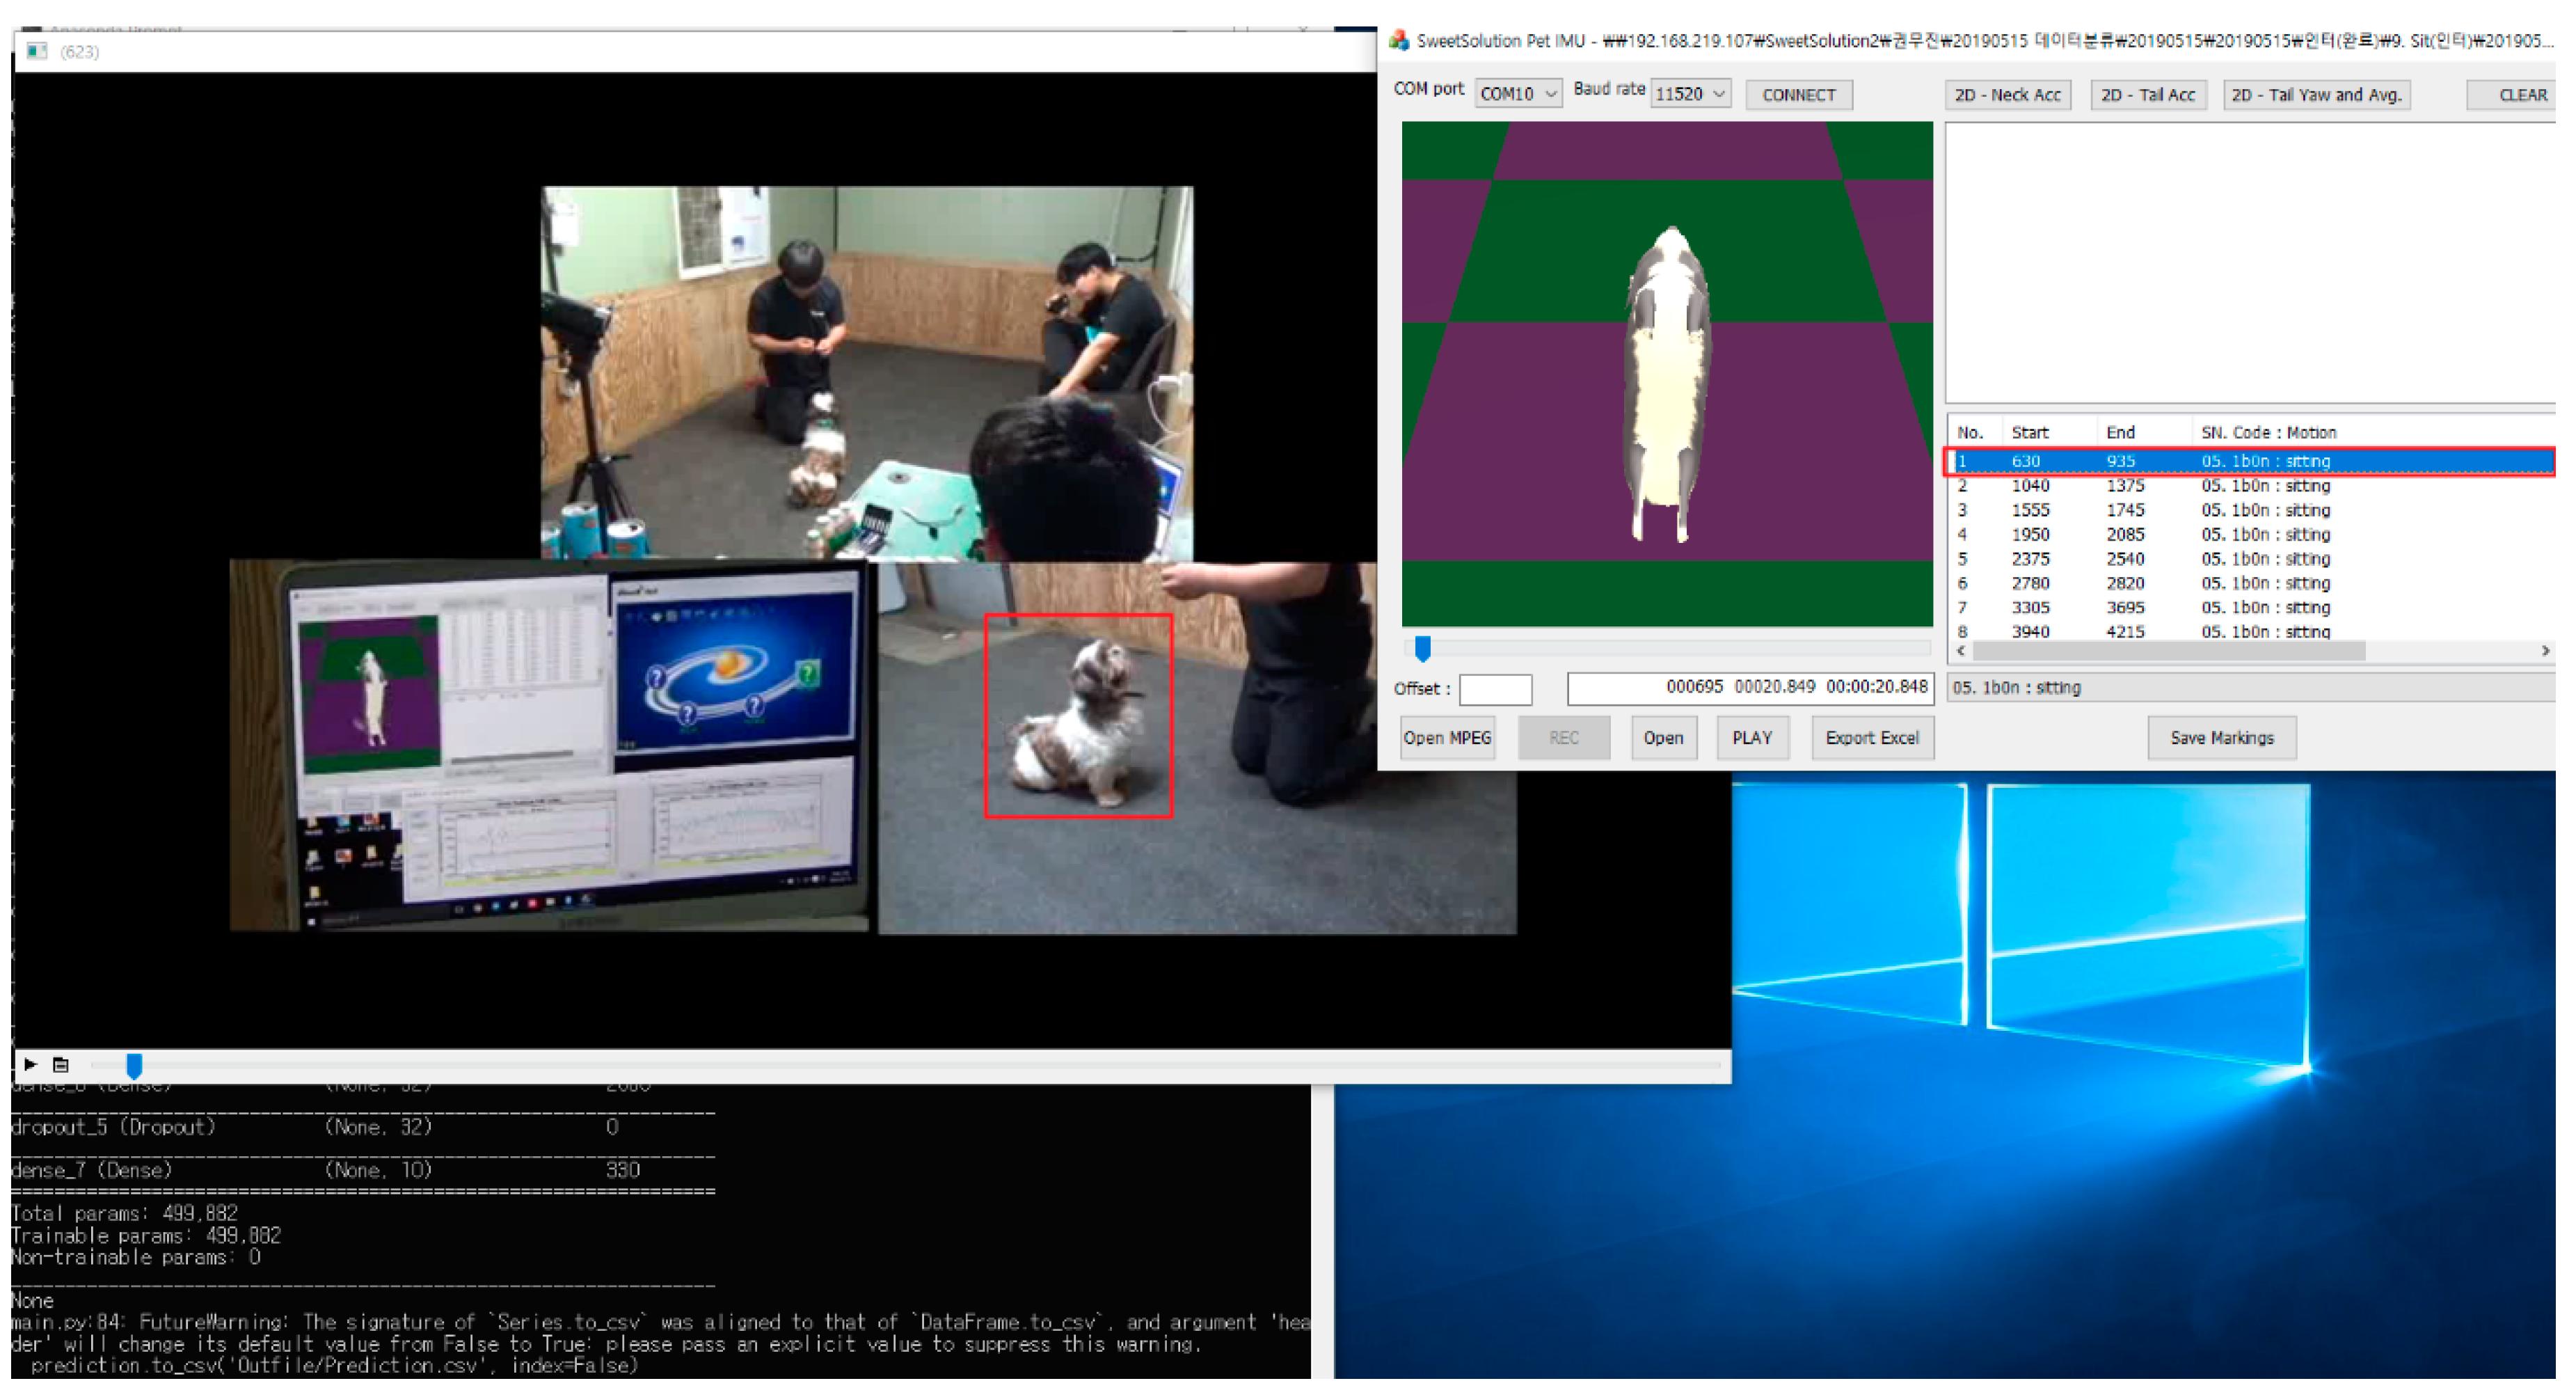
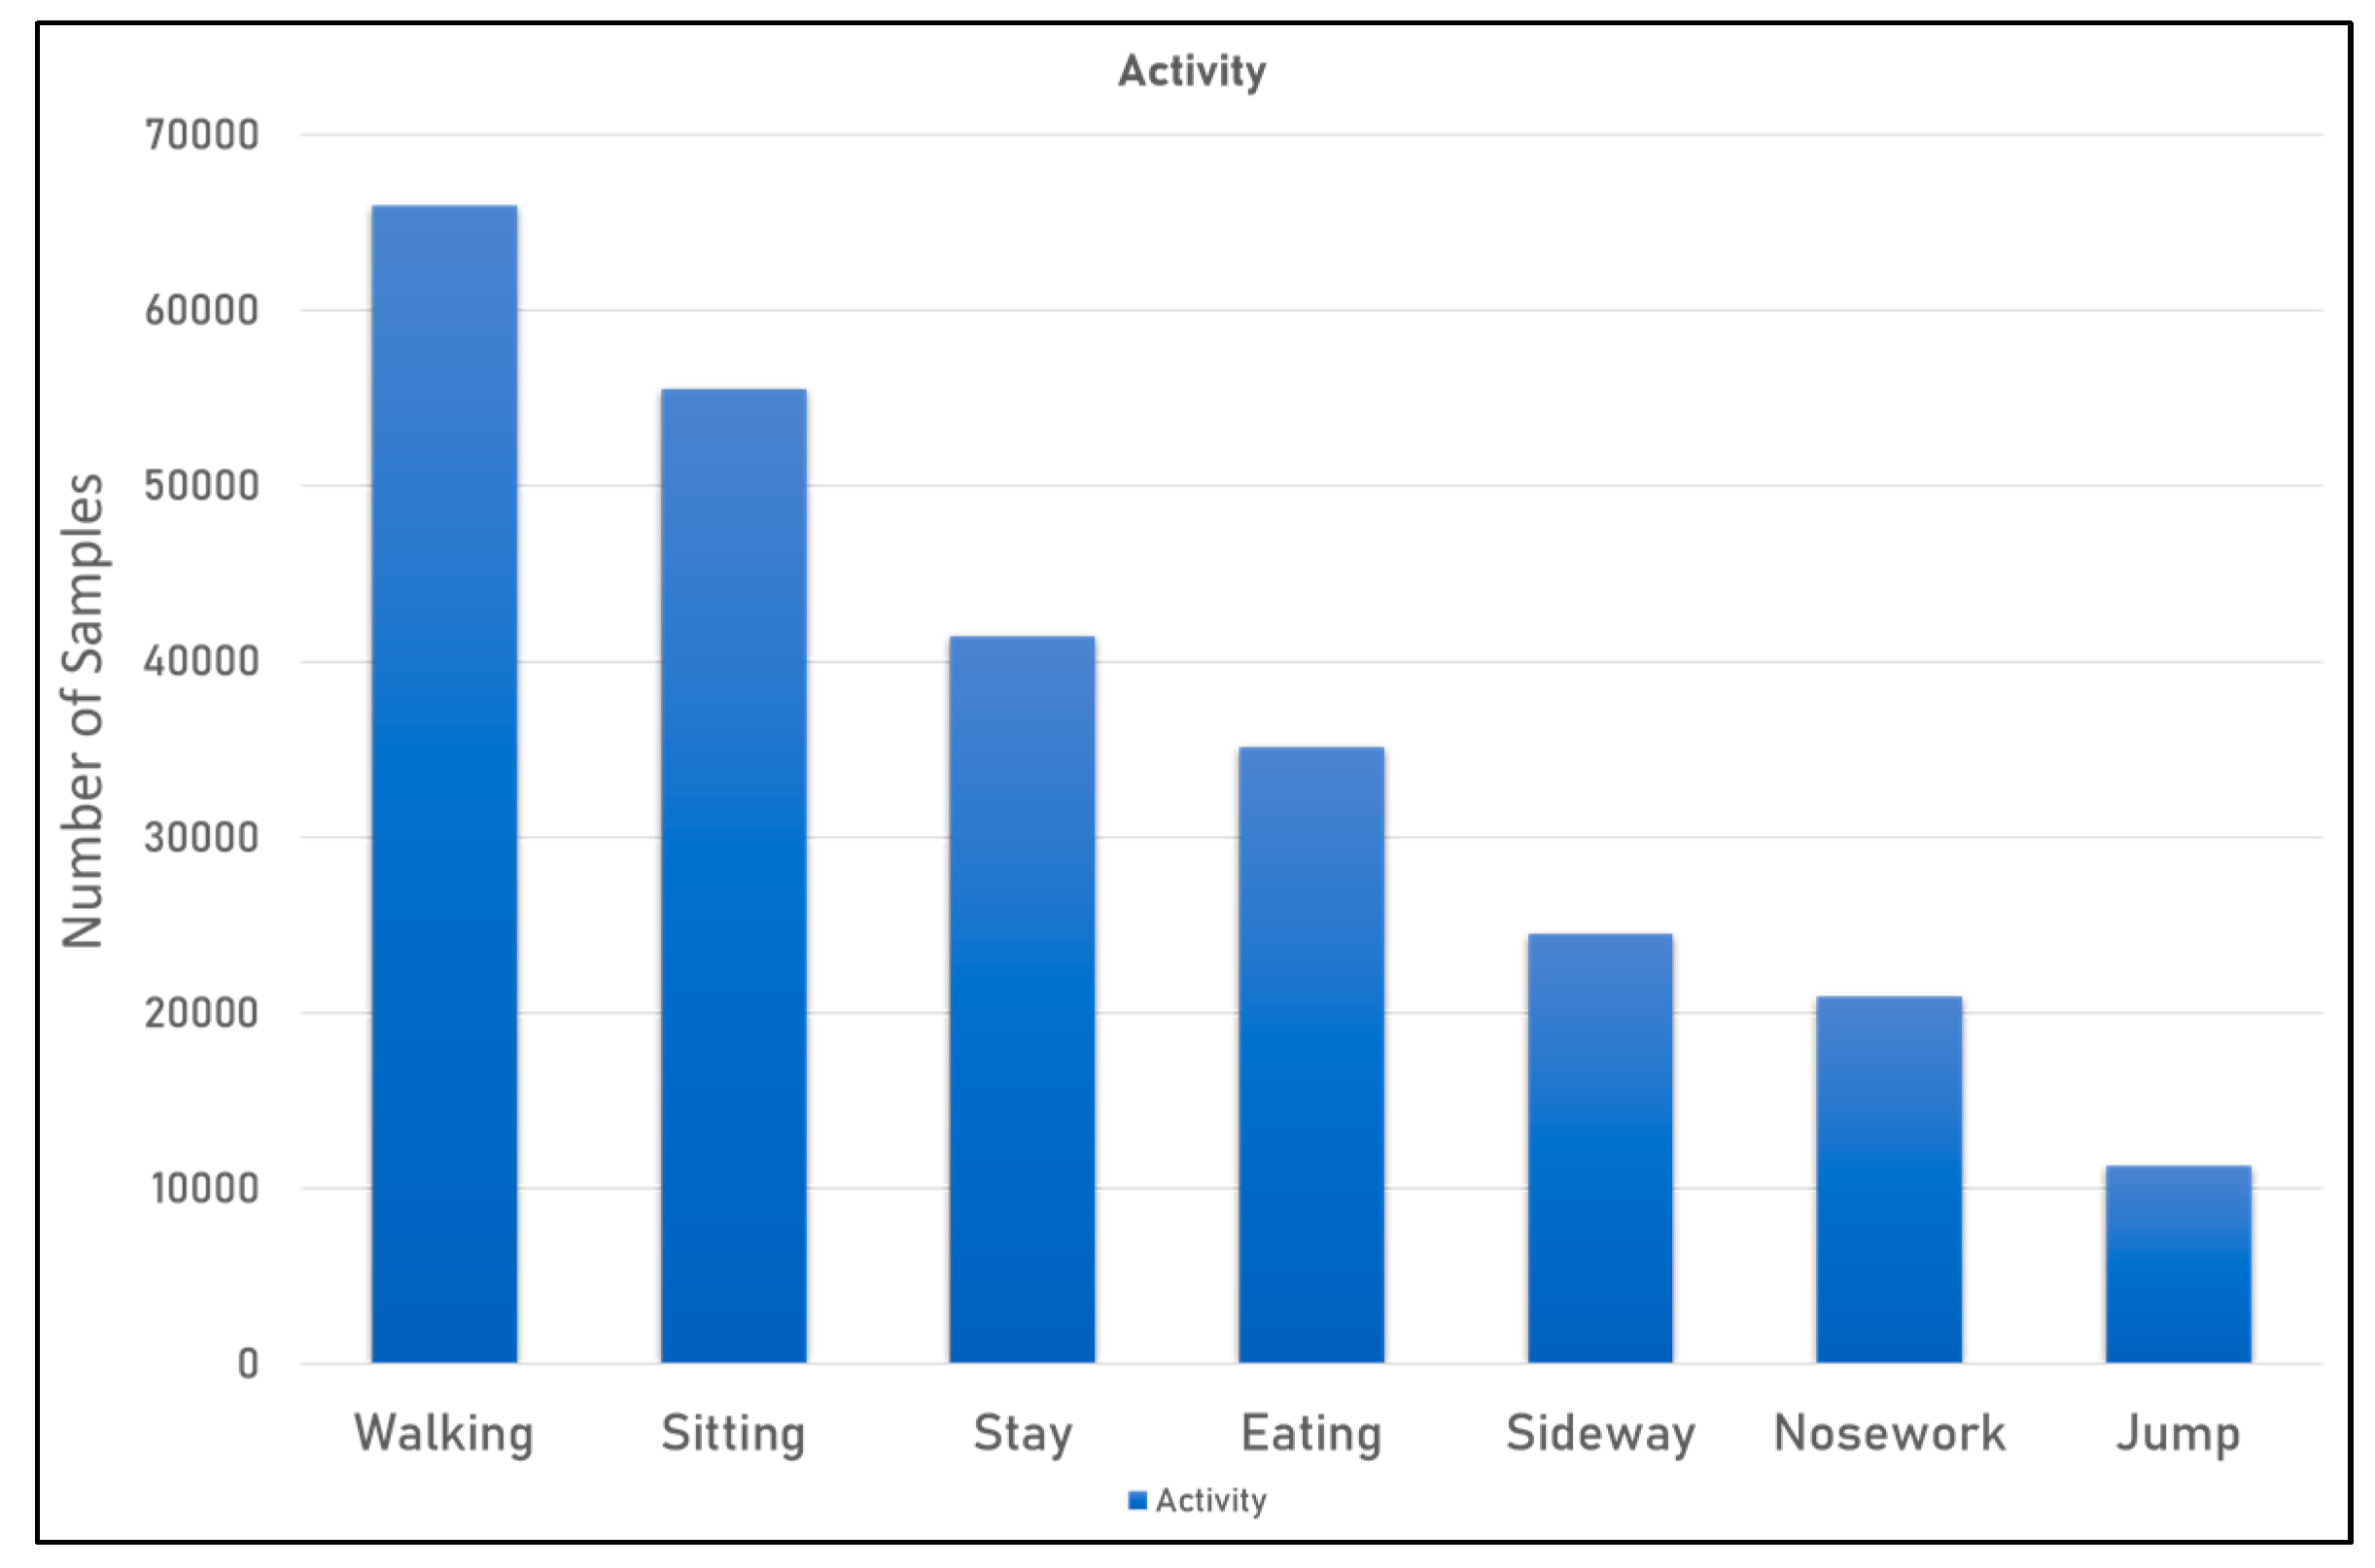
3. Data Collection and Experimental Procedure
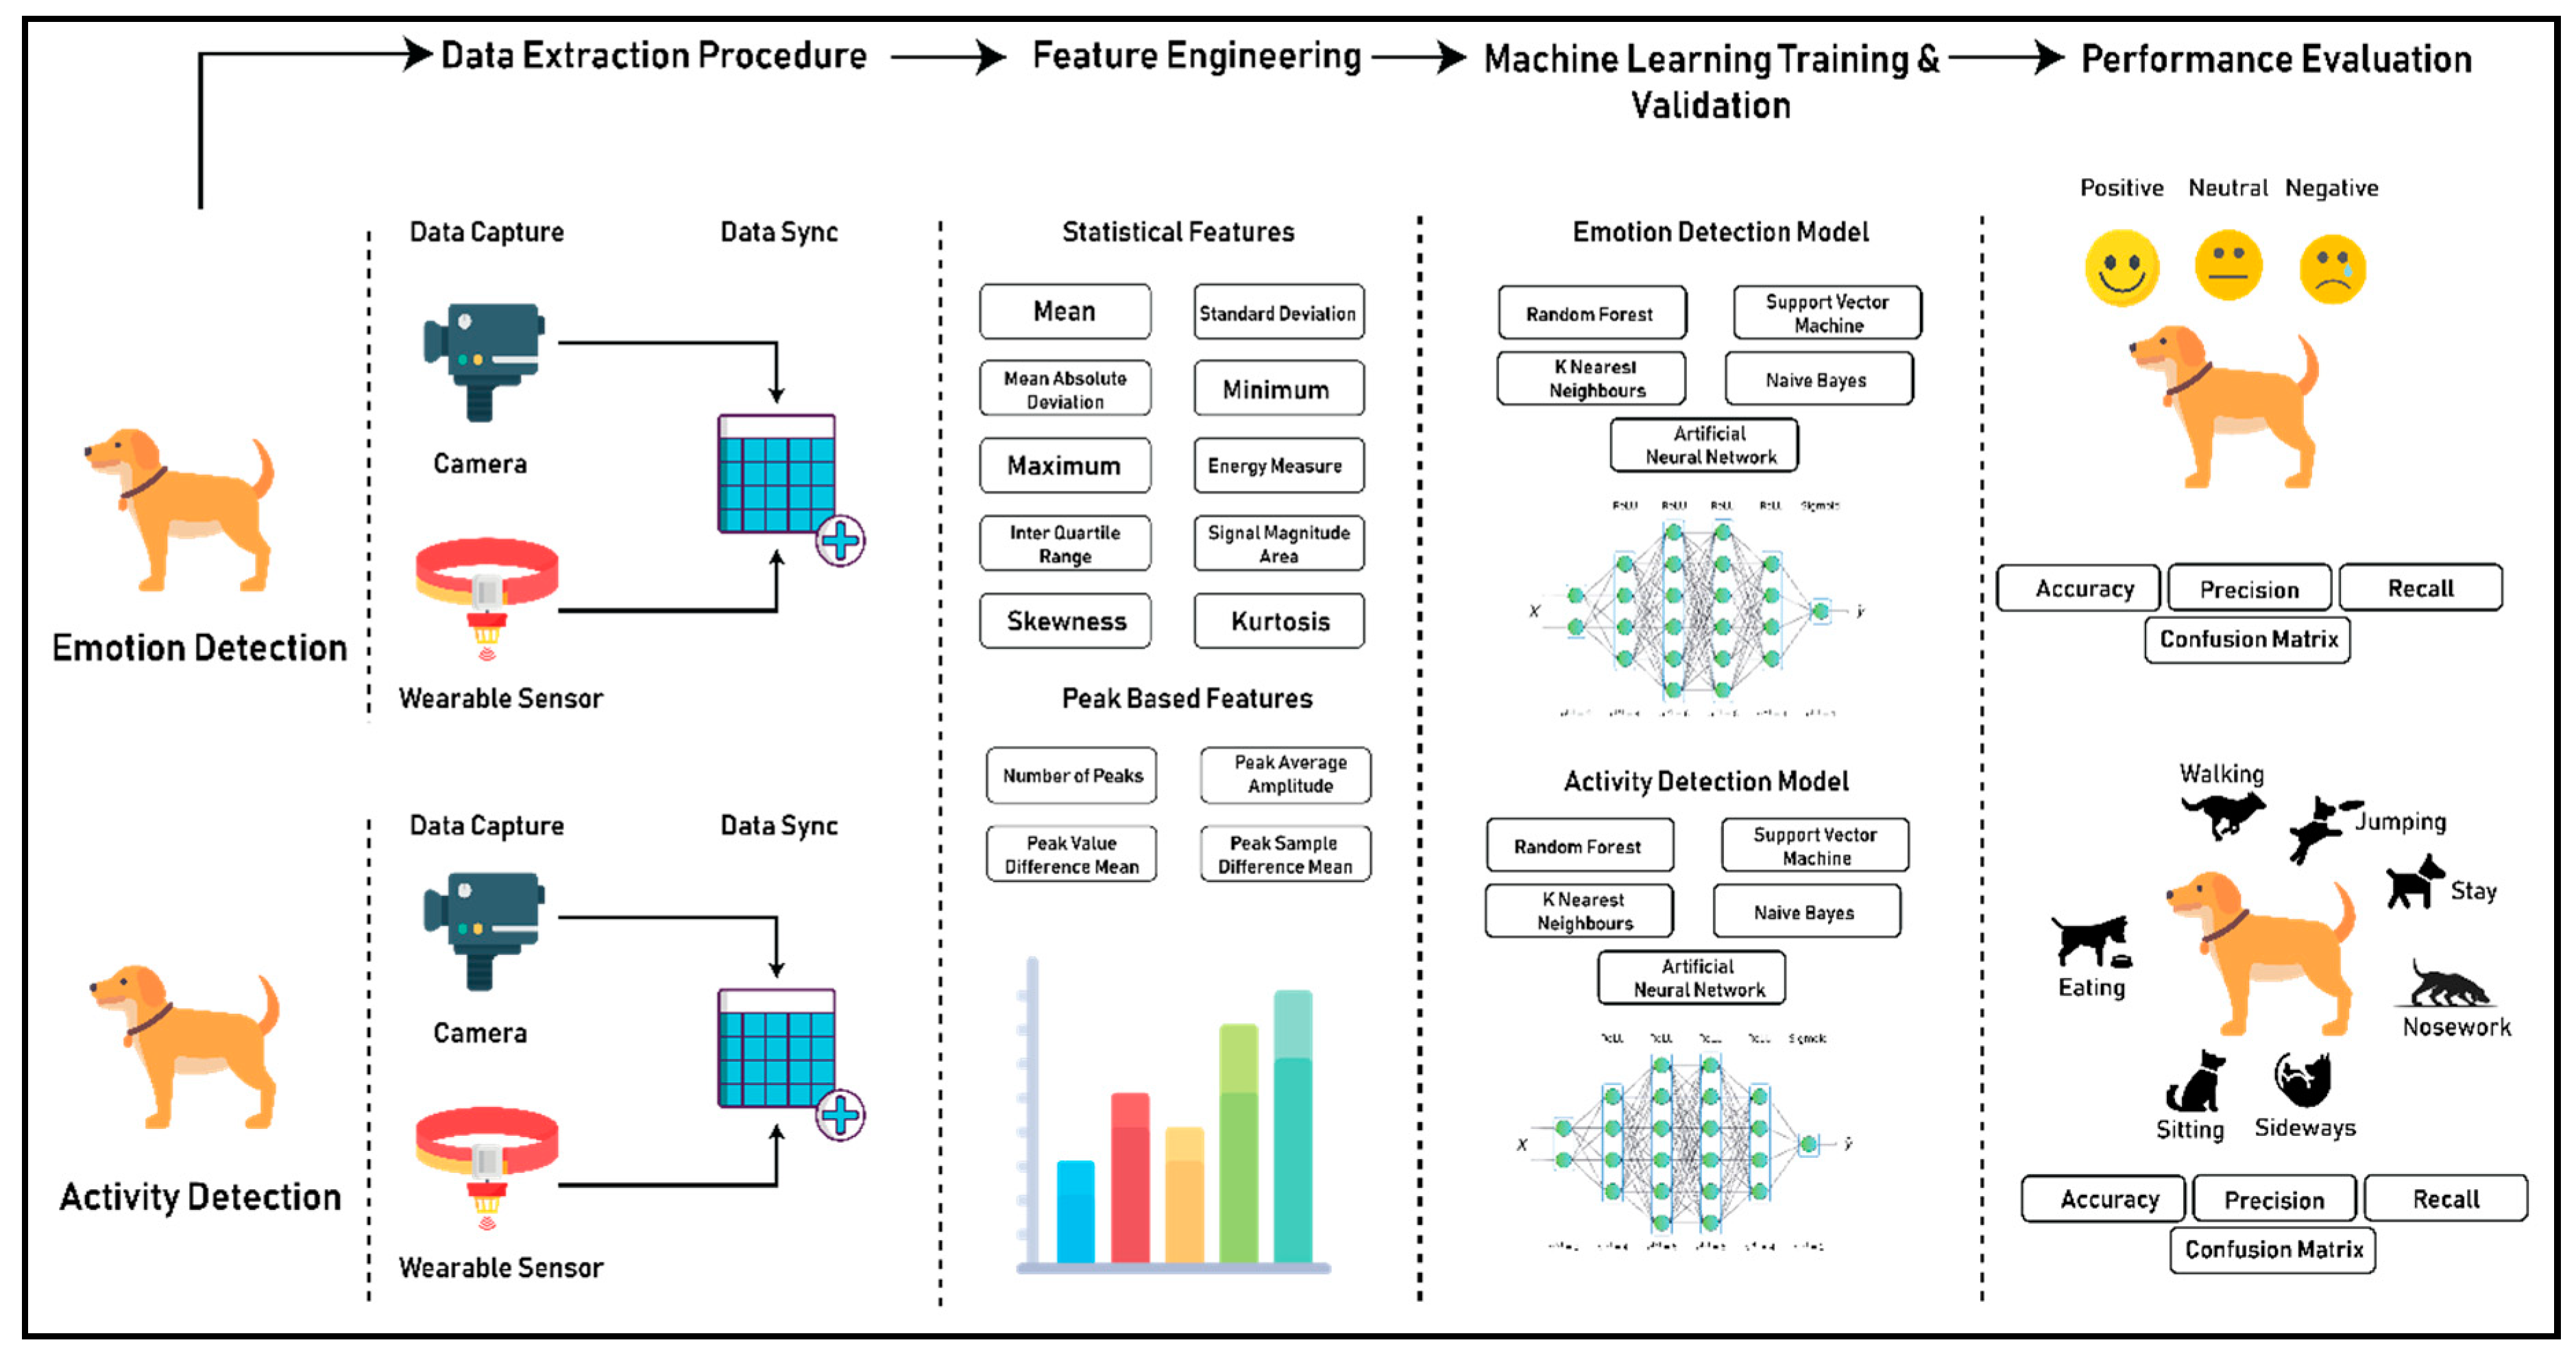
In this study, the data from 10 different dogs were fetched from varied sizes, breeds, and ages. The data regarding the sizes, breeds, genders, and ages of the dogs are depicted in Table 2. Prior approval was taken from the dog owners before collecting the data for our research. For the activity detection, wearable sensors were placed at the neck and tail, as shown in Figure 1a,b. These sensors were fastened to the neck and tail using straps. Wearable sensors with a sampling frequency of 33.33 Hz (Sweet Solution, Busan, South Korea) were used. The wearable sensors were equipped with accelerometer and gyroscope sensors that could measure the linear motions and the rotational motions in all the directions. The neck and tail-wearable devices used in the study were lightweight in nature and are depicted in Figure 1c,d. The dimensions of the neck-worn device used in the study were 52 × 38 × 20.5 mm and it weighed 16 g; and the dimensions of the tail-worn device used in the study were 35 × 24 × 15 mm, and it weighed 13 g. The scale factor of the accelerometer was −4 g to 4 g and gyro was −2000 dps to +2000 dps. Moreover, the data was processed and analyzed using a system with the following specifications: Windows 10, 3.60 GHz 64-Bit Intel Core i7-7700 processor, 24 GB RAM, Python 3.7, and TensorFlow 1.4.0.
The data collection procedure was performed on trained dogs who were accompanied by their personal trainers. The complete data extraction procedure, as shown in Figure 2, was performed by four people who were responsible for activity determination, recording the activity for determining the ground truth using video recorders, monitoring of the environment and IMU data recording, and checking the position of the sensors on the necks and tails of the dogs, respectively. During the data extraction procedure, the required activity whose data needed to be fetched was communicated to the specific dog trainer, who in turn, asked the dog to perform the specific activity. Simultaneously, when the dog was performing the activity, one of the people recorded the IMU data of the dog that was transmitted to the system from the neck and tail-wearable device and another person used a video recorder for recording the activity of the dog. The video was recorded with the exact number of frames per second as the sampling rate of the wearable device. Therefore, the frames of the video were further used to derive the ground truth for a particular set of IMU data.
The data collected for the activity detection were encapsulated for seven different activities; namely, walking, sitting, “stay,” “sideways,” eating, jumping and nose work. The distribution of data that was received from the data collection procedure has been depicted in Figure 3. From the figure, it can be duly observed that the distribution of data across all the classes is highly imbalanced in nature. Therefore, all the classification algorithms that need to be implemented in the work must have a weight matrix associated, for which the minority class needs to have more weight than the majority class to achieve a fixed classification rate. Moreover, Figure 4a,b presents some exploratory data analysis on the resultants of accelerometer and gyroscope data for seven different activities.
Similarly, for emotion detection, the data was encapsulated for three different emotions by leveraging the tail movements of the dogs. The three different emotions that were considered in the study where positive emotion, neutral emotion, and negative emotion. Figure 5 below plots the data distribution of the emotion data across the above-mentioned three emotion classes.
Figure 6, plotted below, shows the resultant accelerometer and gyroscope signals from the tail-wearable for all different emotions.

4. Methodology

Figure 7 shows the complete process of the development of the activity and emotion detection systems for household pets. The complete process was divided into four different sections; namely, the data extraction procedure, feature engineering, machine learning model training and validation, and a performance evaluation. In the data extraction procedure, the IMU data of the dog was captured using wearable sensors, and simultaneously, the video of the dog performing a specific action was recorded for generating the ground truths. The frame rate of the recording device was equalized with the sampling rate of the wearable device. Further, both the data from the wearable device and video recorder were synced with each other based on timestamps to create the primary data where supervised learning could be duly imposed. The next step in the process was feature engineering, which was common for both the activity detection and emotion detection systems. In the feature engineering step, two different types of features were developed; namely, statistical features and peak-based features. Further, in the third segment, multiple machine learning models were developed for both the activity detection and emotion detection, separately; and finally, in the last segment, the performances of all the machine learning algorithms were compared and the best models which aligned with our hypothesis and the requirements were chosen.

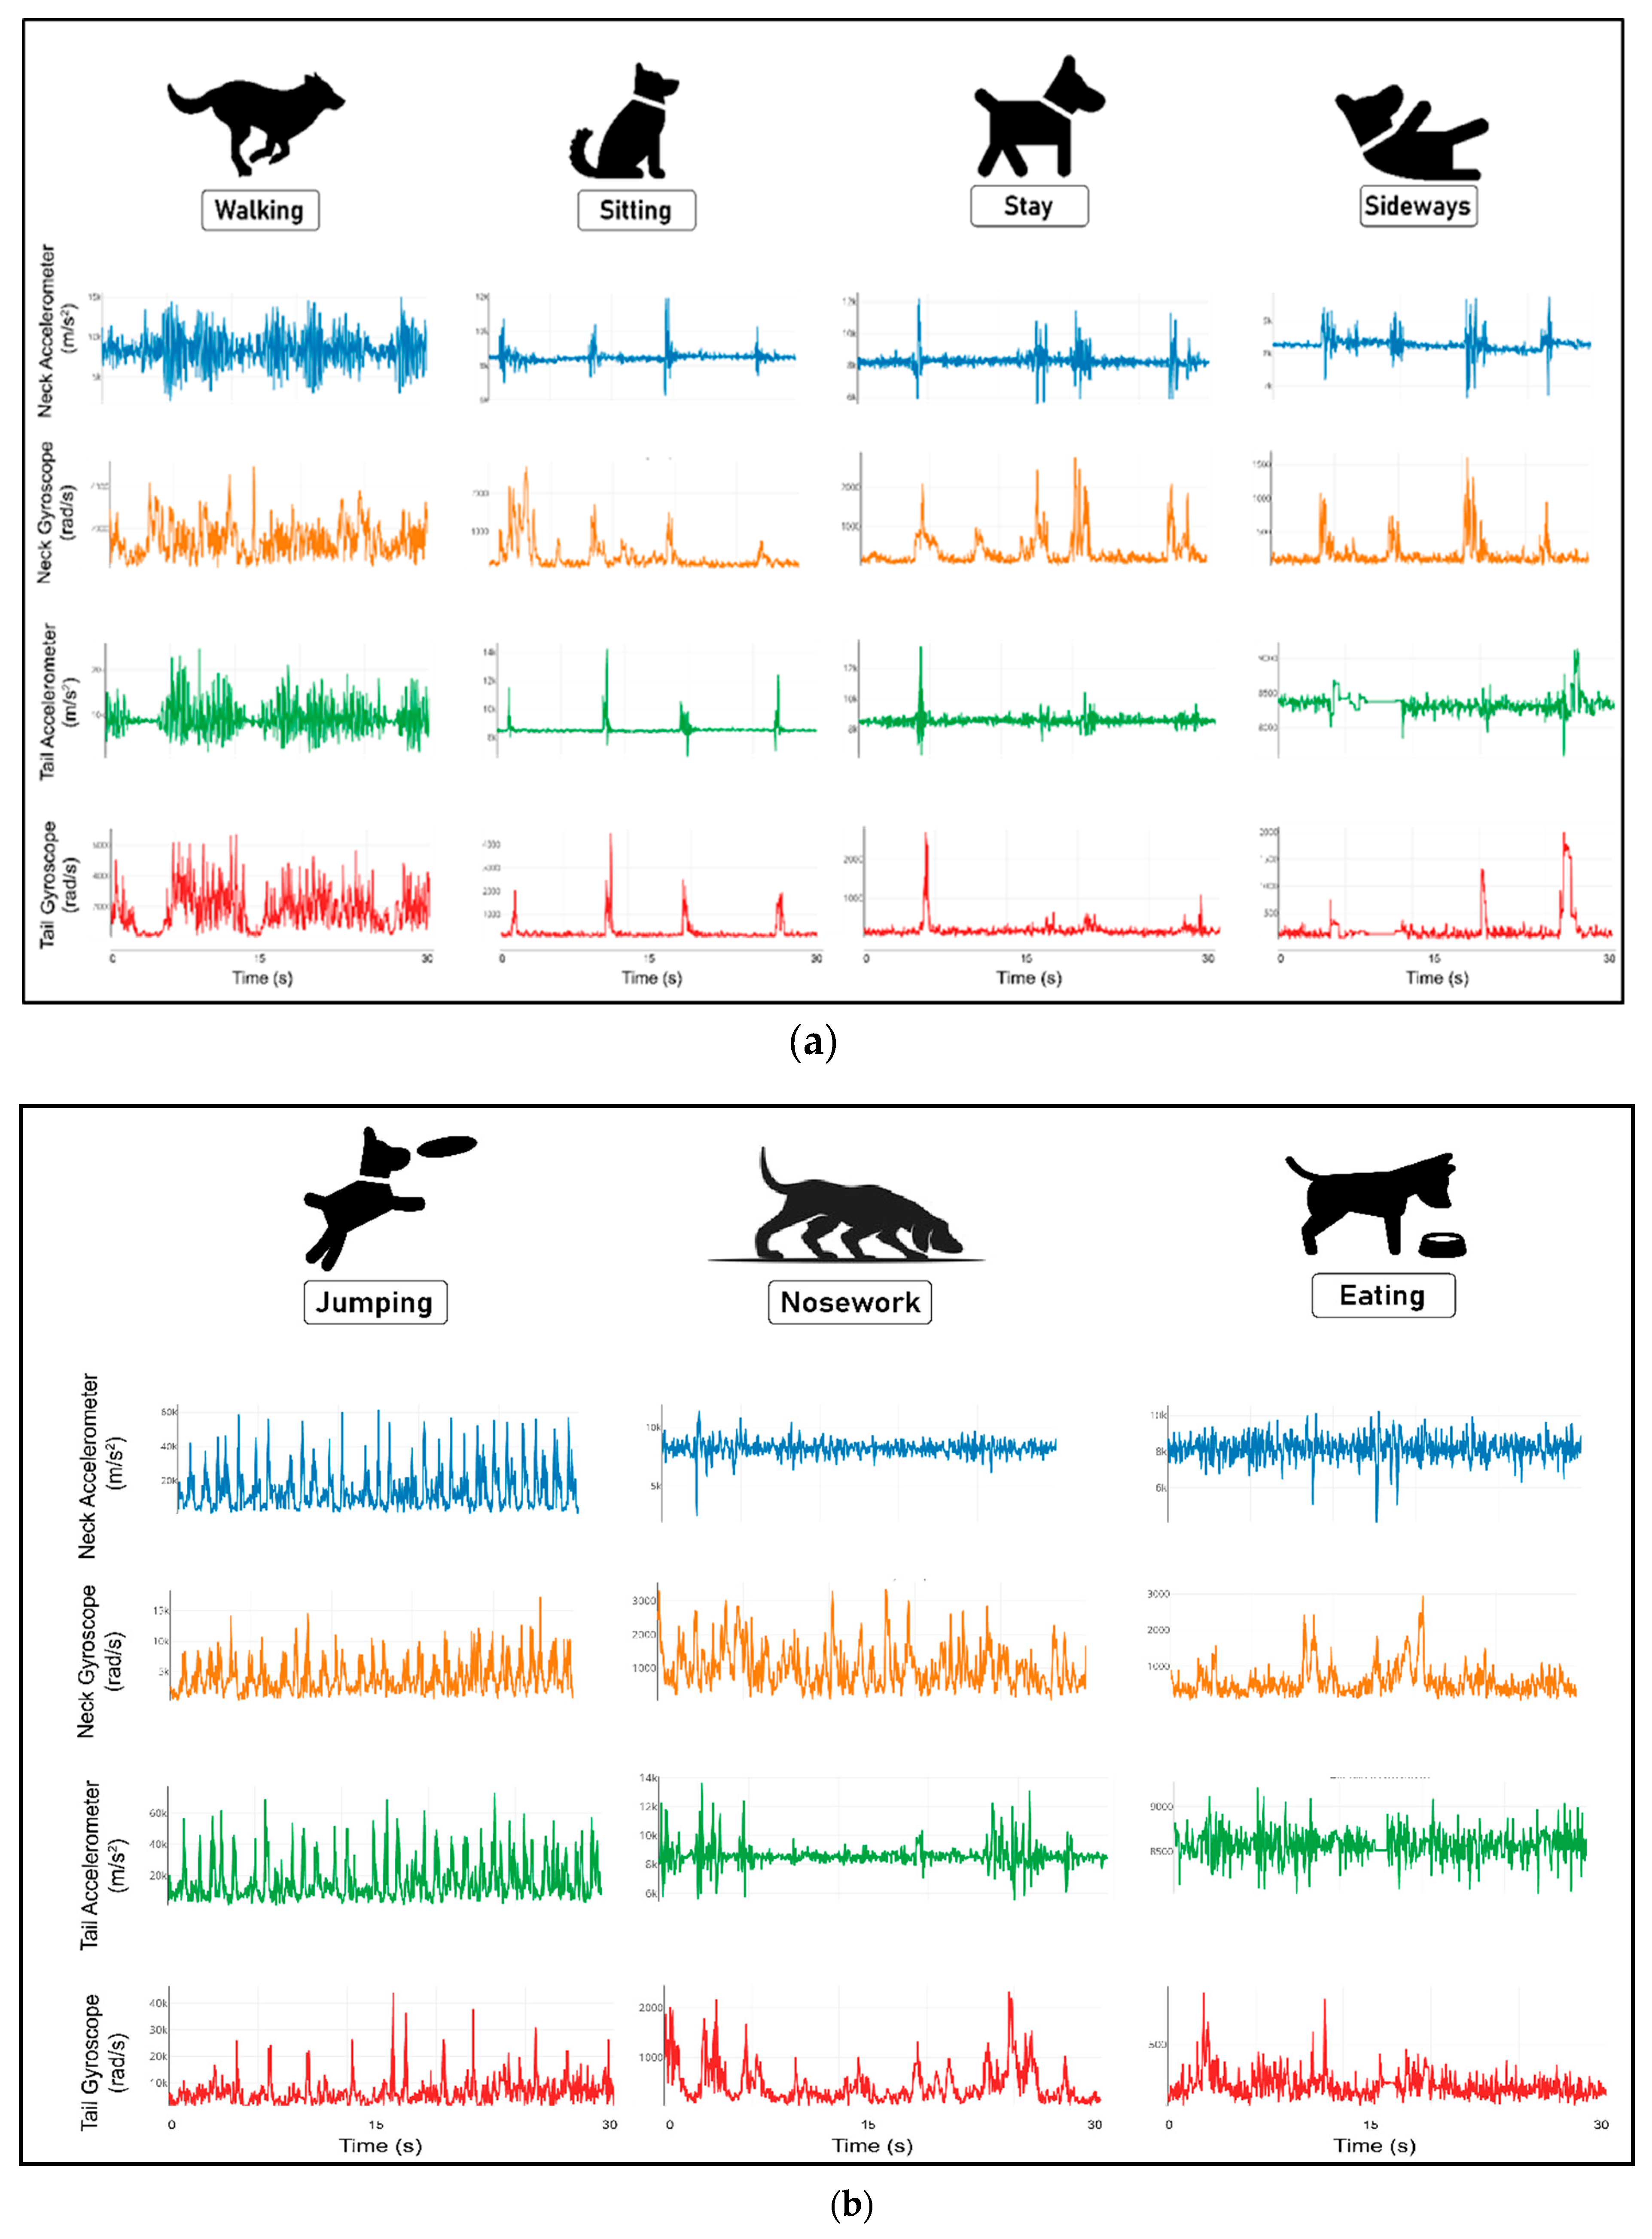
4.1. Activity Detection

The data that was fetched from the 10 dogs were typically from 7 different activities; namely, walking, sitting, “stay,” eating, “sideway,” jumping, and nose work. The data extraction process leveraged a video camera for determining frames of the recorded video for identifying the “activity” ground truths. Moreover, with regard to the sensors, two wearable devices were fastened on the dogs, one on the neck and one on the tail, respectively. Both the sensors sampled accelerometric and gyroscopic data. The data that was fetched was definitely huge in size, as the sensors that were used for the data extraction sampled data at the frequency of 33.3 Hz. The total size of the data that was fetched had 254,826 samples from all the 7 activities.
The data that was received consisted of a huge amount of noise, as the signals were generated from the pets; some instances of disturbances during data collection were unavoidable. Therefore, to reduce the amount of noise, a “lowpass Butterworth filter” was used. The Butterworth filter of the 6th order was used with the cutoff frequency of 3.667 Hz. The order of the filter was chosen on the basis of blocking the maximum noise and the cutoff frequency was decided on the basis of exploratory data analysis.
Post filtering and noise removal of the data, a routine of feature engineering, was performed to fetch important features from the data. For feature engineering, 10 features for each axis of the accelerometer and gyroscope of both the wearable devices from neck and tail were derived using statistical methods and also domain knowledge. The features derived were, mean, standard deviation, mean absolute deviation, minimum, maximum, energy measure, inter quartile range, skewness and kurtosis. All the features were calculated on the basis of a rolling window for 33 samples with a step distance of 16 samples, which means every window must have different values in terms of the features which determine the optimum variances in the features. The number of features that were generated post feature engineering was 124 for all the axes for both the neck and tail-worn sensors. By using these features, we also trained our model with various machine algorithms, such as random forest, SVM, KNN, Naive Bayes, and ANN. Finally, a performance comparison of different machine learning algorithms was performed.

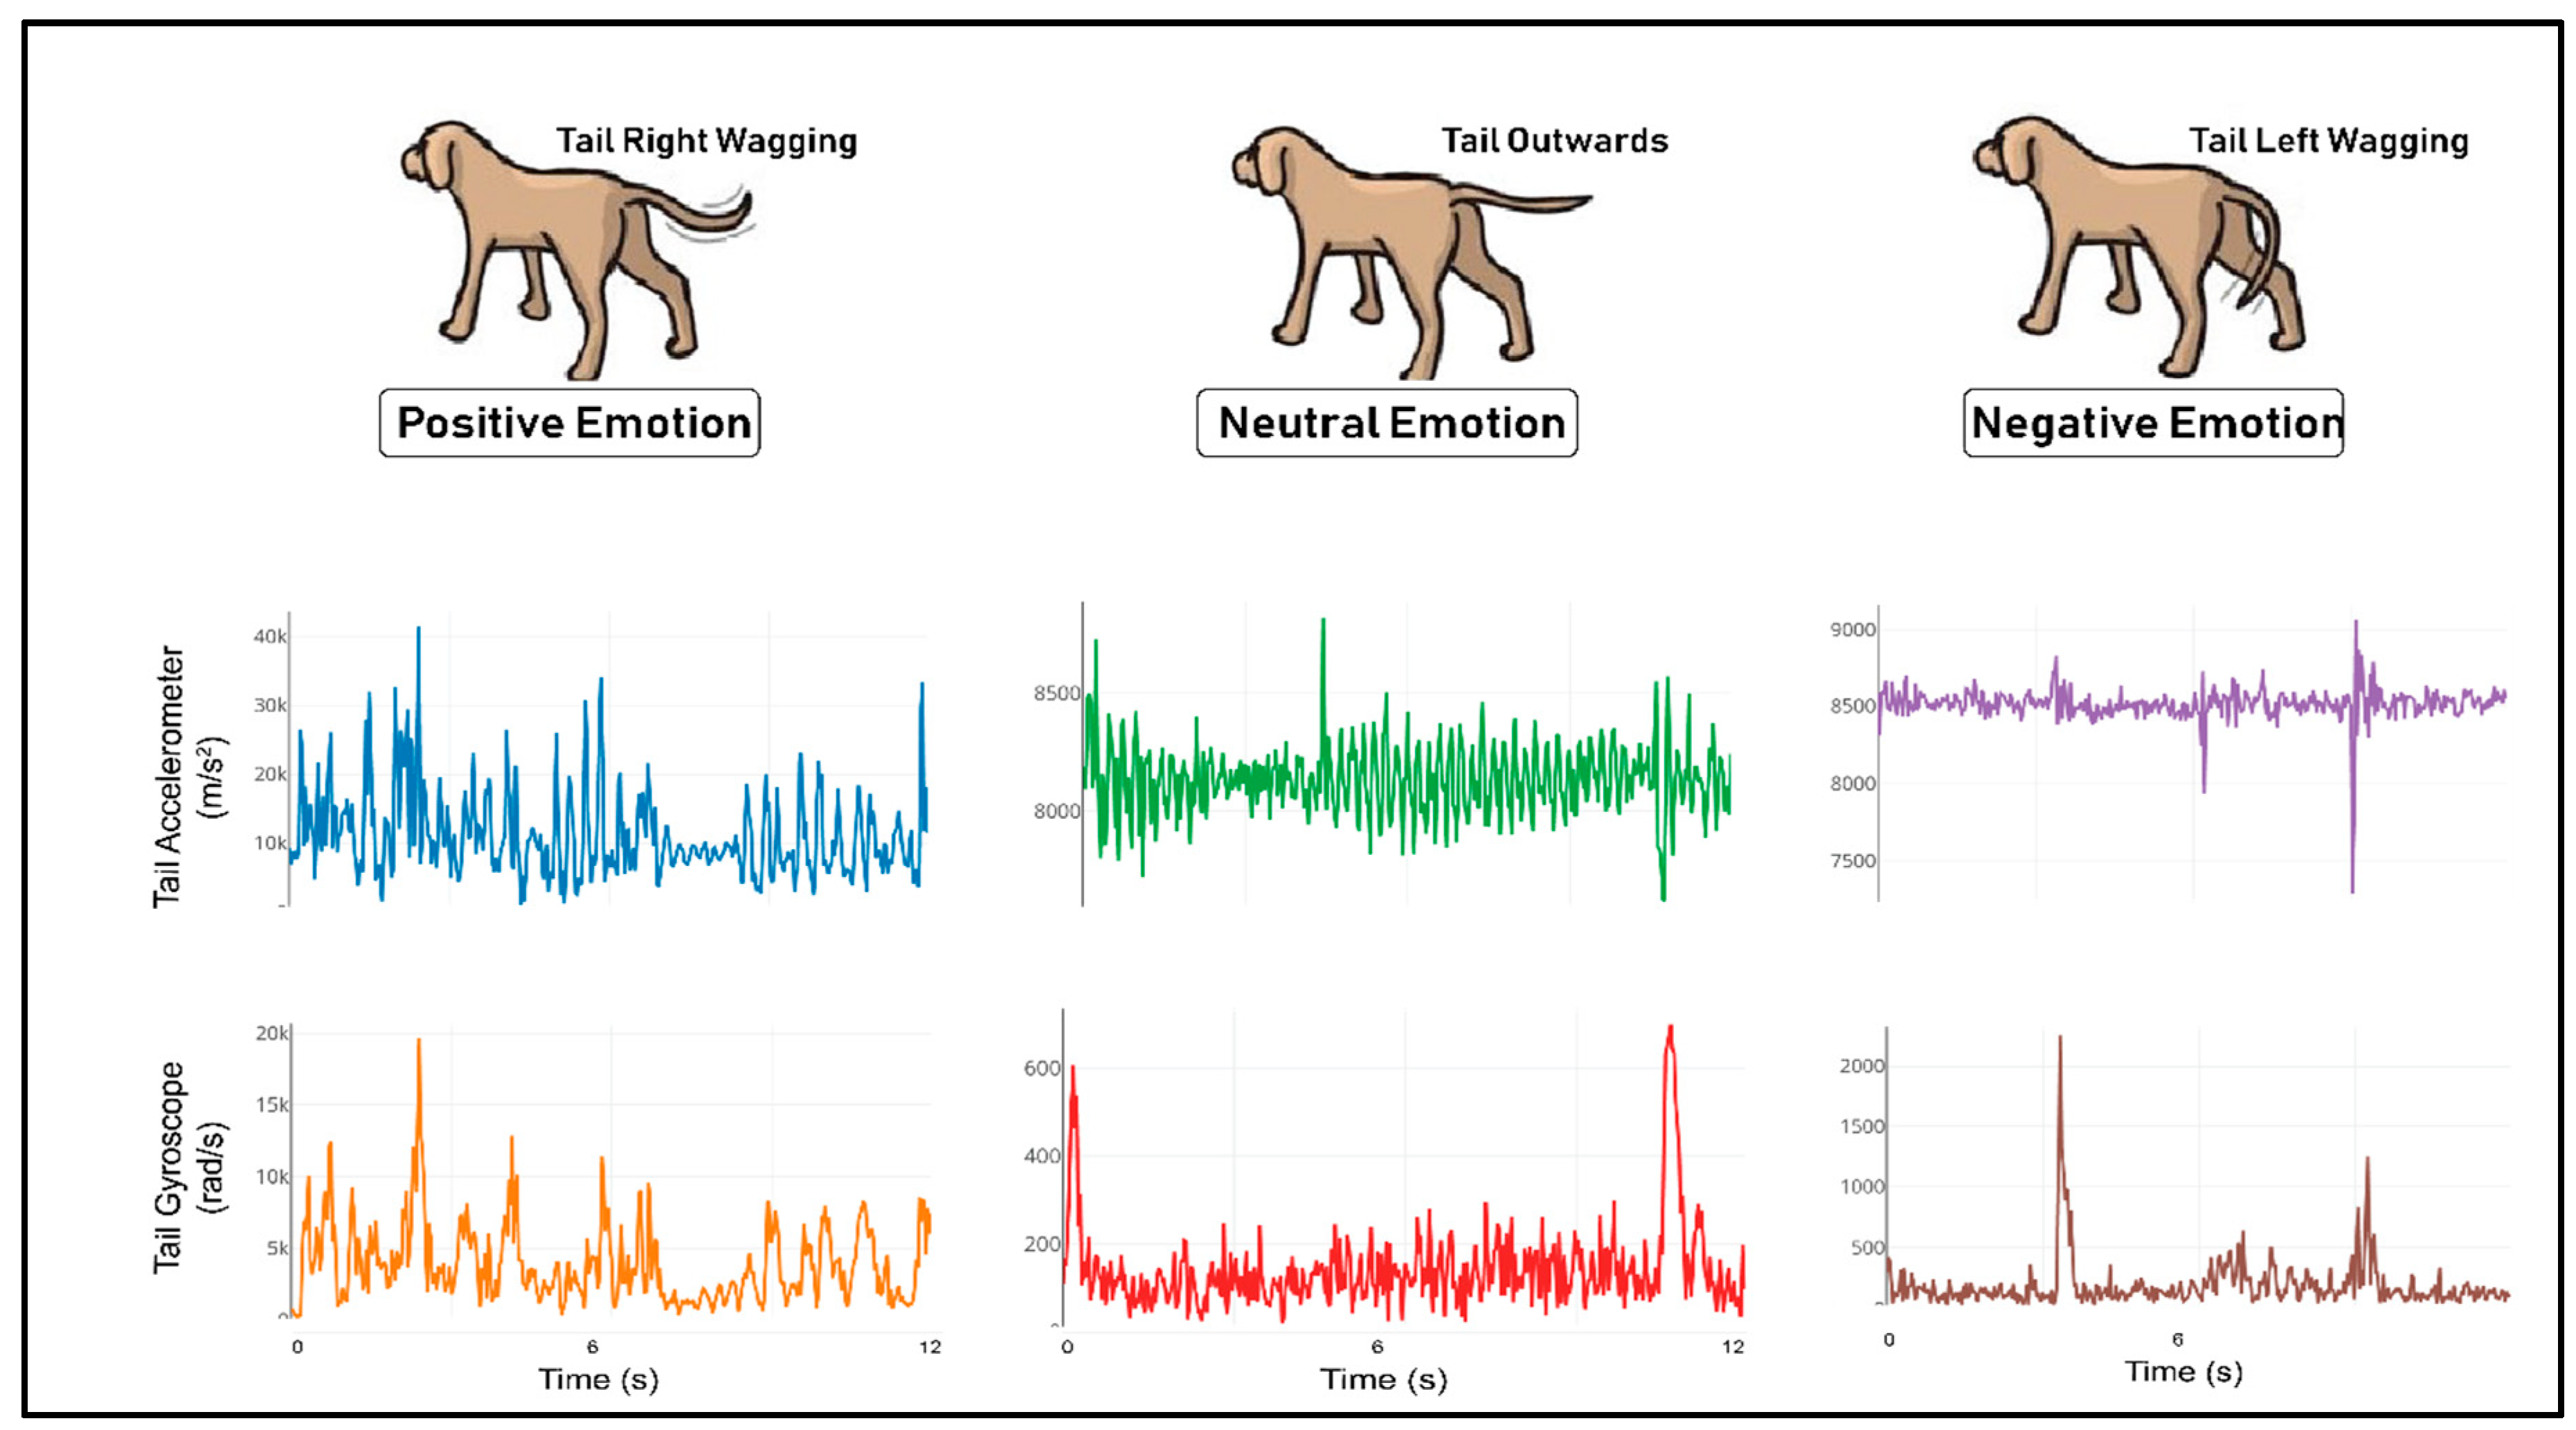
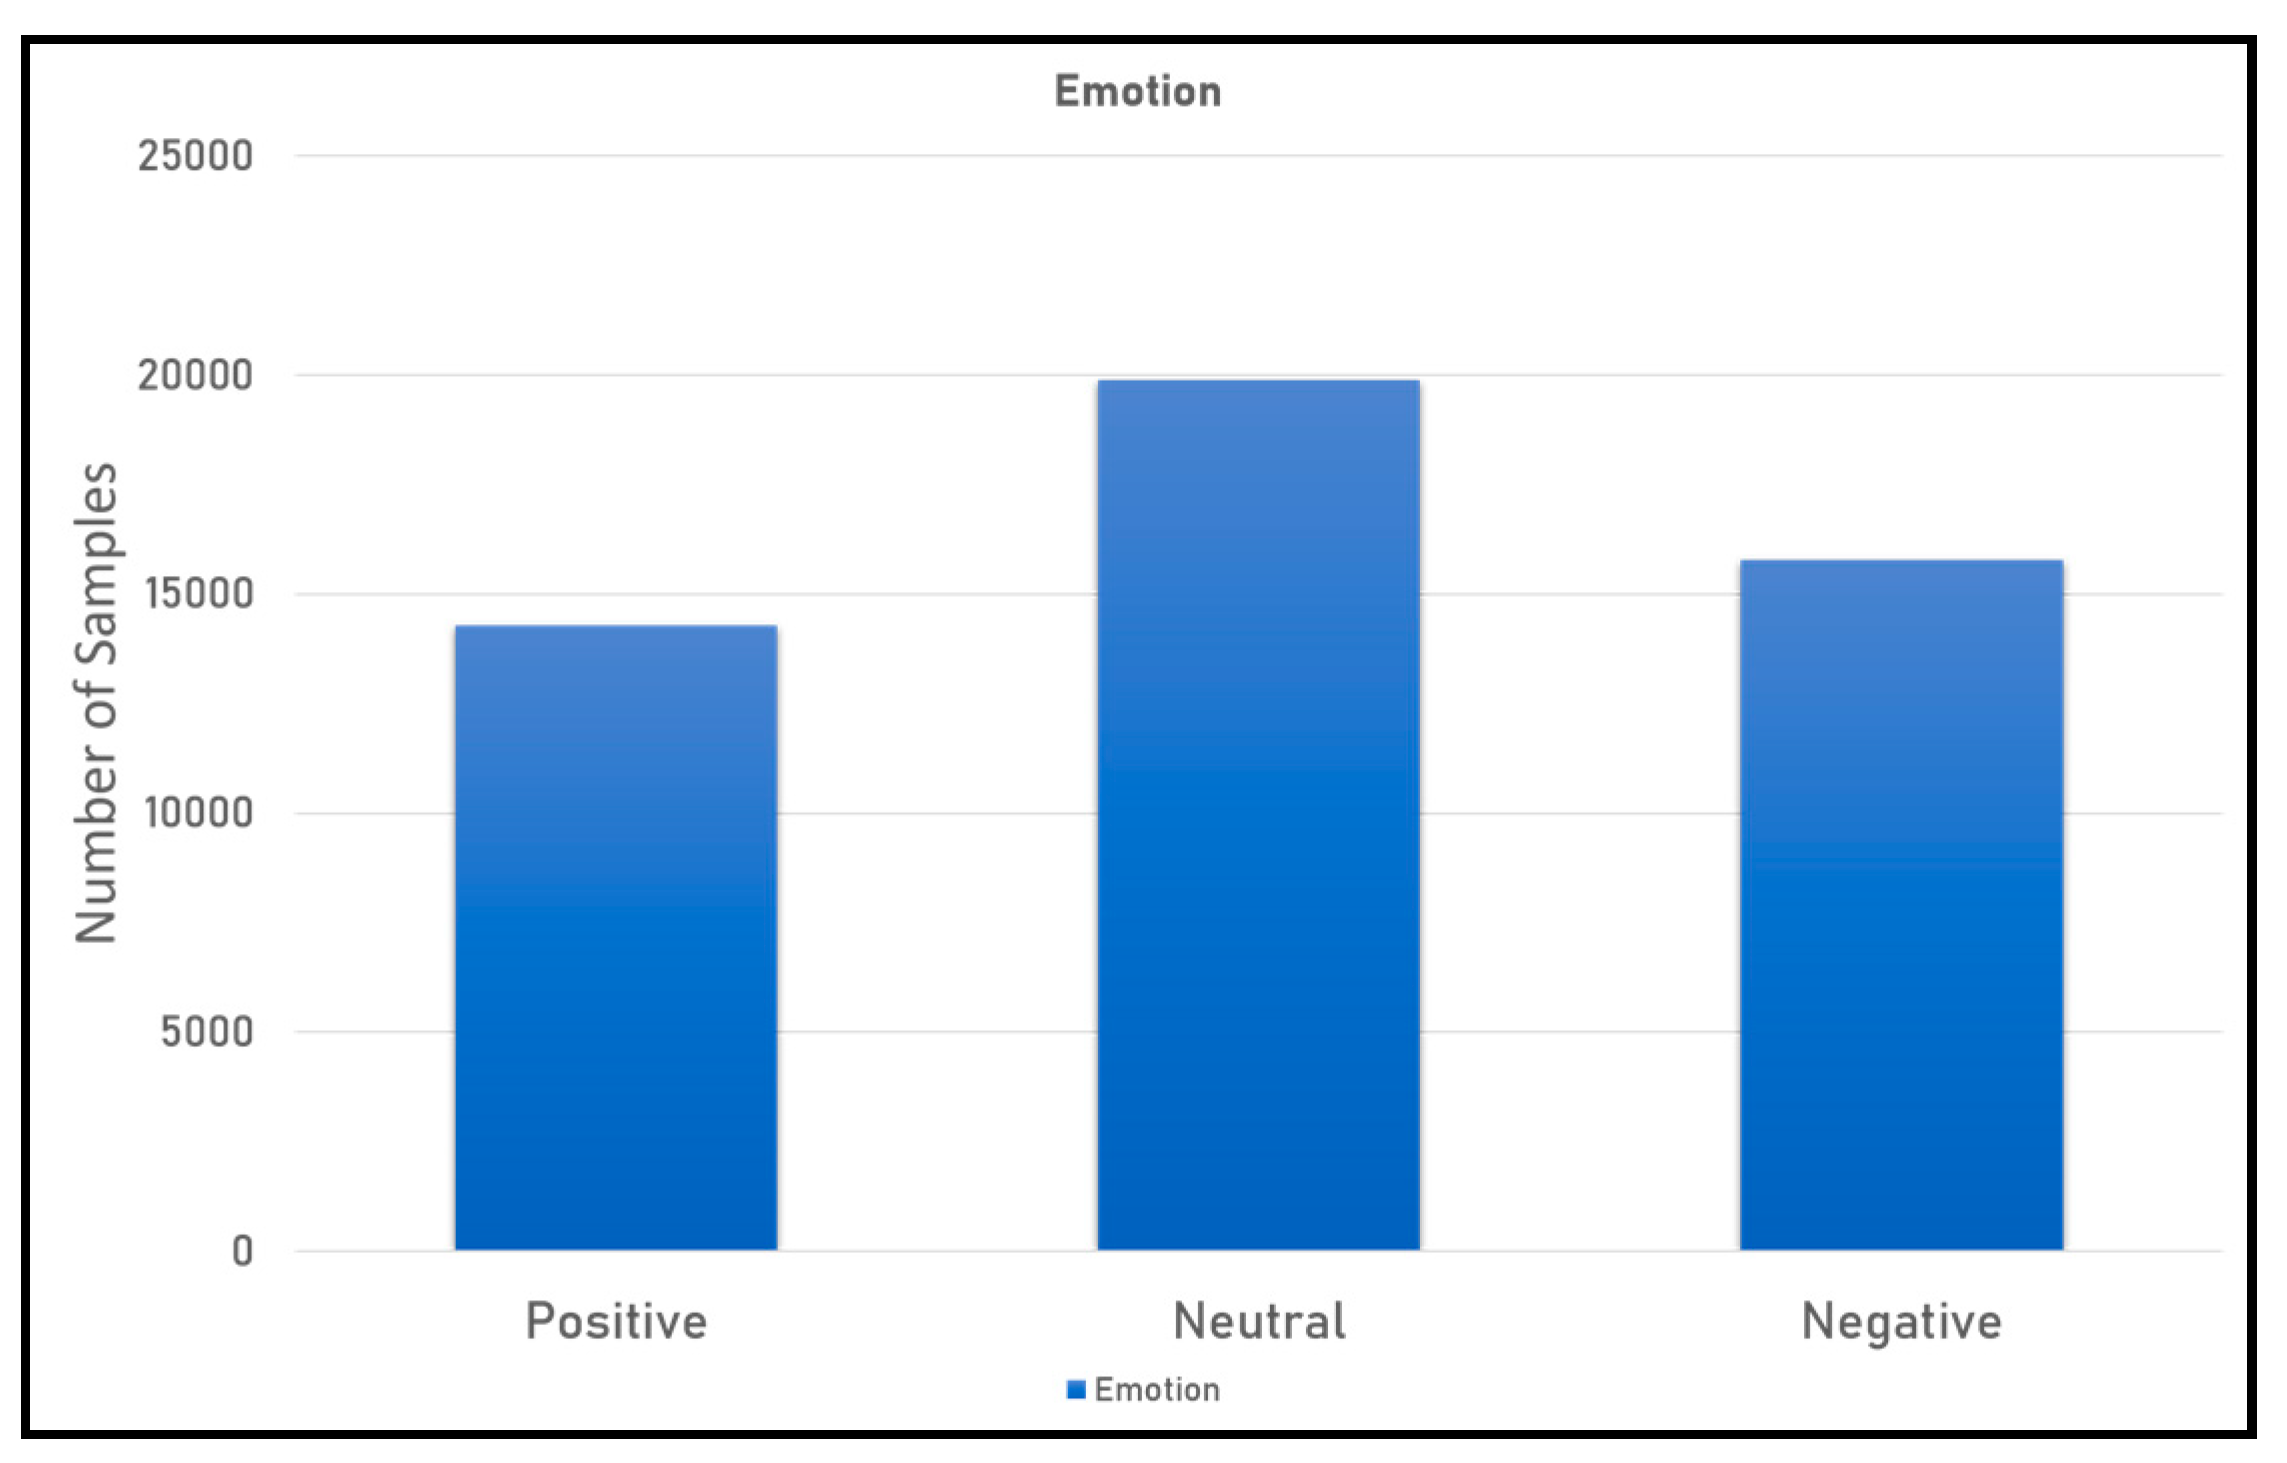
4.2. Emotion Detection

For emotion detection, the data from 10 different dogs of varied sizes, breeds, and ages were fetched. The data that were fetched from the dogs were typically from three different movements; namely, right, left and straight waging, which determine positive, negative and neutral emotions, respectively. The data extraction process leveraged a camera for determining frames of the recorded video for identifying the “emotion” ground truth of the dogs. Moreover, with regard to the sensors, one wearable device was attached to the dog, and that was on the tail. The wearable sensor that was used for the process sampled accelerometric and gyroscopic data. The dataset was quite enormous in size because the sensors sampled the data at a frequency of 33.3 Hz. The total dataset that was fetched had 49,926 samples from all 3 emotions.
The data that was received consisted of a huge amount of noise, as the signals were generated from the pets; therefore, some instances of disturbance in the data were unavoidable. Therefore, to reduce the amount of noise, a ‘‘lowpass Butterworth’’ filter was used. The Butterworth filter of the 6th order was used with the cutoff frequency of 3.667 Hz. The order of the filter was chosen on the basis of blocking the maximum noise and the cutoff frequency was decided on the basis of exploratory data analysis.
Post filtering and noise removal of the data, a routine of feature engineering, was performed to fetch out important features from the data. For feature engineering, 10 features for each axis of the accelerometer and gyroscope of the tail-wearable device were derived using statistical methods and also domain knowledge. The features derived were, mean, standard deviation, mean absolute deviation, minimum, maximum, energy measure, inter quartile range, skewness and kurtosis. All the features were calculated on the basis of a rolling window for 66 samples with a step distance of 32 samples, which means every window must have different values in terms of the features which determine the optimum variance in the features. The number of features that were generated post feature engineering was 72 for all the axis for the tail-wearable device. By using these features, we also trained our model with various machine algorithms, such as random forest, SVM, KNN, Naïve Bayes, and ANN. Finally, a performance comparison of the different machine learning algorithms was performed.

4.3. Feature Engineering

The set of features that were developed for both the activity detection and emotion detection were purely statistical in nature and the set of features that were developed for both the routines, namely, activity detection and emotion detection, were the same. The features were calculated based on a certain number of samples that differed for both the routines.
For the activity detection routine the complete dataset for a particular subject was folded by having 33 (data worth 1 s) samples in each fold and maintaining a step distance of 16 samples. This means the 16 samples at the end of each fold were further used as the samples in the subsequent fold, sequentially. The usage of this particular method was further supported by having optimum variance in the features. For emotion detection, a similar approach was followed, but the size of the fold was increased to have 66 samples (data worth 2 s) and the step distance was increased to 32 samples.
The features for the activity detection were calculated using the raw accelerometric and gyroscopic data of the neck and the raw accelerometric and gyroscopic data of the tail, whereas for the emotion detection, the features were calculated based on the raw accelerometric and gyroscopic data from the tail-wearable device only. The set of features that were calculated were basically of two types; namely, pure statistical features and peak-based features. The calculation procedure was implemented in such a way that the features were calculated for all the samples of a subject for a particular data fold of 33 samples to maintain optimum variances between the feature’s values.
Table 3 depicts all the statistical features that were used for the detection of activity and emotion. The use of statistical features in the study provided us with the ability to identify some discriminant features even if they lacked obvious interpretability but were still important ones for determining intrinsic patters for the decision making [33,34]. Table 4, on the other hand, plots some peak-based features which have been generated for all the axis of the triaxial accelerometer and triaxial gyroscope for both neck and tail devices. The activities for which data was fetched tended to show a wide range of physical movements; therefore, features based on the peakedness of the signal were hoped to provide us with subtle differences in the movement patterns [23,24].

4.4. Machine Learning Algorithm and Evaluation Metrics

The development of machine learning algorithms for the detection of activity and emotion is very important. Rawassizadeh et al. [35] leveraged machine algorithms to fetch semantic information from data. Moreover, Rehman et al. [36] plotted the usefulness of machine learning methods for extracting abstract patterns from mobile phones and wearable devices. Therefore, for this work, multiple machine learning algorithms were developed and a comparative analysis was performed to determine the best possible algorithm based on the evaluation metrics. As in previous studies performed by Banaee et al. [37], it was found that SVM, ANN, and tree-based classifiers could be leveraged for healthcare-based uses. Additionally, Casto et al. [38], showed that SVM, naïve Bayes, and ANN are potentially much more reliable when it comes to human activity detection. Therefore, for the learning process in this particular study, 5 different machine learning algorithms, namely, random forest, SVM, KNN, naïve Bayes, and ANN, were developed. Yang et al. [39] used an SVM-based diagnosis model for fault detection using sensors that were connected to the equipment, and they achieved an accuracy of 98.7%. Aich et al. [40] used SVM, KNN, decision tree, and naïve Bayes classifiers to distinguish the freezing of gait patients from not freezing, and they attained accuracy of 88% with SVM. The initial hypothesis for the activity detection stated that the recall of all the 7 classes must be over 85% and all the classes must maintain a fixed classification rate. On the other hand, the hypothesis for emotion detection was devised in a way where it was stated that the recall of each class must be more than 85% and the correct number of samples in the positive class and negative class must be more than the neutral class. Table 5 and Table 6 below show the specifications and the hyperparameters of all the machine learning algorithms that were used for the classification tasks of activity detection and emotion detection respectively.
Moreover, in Figure 4, it can be duly observed that the numbers of samples in the 7 different classes of activity are highly imbalanced. The presence of imbalanced data deeply affects the performance of machine learning and deep learning models [41,42,43,44]. In the present day, there are multiple techniques that have been found for dealing with imbalanced datasets, such as oversampling, undersampling, synthetic minority oversampling technique (SMOTE) [45], etc. But in the present study, the usage of such sampling techniques was not leveraged to increase the cardinality of the datasets; rather, a class weight-based approach was undertaken. The class weights were basically used to create a weighting mechanism for the calculation of a loss function, which means the minority samples that had a smaller number of samples were focused on more during the training process. For determining the class weights of the classes, a specific technique was used which is given as follows:
w e i g h t _ o f _ p a r t i c u l a r _ c l a s s =   l o g ( t u n i n g _ p a r a m e t e r   n u m b e r _ o f _ t o t a l _ s a m p l e s ( n u m b e r _ o f _ p a r t i c u l a r   c l a s s ) ) ,
where tuning_parameter is a constant value that needs to be iteratively tuned.
For this paper, the chosen class weights are defined in Table 7.
The evaluation of the machine learning algorithms was done by considering accuracy, average recall, average precision, and average f1 score as the evaluation metrics. Accuracy in the particular task was used to understand the overall accuracy across all the 7 classes for activity detection and the 3 classes of emotion detection. In the current scope of the work, the recall was being calculated for each class where it provided the information regarding the number of data samples that the model correctly identified for a particular class. Therefore, in the study, average recall was calculated, which determined the average percentage of correct predictions in each class of both activity detection and emotion detection respectively. Additionally, the precision of the predictions has been derived, which determines the confidence of a particular prediction to belong to a particular class. Further, for evaluation purposes, average precision was derived, which allowed us to identify the average of all the precision scores for each class. Finally, an f1-score was derived, which provides a weighted average between both the precision and recall of each class, and therefore, penalizes the score for all the wrongly-predicted samples of a particular class. Furthermore, during the learning procedure, the complete data of 10 subjects were divided into the ratio of 70:30, where the data of 7 subjects were used for the training and the data of 3 subjects for the validation/testing.

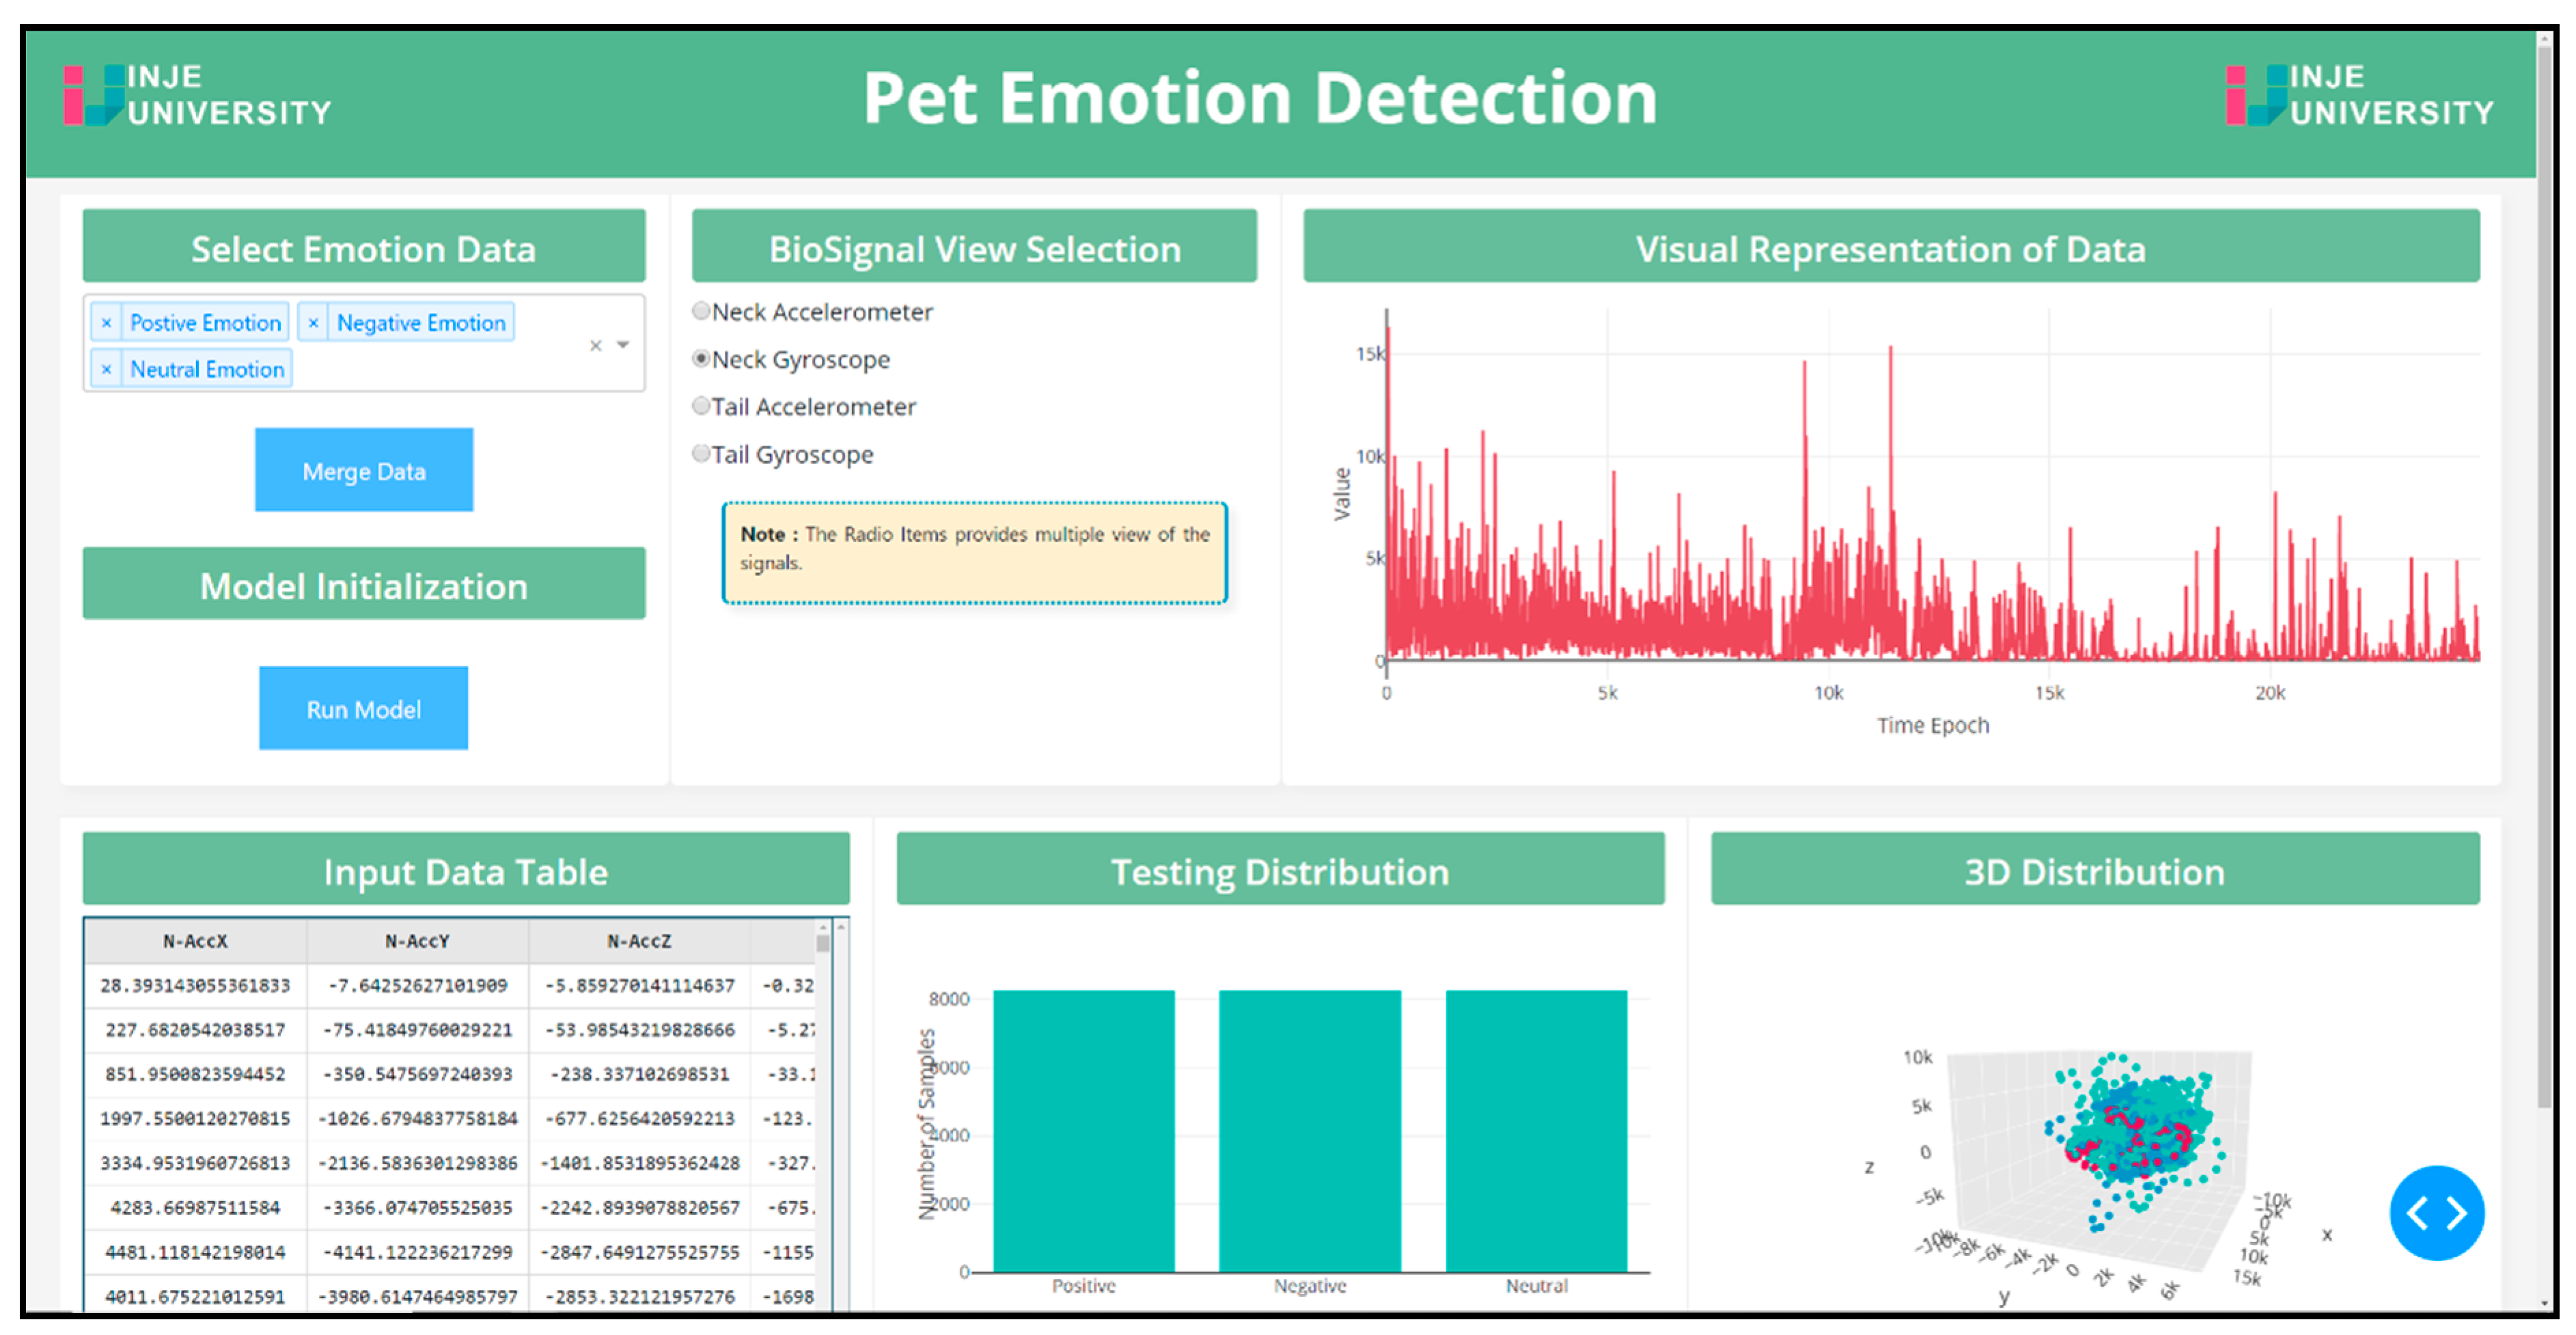
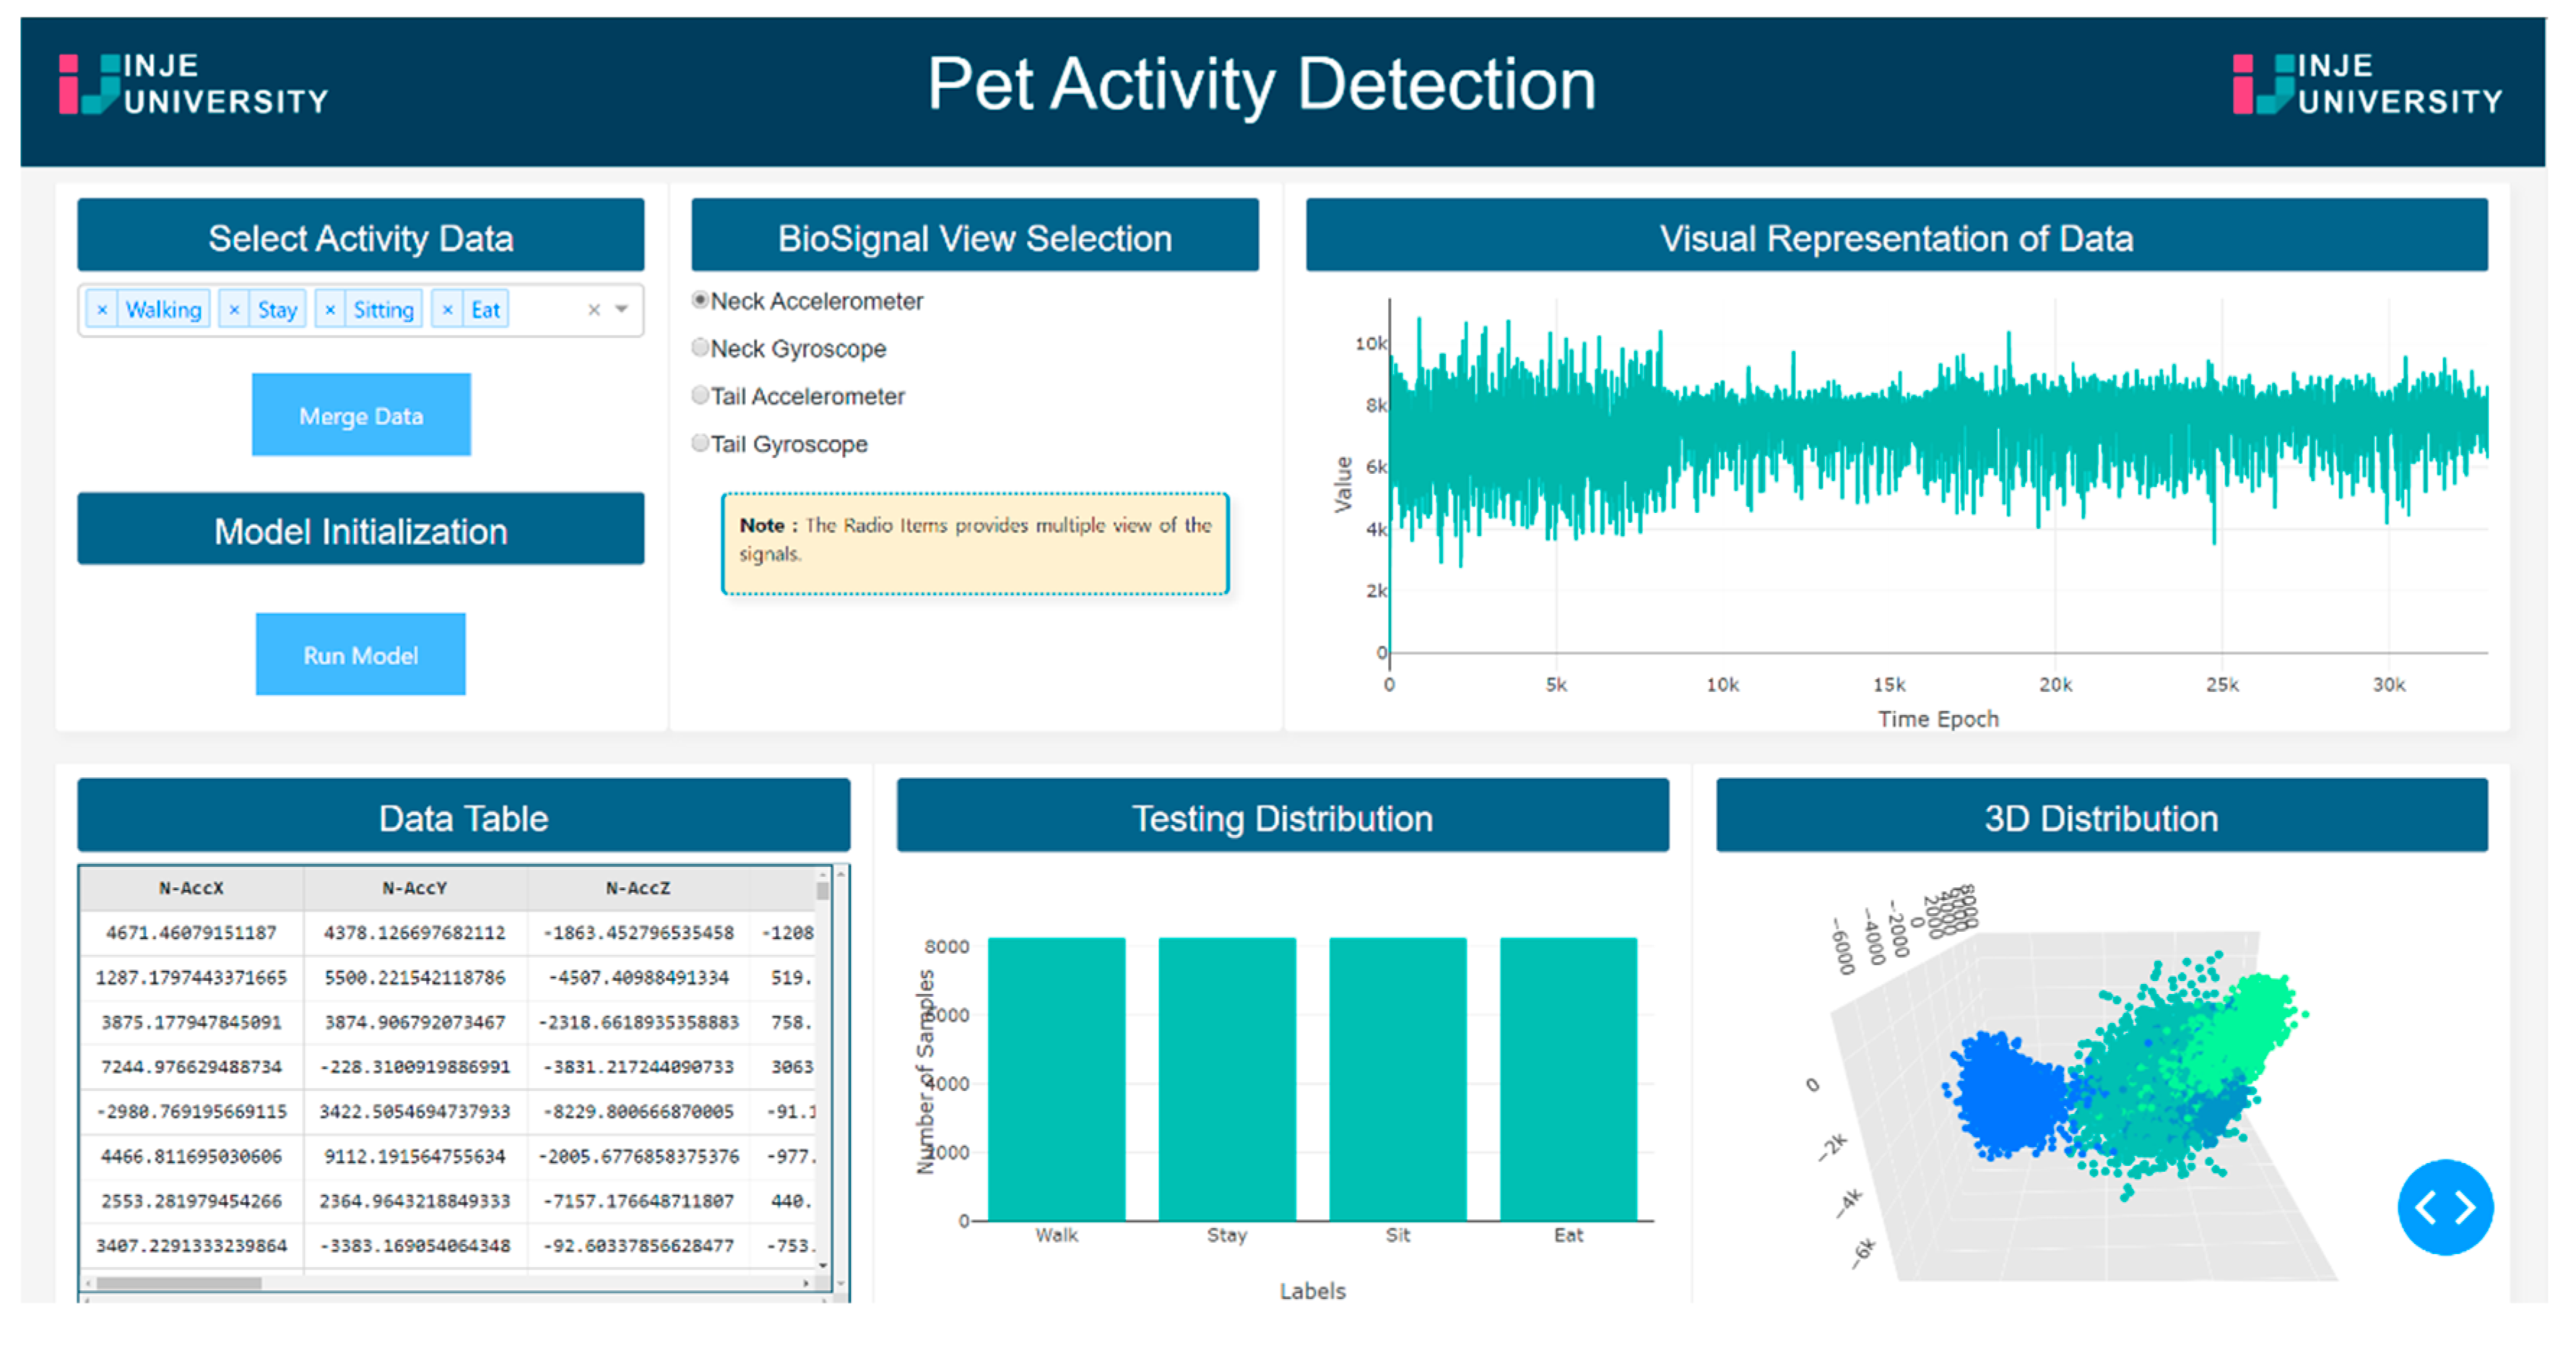
4.5. Web Application

To deploy the machine learning models developed in the study, two different web applications were designed for activity and emotion detection, respectively. The application was developed using Python’s micro web framework Flask and Dash. The pipeline of the application was designed to accept the raw data generated from the neck-wearable and tail-wearable devices. Furthermore, regarding the process, the raw accelerometer and gyroscope data from both devices are passed through the pre-processing and the feature engineering routine of the system. The preprocessing and feature engineering routine cleans, processes, and extracts important features on the fly. Moving on, the data extracted features were passed to the machine learning module, which performed the analysis on the data and laid out the predictions for each data segment. Figure 8 shows the web application for activity detection and Figure 9 shows the web application for emotion detection.

5. Results

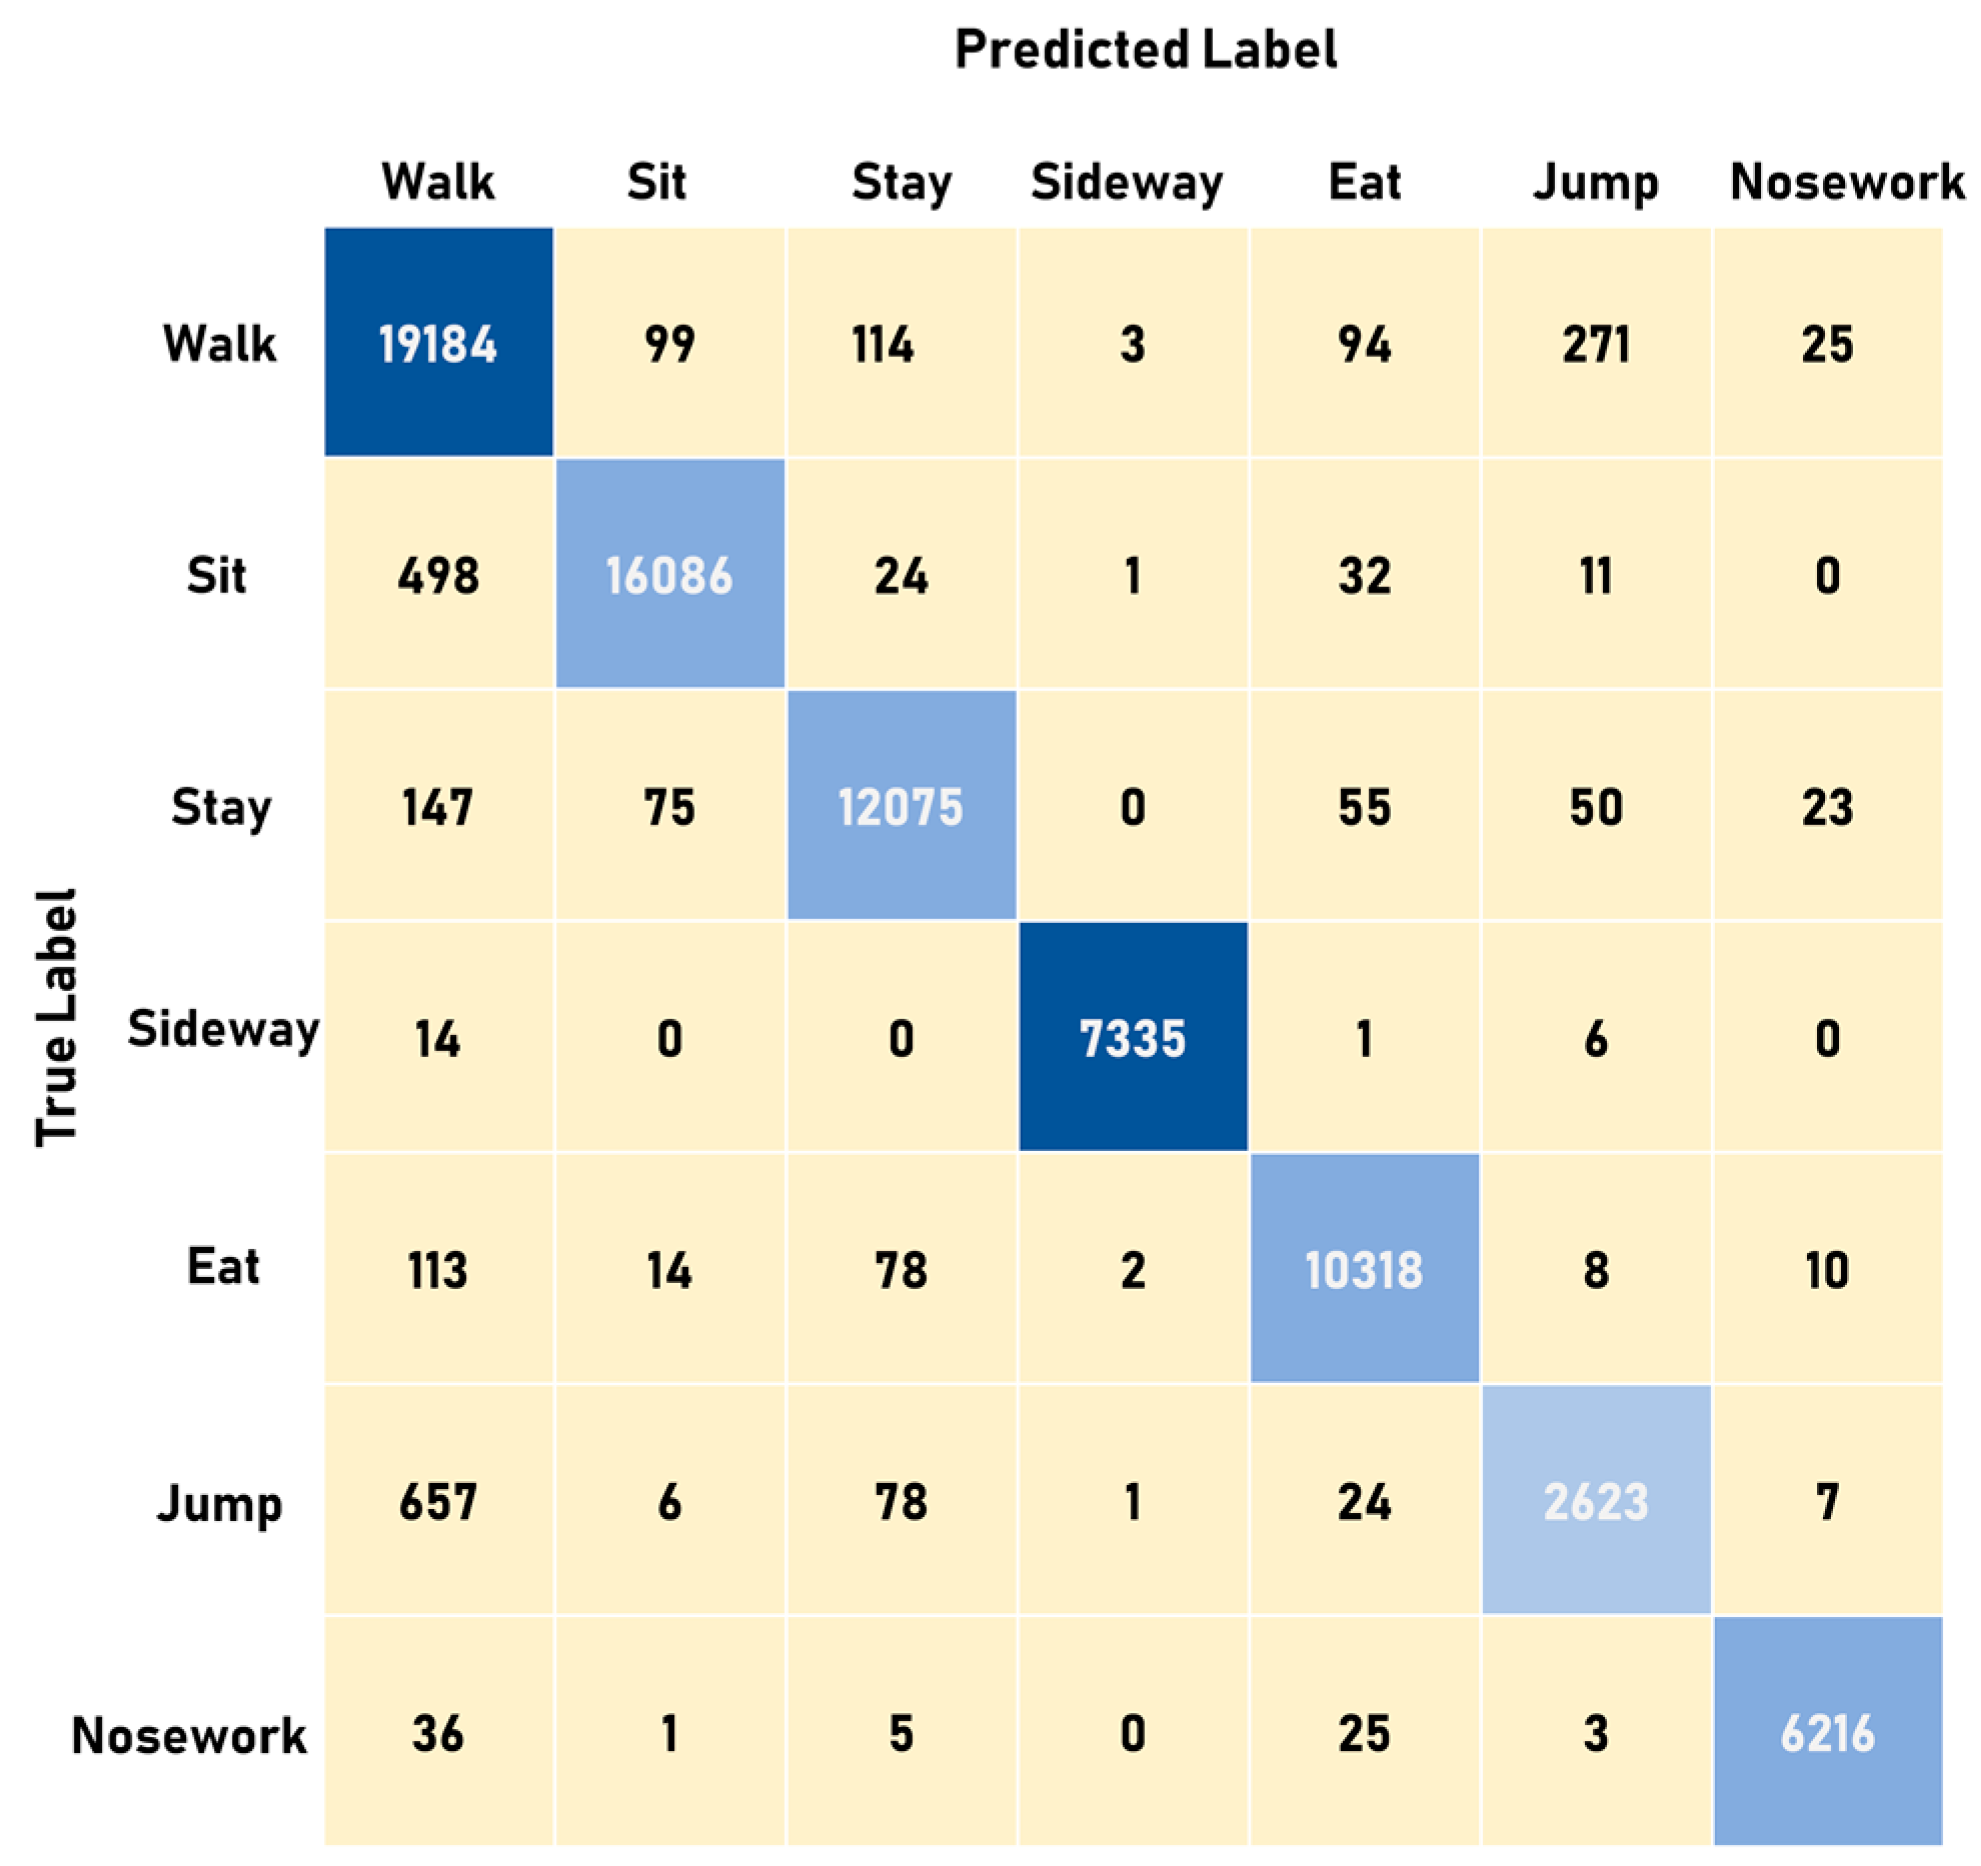
5.1. Activity Detection

The machine learning algorithms developed in our work uncovered some astounding and effective results in terms of determining the activity for a particular data segment. Table 8, depicted below, provides a comparative analysis between all five machine learning algorithms that were used for the learning process, and the evaluation metrics. The scores mentioned in Table 8 are based on the data of the validation set. From the scores, it can be duly observed that the ANN outperformed all the other classifiers. Moreover, as the primary requirement of the complete study was to develop a classifier that could be deployed in a real-time production environment, having ANN as the classifier would be very beneficial, as it provides the support for incremental learning.
Figure 10, plotted below, shows the confusion matrix that was derived using the classification results of the test data. Therefore, we can see that the confusion matrix that was derived from the classification results on the test data is in full accordance with the initial hypothesis that the number of correct predictions in each class needs to be above 85%; that is, the recall of each class needs to be above 85% and maintain a fixed classification rate across each class.

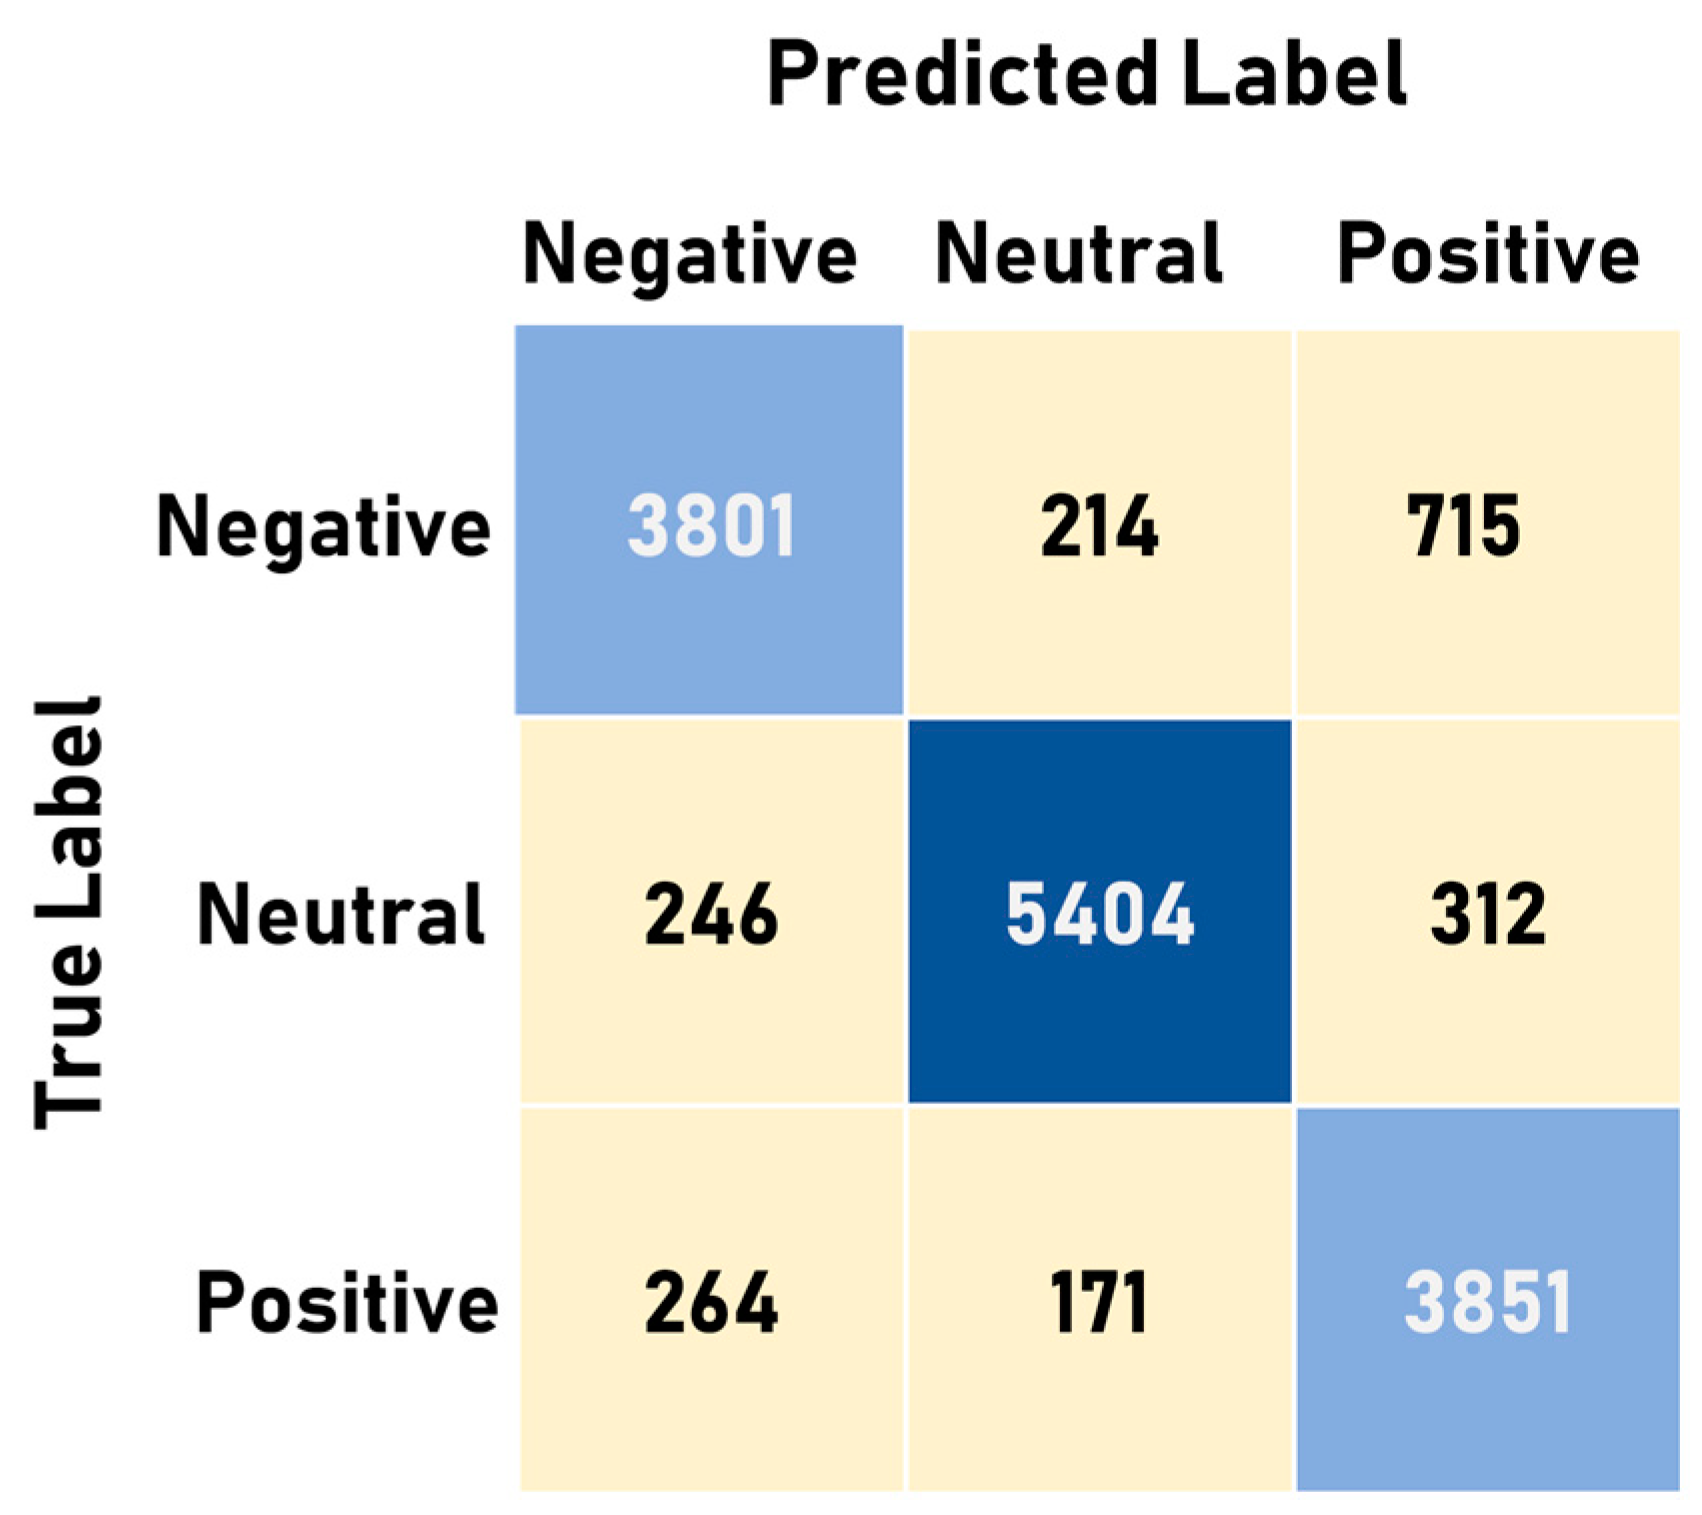
5.2. Emotion Detection

For emotion detection too, some astounding results were observed. The five algorithms that were used to develop the machine learning models produced some results which completely accorded with the initial hypothesis that was devised for the emotion detection models. Table 9, plotted below, shows the comparative analysis between the performances of multiple algorithms that were used to develop the model. But in Table 9, it can be observed that the random forest algorithm outperformed all the other algorithms. But in the Table, it can be seen that the ANN model also performed fairly well. Therefore, for the sake of deploying the model in the production environment, we used the ANN for the same reason that was discussed—for the activity detection, as that is incremental learning.
Figure 11, plotted below, provides the confusion matrix based on the classification results obtained from the ANN model. It can be duly observed in the confusion matrix that it completely follows the initial hypothesis which stated that the number of correct predictions in each class needs to be more than 85% and that it must maintain a stable classification rate across all the classes.

6. Discussion

We have developed an activity and emotion detection framework that will able to perform efficiently for monitoring the household pets by leveraging wearable sensors on the neck and tail. We have presented various features that were derived from the accelerometer’s and gyroscope’s data that was used as input for recognizing different activities and emotions in a precise way with low misclassification rates. Our results highlight the complex procedure involved in the detection of the behavior of household pets. We can see that the similar features extracted from different types of signals are able to recognize the activity and emotional state. The most important point to consider here is that our model was working perfectly with imbalanced data sets and also predicted some rare behaviors, such as nose-work and moving sideways. Although previous researchers detected the emotion patterns based on various physiological signals, in this paper, we implemented the hypothesis which described the relationship between tail wagging and emotional state in real-time by collecting the signals using a tail-wearable device. The accelerometer and gyroscope data-based model was not studied deeply for the animals, but few researchers have implemented that model in the human beings and found good results which could be comparable with our method, cementing our as a state-of-the-art model. Although we were able to get successful results, the challenge lies in the interpretability of the model when it takes inputs other than tail-wagging data, such as galvanic skin responses, respiration, ECG, EEG, and PPG data. Although comparing the emotional model of human beings with an emotional model of animals is not perfect, in this paper, they were compared to check the feasibility and the effectiveness of the model. The emotion detection models implemented in the human considered the physiological signals as the primary input for the identification of emotional state [46,47]; those data were missing in our emotion detection model. One of the findings was that the relationship between body language pattern and emotional state described by [48], could be compared to our model because tail wagging is considered a decoded version of body language [49].
The novelties of this study are as follows. (1) This is the first study that used neck and tail-wearable data that included accelerometric data and gyroscopic data for the detection of activity patterns and is highly recommended for real-life situations, because activities of dogs include both body movement and tail movement, and in this case we had the data collected using both the sensors. (2) This study used tail-wearable accelerometer and gyroscope data for the detection of emotional patterns, and is also recommended for real-life situations, because the emotional pattern can be easily described by the tail movement. (3) This study presented a robust system by using an incremental learning-based machine learning algorithm. (4) This study also contained a web application in which the complete process could be experienced, starting from the input of the data to the data distribution, and resulting in the single web page within a few seconds.
The system proposed in this study for activity detection outweighs the performances of previous researchers’ work. A comparison of our result with state-of-the-art models for activity detection is shown in Table 10. The comparison of our result with state-of-the-art models for emotion detection is shown in Table 11.

7. Conclusions

In this paper, activity detection and emotion detection systems were proposed; they used wearable devices that leveraged incremental machine learning models. The methodology presented in the study demonstrates the effectiveness of using wearable sensor-based techniques and machine learning algorithms for the quantification of behaviors and for the development of automated systems. A challenge that was addressed here was the collection of data for different activities, because fetching data from animals is a very difficult task that had to be performed. Considering the earlier reports, this work plotted some very new findings, such as (1) using accelerometric and gyroscopic data together for the detection of activity and emotion detection; (2) collecting data at two different locations, the neck and tail, that provided a lot of samples for making a robust model for the development of an automated system; (3) quantifying emotional state based on tail wagging, which is novel considering the use accelerometric and gyroscopic data, yet was effectively presented in this paper; (4) using incremental learning methods effectively, to achieve improved accuracy over conventional machine learning methods.
The limitations of this study are as follows. (1) The study did not take any additional cues for the development of its emotion detection model; this study only used tail wagging data for classifying different emotional states of the dog. (2) The emotion detection model that was developed in this study on the basis of tail wagging needs further validation to be implemented in real-life situations.
The methodology proposed in this paper could be improved by taking into account the physiological signals which are directly or indirectly related to behavioral patterns. The system was developed using accelerometer and gyroscope data, but in future, other parameters, such as galvanic skin responses, respiration, and heart rate data have to be included to develop a more robust model for the detection of the behavioral patterns. As previous pieces of literature already mentioned the importance of heart rate and physiological data for the detection of emotional states, considering these data with the tail data could make the model more robust and provide much-improved accuracy. The outcome of this study provided us with a lot of confidence that this system can be used in real-life situations for detecting the activity patterns and the emotional patterns of pet dogs for monitoring their health and well-being.

Author Contributions

Conceptualization, S.A. and S.C.; methodology, S.A. and S.C.; validation, S.A., S.C., and H.-C.K.; formal analysis, S.A., S.C., and H.-C.K.; data curation, J.-S.S., S.A., and S.C.; writing—original draft preparation, S.A. and S.C.; writing—review and editing, S.A. and S.C.; supervision, H.-C.K. and D.-J.J.; project administration, H.-C.K.; funding acquisition, H.-C.K.

Funding

This research was supported by the Ministry of Trade, Industry, and Energy (MOTIE), Korea, through the Education program for Creative and Industrial Convergence (grant number N0000717).

Conflicts of Interest

The authors declare no conflicts of interest.

References

  1. Watanabe, S.; Izawa, M.; Kato, A.; Ropert-Coudert, Y.; Naito, Y. A new technique for monitoring the detailed behavior of terrestrial animals: A case study with the domestic cat. Appl. Anim. Behav. Sci. 2005, 94, 117–131. [Google Scholar] [CrossRef]
  2. Hooker, S.K.; Biuw, M.; McConnell, B.J.; Miller, P.J.; Sparling, C.E. Bio-logging science: Logging and relaying physical and biological data using animal-attached tags. Deep Sea Res. 2007, 3, 177–182. [Google Scholar] [CrossRef]
  3. Bidder, O.R.; Soresina, M.; Shepard, E.L.; Halsey, L.G.; Quintana, F.; Gómez-Laich, A.; Wilson, R.P. The need for speed: Testing acceleration for estimating animal travel rates in terrestrial dead-reckoning systems. Zoology 2012, 115, 58–64. [Google Scholar] [CrossRef] [PubMed]
  4. Baratchi, M.; Meratnia, N.; Havinga, P.; Skidmore, A.; Toxopeus, B. Sensing solutions for collecting spatio-temporal data for wildlife monitoring applications: A review. Sensors 2013, 13, 6054–6088. [Google Scholar] [CrossRef]
  5. Gravina, R.; Alinia, P.; Ghasemzadeh, H.; Fortino, G. Multi-sensor fusion in body sensor networks: State-of-the-art and research challenges. Inf. Fusion 2017, 35, 68–80. [Google Scholar] [CrossRef]
  6. Fortino, G.; Galzarano, S.; Gravina, R.; Li, W. A framework for collaborative computing and multi-sensor data fusion in body sensor networks. Inf. Fusion 2015, 22, 50–70. [Google Scholar] [CrossRef]
  7. Chakraborty, S.; Aich, S.; Joo, M.I.; Sain, M.; Kim, H.C. A Multichannel Convolutional Neural Network Architecture for the Detection of the State of Mind Using Physiological Signals from Wearable Devices. J. Healthc. Eng. 2019, 2019, 5397814. [Google Scholar] [CrossRef]
  8. Fortino, G.; Giannantonio, R.; Gravina, R.; Kuryloski, P.; Jafari, R. Enabling effective programming and flexible management of efficient body sensor network applications. IEEE Trans. Hum. Mach. Syst. 2012, 43, 115–133. [Google Scholar] [CrossRef]
  9. Fortino, G.; Parisi, D.; Pirrone, V.; Di Fatta, G. BodyCloud: A SaaS approach for community body sensor networks. Future Gener. Comput. Syst. 2014, 35, 62–79. [Google Scholar] [CrossRef]
  10. Kooyman, G.L. Genesis and evolution of bio-logging devices. Natl. Polar Res. Inst. 2004, 58, 15–22. [Google Scholar]
  11. Yoda, K.; Naito, Y.; Sato, K.; Takahashi, A.; Nishikawa, J.; Ropert-Coudert, Y.; Kurita, M.; Le Maho, Y. A new technique for monitoring the behavior of free-ranging Adelie penguins. J. Exp. Biol. 2001, 204, 685–690. [Google Scholar] [PubMed]
  12. Wilson, R.P.; Shepard, E.L.C.; Liebsch, N. Prying into the intimate details of animal lives: Use of a daily diary on animals. Endanger. Species Res. 2008, 4, 123–137. [Google Scholar] [CrossRef]
  13. Britt, W.R.; Miller, J.; Waggoner, P.; Bevly, D.M.; Hamilton, J.A., Jr. An embedded system for real-time navigation and remote command of a trained canine. Pers. Ubiquitous Comput. 2011, 15, 61–74. [Google Scholar] [CrossRef]
  14. Cooper, C. How to Listen to Your Dog: The Complete Guide to Communicating with Man’s Best Friend; Atlantic Publishing Company: London, UK, 2015. [Google Scholar]
  15. Siniscalchi, M.; Lusito, R.; Vallortigara, G.; Quaranta, A. Seeing left-or right-asymmetric tail wagging produces different emotional responses in dogs. Curr. Biol. 2013, 23, 2279–2282. [Google Scholar] [CrossRef] [PubMed]
  16. Mather, M.; Thayer, J.F. How heart rate variability affects emotion regulation brain networks. Curr. Opin. Behav. Sci. 2018, 19, 98–104. [Google Scholar] [CrossRef]
  17. Liu, X.; Wang, Q.; Liu, D.; Wang, Y.; Zhang, Y.; Bai, O.; Sun, J. Human emotion classification based on multiple physiological signals by wearable system. Technol. Health Care 2018, 26, 459–469. [Google Scholar] [CrossRef]
  18. De Seabra, J.; Rybarczyk, Y.; Batista, A.; Rybarczyk, P.; Lebret, M.C.; Vernay, D. Development of a Wearable Monitoring System for Service Dogs. 2014. Available online: https://docentes.fct.unl.pt/agb/files/service_dogs.pdf (accessed on 18 September 2019).
  19. Ladha, C.; Hammerla, N.; Hughes, E.; Olivier, P.; Ploetz, T. Dog’s life: Wearable activity recognition for dogs. In Proceedings of the 2013 ACM International Joint Conference on Pervasive and Ubiquitous Computing, Zurich, Switzerland, 8–12 September 2013; pp. 415–418. [Google Scholar]
  20. Den Uijl, I.; Alvarez, C.B.G.; Bartram, D.; Dror, Y.; Holland, R.; Cook, A. External validation of a collar-mounted triaxial accelerometer for second-by-second monitoring of eight behavioral states in dogs. PLoS ONE 2017, 12, e0188481. [Google Scholar] [CrossRef]
  21. Massawe, E.A.; Kisangiri, M.; Kaijage, S.; Seshaiyer, P. Design and Analysis of Smart Sensing System for Animal Emotions Recognition. Int. J. Comput. Appl. 2017, 169, 8887. [Google Scholar]
  22. Wernimont, S.; Thompson, R.; Mickelsen, S.; Smith, S.; Alvarenga, I.; Gross, K. Use of accelerometer activity monitors to detect changes in pruritic behaviors: Interim clinical data on 6 dogs. Sensors. 2018, 18, 249. [Google Scholar] [CrossRef]
  23. Gerencsér, L.; Vásárhelyi, G.; Nagy, M.; Vicsek, T.; Miklósi, A. Identification of behavior in freely moving dogs (Canis familiaris) using inertial sensors. PLoS ONE 2013, 8, e77814. [Google Scholar] [CrossRef]
  24. Rahman, A.; Smith, D.V.; Little, B.; Ingham, A.B.; Greenwood, P.L.; Bishop-Hurley, G.J. Cattle behavior classification from collar, halter, and ear tag sensors. Inf. Process. Agric. 2018, 5, 124–133. [Google Scholar]
  25. Decandia, M.; Giovanetti, V.; Molle, G.; Acciaro, M.; Mameli, M.; Cabiddu, A.; Cossu, R.; Serra, M.G.; Manca, C.; Rassu, S.P.G.; et al. The effect of different time epoch settings on the classification of sheep behavior using tri-axial accelerometry. Comput. Electron. Agric. 2018, 154, 112–119. [Google Scholar] [CrossRef]
  26. Hammond, T.T.; Springthorpe, D.; Walsh, R.E.; Berg-Kirkpatrick, T. Using accelerometers to remotely and automatically characterize behavior in small animals. J. Exp. Biol. 2016, 219, 1618–1624. [Google Scholar] [CrossRef] [PubMed]
  27. Chakravarty, P.; Cozzi, G.; Ozgul, A.; Aminian, K. A novel biomechanical approach for animal behavior recognition using accelerometers. Methods Ecol. Evol. 2019, 10, 802–814. [Google Scholar] [CrossRef]
  28. Brugarolas, R.; Latif, T.; Dieffenderfer, J.; Walker, K.; Yuschak, S.; Sherman, B.L.; Roberts, D.L.; Bozkurt, A. Wearable heart rate sensor systems for wireless canine health monitoring. IEEE Sens. J. 2015, 16, 3454–3464. [Google Scholar] [CrossRef]
  29. Venkatraman, S.; Long, J.D.; Pister, K.S.; Carmena, J.M. Wireless inertial sensors for monitoring animal behavior. In Proceedings of the 2007 29th Annual International Conference of the IEEE Engineering in Medicine and Biology Society, Lyon, France, 23–26 August 2007; pp. 378–381. [Google Scholar]
  30. Hansen, B.D.; Lascelles, B.D.X.; Keene, B.W.; Adams, A.K.; Thomson, A.E. Evaluation of an accelerometer for at-home monitoring of spontaneous activity in dogs. Am. J. Vet. Res. 2007, 68, 468–475. [Google Scholar] [CrossRef] [PubMed]
  31. Grünewälder, S.; Broekhuis, F.; Macdonald, D.W.; Wilson, A.M.; McNutt, J.W.; Shawe-Taylor, J.; Hailes, S. Movement activity based classification of animal behavior with an application to data from cheetah (Acinonyx jubatus). PLoS ONE 2012, 7, e49120. [Google Scholar] [CrossRef]
  32. McClune, D.W.; Marks, N.J.; Wilson, R.P.; Houghton, J.D.; Montgomery, I.W.; McGowan, N.E.; Gormley, E.; Scantlebury, M. Tri-axial accelerometers quantify behavior in the Eurasian badger (Meles meles): Towards an automated interpretation of field data. Anim. Biotelemetry 2014, 2. [Google Scholar] [CrossRef]
  33. Nazmi, N.; Abdul Rahman, M.; Yamamoto, S.I.; Ahmad, S.; Zamzuri, H.; Mazlan, S. A review of classification techniques of EMG signals during isotonic and isometric contractions. Sensors 2016, 16, 1304. [Google Scholar] [CrossRef]
  34. Rosati, S.; Balestra, G.; Knaflitz, M. Comparison of Different Sets of Features for Human Activity Recognition by Wearable Sensors. Sensors. 2018, 18, 4189. [Google Scholar] [CrossRef]
  35. Rawassizadeh, R.; Tomitsch, M.; Nourizadeh, M.; Momeni, E.; Peery, A.; Ulanova, L.; Pazzani, M. Energy-efficient integration of continuous context sensing and prediction into smartwatches. Sensors 2015, 15, 22616–22645. [Google Scholar] [CrossRef] [PubMed]
  36. Rehman, M.; Liew, C.; Wah, T.; Shuja, J.; Daghighi, B. Mining personal data using smartphones and wearable devices: A survey. Sensors 2015, 15, 4430–4469. [Google Scholar] [CrossRef] [PubMed]
  37. Banaee, H.; Ahmed, M.; Loutfi, A. Data mining for wearable sensors in health monitoring systems: A review of recent trends and challenges. Sensors 2013, 13, 17472–17500. [Google Scholar] [CrossRef]
  38. Castro, D.; Coral, W.; Rodriguez, C.; Cabra, J.; Colorado, J. Wearable-based human activity recognition using an iot approach. J. Sens. Actuator Netw. 2017, 6, 28. [Google Scholar] [CrossRef] [Green Version]
  39. Yang, X.; Lee, J.; Jung, H. Fault Diagnosis Management Model using Machine Learning. J. Inf. Commun. Converg. Eng. 2019, 17, 128–134. [Google Scholar]
  40. Aich, S.; Pradhan, P.; Park, J.; Sethi, N.; Vathsa, V.; Kim, H.C. A validation study of freezing of gait (FoG) detection and machine-learning-based FoG prediction using estimated gait characteristics with a wearable accelerometer. Sensors 2018, 18, 3287. [Google Scholar] [CrossRef] [PubMed] [Green Version]
  41. Krawczyk, B. Learning from imbalanced data: Open challenges and future directions. Prog. Artif. Intell. 2016, 5, 221–232. [Google Scholar] [CrossRef] [Green Version]
  42. Wu, D.; Wang, Z.; Chen, Y.; Zhao, H. Mixed-kernel based weighted extreme learning machine for inertial sensor based human activity recognition with imbalanced dataset. Neurocomputing 2016, 190, 35–49. [Google Scholar] [CrossRef]
  43. M’hamed Abidine, B.; Fergani, B.; Oussalah, M.; Fergani, L. A new classification strategy for human activity recognition using cost sensitive support vector machines for imbalanced data”. Kybernetes 2014, 43, 1150–1164. [Google Scholar] [CrossRef]
  44. Fergani, B.; Clavier, L. Importance-weighted the imbalanced data for C-SVM classifier to human activity recognition. In Proceedings of the 2013 8th International Workshop on Systems, Signal Processing and their Applications (WoSSPA), Algeria, Zalalada, 12–15 May 2013; pp. 330–335. [Google Scholar]
  45. Chawla, N.V.; Bowyer, K.W.; Hall, L.O.; Kegelmeyer, W.P. SMOTE: Synthetic minority over-sampling technique. J. Artif. Intell. Res. 2002, 16, 321–357. [Google Scholar] [CrossRef]
  46. Zhao, B.; Wang, Z.; Yu, Z.; Guo, B. EmotionSense: Emotion Recognition Based on Wearable Wristband. In Proceedings of the 2018 IEEE SmartWorld, Ubiquitous Intelligence & Computing, Advanced & Trusted Computing, Scalable Computing & Communications, Cloud & Big Data Computing, Internet of People and Smart City Innovation (SmartWorld/SCALCOM/UIC/ATC/CBDCom/IOP/SCI), Guangzhou, China, 8–12 October 2018; pp. 346–355. [Google Scholar]
  47. Dobbins, C.; Fairclough, S. Detecting negative emotions during real-life driving via dynamically labelled physiological data. In Proceedings of the 2018 IEEE International Conference on Pervasive Computing and Communications Workshops (PerCom Workshops), Athens, Greece, 19–23 March 2018; pp. 830–835. [Google Scholar]
  48. Behoora, I.; Tucker, C.S. Machine learning classification of design team members’ body language patterns for real time emotional state detection. Des. Stud. 2015, 39, 100–127. [Google Scholar] [CrossRef]
  49. Hasegawa, M.; Ohtani, N.; Ohta, M. Dogs’ body language relevant to learning achievement. Animals 2014, 4, 45–58. [Google Scholar] [CrossRef] [PubMed] [Green Version]
Figure 1. (a) Neck-wearable and tail-wearable devices placed on the dog for activity detection. (b) The tail-wearable device is placed for emotion detection. (c) Neck-wearable device. (d) Tail-wearable device.
Applsci 09 04938 g001
Figure 2. Data collection procedure.
Applsci 09 04938 g002
Figure 3. Data distribution of activity detection.
Applsci 09 04938 g003
Figure 4. Resultant signals of the accelerometer and gyroscope from both neck and tail-wearable devices for activity detection. (a) For Activity Walking, Sitting, Stay and Sideway (b) For Activity Jumping, Nosework and Eating.
Applsci 09 04938 g004
Figure 5. Data distribution of emotion detection.
Applsci 09 04938 g005
Figure 6. Resultant signals of the accelerometer and gyroscope from both neck and tail-wearable devices for emotion detection.
Applsci 09 04938 g006
Figure 7. Complete process of the experiment.
Applsci 09 04938 g007
Figure 8. Activity detection web application.
Applsci 09 04938 g008
Figure 9. Emotion detection web application.
Applsci 09 04938 g009
Figure 10. Confusion matrix for activity detection.
Applsci 09 04938 g010
Figure 11. Confusion matrix for emotion detection.
Applsci 09 04938 g011
Table 1. Related work.
Ref.SensorsLocationKey ResultsLimitationsSubjects
[18]Tri-axial accelerometer and gyroscopeBackAccelerometer data were analyzed based on the simultaneous video recording for different activities and emotions.This is a preliminary study to check the feasibility of wearable devices for activity and emotion detection and not validated for real-life situations.Dog
[19]Tri-axial accelerometerCollarThe accelerometer data-based model is able to classify different activities with natural settings with an accuracy close to 70%.The classification accuracy of the model solely depends on the recording by the dog owner because that recording was used for annotation, which is not perfect because a manual error is inevitable. The proper environment has not been prepared for conducting the experiment.Dog
[20]Tri-axial accelerometerCollarAccelerometer data has been used for the classification of different activities and external validation has been performed on the model for checking the robustness of the model.Only accelerometer data is used for the classification of different activities. Emotion detection study was not explored in this paper.Dog
[21]Heart rate, galvanic skin resistance, and body temperatureCollarThe result would able to recognize the animal emotions based on the physiological signals.The model has not implemented with real data. So, the result cannot be validated to be used in real-life situations.Dog and Cow
[22]Tri-axial accelerometerCollarThe model was developed to monitor the pruritic behavior. It was mentioned that the result obtained using wearable device matched with the veterinarian reports.Only accelerometer data is used for predicting behavior changes.Dog
[23]Tri-axial accelerometer and gyroscopeWithersAccelerometer data and a gyroscope for detecting the activity patterns and used machine learning techniques to automate the system with an accuracy of 91.3%Used only one machine learning technique (SVM) to evaluate the performance of the system. The other model performance has not been explored to check the robustness of the system. Emotion pattern detection has not been explored as well.Dog
[24]Tri-axial accelerometerCollar, halter and ear tag sensorsTo monitor the behavior using accelerometer sensor data at different position and automated the system using machine learning techniques with a good classification accuracy.Only accelerometer data has been taken into account for behavior detection and only one machine learning model has been used to evaluate the system.Sheep
[25]Tri-axial accelerometerBackAcceleration data were used to detect the behavior pattern of chipmunk species and machine learning techniques were used to automate the system.The model was developed only using two chipmunk species, which don’t support the validation standpoint and the system used only the acceleration data to detect the pattern.Chipmunk
[26]Tri-axial accelerometerCollarAcceleration data were used to detect the behaviors of meerkat species and hybrid techniques (biomechanical principle and machine learning technique) are used for classification and showed good performance.Only accelerometer data is used for the development of the model and the performance has not been compared due to lack of the state of art model.Meerkat
[27]Tri-axial accelerometerBackAcceleration data and GPS data were used to detect the behavioral modes of vulture and machine learning techniques were used for classification of modes.This kind of analysis is really challenging because they are free-ranging animals. Validation of this model in real-time is difficult.Vulture
[28]ECG, PPG, Inertial Measurement Unit (IMU)BackThe physiological signals collected using these sensors help to detect the emotional response of the dog. A strong correlation found between the physiological signals and emotional state.No information has been provided about the tail movements behavioral the emotional response and no machine learning system has been used to automate the system.Dog
[29]Tri-axial accelerometerBackAcceleration data collected using the sensors used to develop the algorithm to detect the activity pattern of the rats and also helps to provide information about the neural behaviors which help to detect the emotions.Only acceleration data has been used for detecting the behavior and performance comparison using different machine learning algorithms has not been studied in this paper.Rat
[30]Tri-axial accelerometerCollar, vest, and forelimb stocking locationsAcceleration data collected using sensors were used to detect the activities and the best sensor locations were also analyzed.Any machine learning techniques were not used for automating the developed system and also the emotional state of the dog using the data has not been discussed.Dog
[31]GPS radio collar, bi-axial accelerometerCollarAn algorithm based on the acceleration data has been used to detect the activities of a cheetah and also classification of activities was performed using machine learning techniques.Only acceleration data has been used for the detection of activities. Emotional behavior has not been studied in this paper.Cheetah
[32]Tri-axial accelerometerNeckAcceleration data were used for the detection of different activities and classification task was performed using a machine learning technique.Only acceleration data were used for the detection of activities and only one conventional machine learning technique has been used and performance comparison using different machine learning algorithms has not been studied.Eurasian badger
Table 2. The data regarding the subjects (Dogs) from which data was fetched.
SerialSizeNameBreedAgeGender
1LargeMihokeuBorder Collie2Male
2LargeRingoBorder Collie6Female
3SmallDeoguFrench Bull Dog6Male
4SmallInterSichuan5Male
5MediumBarleyGolden Retriever3Male
6LargeCannesCannes Korso4Male
7LargeSoheeLot Willer2Female
8LargeSaaldogDalmatian1Male
9SmallChoiBeagle5Female
10MediumSimbaRhodesian Ridgeback7Male
Table 3. Statistical features.
FeatureEquationDescription
Mean X ¯ = 1 n i = 0 n ( X i ) The mean of the feature was calculated for each subject for all the samples in each fold i.e., 33 samples.
Standard Deviation σ = 1 N i = 1 N ( X i X ¯ ) 2 The standard deviation of the signal is calculated for each subject for all the samples in each fold i.e., 33 samples.
Median Absolute Deviation M A D = m e d i a n ( | X i X ˜ | )
Where, X ˜ is the median of X
The median absolute deviation was calculated each subject for all the samples in each fold i.e., 33 Samples.
Minimummin(X)The minimum of the signal was for calculated each subject for all the samples in each fold i.e., 33 Samples.
Maximummax(X)The maximum of the signal was for calculated each subject for all the samples in each fold i.e., 33 Samples.
Energy Measure E x = 1 n i = 0 n | x [ i ] | 2 The energy measure of the signal was calculated for each subject based on all the samples in each fold i.e., 33 Samples.
Inter Quartile Range I Q R = m e d i a n ( Q 3 ) m e d i a n ( Q 1 ) The interquartile range was calculated on each subject by considering each fold that is 33 samples of data as the complete set.
Signal Magnitude Area S M A =   1 n i = 0 n ( | X i | + | Y i | + | Z i | ) The signal magnitude area is been calculated by considering all the axis of the accelerometer and gyroscope and is calculated for each subject by considering the samples in each fold.
Skewness S k e w ( X ) = n ( n 1 ) ( n 2 ) i = 0 n ( X i X ¯ s ) The skewness for all the samples of a fold for a particular subject was calculated on the basis of the Fisher-Pearson standardized moment coefficient
Kurtosis K u r t ( X ) = E [ ( X X ¯ ) 4 ] s t d ( X ) 2 3 The kurtosis (peakedness) is calculated for individual signals.
Table 4. Peak-based features.
FeatureDescription
Number of PeaksThis feature gives out the number of peaks for a subject on a specific data fold of 33 samples
Peak Average AmplitudeThis feature gives out the average amplitude of the peaks for a subject on a specific data fold of 33 samples
Peak Value Difference MeanThis feature pursues the mean difference between the amplitude of consecutive detected peaks for a subject on a specific data fold of 33 samples
Peak Sample Difference MeanThis feature provides us with the mean time difference between each detected peak for a subject on a specific data fold of 33 samples
Table 5. Activity detection: classifiers and specifications.
ClassifierSpecifications
Random Forestn_estimators: 500, criterion = ‘gini’, max_depth:8, min_samples_split = 8, min_samples_leaf = 10
Support Vector MachineKernel = ‘rbf’, degree = 3, gamma = ‘auto_deprecated’,
C = 1.0, tol = 0.001, cache_size = 200
K—Nearest Neighborsn_neighbors = 50, weights = ‘uniform’, algorithm =‘auto’,
leaf_size = 40, p = 2, metric = ‘minkowski’
Naïve BayesGaussian
Artificial Neural Network
(Multi-Layer Perceptron)
Layers: [64, 128, 256, 32, 16, 7], Loss: Categorical Cross-Entropy,
Optimizer: AdaGrad
Table 6. Emotion detection: classifiers and specifications.
ClassifierSpecifications
Random Forestn_estimators: 200, criterion = ‘gini’, max_depth:4, min_samples_split = 4, min_samples_leaf = 5
Support Vector MachineKernel = ‘rbf’, degree = 2, gamma = ‘auto_deprecated’,
C = 1.0, tol = 0.001, cache_size = 200
K—Nearest Neighboursn_neighbors = 10, weights = ‘uniform’, algorithm = ‘auto’,
leaf_size = 40, p = 2, metric = ‘minkowski’
Naïve BayesGaussian
Artificial Neural Network
(Multi-Layer Perceptron)
Layers: [64, 128, 256, 512, 32, 3], Loss: Categorical Cross Entropy,
Optimizer: Stochastic Gradient Descent
Table 7. Class weights for activity detection model training.
ClassWeight
Walking (0)1.0
Sitting (1)1.0
Stay (2)1.0
Eating (3)1.012589412
Sideway (4)1.156774801
Nosework (5)1.203320
Jump (6)1.216978244
Table 8. Comparative analysis between multiple classifiers for activity detection.
MetricRandom ForestSVMKNNNaïve BayesANN
Accuracy0.92150.84520.86720.88440.9658
Average Recall0.91360.82420.84250.86670.9469
Average Precision0.90220.82220.85560.85330.9187
Average F1 Score0.90890.82810.85020.86210.9365
Table 9. Comparative analysis between multiple classifiers for emotion detection.
MetricRandom ForestSVMKNNNaïve BayesANN
Accuracy0.96750.78520.81230.89960.9287
Average Recall0.94360.77650.82550.88740.9134
Average Precision0.92910.85230.83210.900.9469
Average F1 Score0.93260.81260.82260.89420.9289
Table 10. A comparison of our result with state-of-the-art models’ work for activity detection.
AuthorLocation of sensorAccuracy
Our workNeck and Tail96.58%
Gerencsér [23]Dorsally midway between the two scapulae91.3%
Ladha [19]Collar70%
Table 11. A comparison of our result with state-of-the-art models’ work for emotion detection.
AuthorAccuracy
Our work92.87%
Zhao [46]75.56%
Dobbins [47]73%

