Mechanistic Study of Phosphorus Adsorption onto Iron Z-A: Spectroscopic and Experimental Approach

Abstract
:Featured Application
Abstract
1. Introduction
2. Materials and Methods
2.1. Synthesis of Adsorbents
2.2. Characterization of the Zeolites
2.3. Study on Adsorption-Desorption Performance and Isotherm Models
2.3.1. Adsorption-Desorption Study
2.3.2. Adsorption Isotherm Models
2.4. Adsorption Kinetic Study
2.5. Adsorption-Desorption Mechanism Study
3. Results and Discussion
3.1. Characterization of the Zeolite Samples
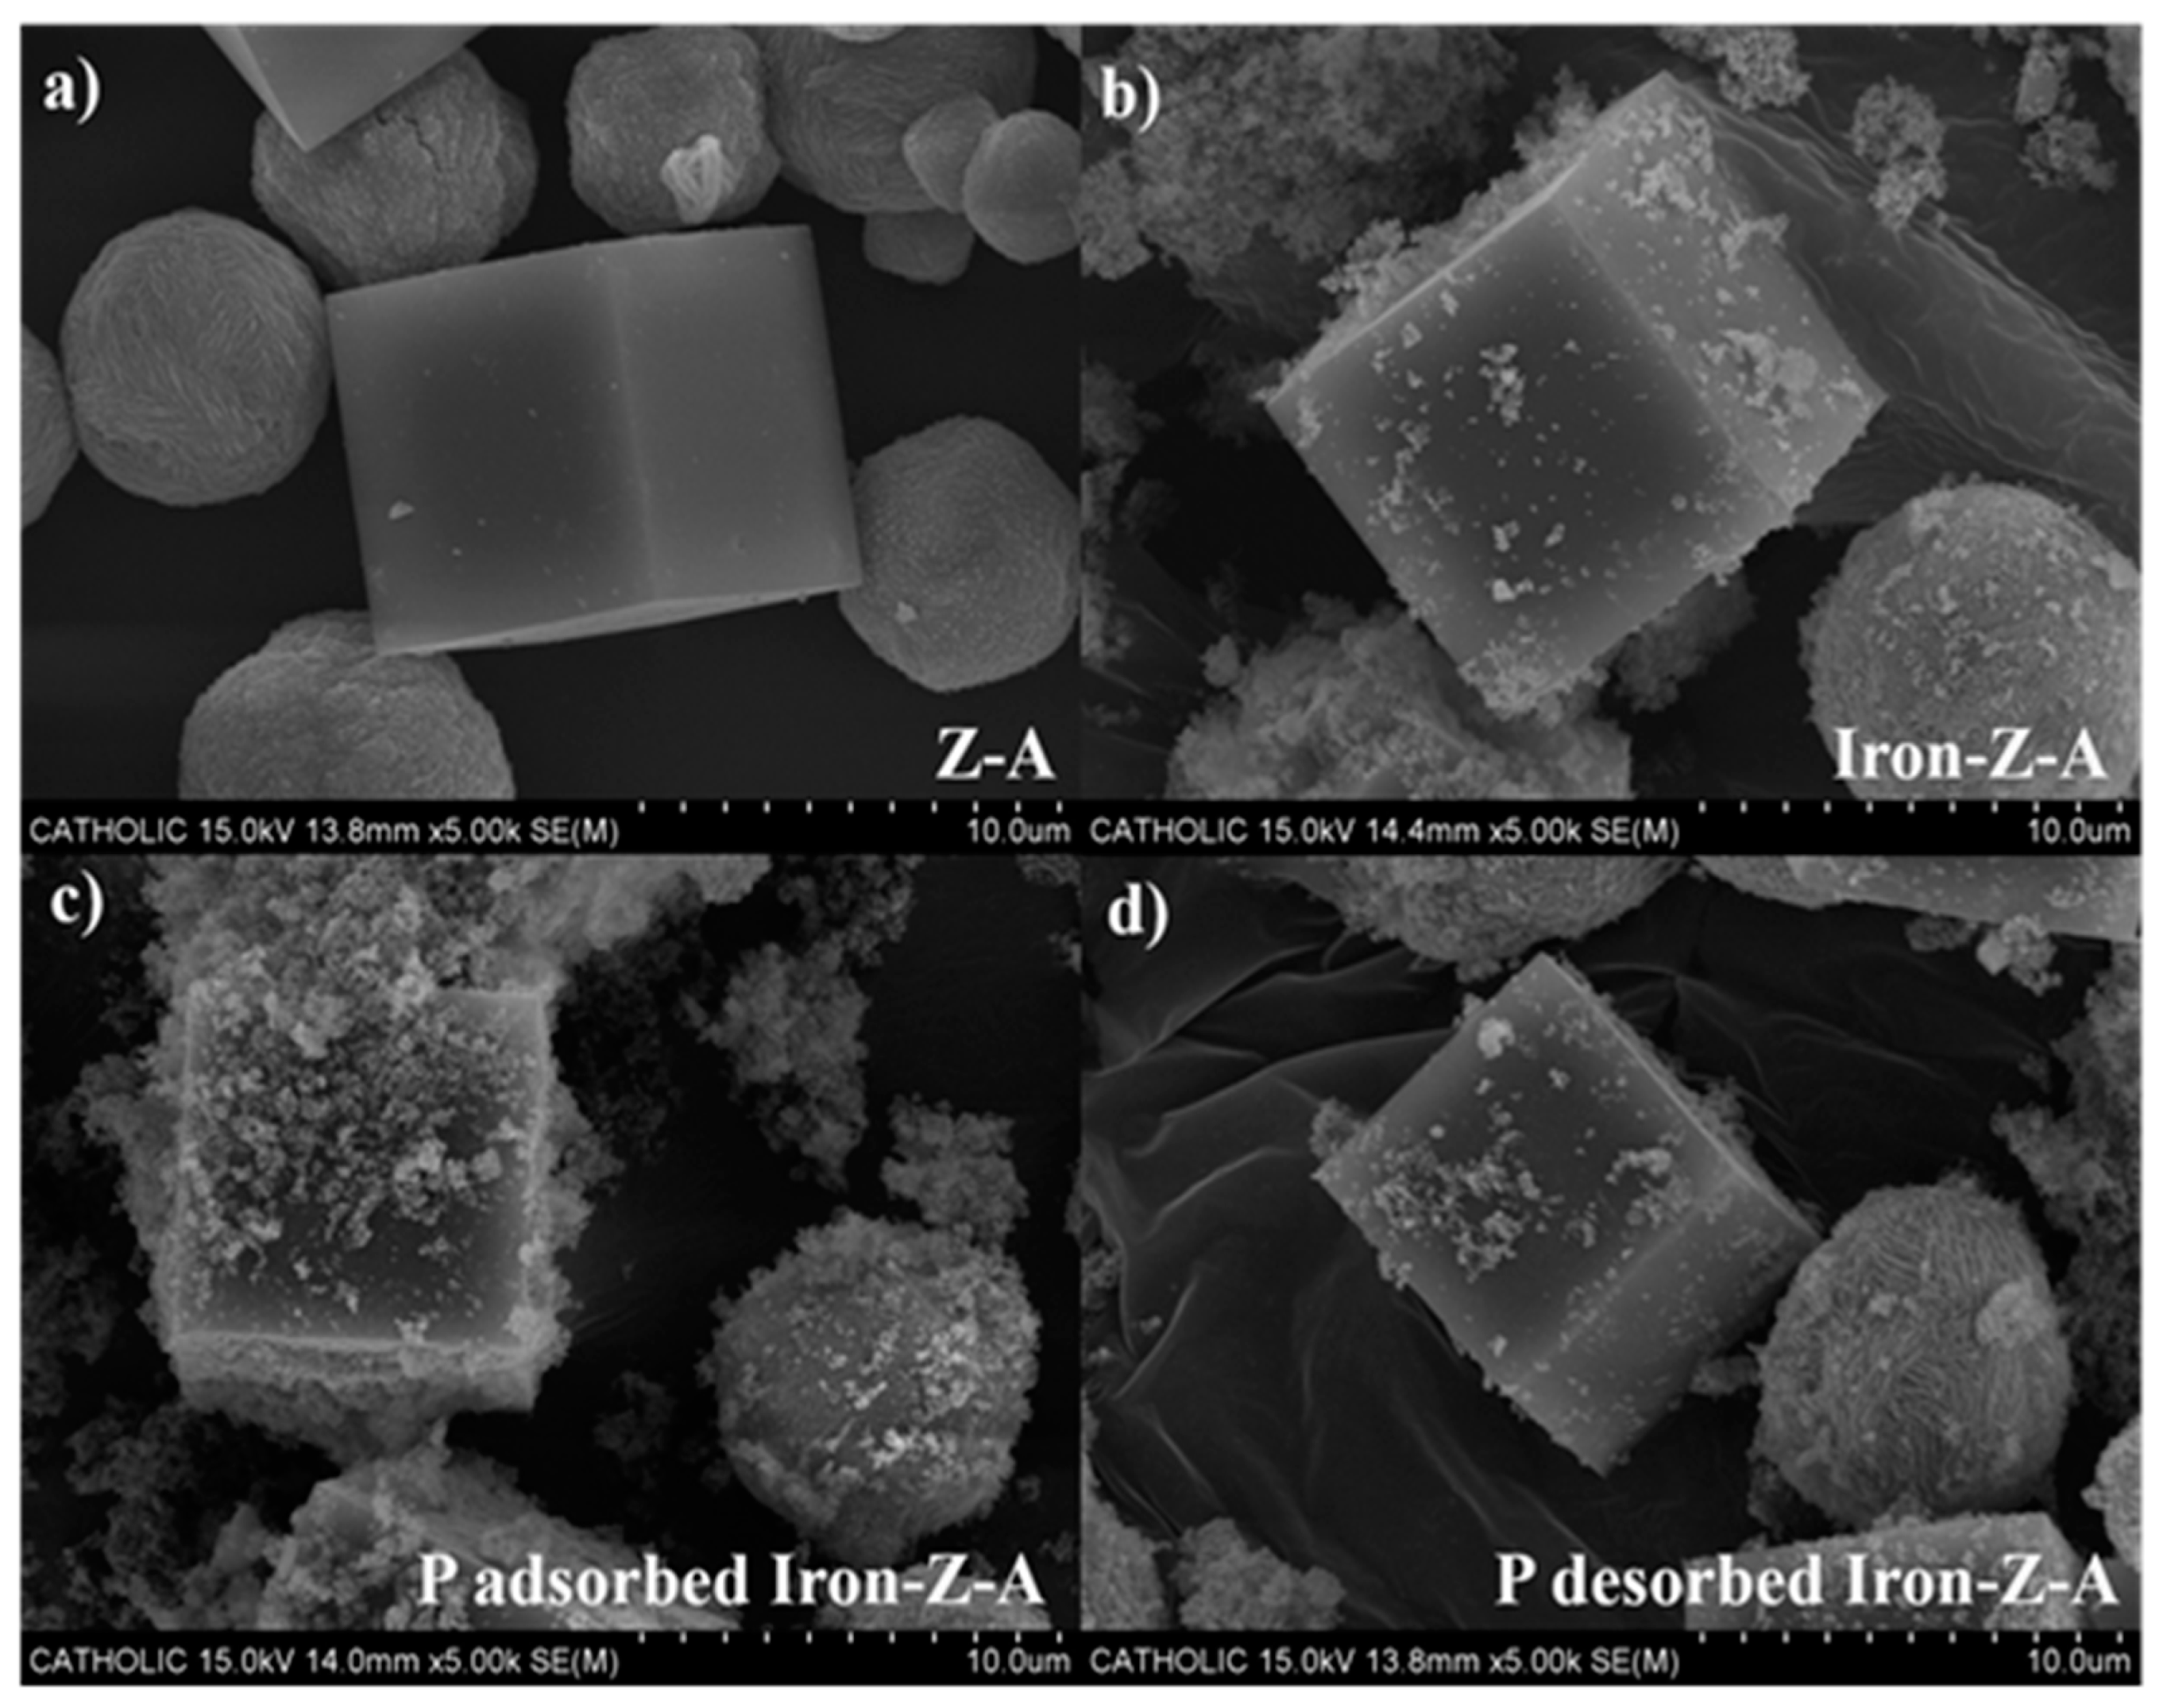
3.1.1. SEM and EDS Analysis
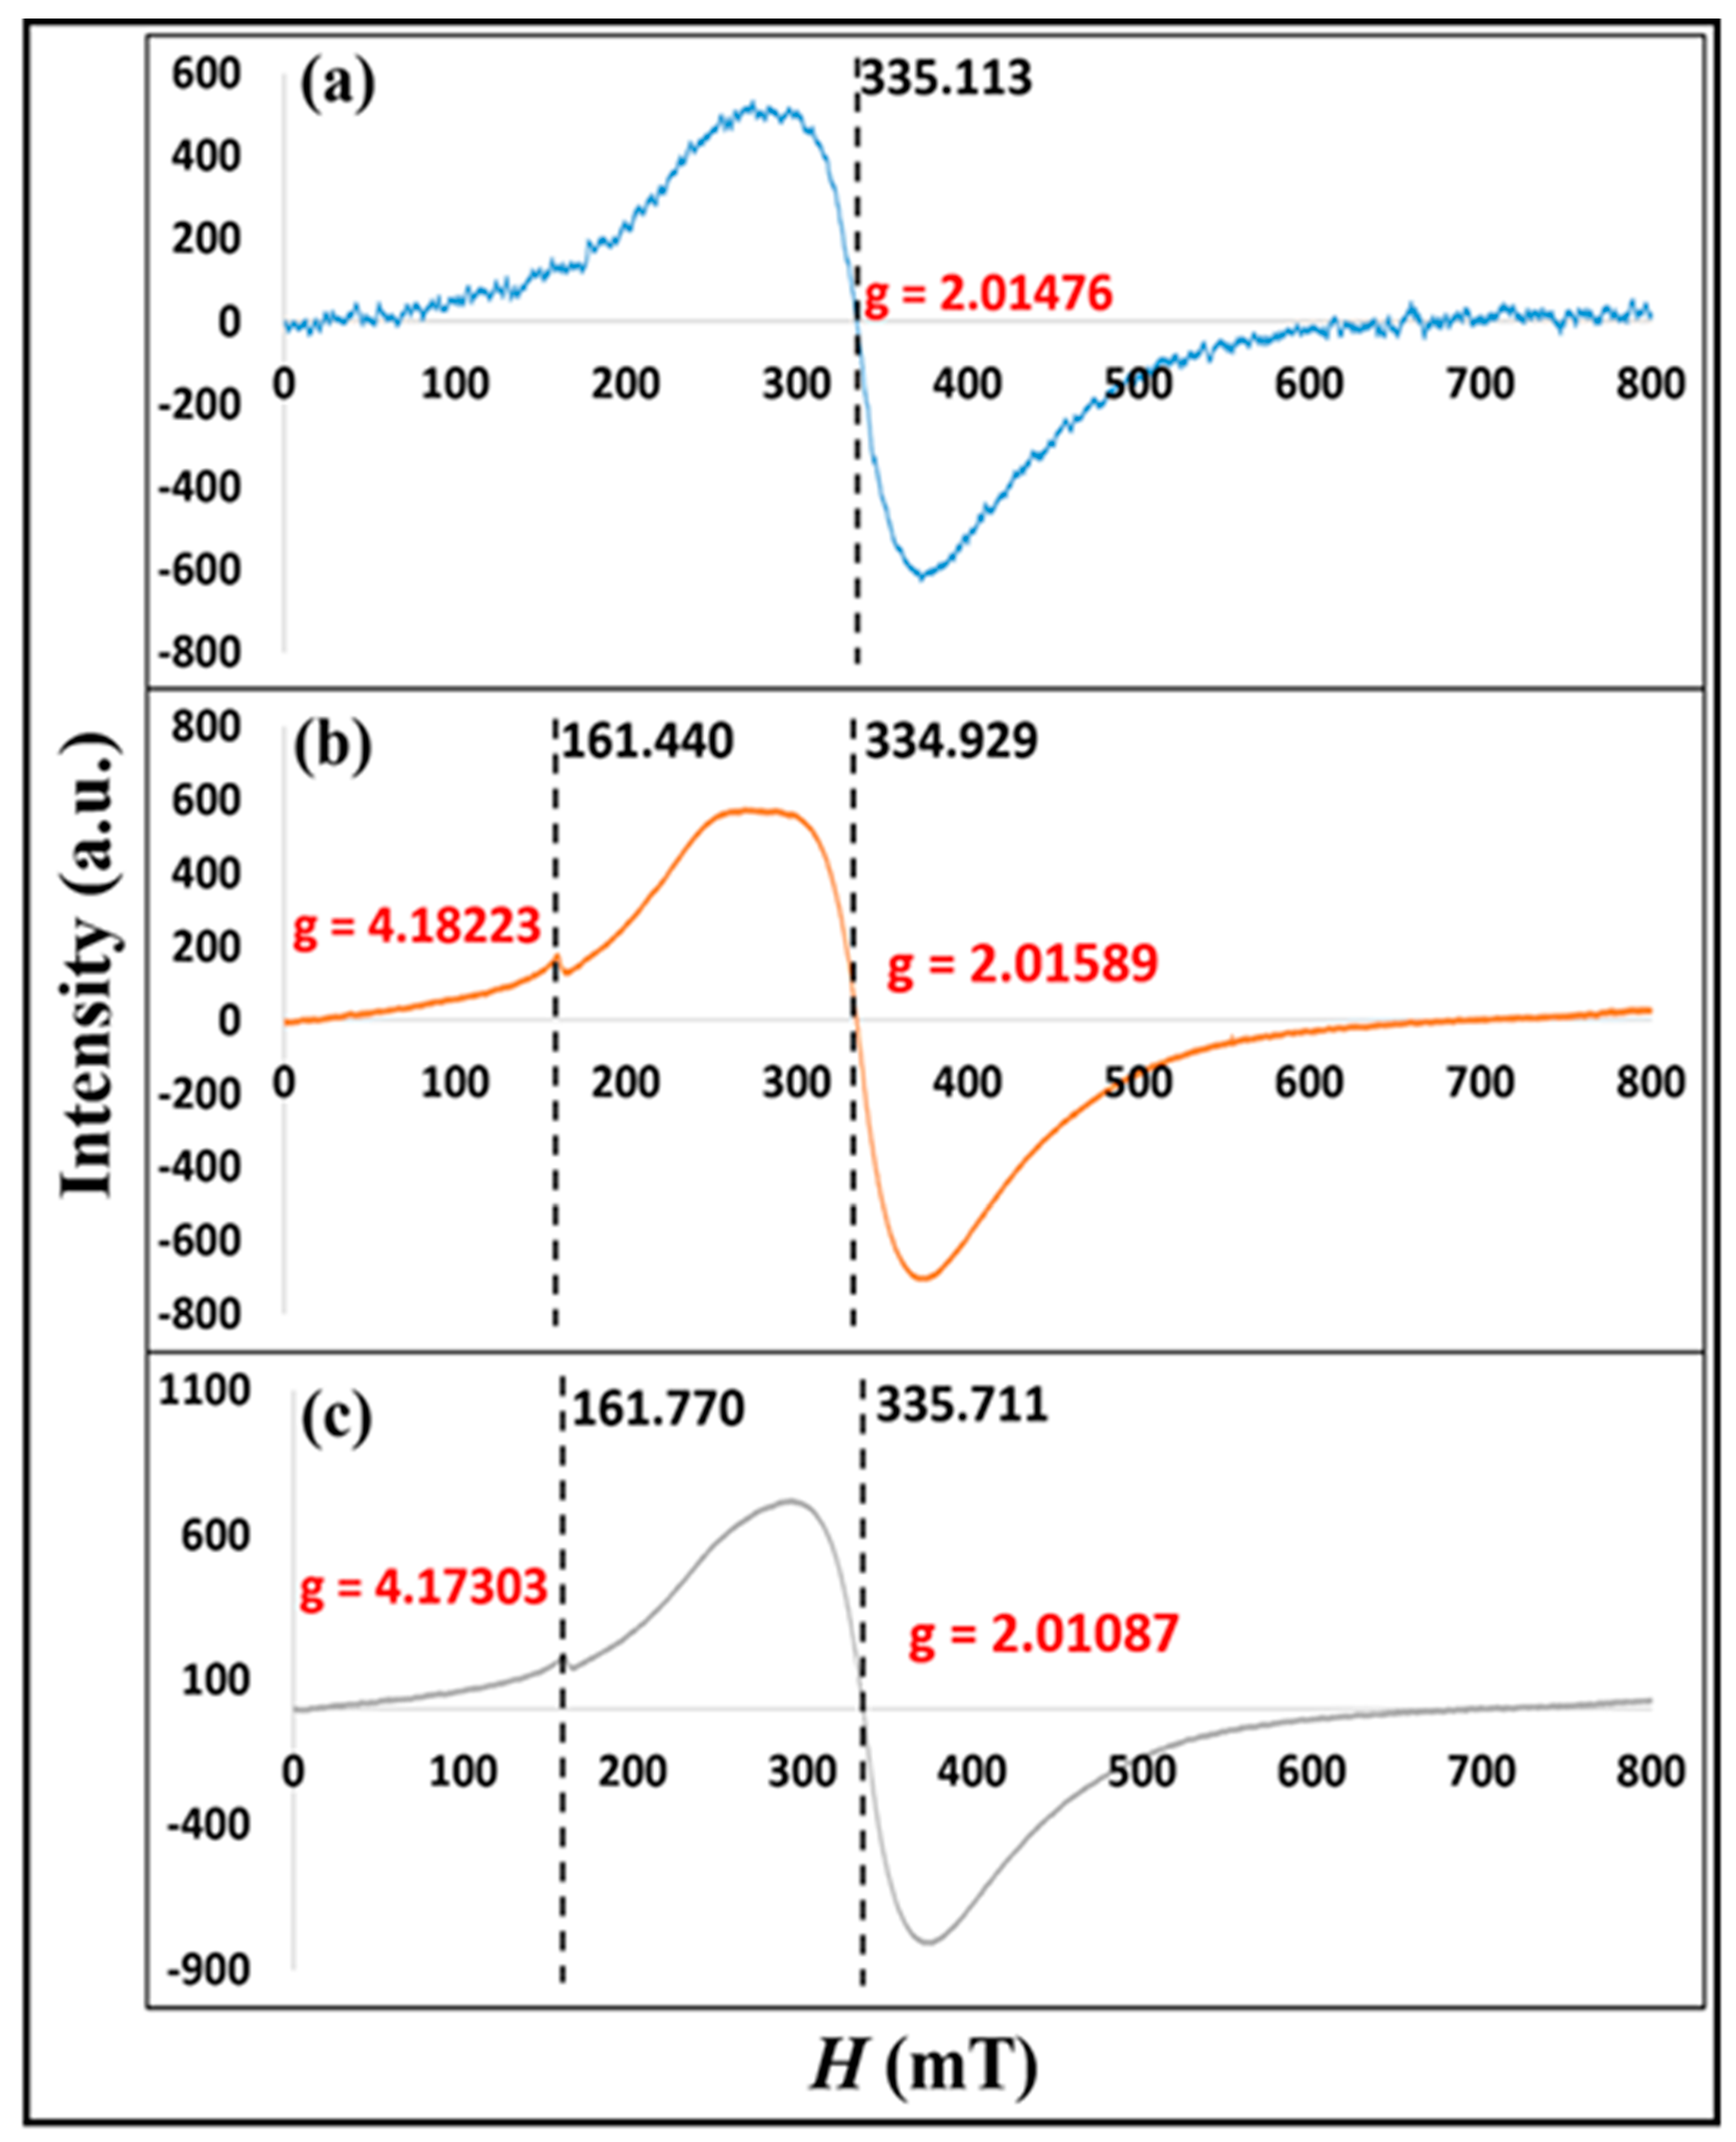
3.1.2. Electron Paramagnetic Resonance
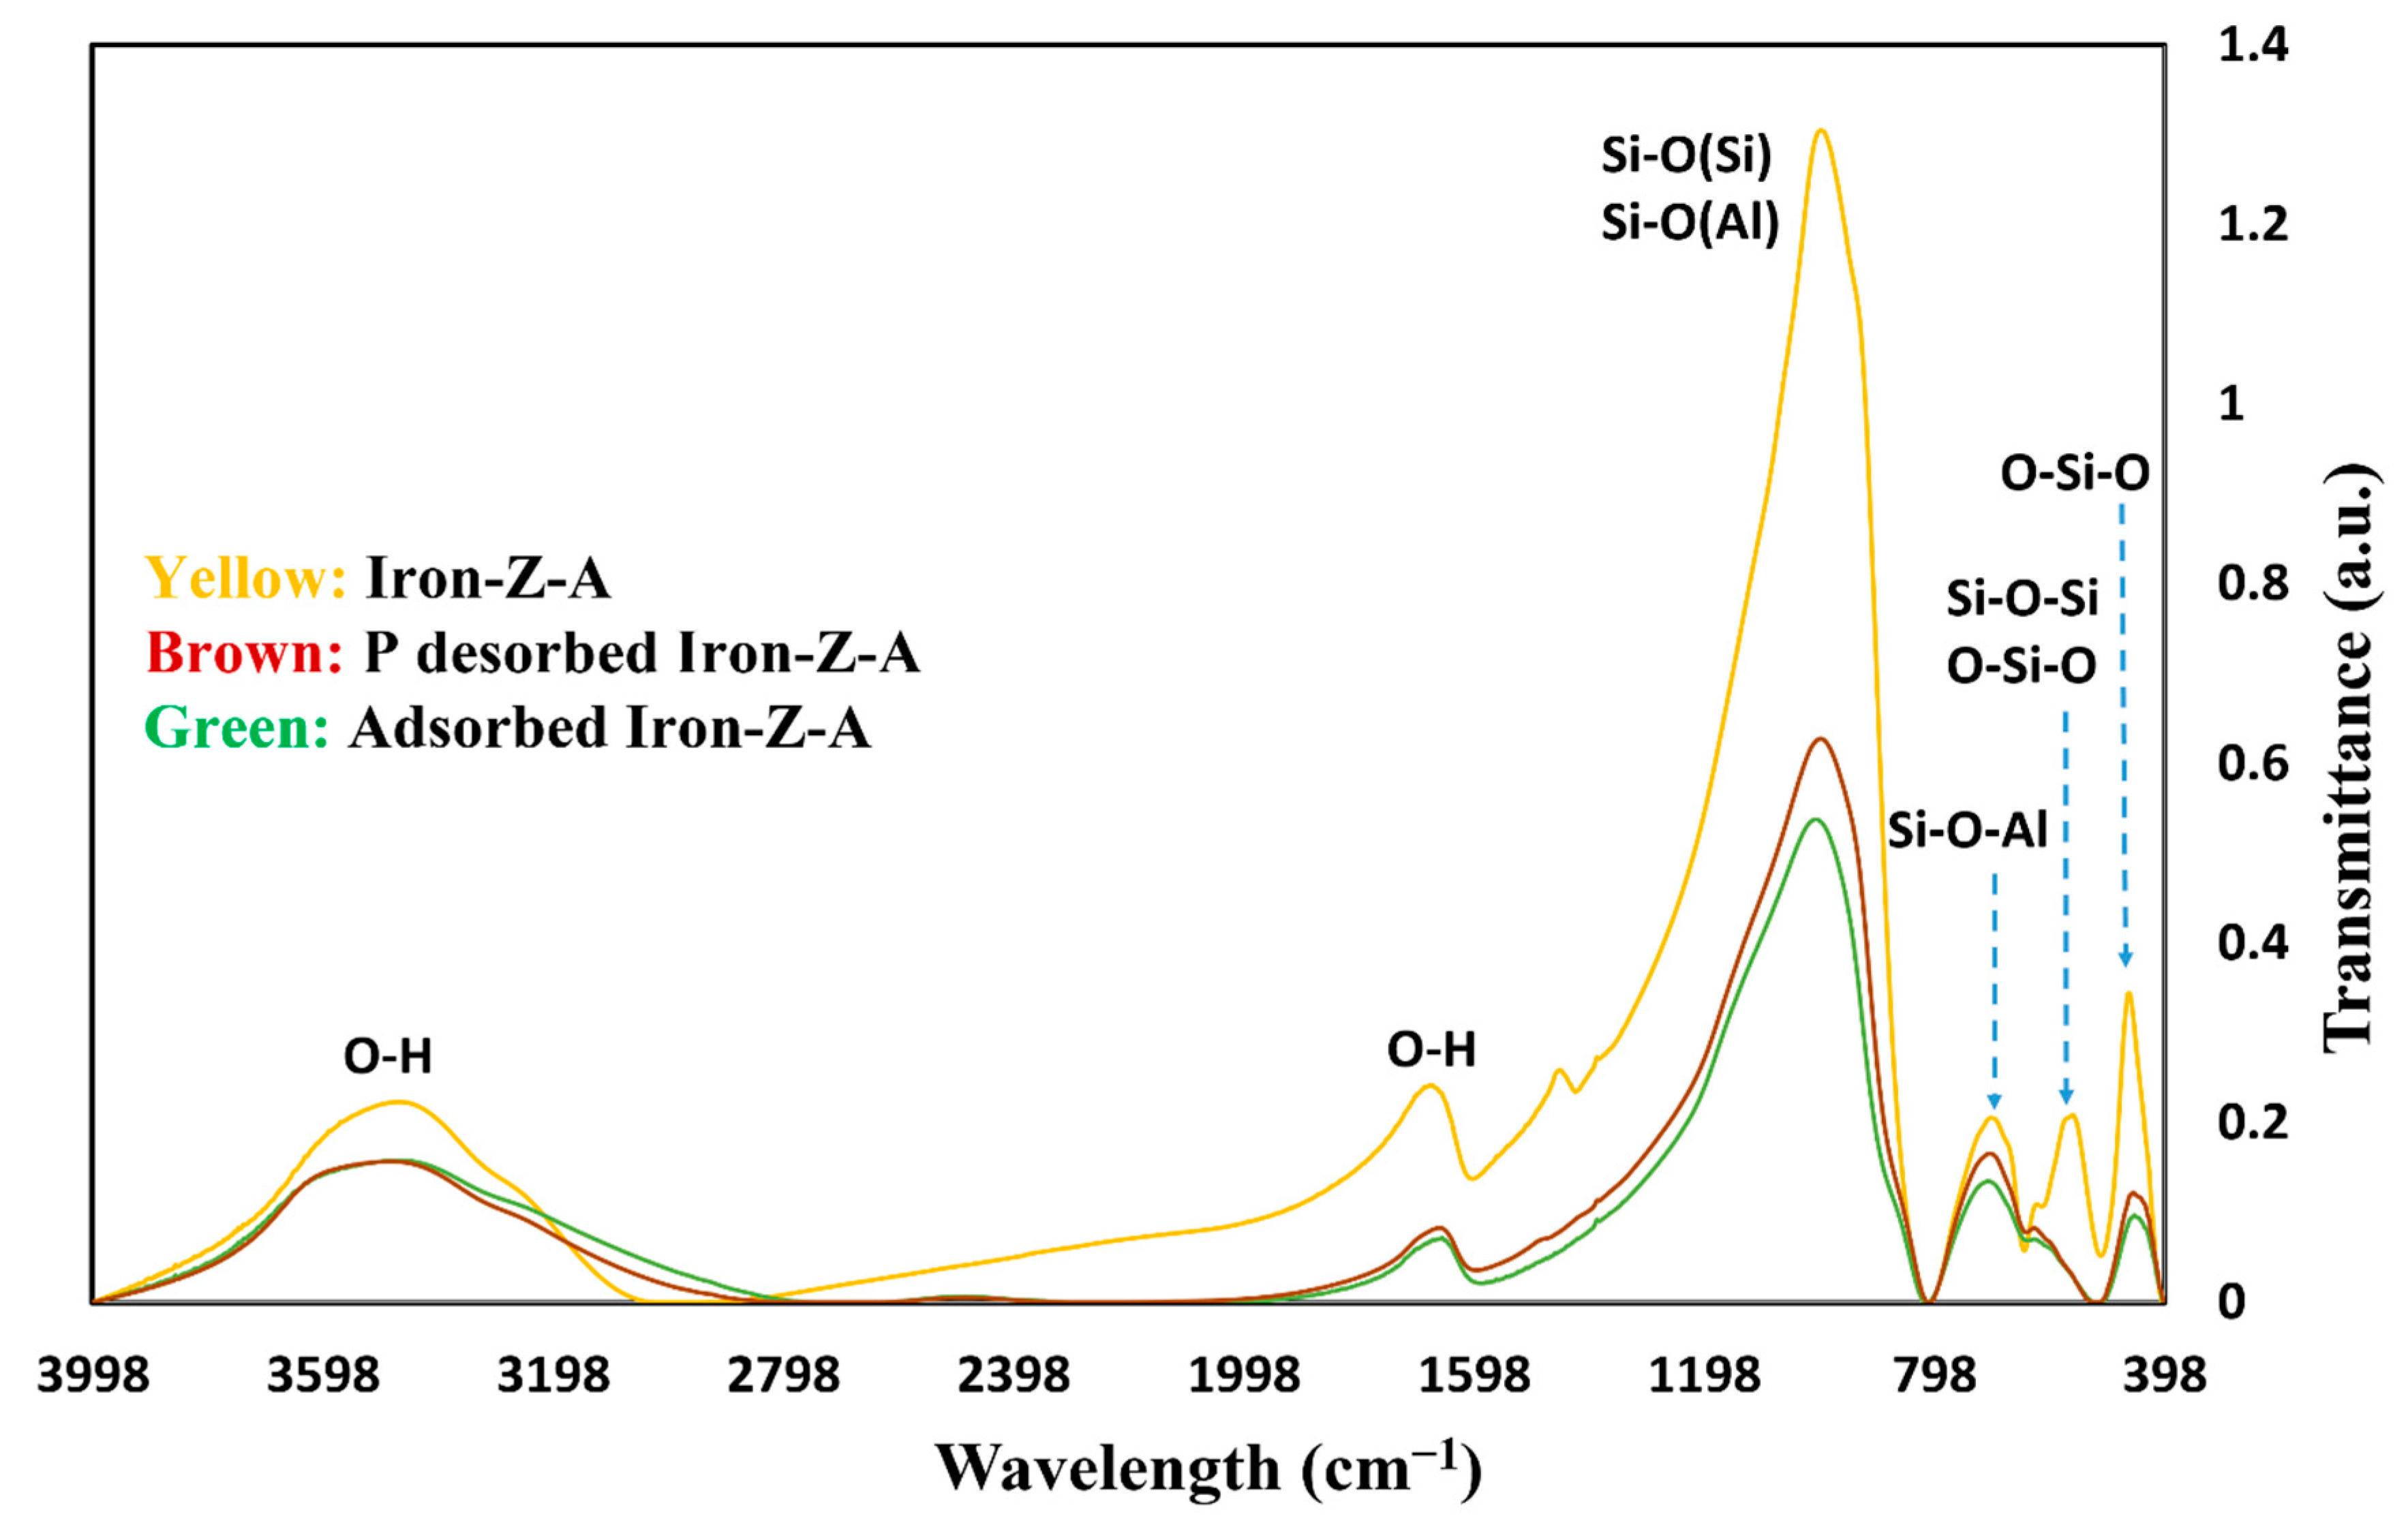
3.1.3. FT-IR Analysis Results
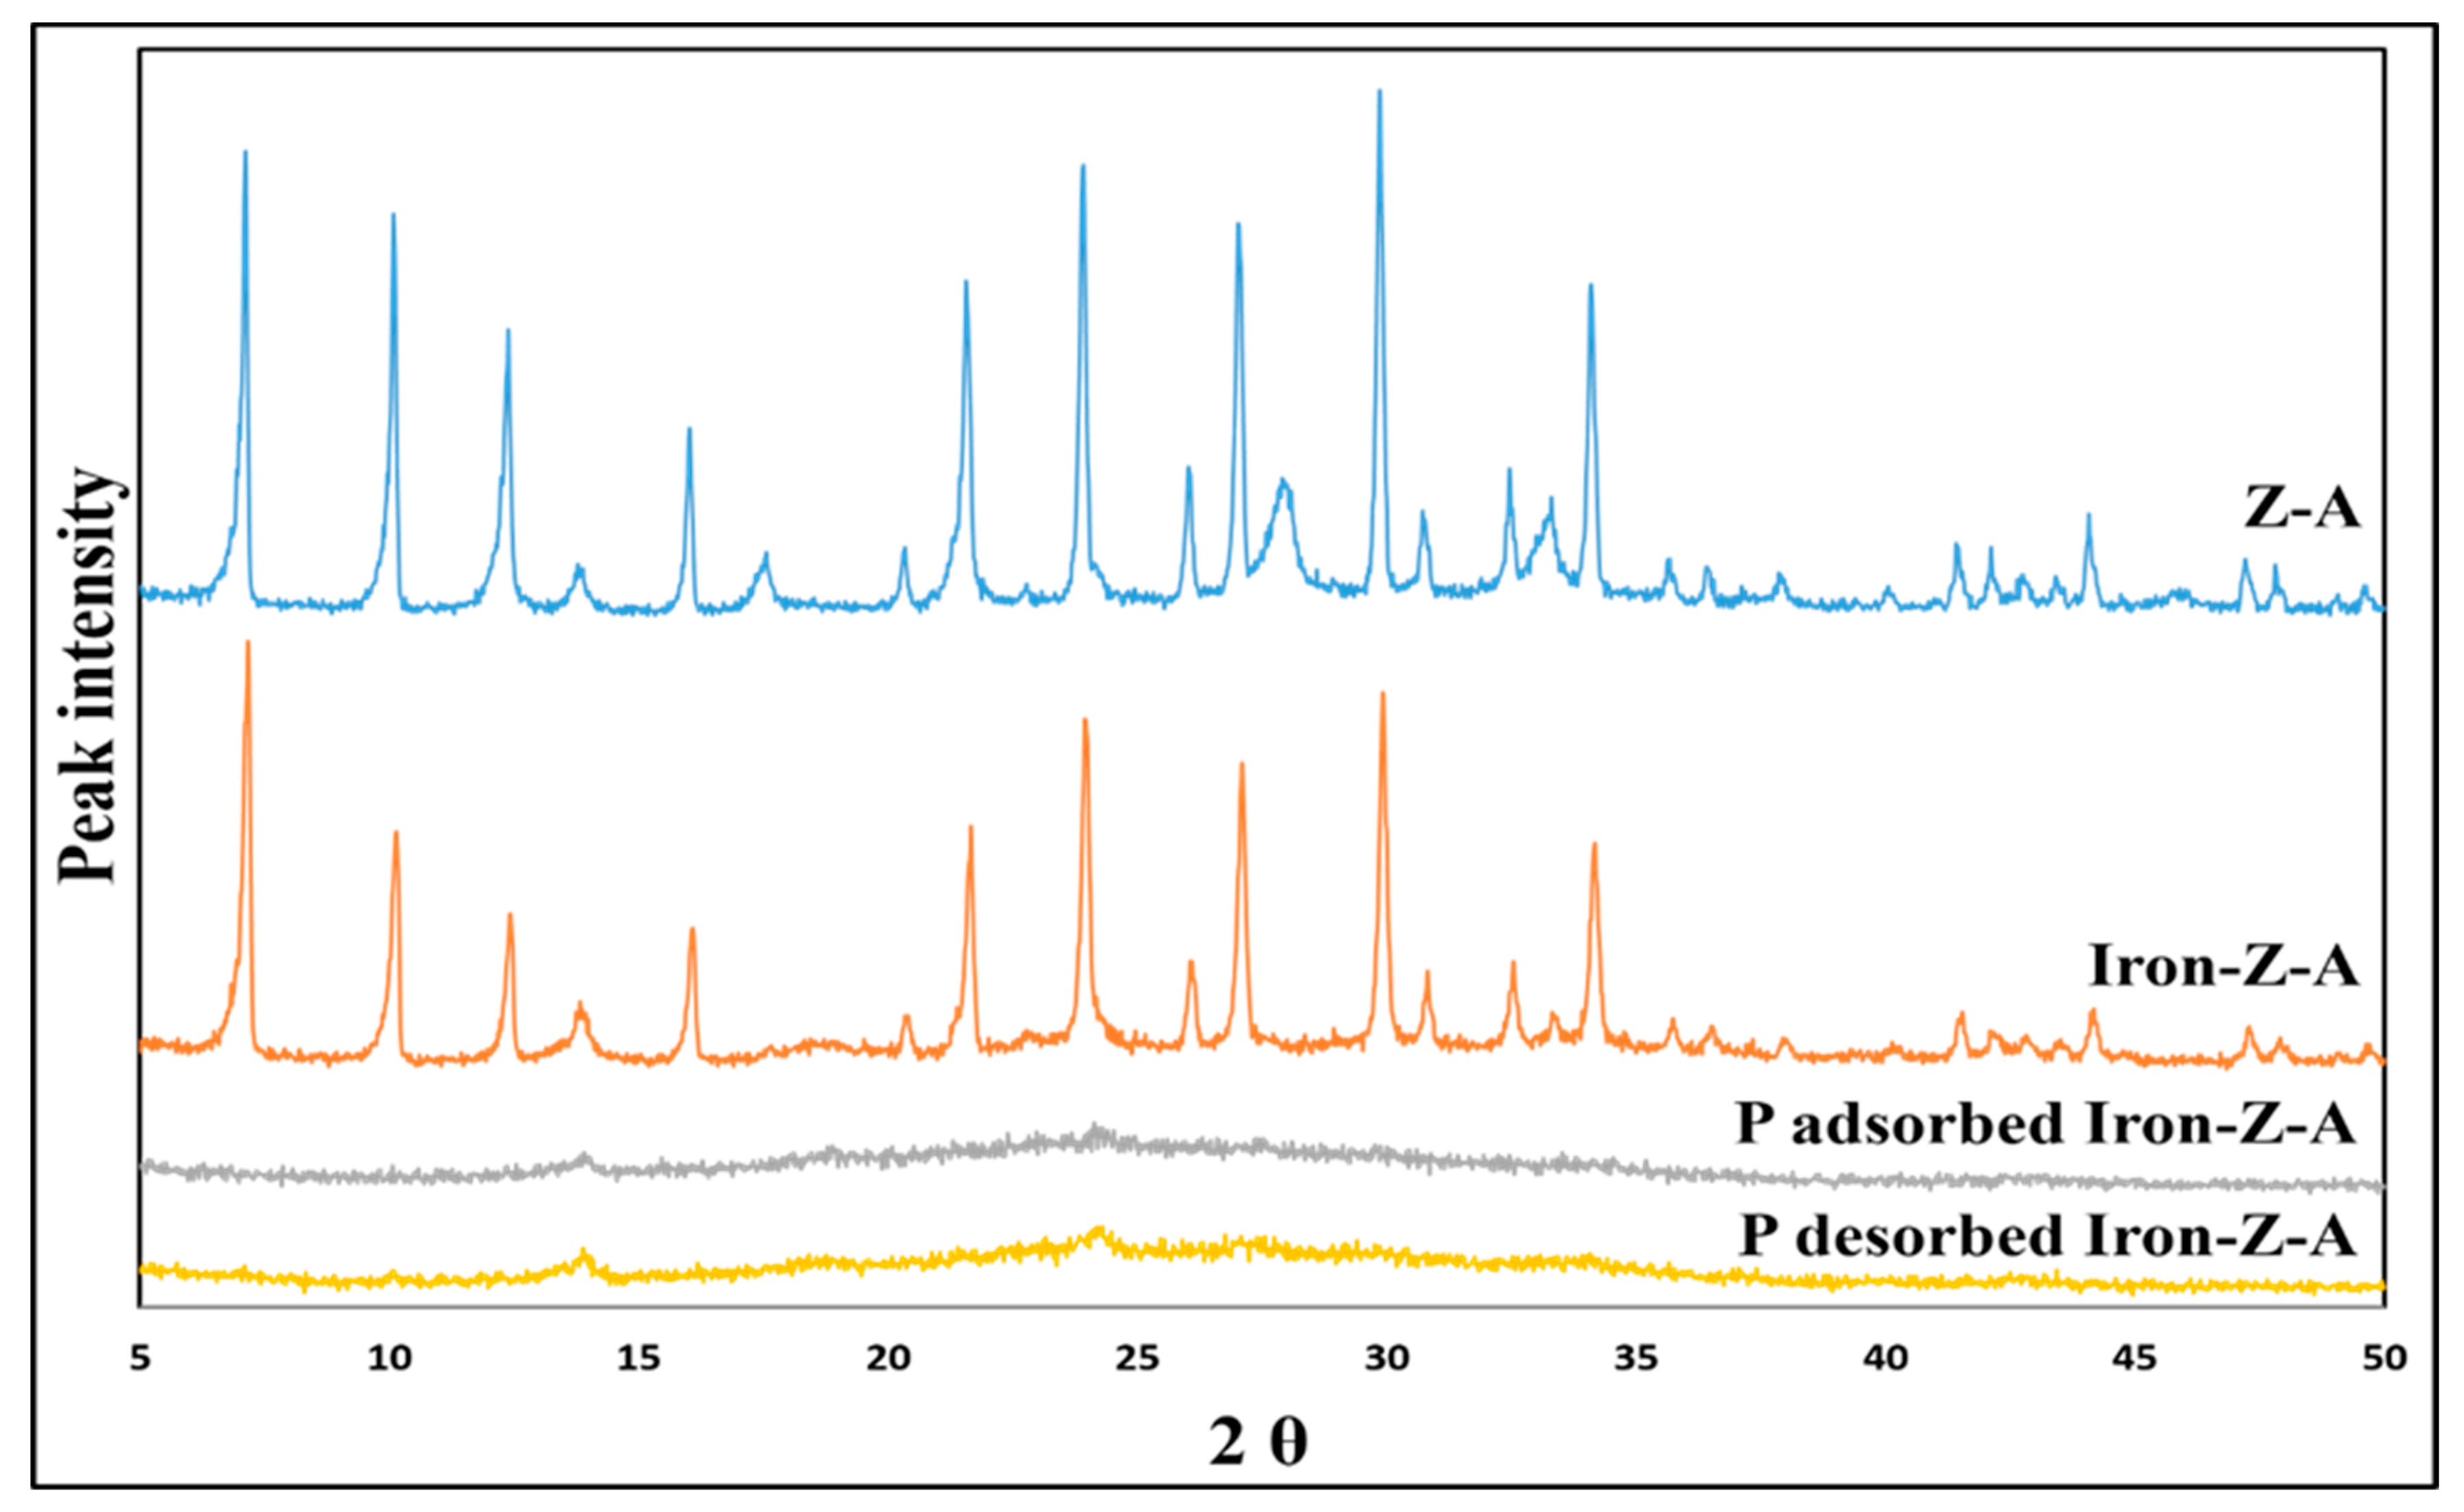
3.1.4. XRD Analysis
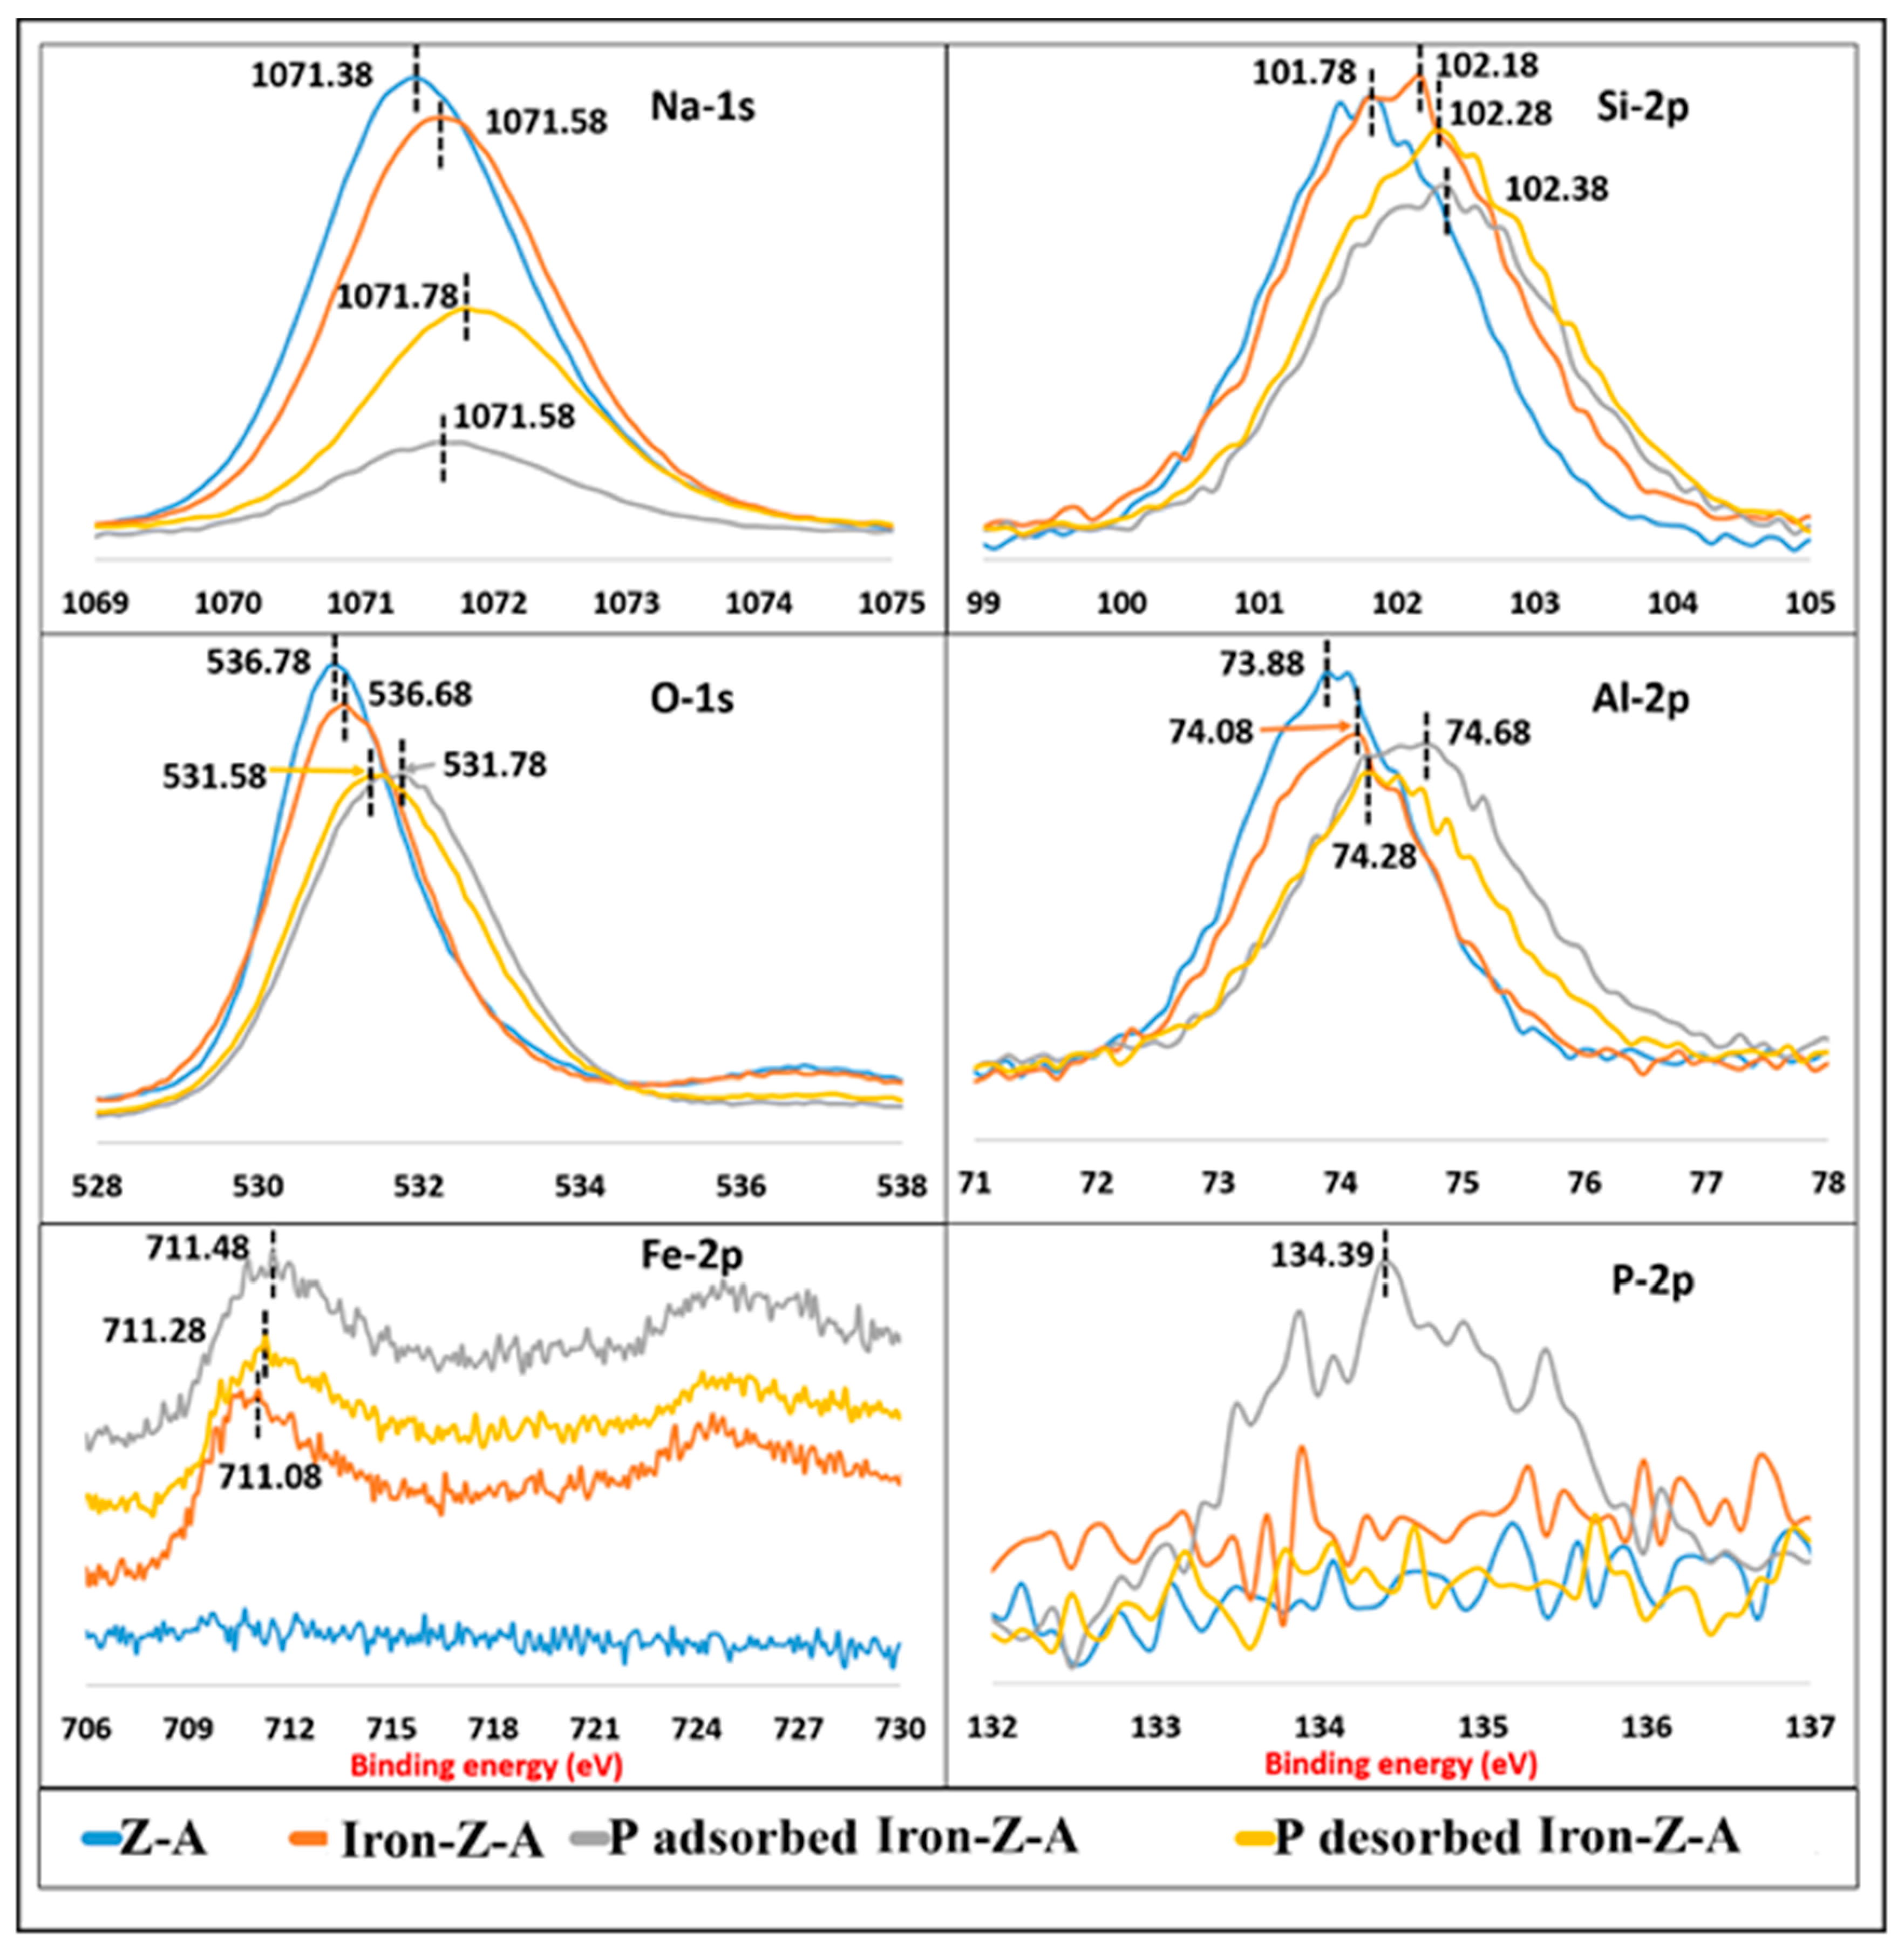
3.1.5. XPS Analysis
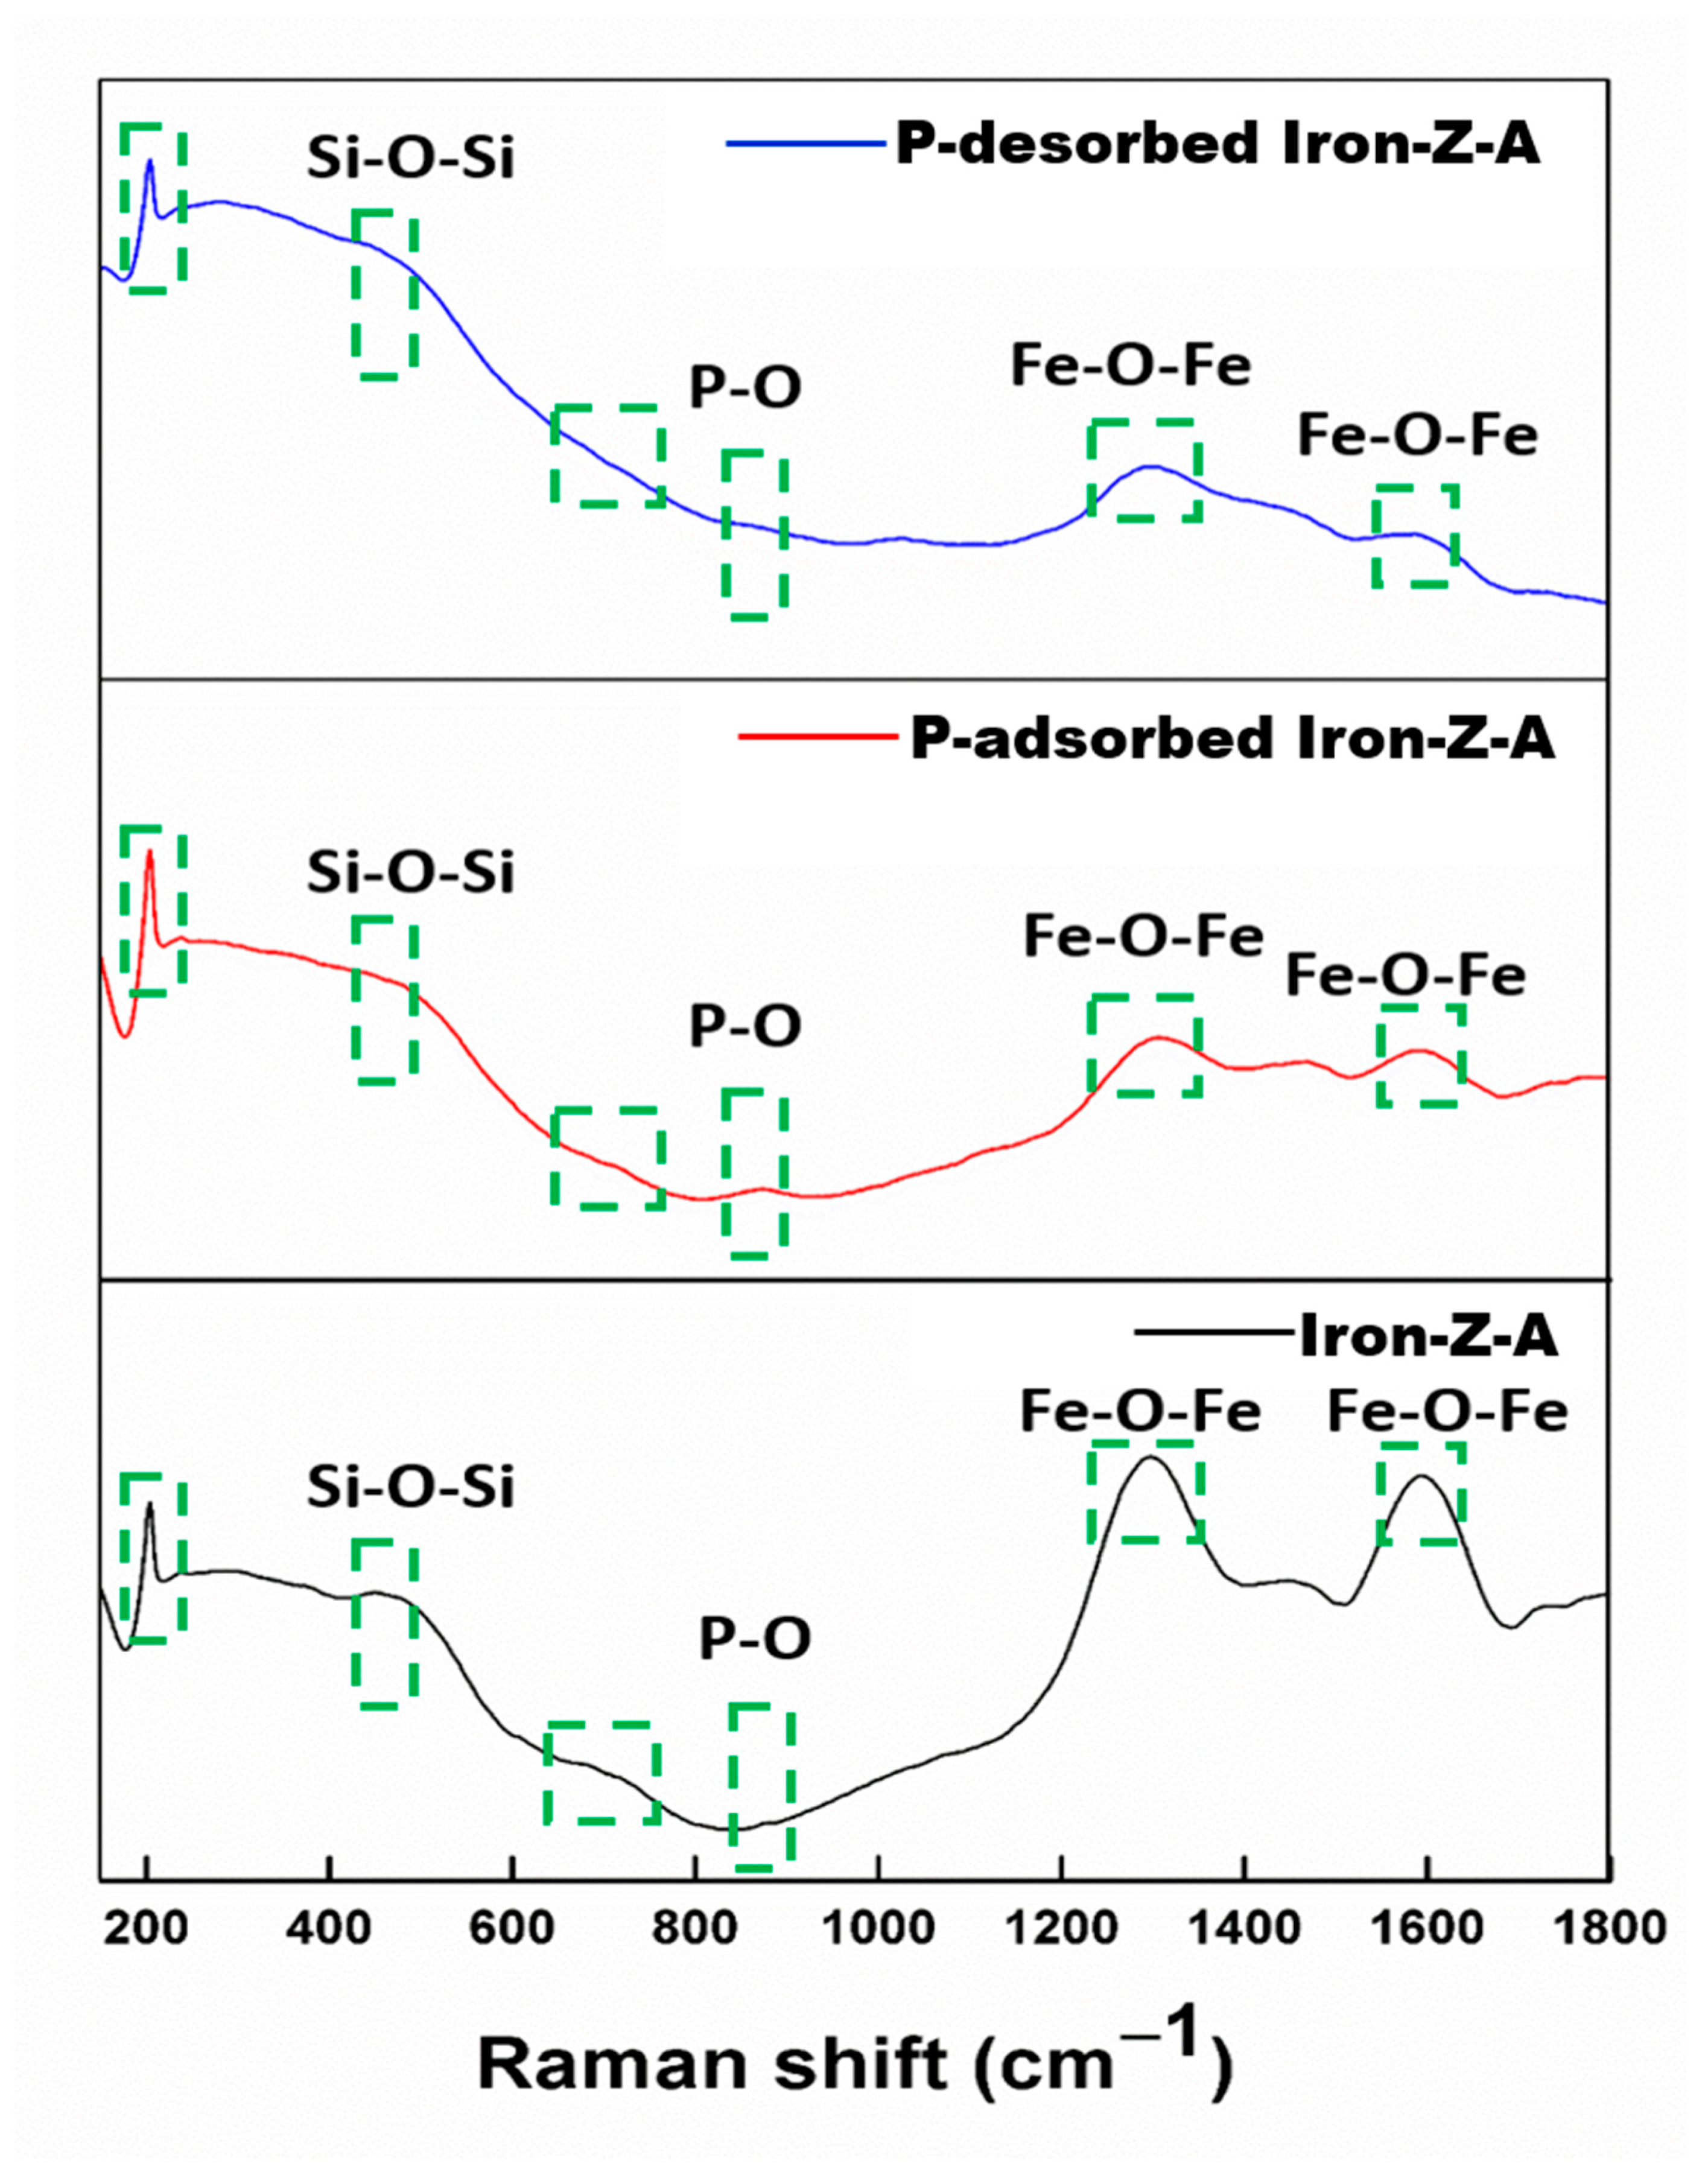
3.1.6. Raman Analysis
3.2. Study on Adsorption-Desorption and Isotherm Models
3.2.1. Adsorption-Desorption Study
3.2.2. Adsorption Isotherm Models
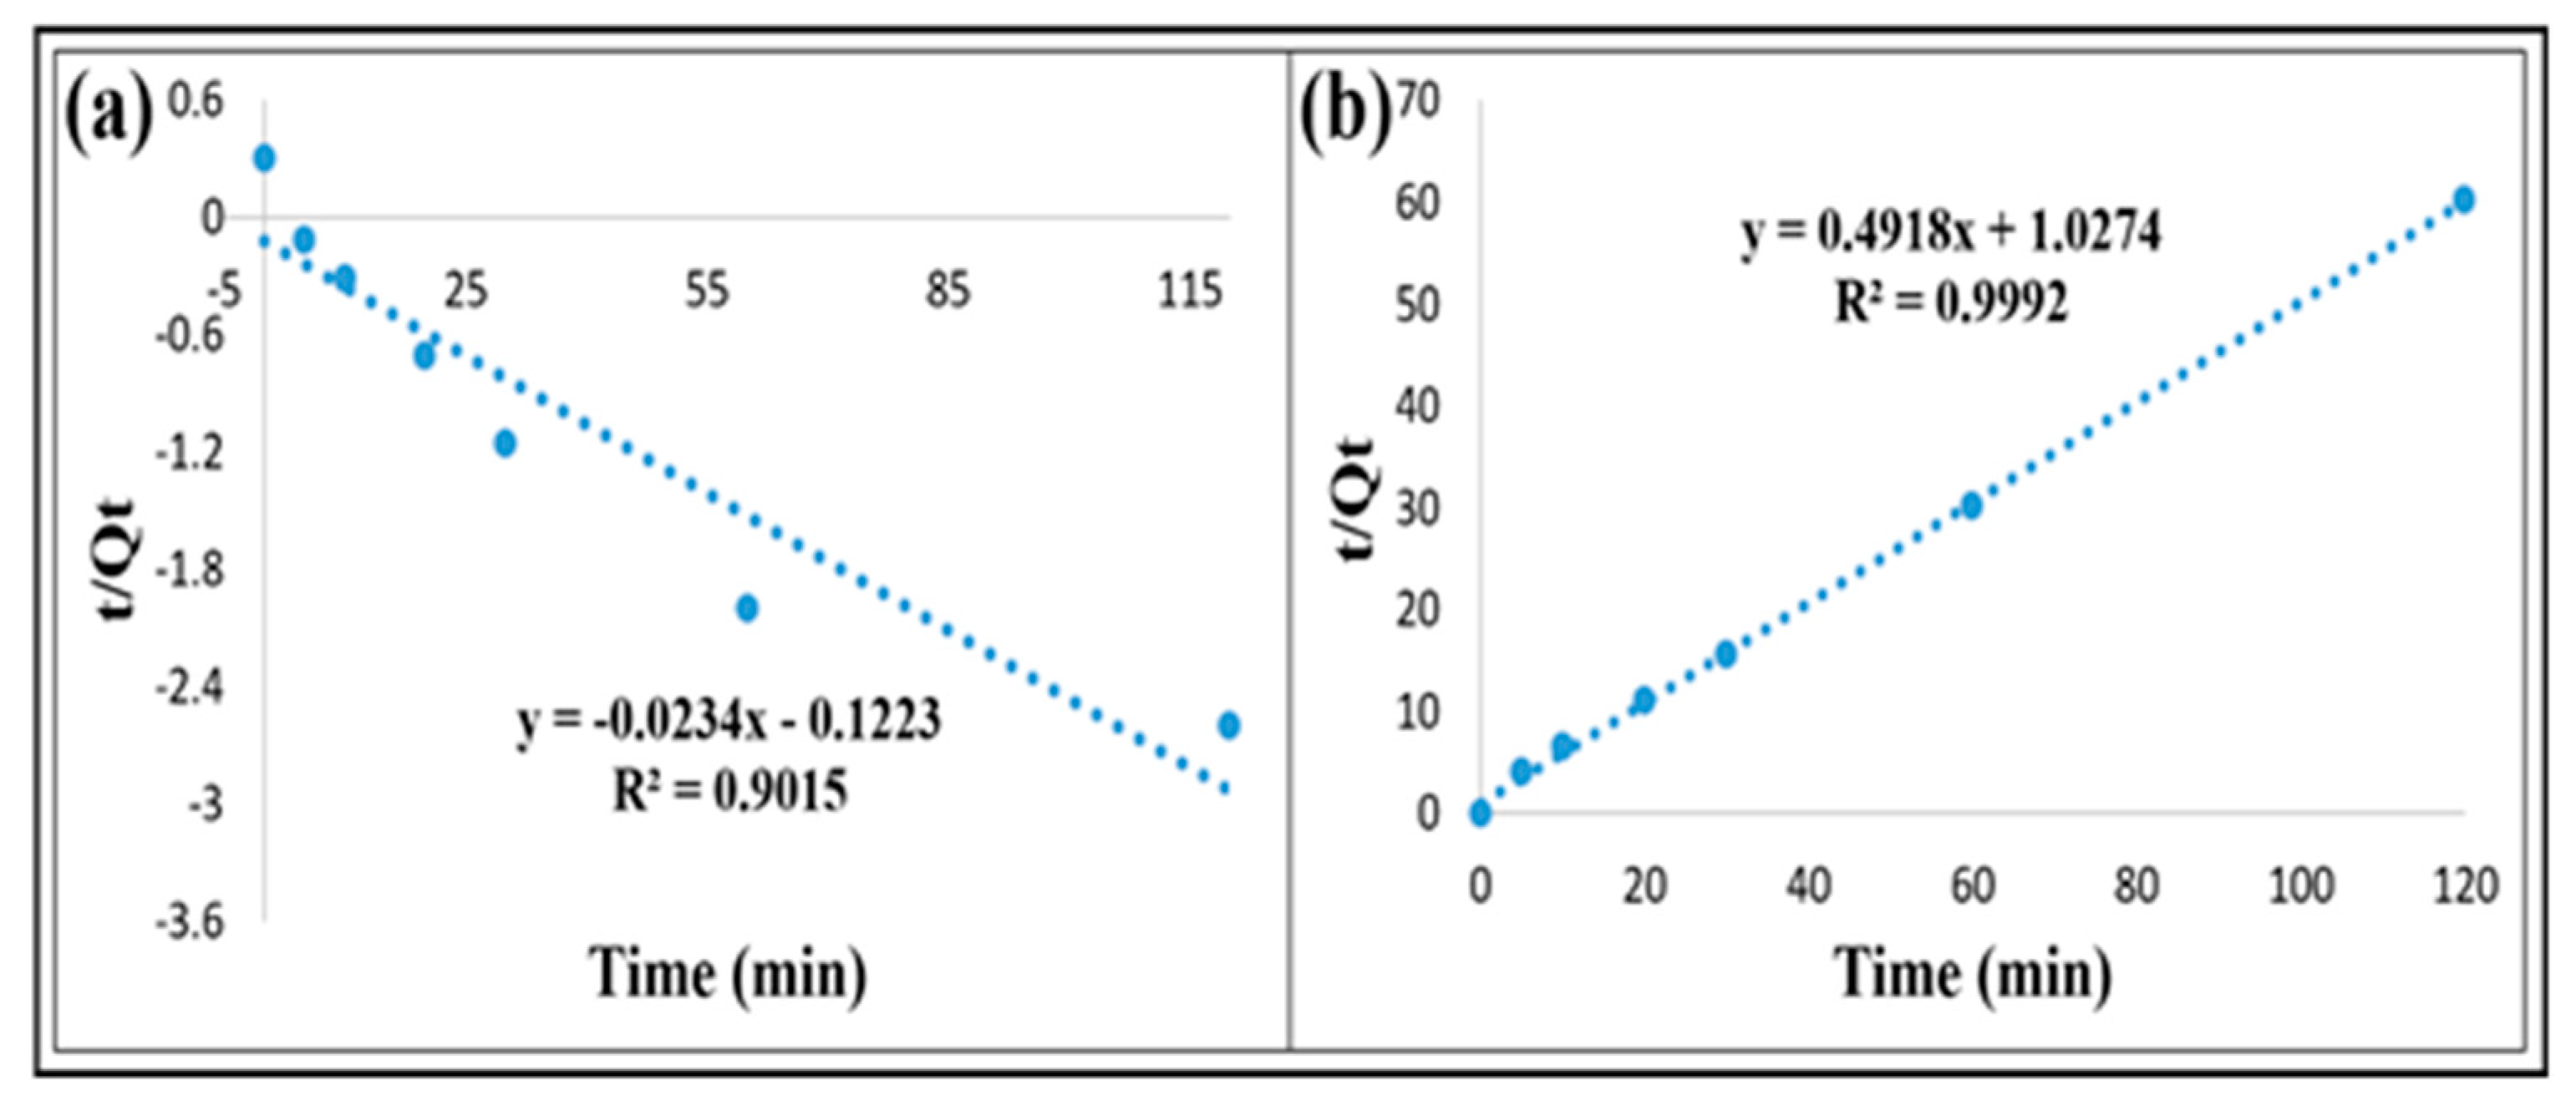
3.3. Adsorption Kinetic Study
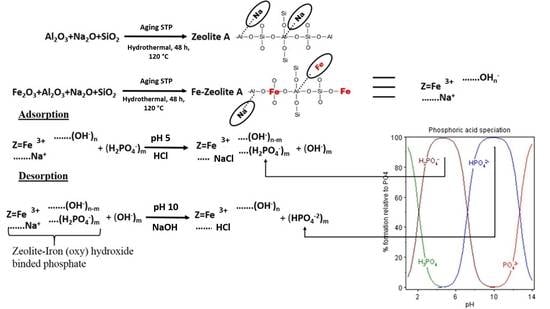
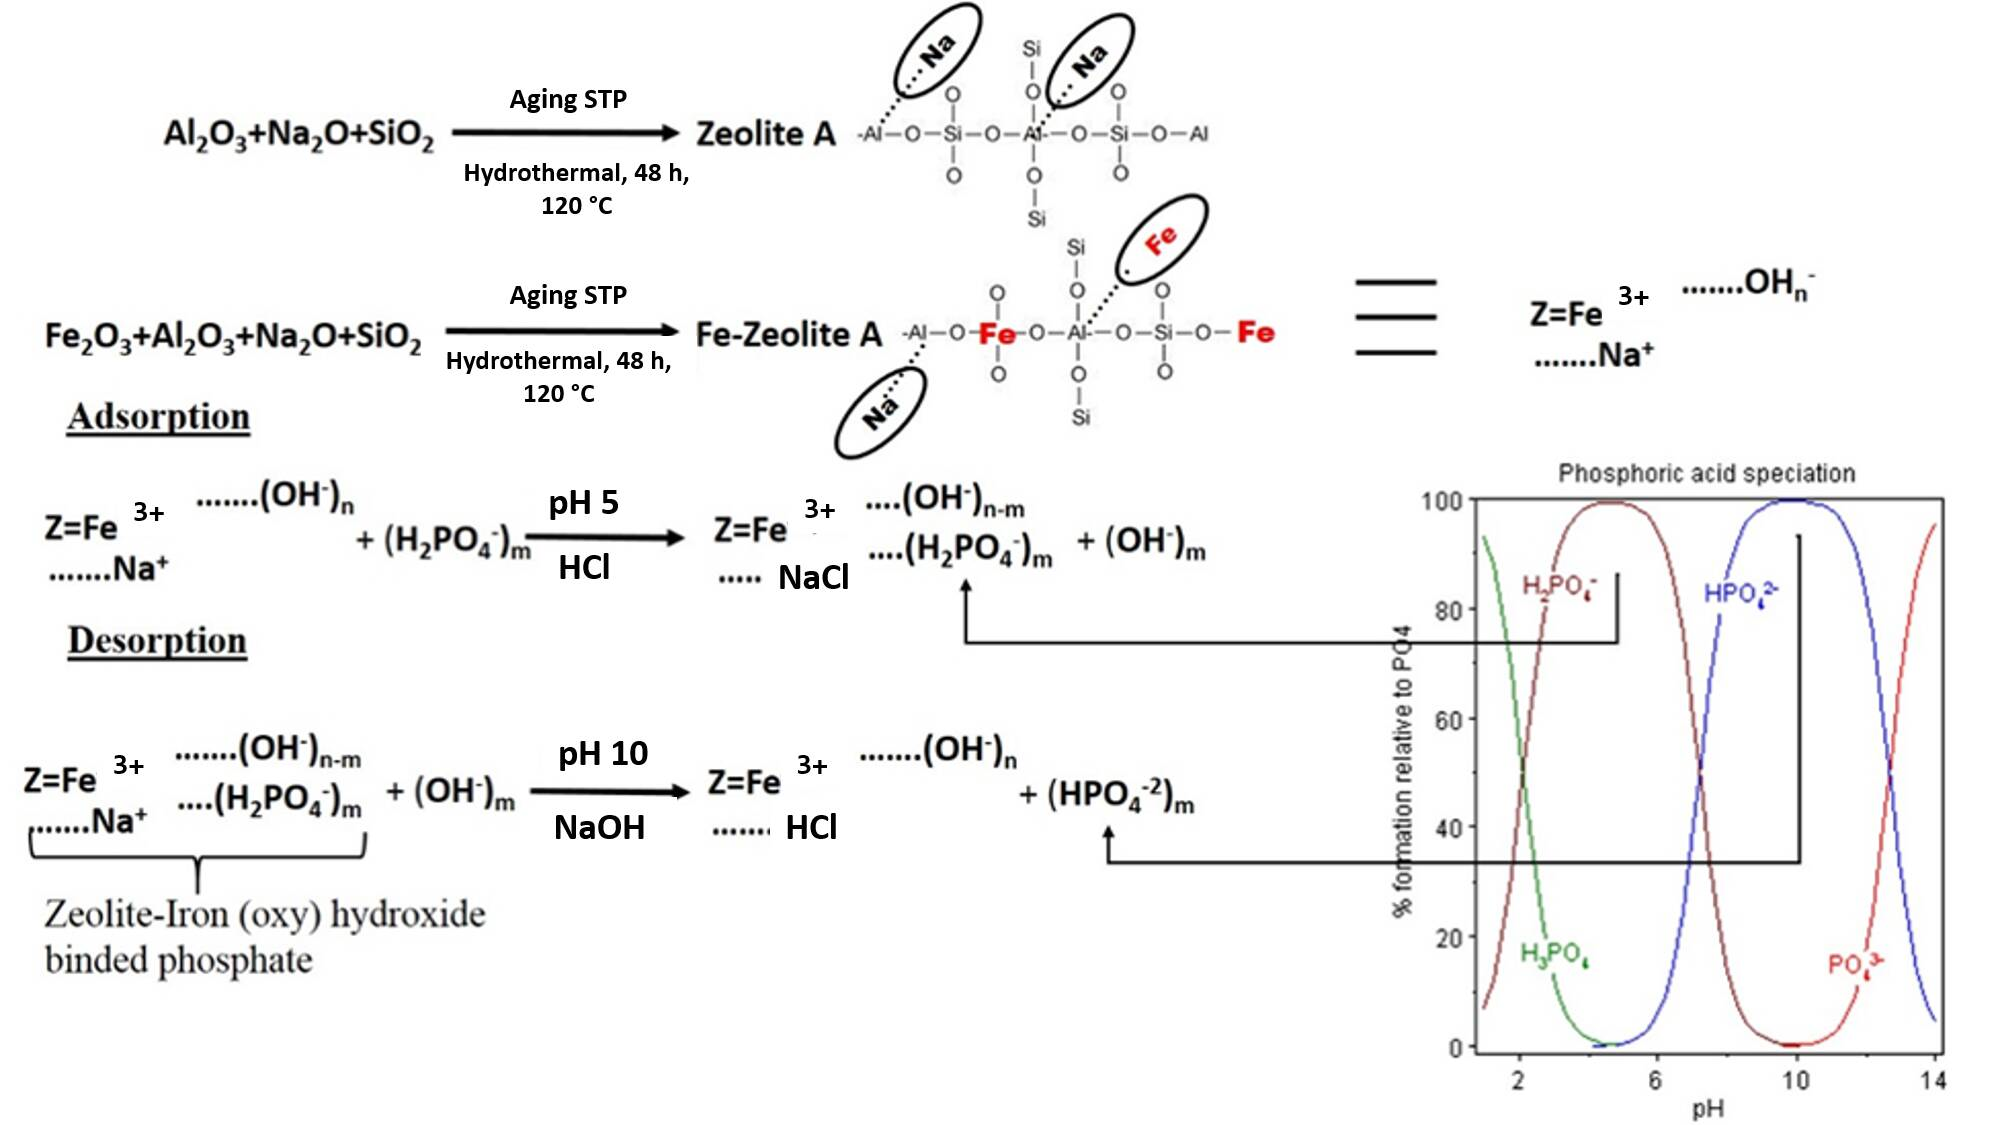
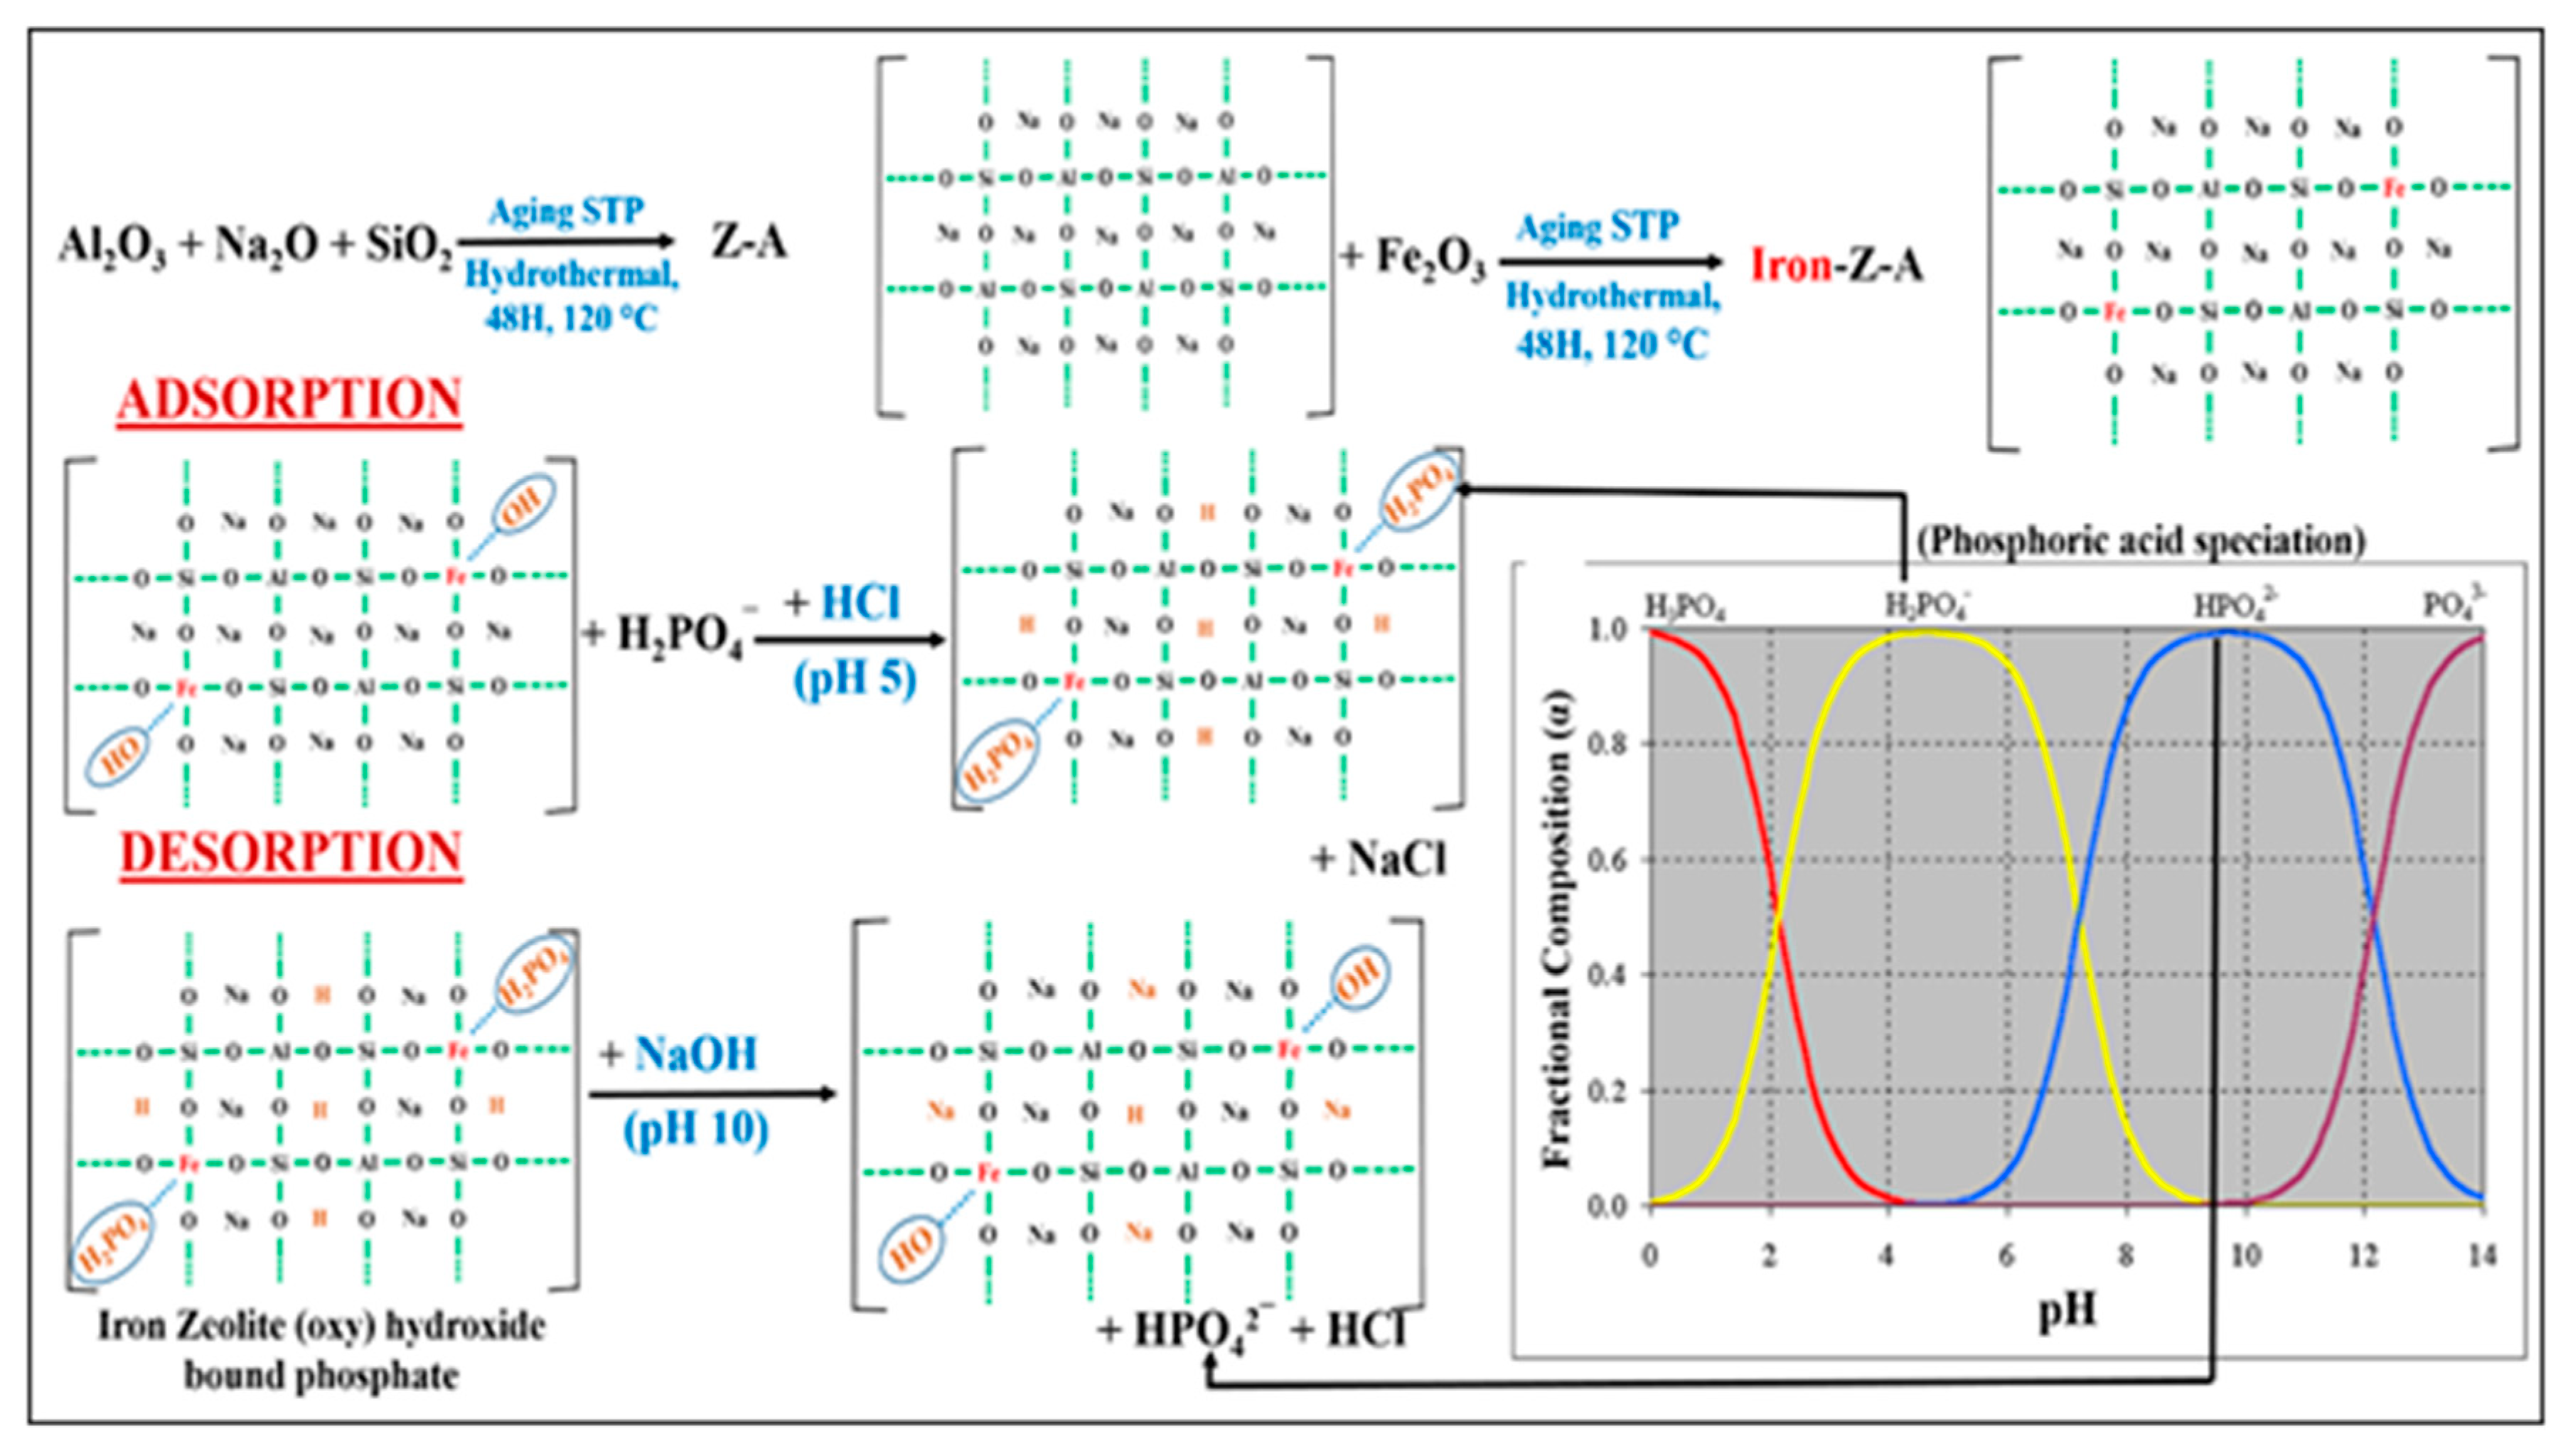
3.4. Proposed Mechanism for Adsorption and Desorption of Phosphate by Iron-Z-A
4. Conclusions
Supplementary Materials
Author Contributions
Funding
Conflicts of Interest
References
- Kralchevska, R.P.; Prucek, R.; Kolařík, J.; Tuček, J.; Machala, L.; Filip, J.; Sharma, V.K.; Zbořil, R. Remarkable efficiency of phosphate removal: Ferrate(VI)-induced in situ sorption on core-shell nanoparticles. Water Res. 2016, 103, 83–91. [Google Scholar] [CrossRef] [PubMed]
- Cooney, D.O. Adsorption Design for Wastewater Treatment; CRC Press: Boca Raton, FL, USA, 1998; ISBN 978-1-56670-333-8. [Google Scholar]
- Applications of Environmental Aquatic Chemistry: A Practical Guide, Third Edition. Available online: https://www.crcpress.com/Applications-of-Environmental-Aquatic-Chemistry-A-Practical-Guide-Third/Weiner/p/book/9781439853320 (accessed on 1 November 2019).
- Zhou, J.; Xu, Z.P.; Qiao, S.; Liu, Q.; Xu, Y.; Qian, G. Enhanced removal of triphosphate by MgCaFe-Cl-LDH: Synergism of precipitation with intercalation and surface uptake. J. Hazard. Mater. 2011, 189, 586–594. [Google Scholar] [CrossRef] [PubMed]
- Chitrakar, R.; Tezuka, S.; Sonoda, A.; Sakane, K.; Ooi, K.; Hirotsu, T. Selective adsorption of phosphate from seawater and wastewater by amorphous zirconium hydroxide. J. Colloid Interface Sci. 2006, 297, 426–433. [Google Scholar] [CrossRef] [PubMed]
- Streat, M.; Hellgardt, K.; Newton, N.L.R. Hydrous ferric oxide as an adsorbent in water treatment: Part 3: Batch and mini-column adsorption of arsenic, phosphorus, fluorine and cadmium ions. Process Saf. Environ. Prot. 2008, 86, 21–30. [Google Scholar] [CrossRef]
- Awual, M.R.; Jyo, A.; El-Safty, S.A.; Tamada, M.; Seko, N. A weak-base fibrous anion exchanger effective for rapid phosphate removal from water. J. Hazard. Mater. 2011, 188, 164–171. [Google Scholar] [CrossRef]
- Long, F.; Gong, J.-L.; Zeng, G.-M.; Chen, L.; Wang, X.-Y.; Deng, J.-H.; Niu, Q.-Y.; Zhang, H.-Y.; Zhang, X.-R. Removal of phosphate from aqueous solution by magnetic Fe–Zr binary oxide. Chem. Eng. J. 2011, 171, 448–455. [Google Scholar] [CrossRef]
- Zeng, L.; Li, X.; Liu, J. Adsorptive removal of phosphate from aqueous solutions using iron oxide tailings. Water Res. 2004, 38, 1318–1326. [Google Scholar] [CrossRef]
- Xu, Y.; Dai, Y.; Zhou, J.; Xu, Z.P.; Qian, G.; Lu, G.Q.M. Removal efficiency of arsenate and phosphate from aqueous solution using layered double hydroxide materials: intercalation vs. precipitation. J. Mater. Chem. 2010, 20, 4684–4691. [Google Scholar] [CrossRef]
- Hussain, S.; Aziz, H.A.; Isa, M.H.; Ahmad, A.; Van Leeuwen, J.; Zou, L.; Beecham, S.; Umar, M. Orthophosphate removal from domestic wastewater using limestone and granular activated carbon. Desalination 2011, 271, 265–272. [Google Scholar] [CrossRef]
- Deliyanni, E.A.; Peleka, E.N.; Lazaridis, N.K. Comparative study of phosphates removal from aqueous solutions by nanocrystalline akaganéite and hybrid surfactant-akaganéite. Sep. Purif. Technol. 2007, 52, 478–486. [Google Scholar] [CrossRef]
- Yeoman, S.; Stephenson, T.; Lester, J.N.; Perry, R. The removal of phosphorus during wastewater treatment: A review. Environ. Pollut. 1988, 49, 183–233. [Google Scholar] [CrossRef]
- Karageorgiou, K.; Paschalis, M.; Anastassakis, G.N. Removal of phosphate species from solution by adsorption onto calcite used as natural adsorbent. J. Hazard. Mater. 2007, 139, 447–452. [Google Scholar] [CrossRef] [PubMed]
- Wei, W.; Du, J.; Li, J.; Yan, M.; Zhu, Q.; Jin, X.; Zhu, X.; Hu, Z.; Tang, Y.; Lu, Y. Construction of robust enzyme nanocapsules for effective organophosphate decontamination, detoxification, and protection. Adv. Mater. Weinheim 2013, 25, 2212–2218. [Google Scholar] [CrossRef] [PubMed]
- Samet, Y.; Agengui, L.; Abdelhédi, R. Electrochemical degradation of chlorpyrifos pesticide in aqueous solutions by anodic oxidation at boron-doped diamond electrodes. Chem. Eng. J. 2010, 161, 167–172. [Google Scholar] [CrossRef]
- Johnson, B.J.; Malanoski, A.P.; Leska, I.A.; Melde, B.J.; Taft, J.R.; Dinderman, M.A.; Deschamps, J.R. Adsorption of organophosphates from solution by porous organosilicates: Capillary phase-separation. Microporous Mesoporous Mater. 2014, 195, 154–160. [Google Scholar] [CrossRef]
- Huo, S.-H.; Yan, X.-P. Metal–organic framework MIL-100(Fe) for the adsorption of malachite green from aqueous solution. J. Mater. Chem. 2012, 22, 7449–7455. [Google Scholar] [CrossRef]
- Ahmad, A.; Mohd-Setapar, S.H.; Chuong, C.S.; Khatoon, A.; Wani, W.A.; Kumar, R.; Rafatullah, M. Recent advances in new generation dye removal technologies: novel search for approaches to reprocess wastewater. RSC Adv. 2015, 5, 30801–30818. [Google Scholar] [CrossRef]
- Gupta, V.K.; Gupta, B.; Rastogi, A.; Agarwal, S.; Nayak, A. A comparative investigation on adsorption performances of mesoporous activated carbon prepared from waste rubber tire and activated carbon for a hazardous azo dye—Acid Blue 113. J. Hazard. Mater. 2011, 186, 891–901. [Google Scholar] [CrossRef]
- Gupta, V.K.; Gupta, B.; Rastogi, A.; Agarwal, S.; Nayak, A. Pesticides removal from waste water by activated carbon prepared from waste rubber tire. Water Research 2011, 45, 4047–4055. [Google Scholar] [CrossRef]
- Wang, X.; Dai, S. A simple method to ordered mesoporous carbons containing nickel nanoparticles. Adsorption 2009, 15, 138–144. [Google Scholar] [CrossRef]
- Yen, C.-W.; Lin, M.-L.; Wang, A.; Chen, S.-A.; Chen, J.-M.; Mou, C.-Y. CO Oxidation Catalyzed by Au−Ag Bimetallic Nanoparticles Supported in Mesoporous Silica. J. Phys. Chem. C 2009, 113, 17831–17839. [Google Scholar] [CrossRef]
- Lu, S.G.; Bai, S.Q.; Zhu, L.; Shan, H.D. Removal mechanism of phosphate from aqueous solution by fly ash. J. Hazard. Mater. 2009, 161, 95–101. [Google Scholar] [CrossRef] [PubMed]
- Babatunde, A.O.; Zhao, Y.Q. Equilibrium and kinetic analysis of phosphorus adsorption from aqueous solution using waste alum sludge. J. Hazard. Mater. 2010, 184, 746–752. [Google Scholar] [CrossRef] [PubMed]
- Loganathan, P.; Vigneswaran, S.; Kandasamy, J.; Bolan, N.S. Removal and Recovery of Phosphate From Water Using Sorption. Crit. Rev. Environ. Sci. Technol. 2014, 44, 847–907. [Google Scholar] [CrossRef]
- Xue, Y.; Hou, H.; Zhu, S. Characteristics and mechanisms of phosphate adsorption onto basic oxygen furnace slag. J. Hazard. Mater. 2009, 162, 973–980. [Google Scholar] [CrossRef]
- Li, Y.; Liu, C.; Luan, Z.; Peng, X.; Zhu, C.; Chen, Z.; Zhang, Z.; Fan, J.; Jia, Z. Phosphate removal from aqueous solutions using raw and activated red mud and fly ash. J. Hazard. Mater. 2006, 137, 374–383. [Google Scholar] [CrossRef]
- Mahmudov, R.; Huang, C.P. Selective adsorption of oxyanions on activated carbon exemplified by Filtrasorb 400 (F400). Sep. Purif. Technol. 2011, 77, 294–300. [Google Scholar] [CrossRef]
- Wang, J.; Zhang, Y.; Feng, C.; Li, J.; Li, G. Adsorption Capacity for Phosphorus Comparison among Activated Alumina, Silica Sand and Anthracite Coal. J. Water Resour. Prot. 2009, 4, 260–264. [Google Scholar] [CrossRef]
- Database of Zeolite Structures. Available online: http://www.iza-structure.org/databases/ (accessed on 1 November 2019).
- Dana Classification. Available online: http://www.webmineral.com/danaclass.shtml#.XbsfpJozaM8 (accessed on 1 November 2019).
- Rashed, M.N.; Palanisamy, P.N. Zeolites and Their Applications; IntechOpen: London, UK, 2018; ISBN 978-1-78923-343-8. [Google Scholar]
- Ismail, A.A.; Mohamed, R.M.; Ibrahim, I.A.; Kini, G.; Koopman, B. Synthesis, optimization and characterization of zeolite A and its ion-exchange properties. Colloids Surf. A Physicochem. Eng. Asp. 2010, 366, 80–87. [Google Scholar] [CrossRef]
- Jiang, C.; Jia, L.; He, Y.; Zhang, B.; Kirumba, G.; Xie, J. Adsorptive removal of phosphorus from aqueous solution using sponge iron and zeolite. J. Colloid Interface Sci. 2013, 402, 246–252. [Google Scholar] [CrossRef]
- Guo, C.; Stabnikov, V.; Kuang, S.; Ivanov, V. The removal of phosphate from wastewater using anoxic reduction of iron ore in the rotating reactor. Biochem. Eng. J. 2009, 46, 223–226. [Google Scholar] [CrossRef]
- Chitrakar, R.; Tezuka, S.; Sonoda, A.; Sakane, K.; Ooi, K.; Hirotsu, T. Phosphate adsorption on synthetic goethite and akaganeite. J. Colloid Interface Sci. 2006, 298, 602–608. [Google Scholar] [CrossRef]
- Cordray, A. Phosphorus Removal Characteristics on Biogenic Ferrous Iron Oxides. Ph.D. Thesis, Washington State University, Pullman, WA, USA, 2008. [Google Scholar]
- Aziz, A.; Kim, S.; Kim, K.S. Fe/ZSM-5 zeolites for organic-pollutant removal in the gas phase: Effect of the iron source and loading. J. Environ. Chem. Eng. 2016, 4, 3033–3040. [Google Scholar] [CrossRef]
- Ning, P.; Bart, H.-J.; Li, B.; Lu, X.; Zhang, Y. Phosphate removal from wastewater by model-La(III) zeolite adsorbents. J. Environ. Sci. 2008, 20, 670–674. [Google Scholar] [CrossRef]
- Tran, T. Standard Methods For the Examination of Water and Wastewater, 23nd ed.; American Public Health Association: National Harbor, MD, USA, 2017. [Google Scholar]
- Synthesis of Iron-loaded Zeolites for Removal of Ammonium and Phosphate from Aqueous Solutions. Available online: http://eeer.org/journal/view.php?number=599 (accessed on 1 November 2019).
- Vimonses, V.; Lei, S.; Jin, B.; Chow, C.W.K.; Saint, C. Kinetic study and equilibrium isotherm analysis of Congo Red adsorption by clay materials. Chem. Eng. J. 2009, 148, 354–364. [Google Scholar] [CrossRef]
- Khamizov, R.K.; Sveshnikova, D.A.; Kucherova, A.E.; Sinyaeva, L.A. Kinetic Models of Batch Sorption in a Limited Volume. Russ. J. Phys. Chem. A 2018, 92, 1782–1789. [Google Scholar] [CrossRef]
- Ho, Y.S.; McKay, G. Pseudo-second order model for sorption processes. Process Biochem. 1999, 34, 451–465. [Google Scholar] [CrossRef]
- Ho, Y.S.; McKay, G. The kinetics of sorption of divalent metal ions onto sphagnum moss peat. Water Res. 2000, 34, 735–742. [Google Scholar] [CrossRef]
- Anirudhan, T.S.; Senan, P. Adsorption of phosphate ions from water using a novel cellulose-based adsorbent. Chem. Ecol. 2011, 27, 147–164. [Google Scholar] [CrossRef]
- Pham, T.-H.; Lee, B.-K.; Kim, J. Improved adsorption properties of a nano zeolite adsorbent toward toxic nitrophenols. Process Saf. Environ. Prot. 2016, 104, 314–322. [Google Scholar] [CrossRef]
- Collection of Simulated XRD Powder Patterns for Zeolites Fifth (5th) Revised Edition-5th Edition. Available online: https://www.elsevier.com/books/collection-of-simulated-xrd-powder-patterns-for-zeolites-fifth-5th-revised-edition/treacy/978-0-444-53067-7 (accessed on 1 November 2019).
- Gupta, N.K.; Gupta, A.; Ramteke, P.; Sahoo, H.; Sengupta, A. Biosorption-a green method for the preconcentration of rare earth elements (REEs) from waste solutions: A review. J. Mol. Liq. 2019, 274, 148–164. [Google Scholar] [CrossRef]
- Kanthasamy, R.; Larsen, S.C. Visible light photoreduction of Cr(VI) in aqueous solution using iron-containing zeolite tubes. Microporous and Mesoporous Materi. 2007, 100, 340–349. [Google Scholar] [CrossRef]
- Raman spectroscopy of zeolite A: Influence of silicon/aluminum ratio. J. Physical Chemistry 1988, 92, 354–357. Available online: https://pubs.acs.org/doi/abs/10.1021/j100313a022 (accessed on 1 November 2019). [CrossRef]
- Kaoua, S.; Krimi, S.; El Jazouli, A.; Hlil, E.K.; de Waal, D. Preparation and characterization of phosphate glasses containing titanium and vanadium. J. Alloy. Compd. 2007, 429, 276–279. [Google Scholar] [CrossRef]
- Yadav, A.K.; Singh, P. A review of the structures of oxide glasses by Raman spectroscopy. RSC Adv. 2015, 5, 67583–67609. [Google Scholar] [CrossRef]
- Yu, Y.; Murthy, B.N.; Shapter, J.G.; Constantopoulos, K.T.; Voelcker, N.H.; Ellis, A.V. Benzene carboxylic acid derivatized graphene oxide nanosheets on natural zeolites as effective adsorbents for cationic dye removal. J. Hazard. Mater. 2013, 260, 330–338. [Google Scholar] [CrossRef]
- Hematite R040024-RRUFF Database: Raman, X-ray, Infrared, and Chemistry. Available online: http://rruff.info/Hematite/R040024 (accessed on 1 November 2019).
- Uzunova, E.L.; Mikosch, H. Adsorption of phosphates and phosphoric acid in zeolite clinoptilolite: Electronic structure study. Microporous and Mesoporous Mater. 2016, 232, 119–125. [Google Scholar] [CrossRef]


| The Vibration of the Following Bonds | Band Peak Shift in IR Spectra of the Zeolite Backbone | |||
|---|---|---|---|---|
| Fresh Z-A | Fresh Iron-Z-A | P-Adsorbed Iron-Z-A | P-Desorbed Iron-Z-A | |
| –OH strectching | 3467.78 | 3466.82 | 3462.96 | 3481.28 |
| –OH bending | 1653.85 | 1652.88 | 1652.88 | 1657.71 |
| –νas Si-O(Si) & νas Si-O(Al) | 993.27 | 995.20 | 1001.95 | 996.16 |
| – νs Si-O-Si | 734.83 | 700.11 | 705.90 | 701.07 |
| – νs Si-O-Al | 668.29 | 556.42 | 705.90 | 701.07 |
| –νsSi-O-Si &–δ O-Si-O | 569.92 | 556.42 | ||
| – δ O-Si-O | 441.67 | 459.02 | 450.34 | 452.27 |
| Langmuir | Freundlich | ||||
|---|---|---|---|---|---|
| KL (L/mg) | Qm | R2 | KF (mg/g)/(mg/L)1/2 | n | R2 |
| −2.51 | 2.16 | 0.92 | 134.62 | −0.29 | 0.67 |
| Metal Ion | Adsorbed Phosphate/Adsorbent (mg/g) |
|---|---|
| Fe | 382.296 mg PO43−/g Fe |
| Al | 56.296 mg PO43−/g Al |
| Kinetic Models | R2 | Qe | k1 & k2 |
|---|---|---|---|
| Pseudo-first-order model | 0.90 | −42.73 | 0.023 (1/min) |
| Pseudo-second-order model | 0.99 | 2.03 | 0.23 (g/mg min) |
© 2019 by the authors. Licensee MDPI, Basel, Switzerland. This article is an open access article distributed under the terms and conditions of the Creative Commons Attribution (CC BY) license (http://creativecommons.org/licenses/by/4.0/).
Share and Cite
Saifuddin, M.; Kim, S.; Aziz, A.; Kim, K.S. Mechanistic Study of Phosphorus Adsorption onto Iron Z-A: Spectroscopic and Experimental Approach. Appl. Sci. 2019, 9, 4897. https://doi.org/10.3390/app9224897
Saifuddin M, Kim S, Aziz A, Kim KS. Mechanistic Study of Phosphorus Adsorption onto Iron Z-A: Spectroscopic and Experimental Approach. Applied Sciences. 2019; 9(22):4897. https://doi.org/10.3390/app9224897
Chicago/Turabian StyleSaifuddin, Md, Suho Kim, Abdul Aziz, and Kwang Soo Kim. 2019. "Mechanistic Study of Phosphorus Adsorption onto Iron Z-A: Spectroscopic and Experimental Approach" Applied Sciences 9, no. 22: 4897. https://doi.org/10.3390/app9224897
APA StyleSaifuddin, M., Kim, S., Aziz, A., & Kim, K. S. (2019). Mechanistic Study of Phosphorus Adsorption onto Iron Z-A: Spectroscopic and Experimental Approach. Applied Sciences, 9(22), 4897. https://doi.org/10.3390/app9224897