Fatigue Reliability Analysis of Rib-To-Deck Joints Using Test Data and In-Situ Measurements

Abstract
:1. Introduction
2. Fatigue Tests of Rib-To-Deck Joints
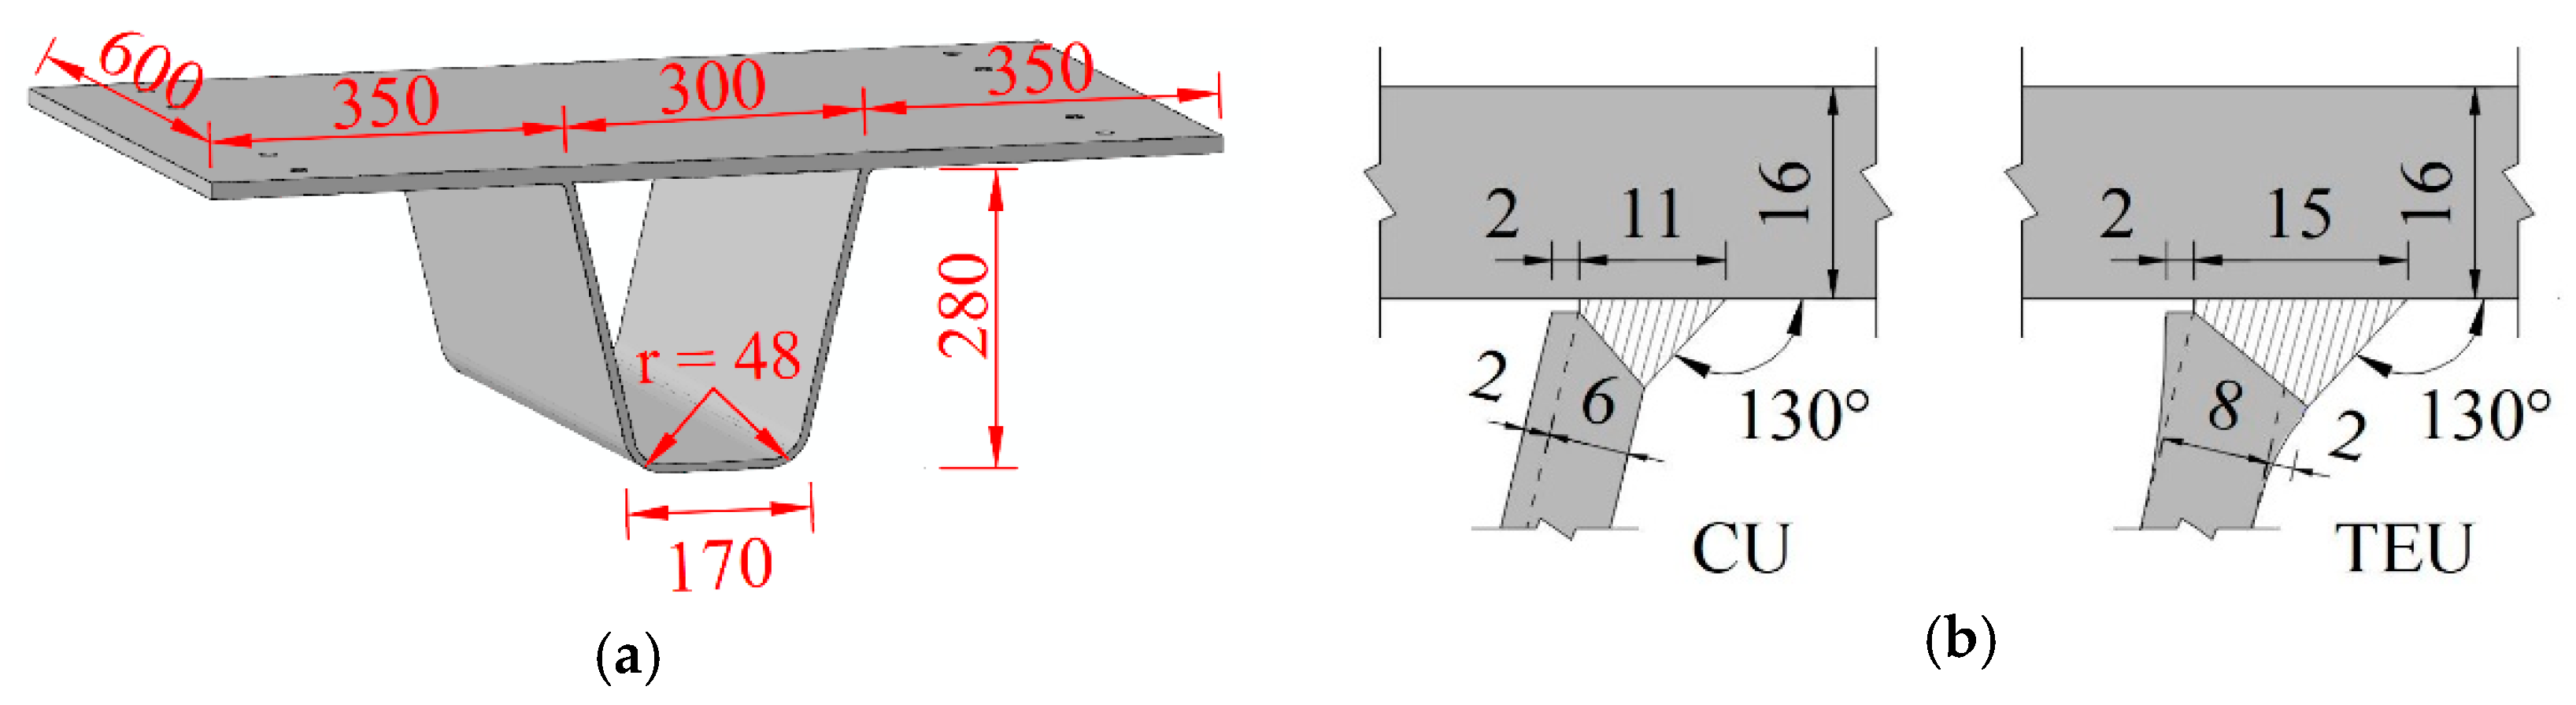
2.1. Design of Specimens
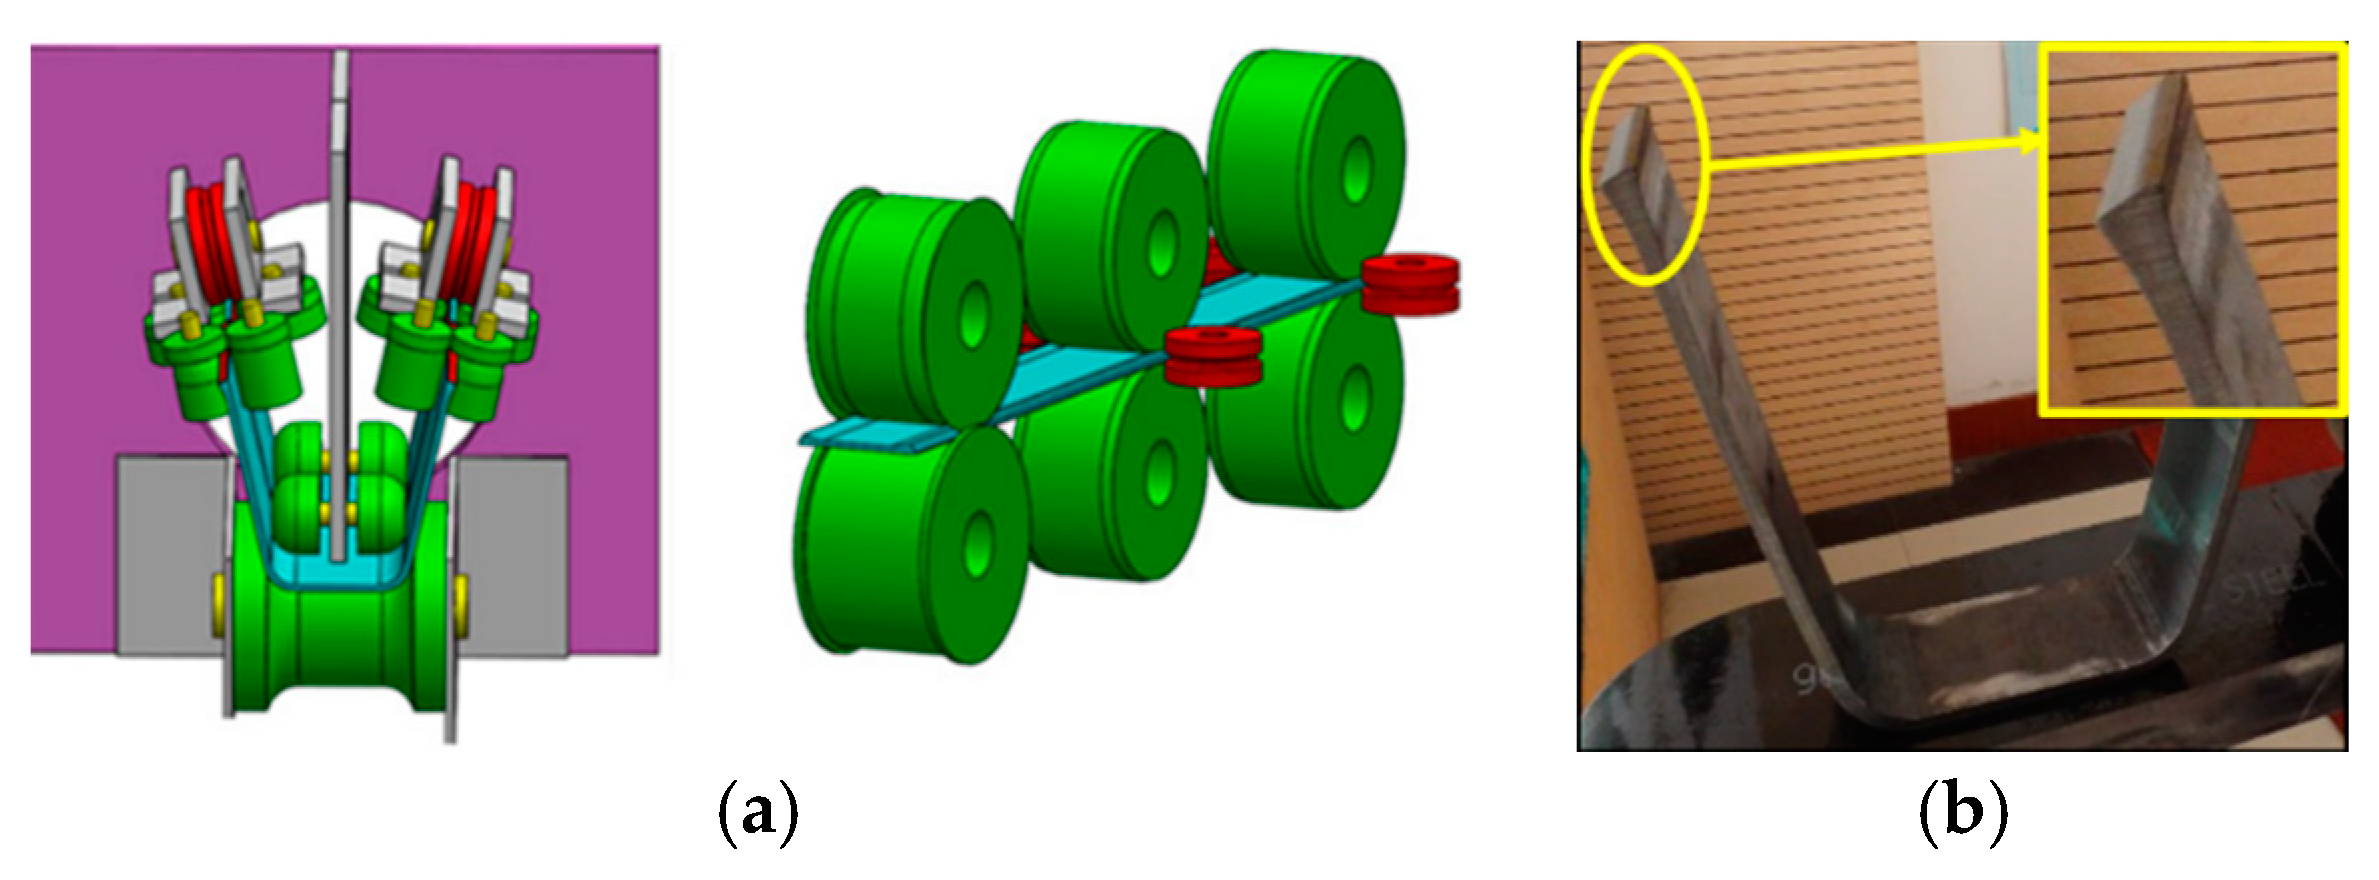
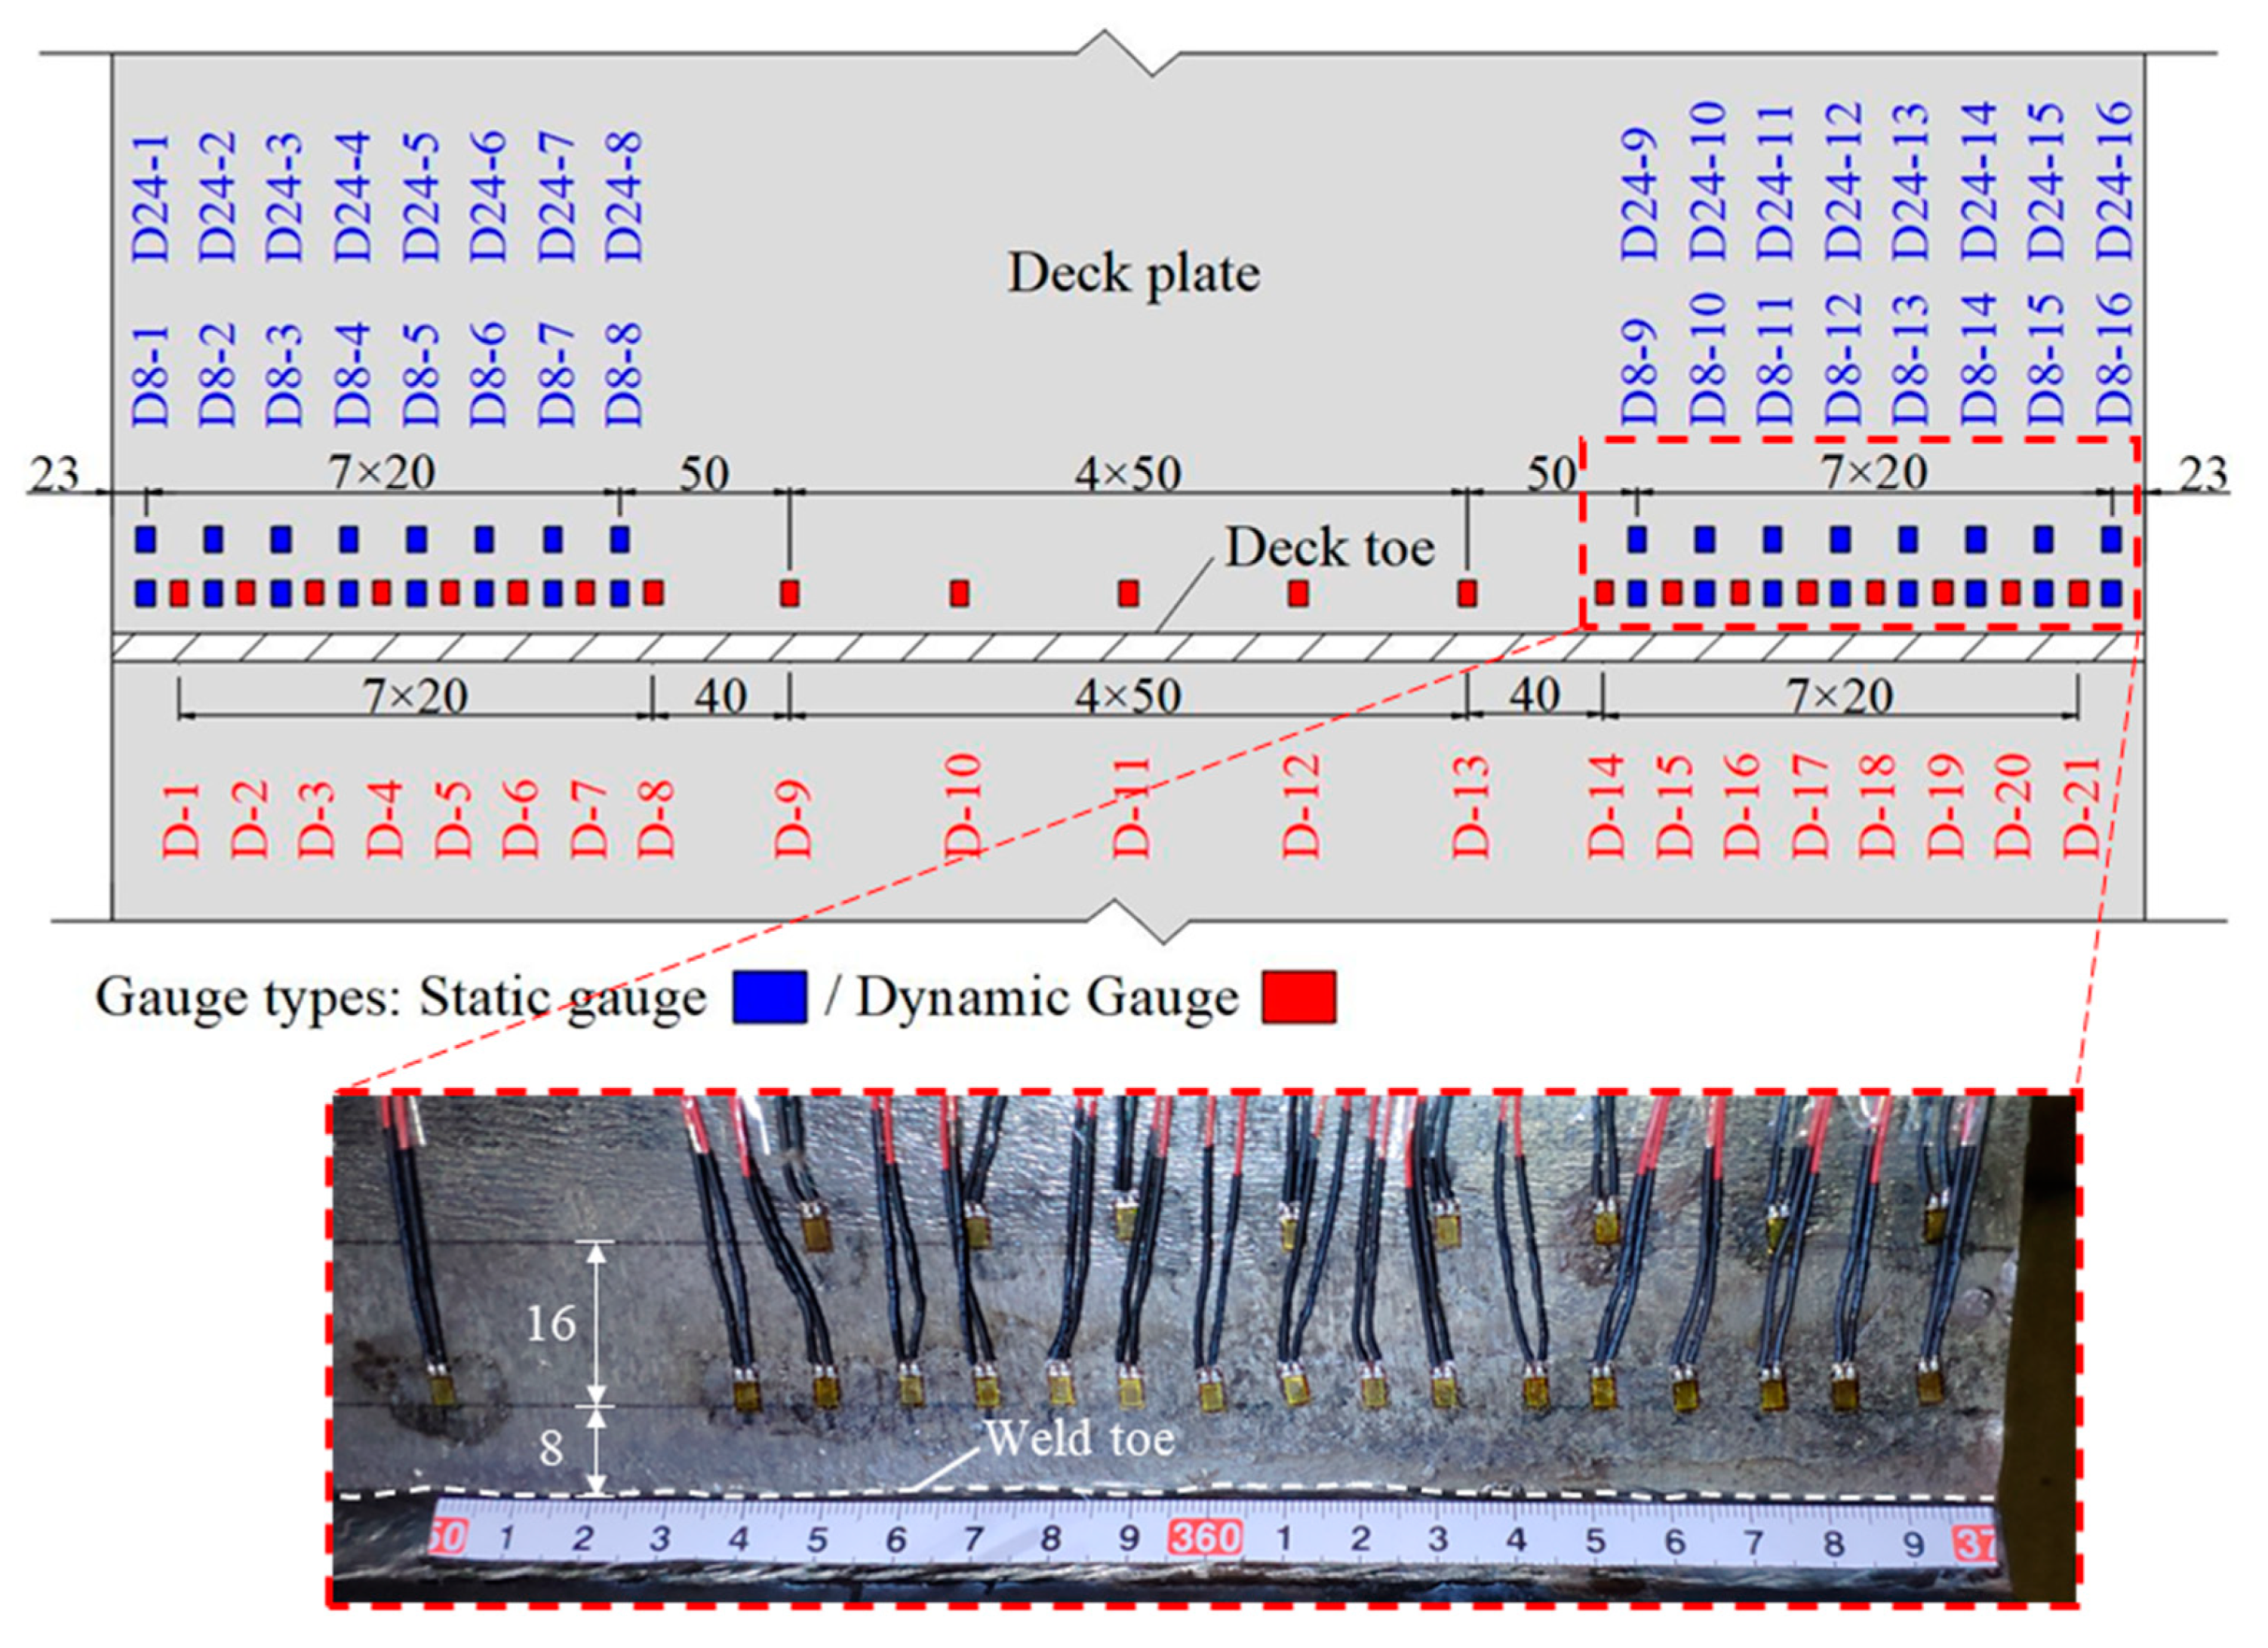
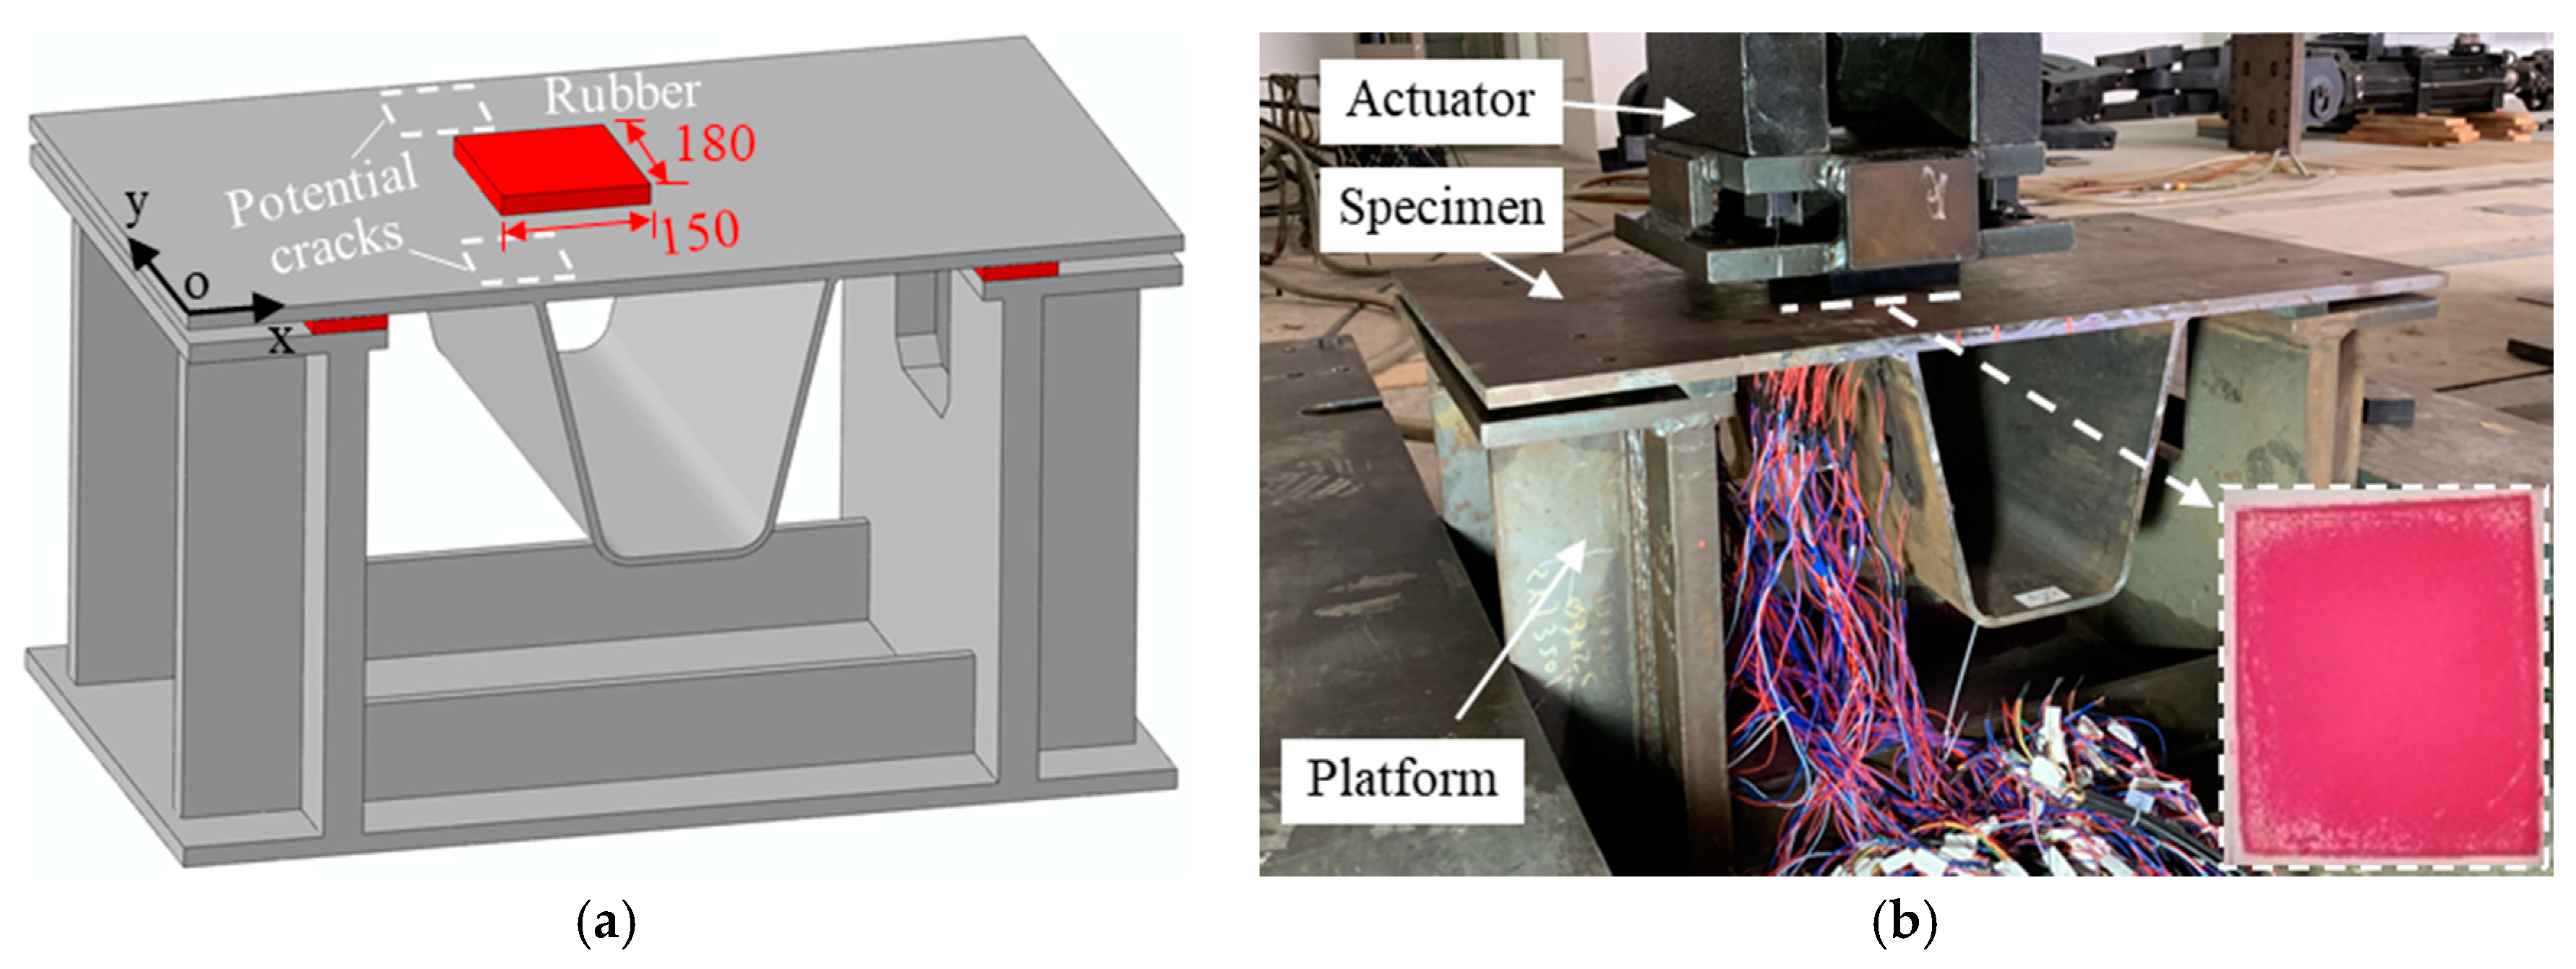
2.2. Test Setup
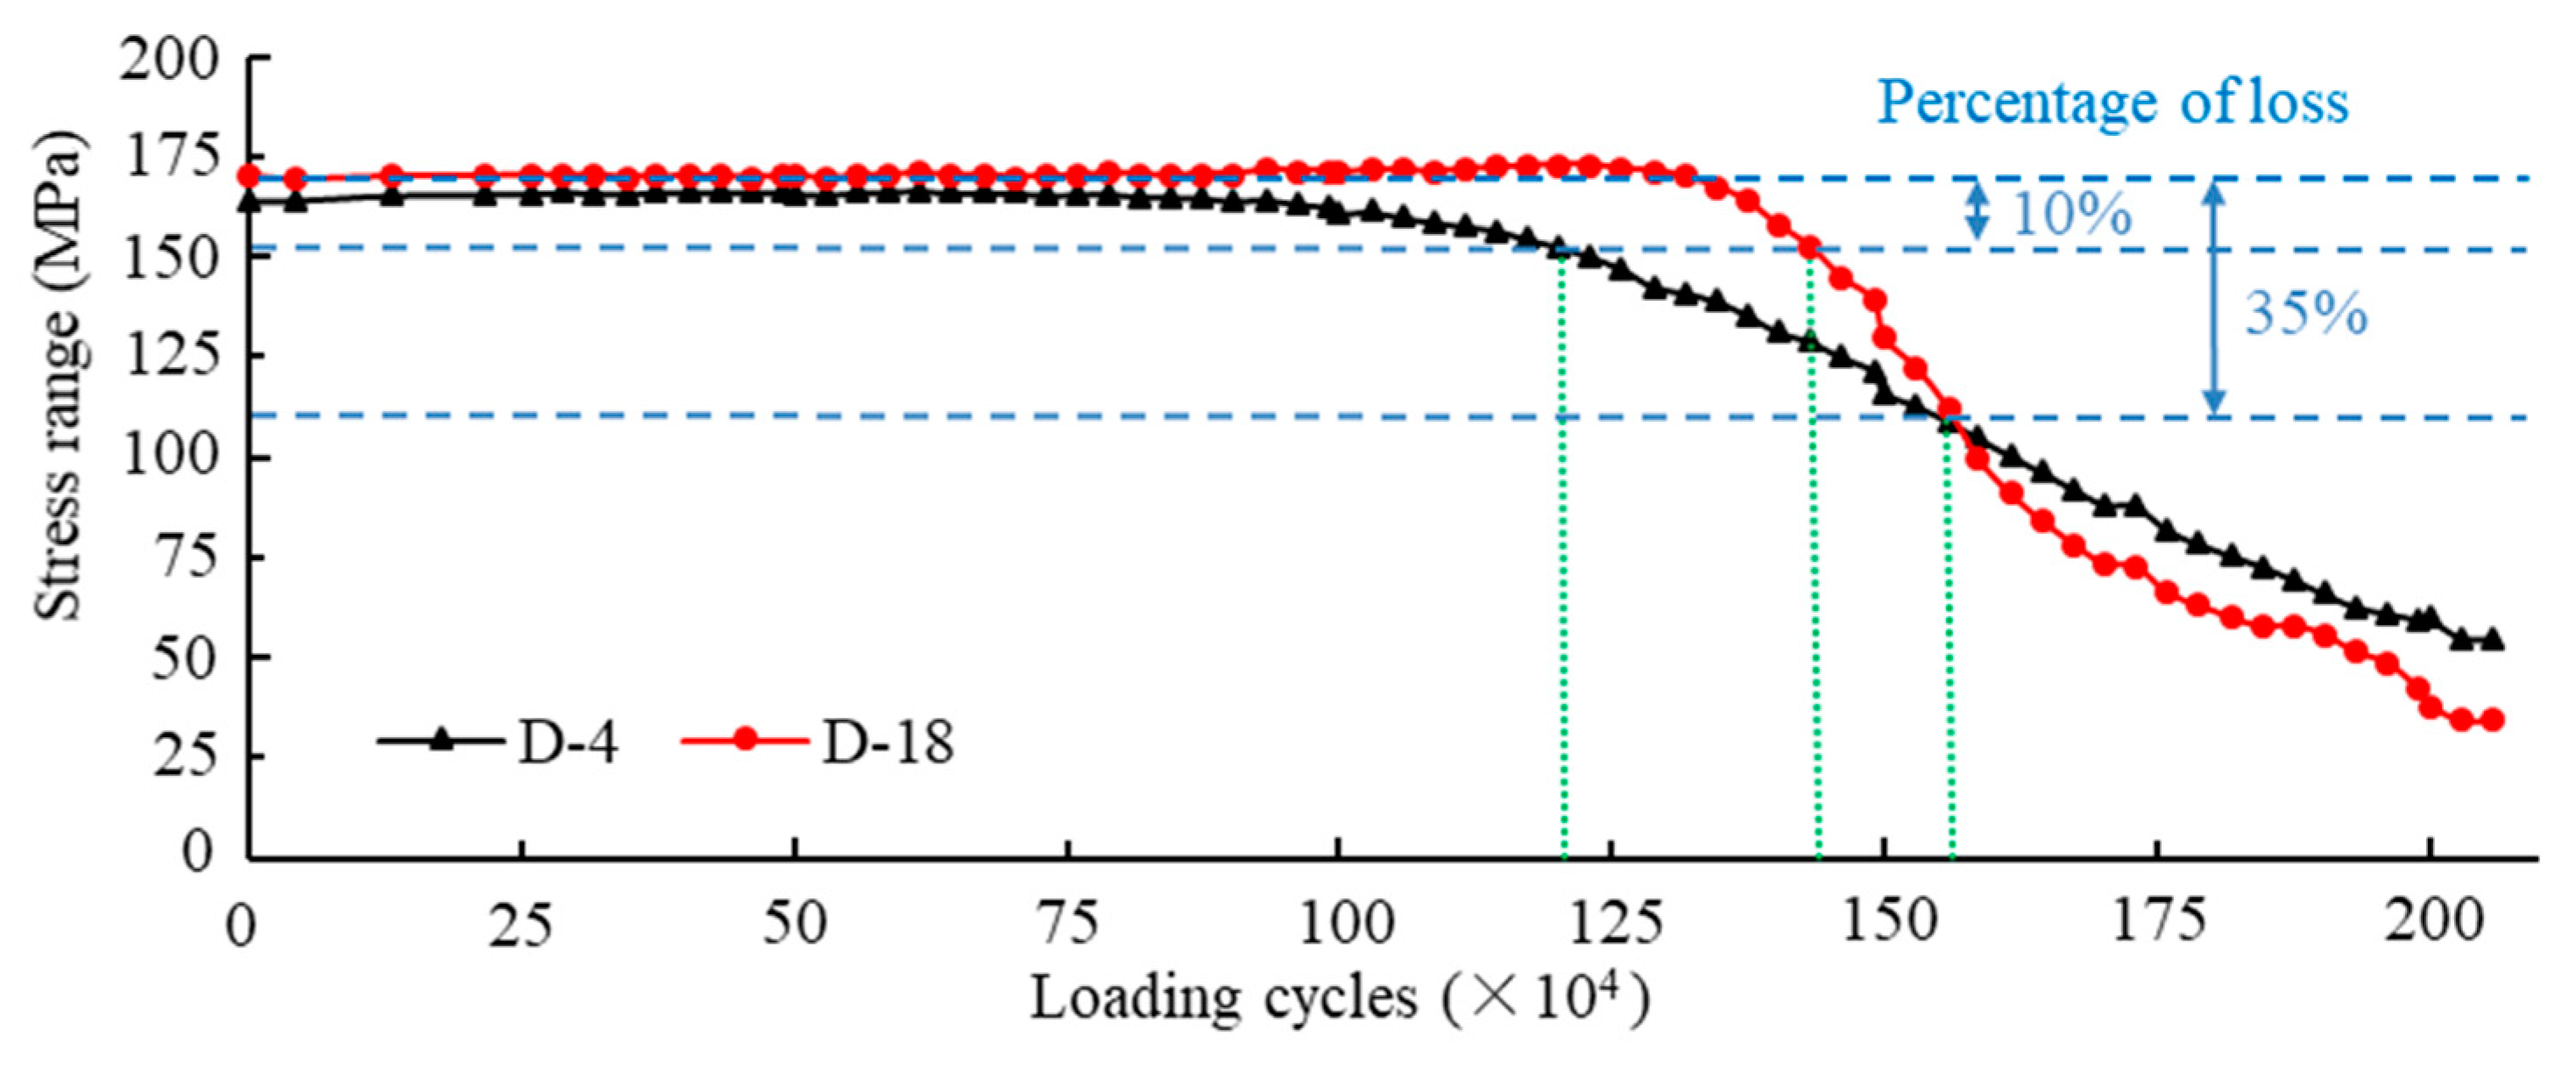
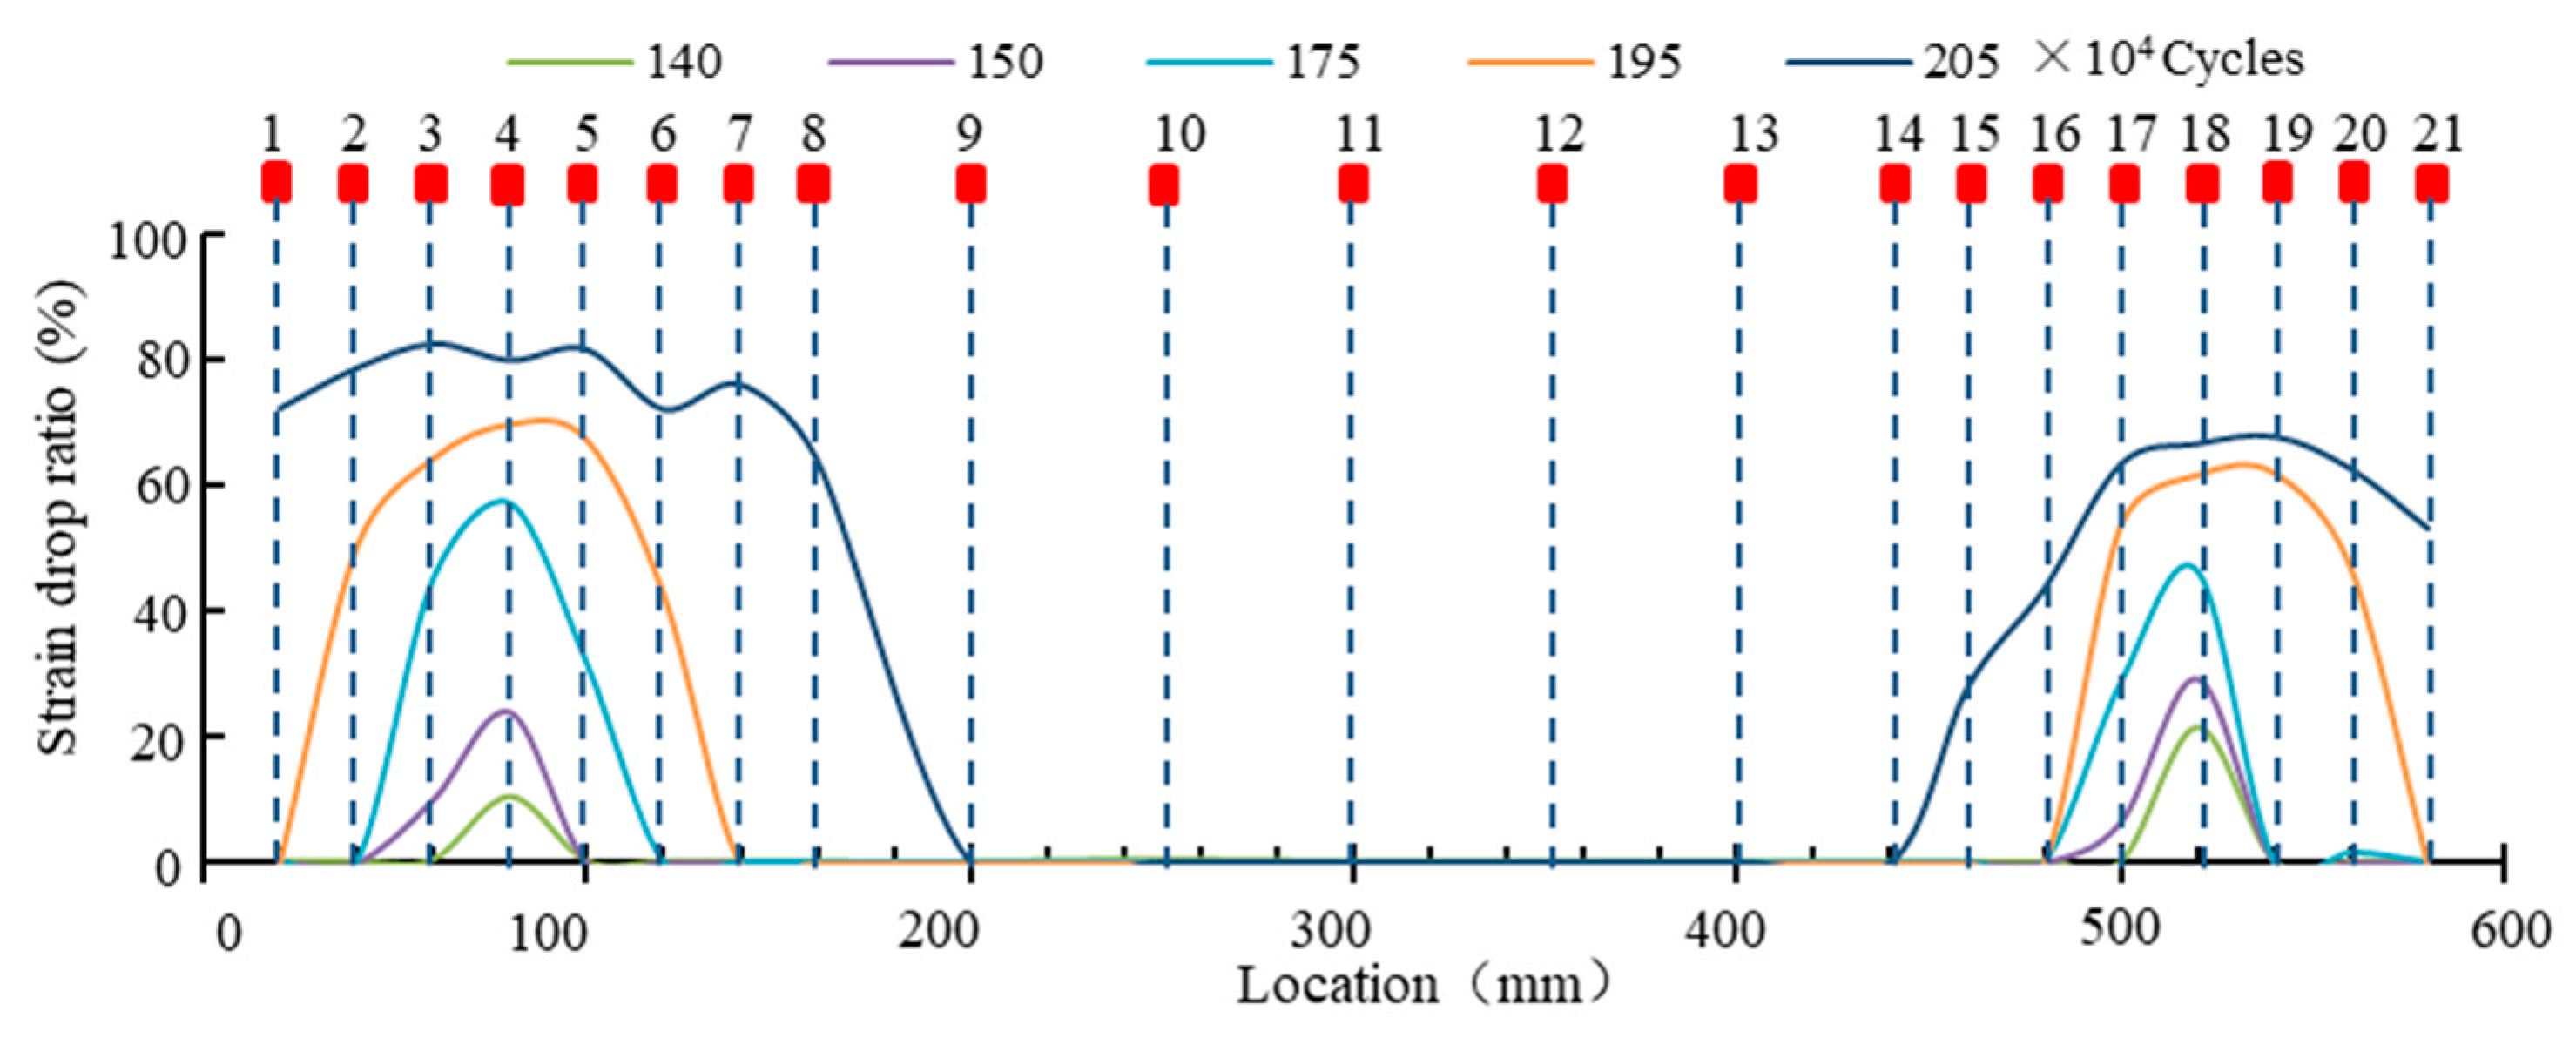
2.3. Test Result
3. Derivation of Probability–Stress–Life Curves
3.1. Statistics Method for P–S–N Derivation
3.2. Result and Discussion
4. In-Situ Measurement-Based Fatigue Reliability Analysis
4.1. Analysis Method of Fatigue Reliability
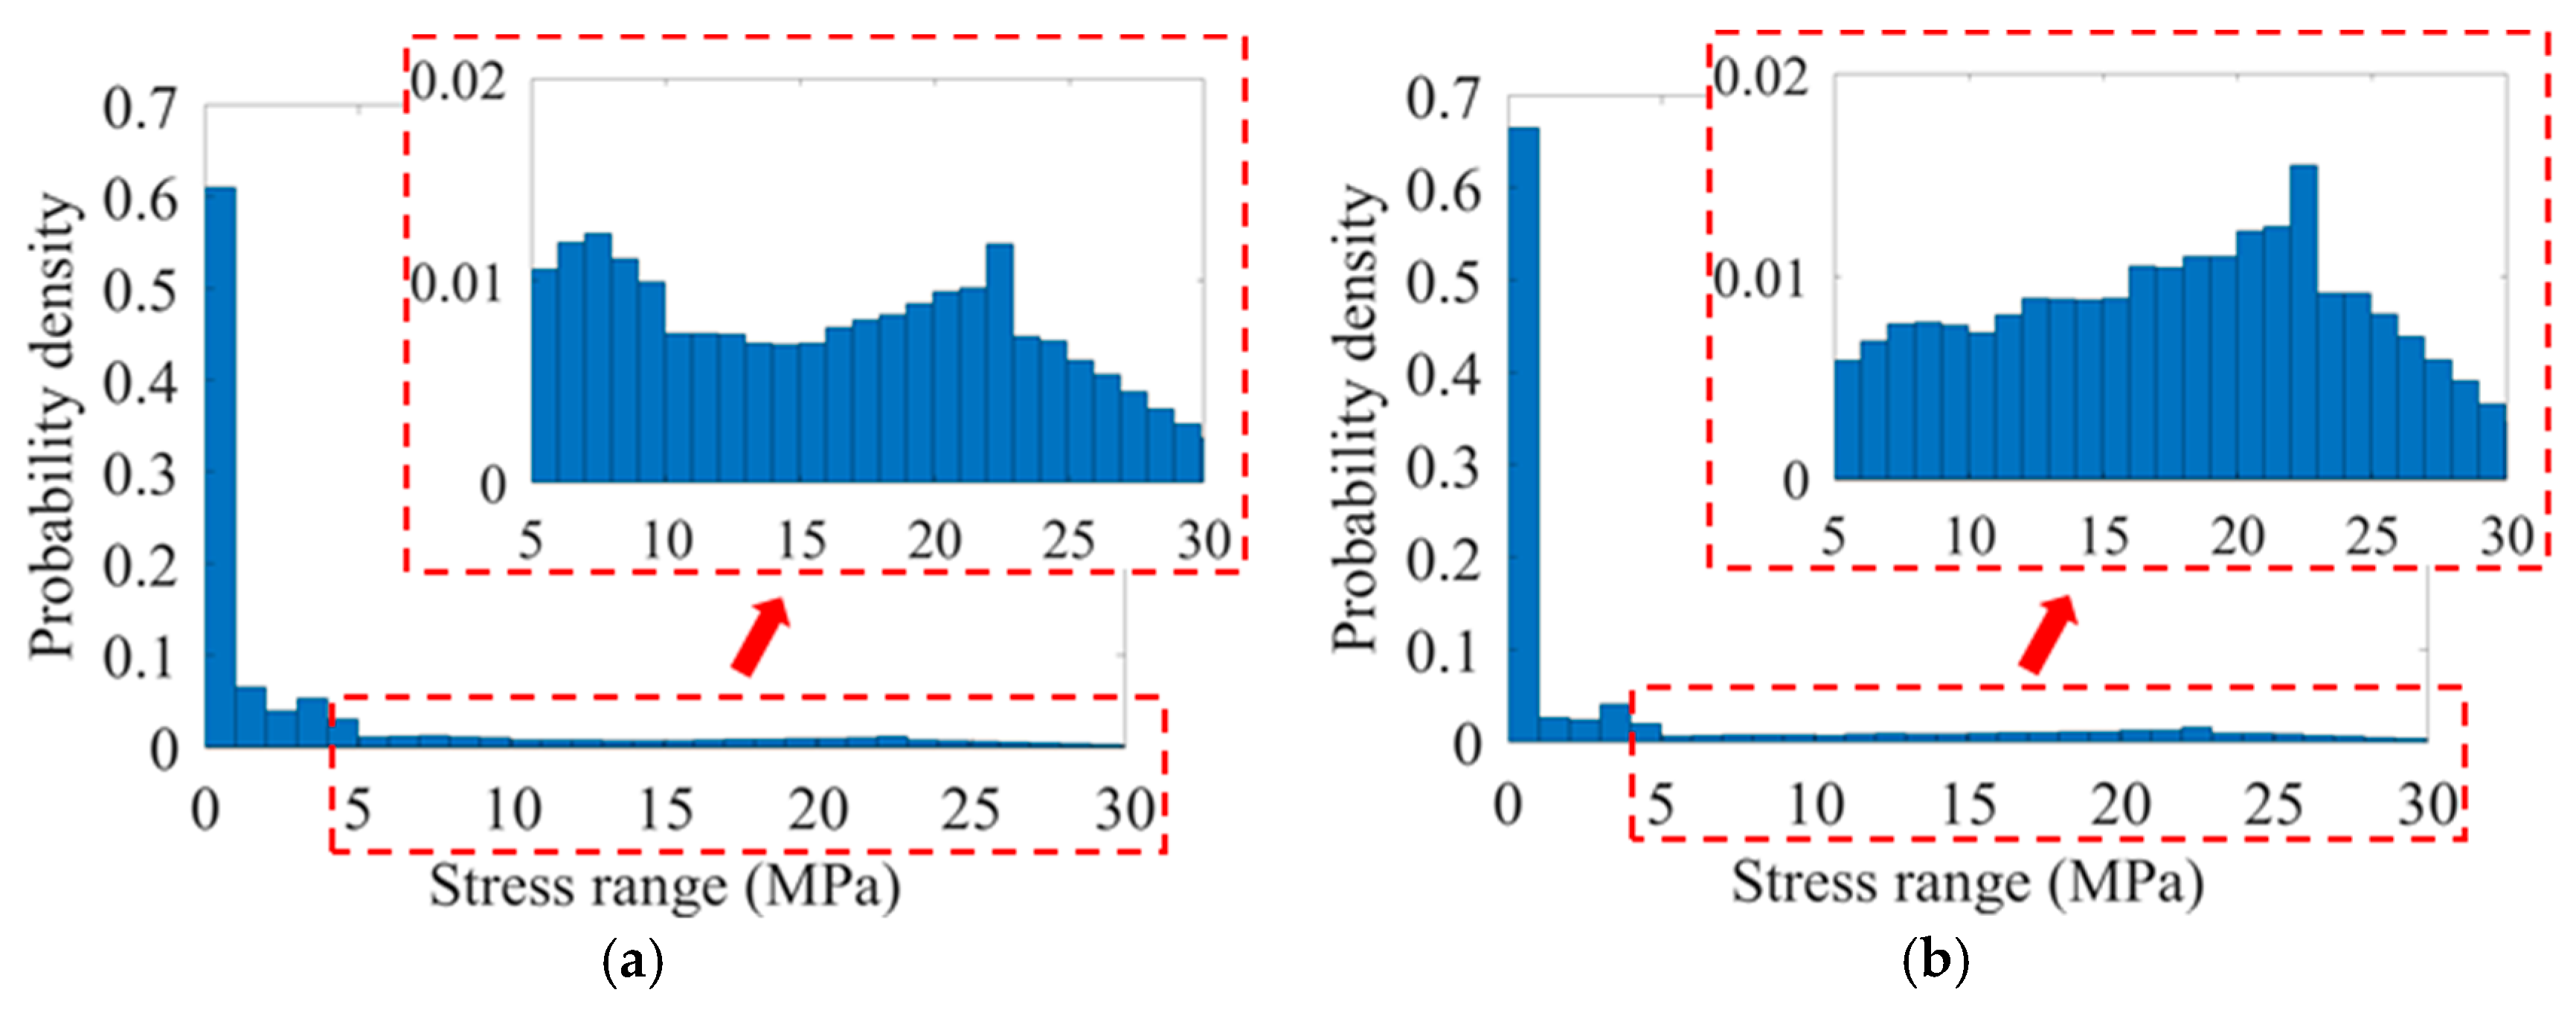
4.2. Derivation of Stress Spectra Using In-Situ Measurement
4.3. Result and Discussion
5. Conclusions
- (1)
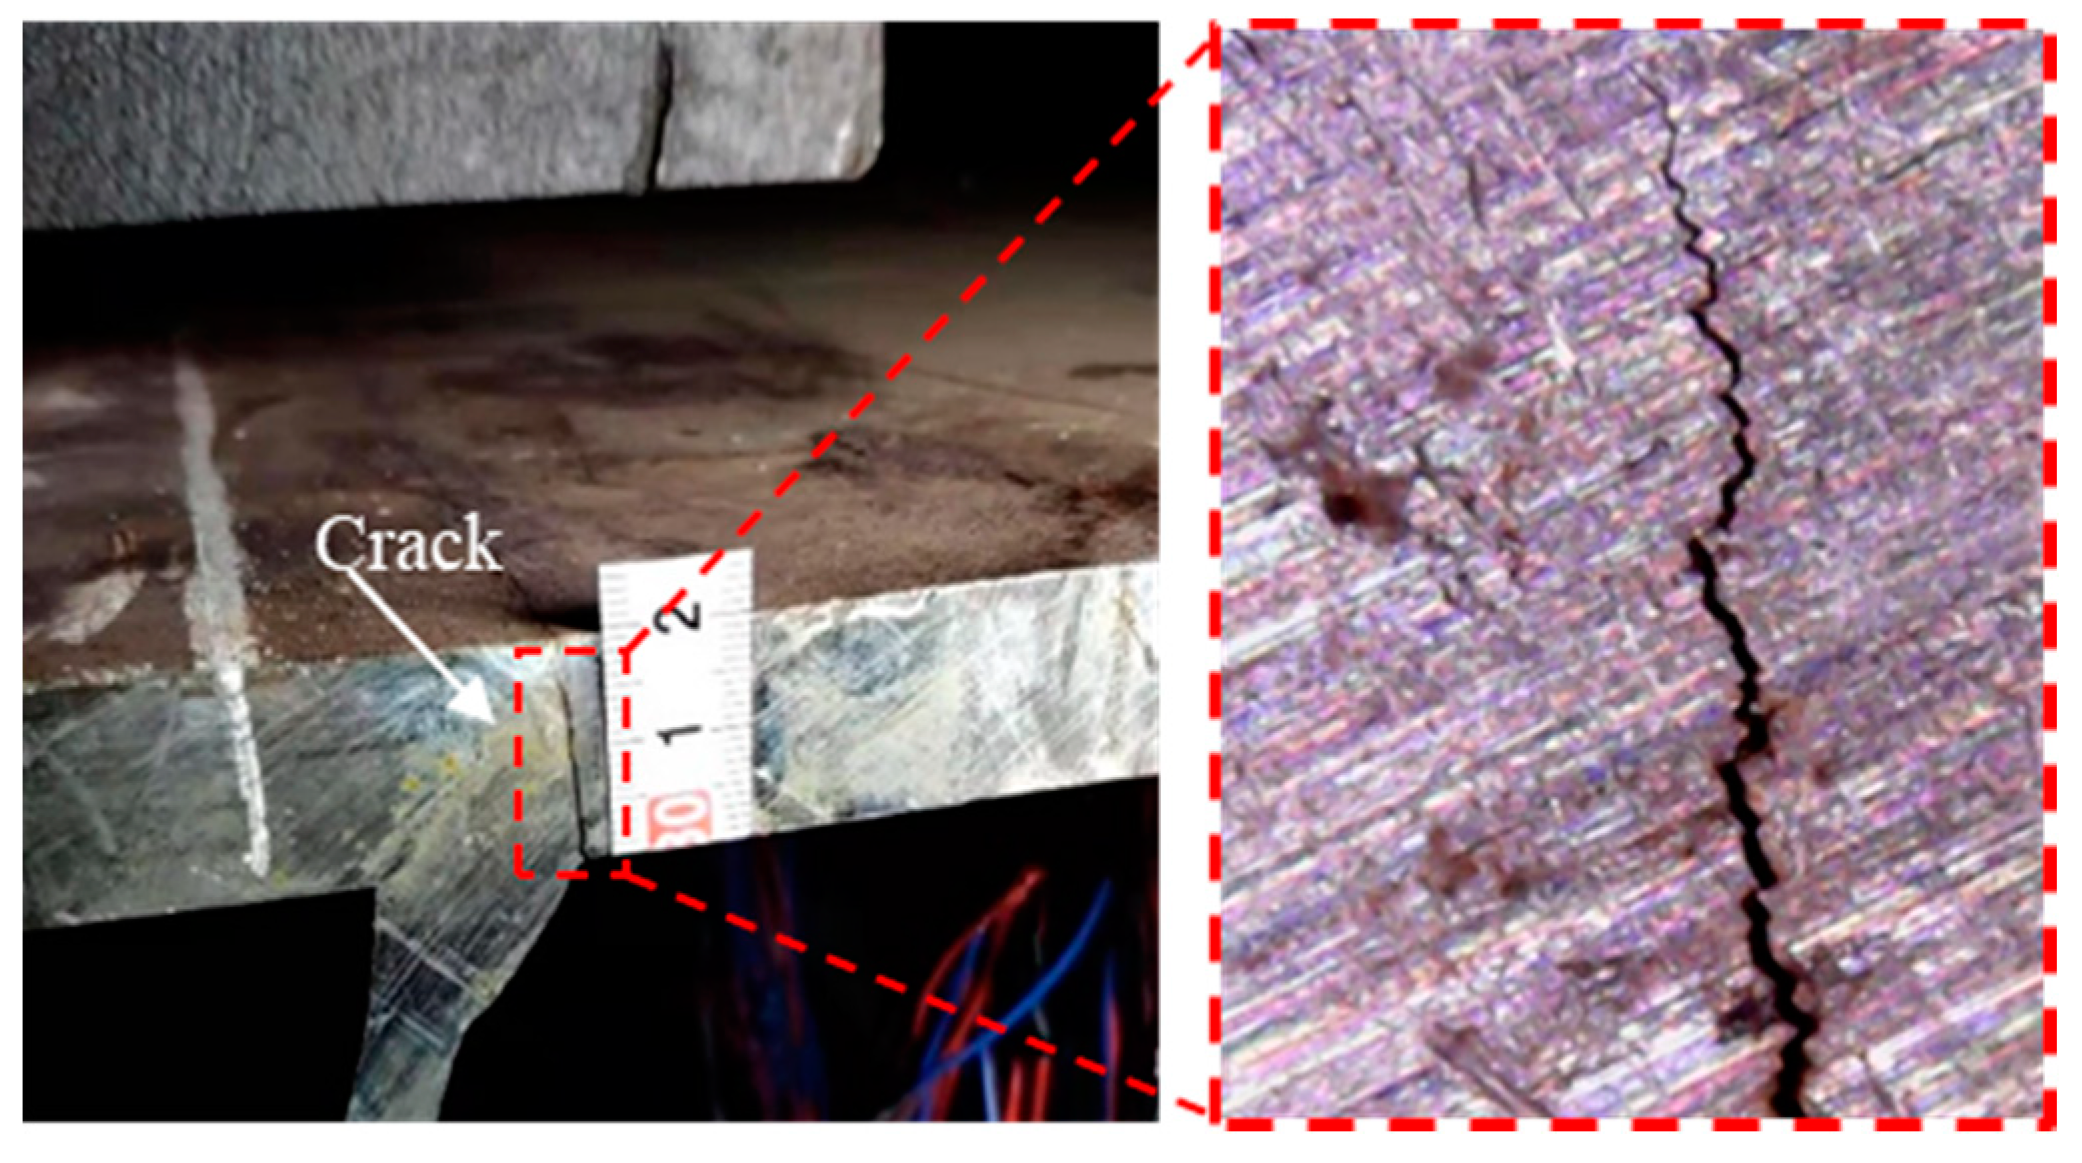
- As per the fatigue test of rib-to-deck specimens, under the cyclic loading, the fatigue crack initiates at the deck toe and then propagates along the thickness and length of the deck plate until it penetrates through the deck plate and cause failure. The test result also proved the effectiveness of TEUs in enhancing the fatigue performance of RD joints. In the case of mean value, compared with the CU specimens, the fatigue strength of TEU specimens was 21.4% higher in nominal stress and 21.1% higher in hot spot stress.
- (2)
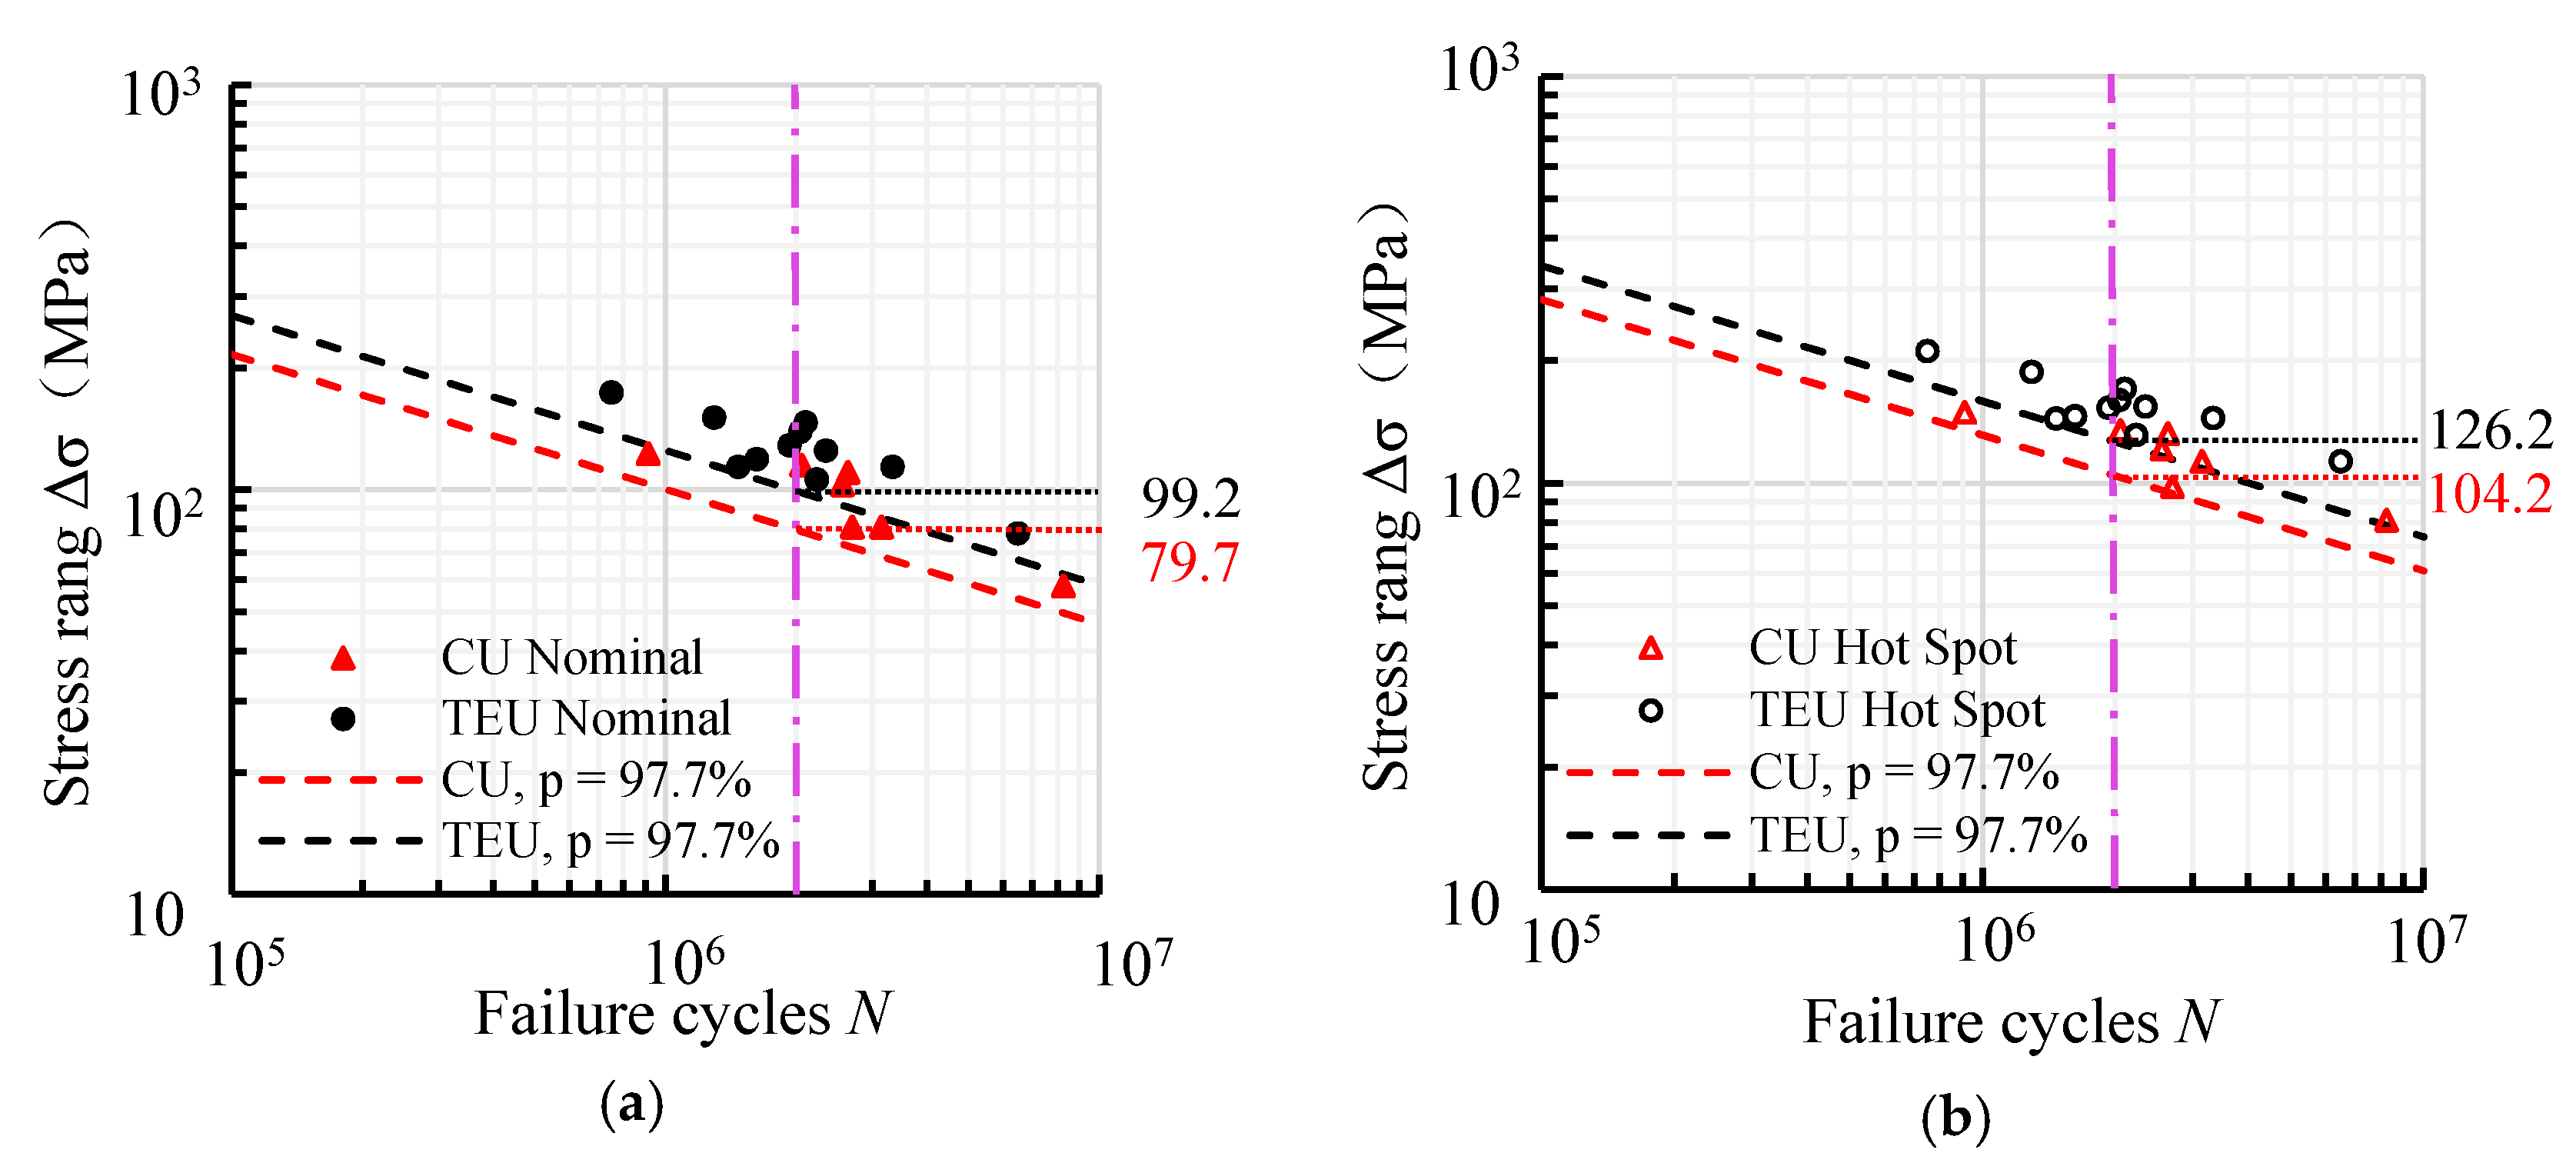
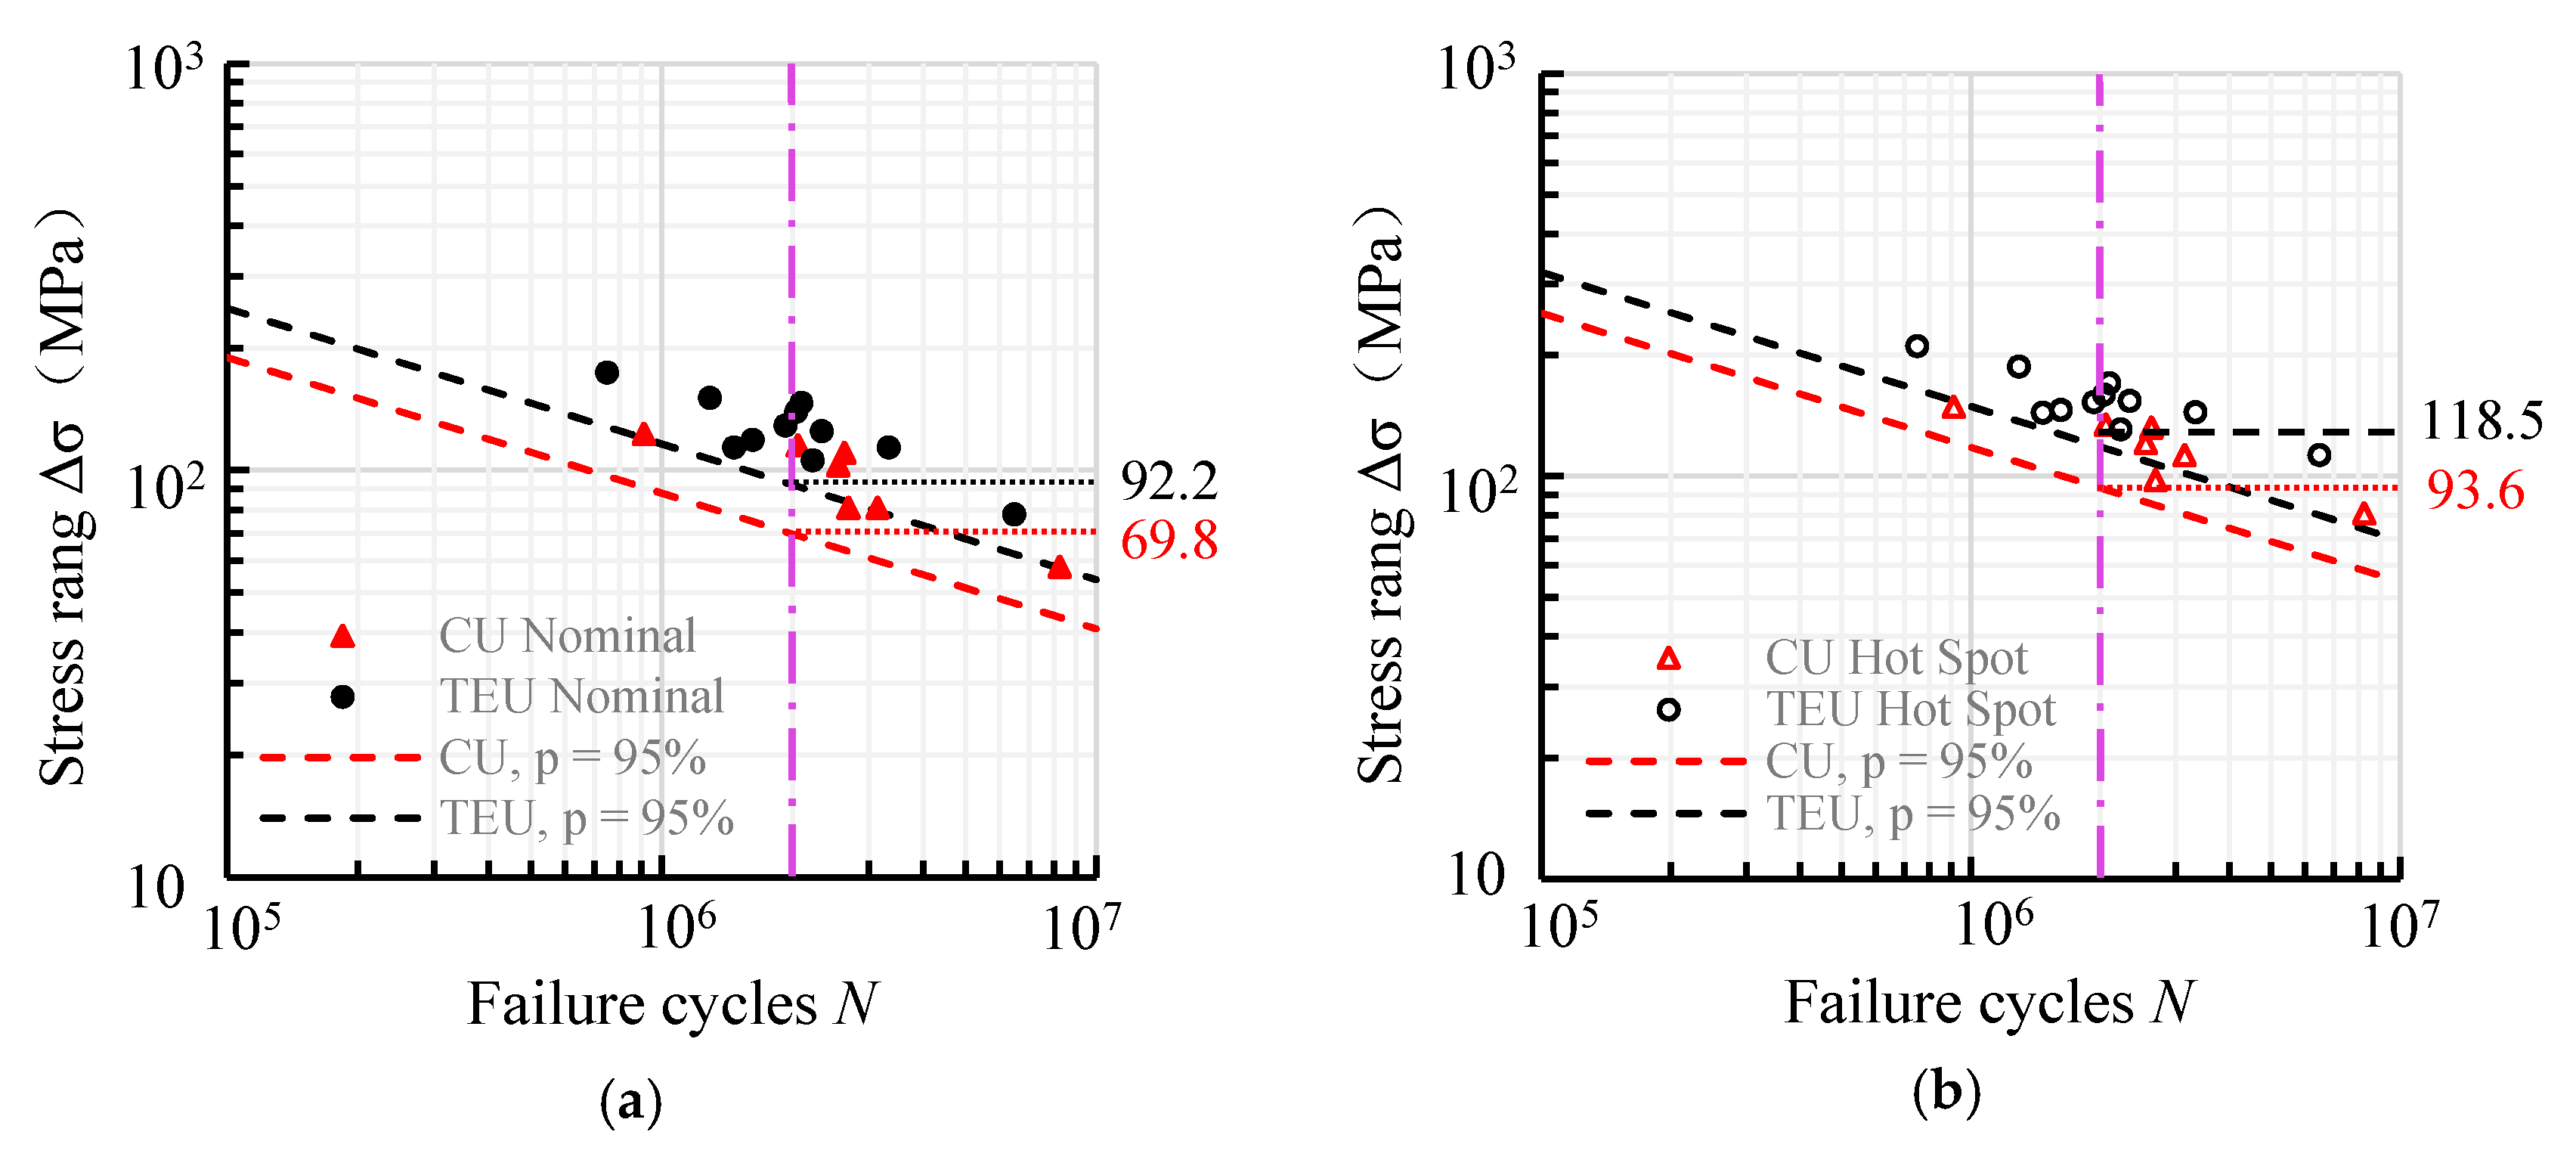
- Based on the test data of 18 specimens, P–S–N curves of RD joints were derived for the OSD using CUs and the OSD using TEUs, respectively. In the derivation, the statistics method proposed by IIW was employed after analysis, in which the survival rate of 95% is considered with the confidence of 75% for estimators. As a result, the FAT 90 and FAT 115 curves are suggested for the fatigue check of RD joints in the OSD using TEUs, in terms of nominal stress and hot spot stress, respectively. Meanwhile, for the RD joints in the OSD using CUs, the FAT 70 and FAT 90 curves are, respectively, recommended under the nominal stress and hot spot stress approaches.
- (3)
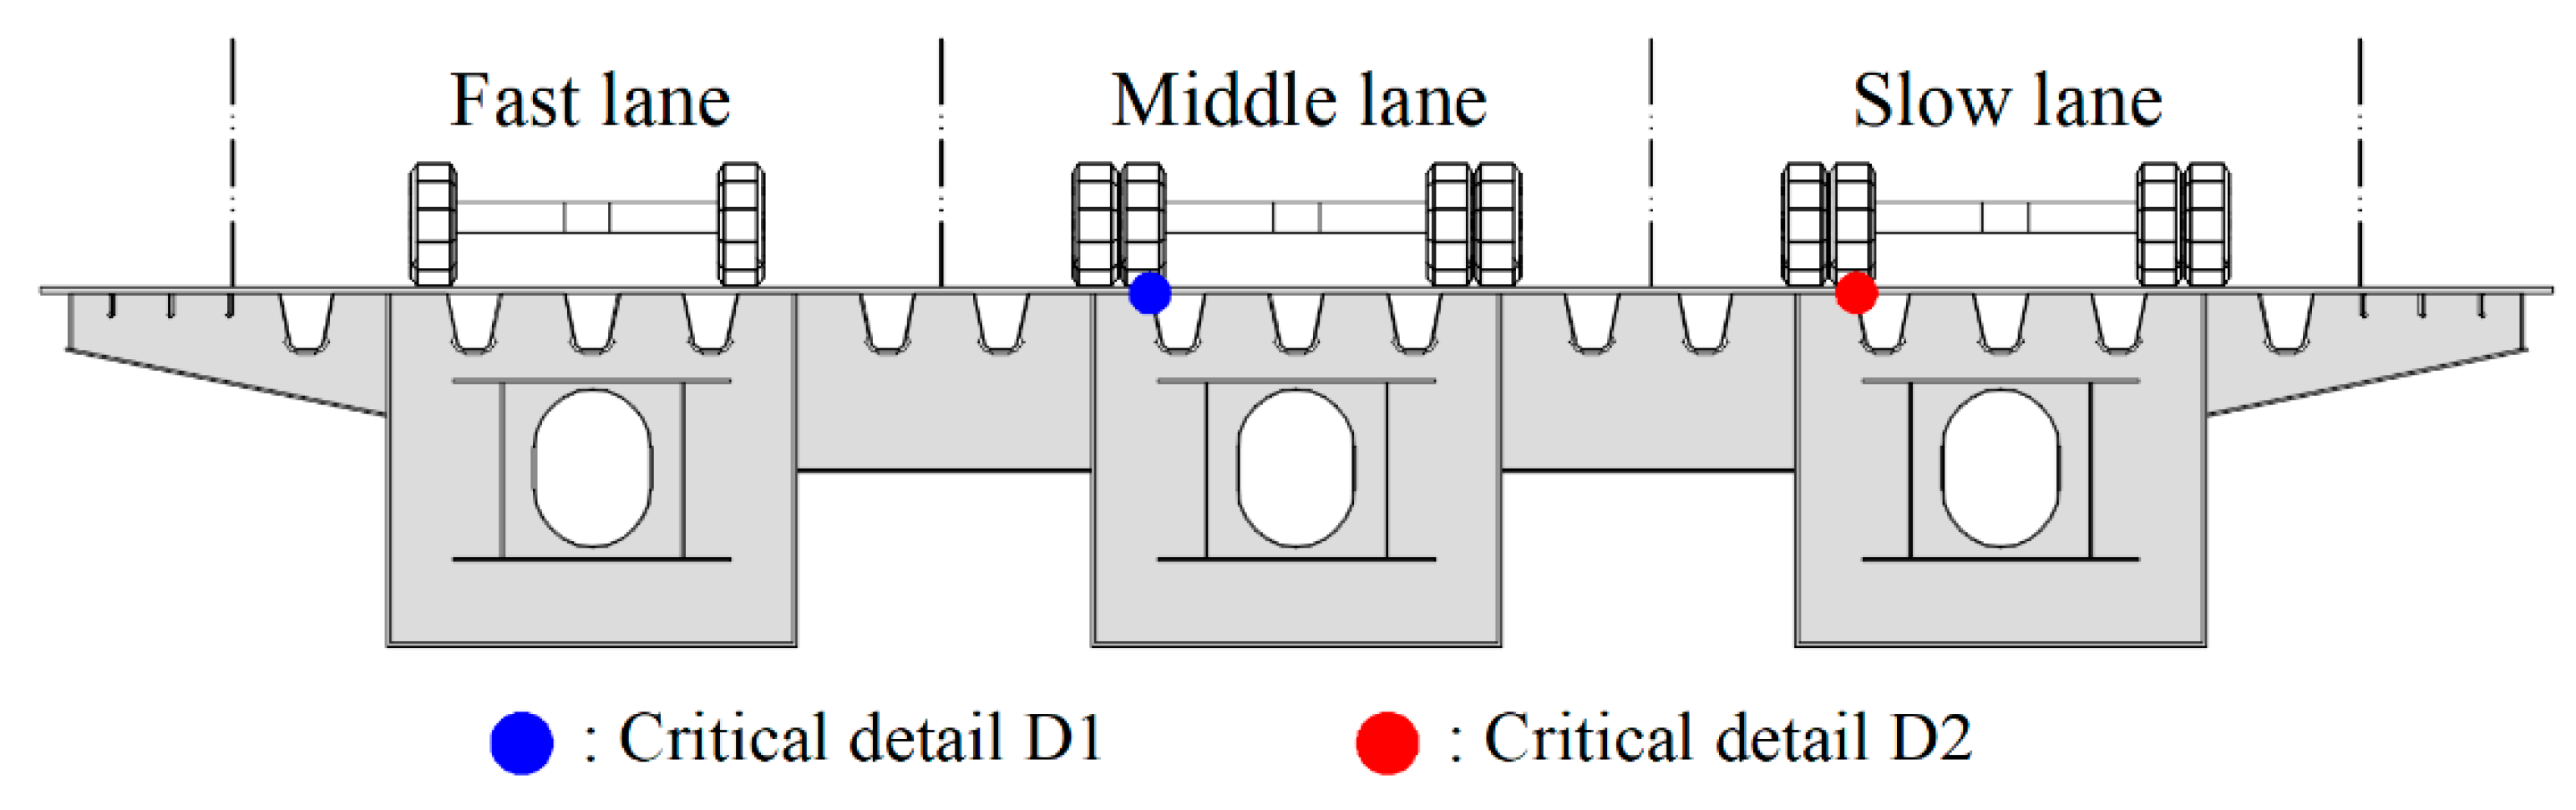
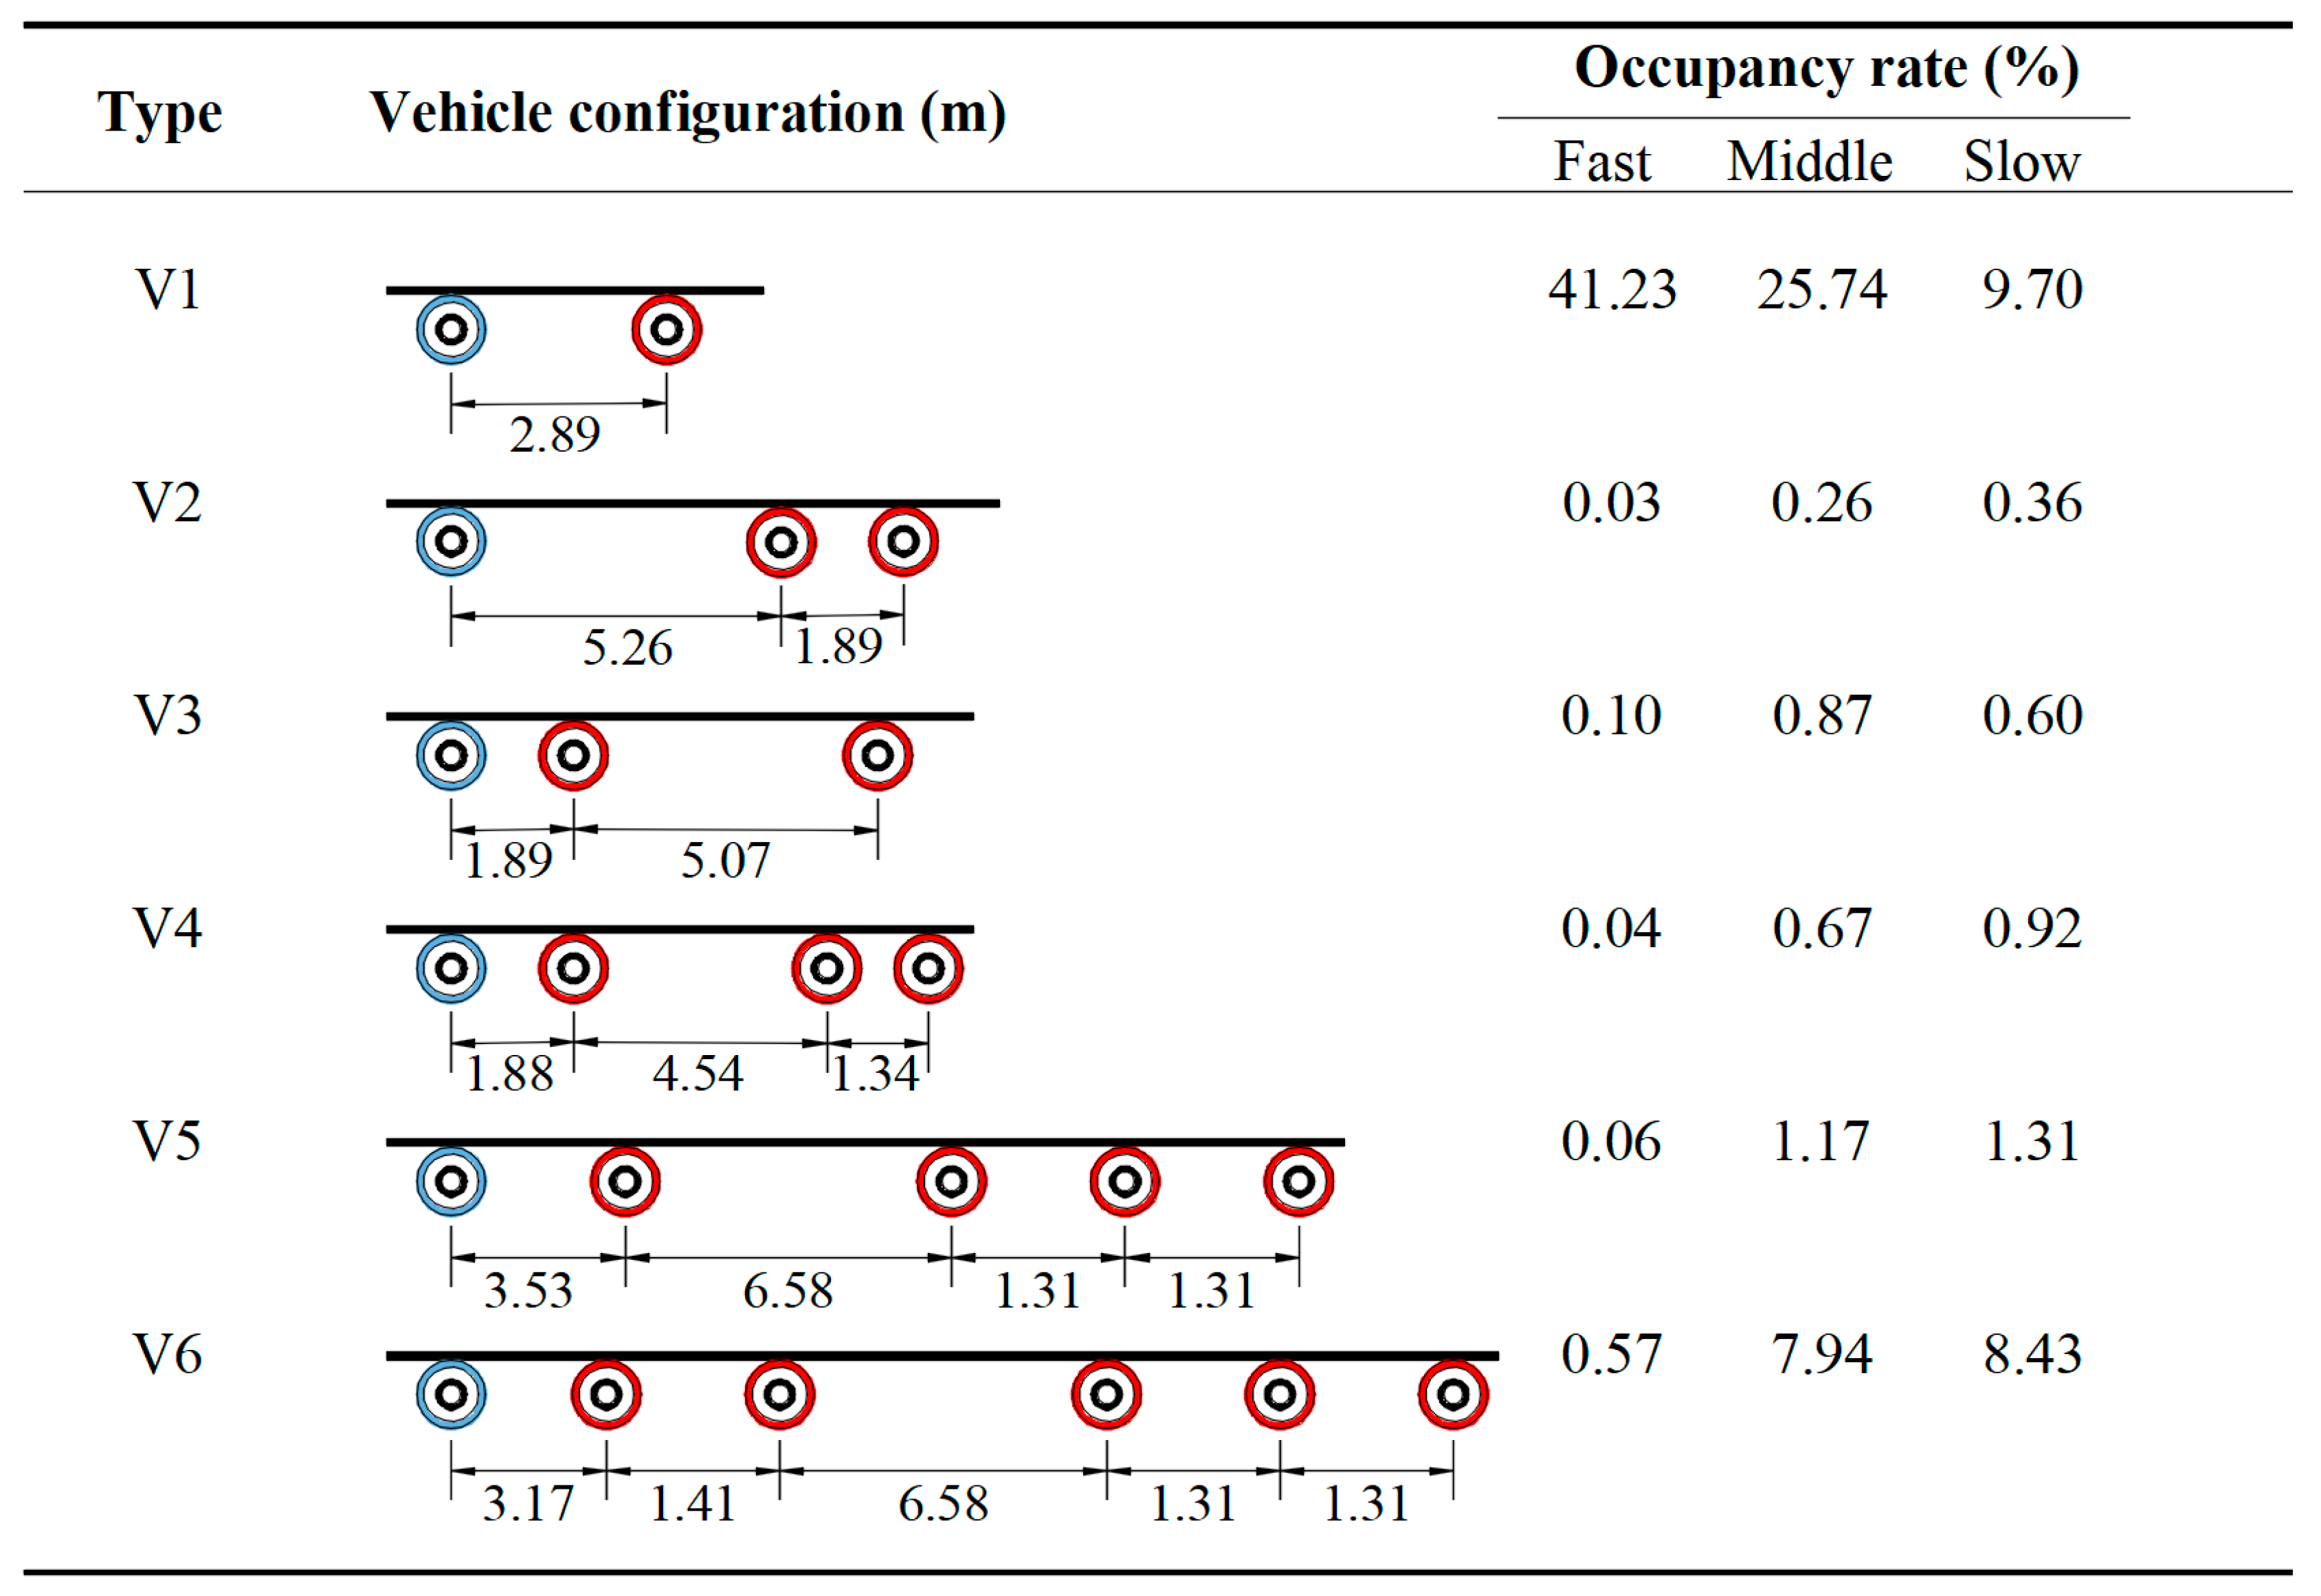
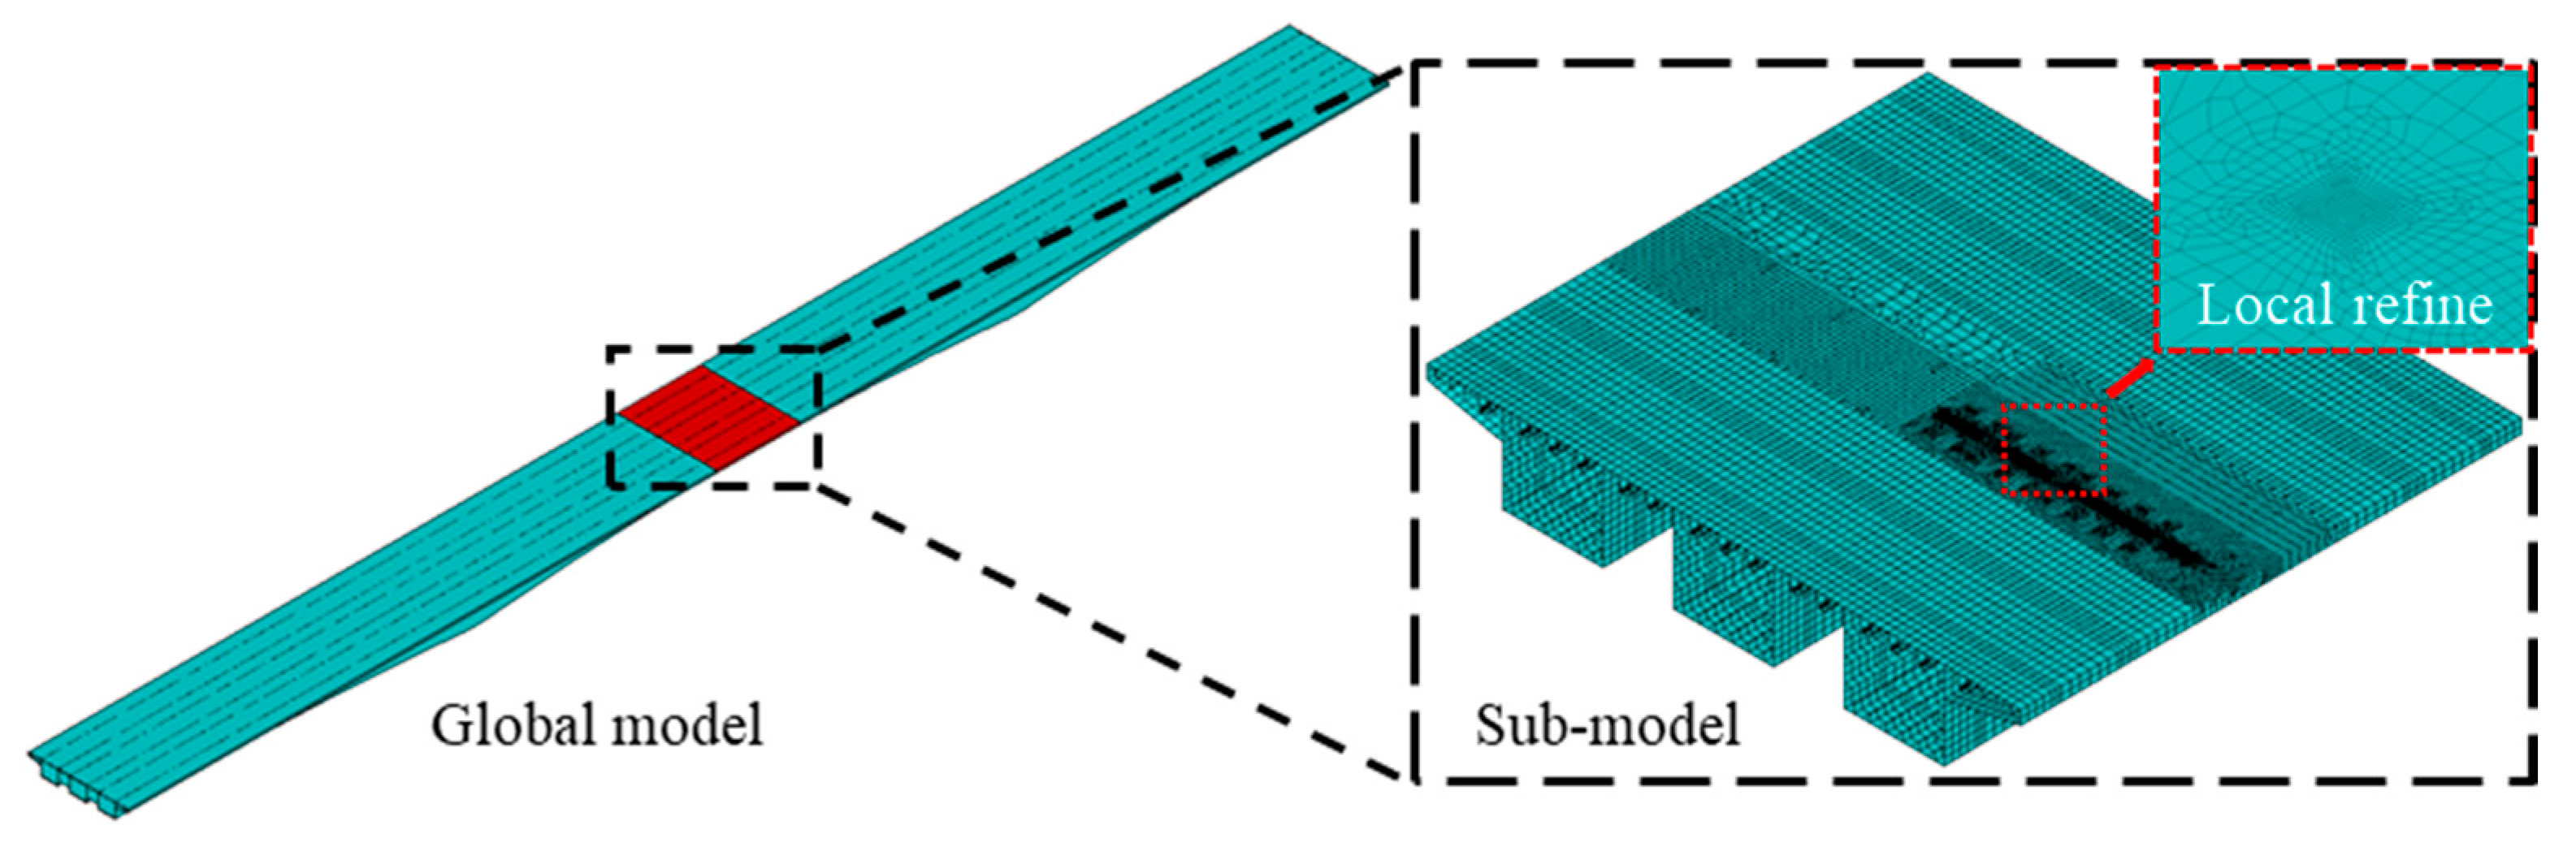
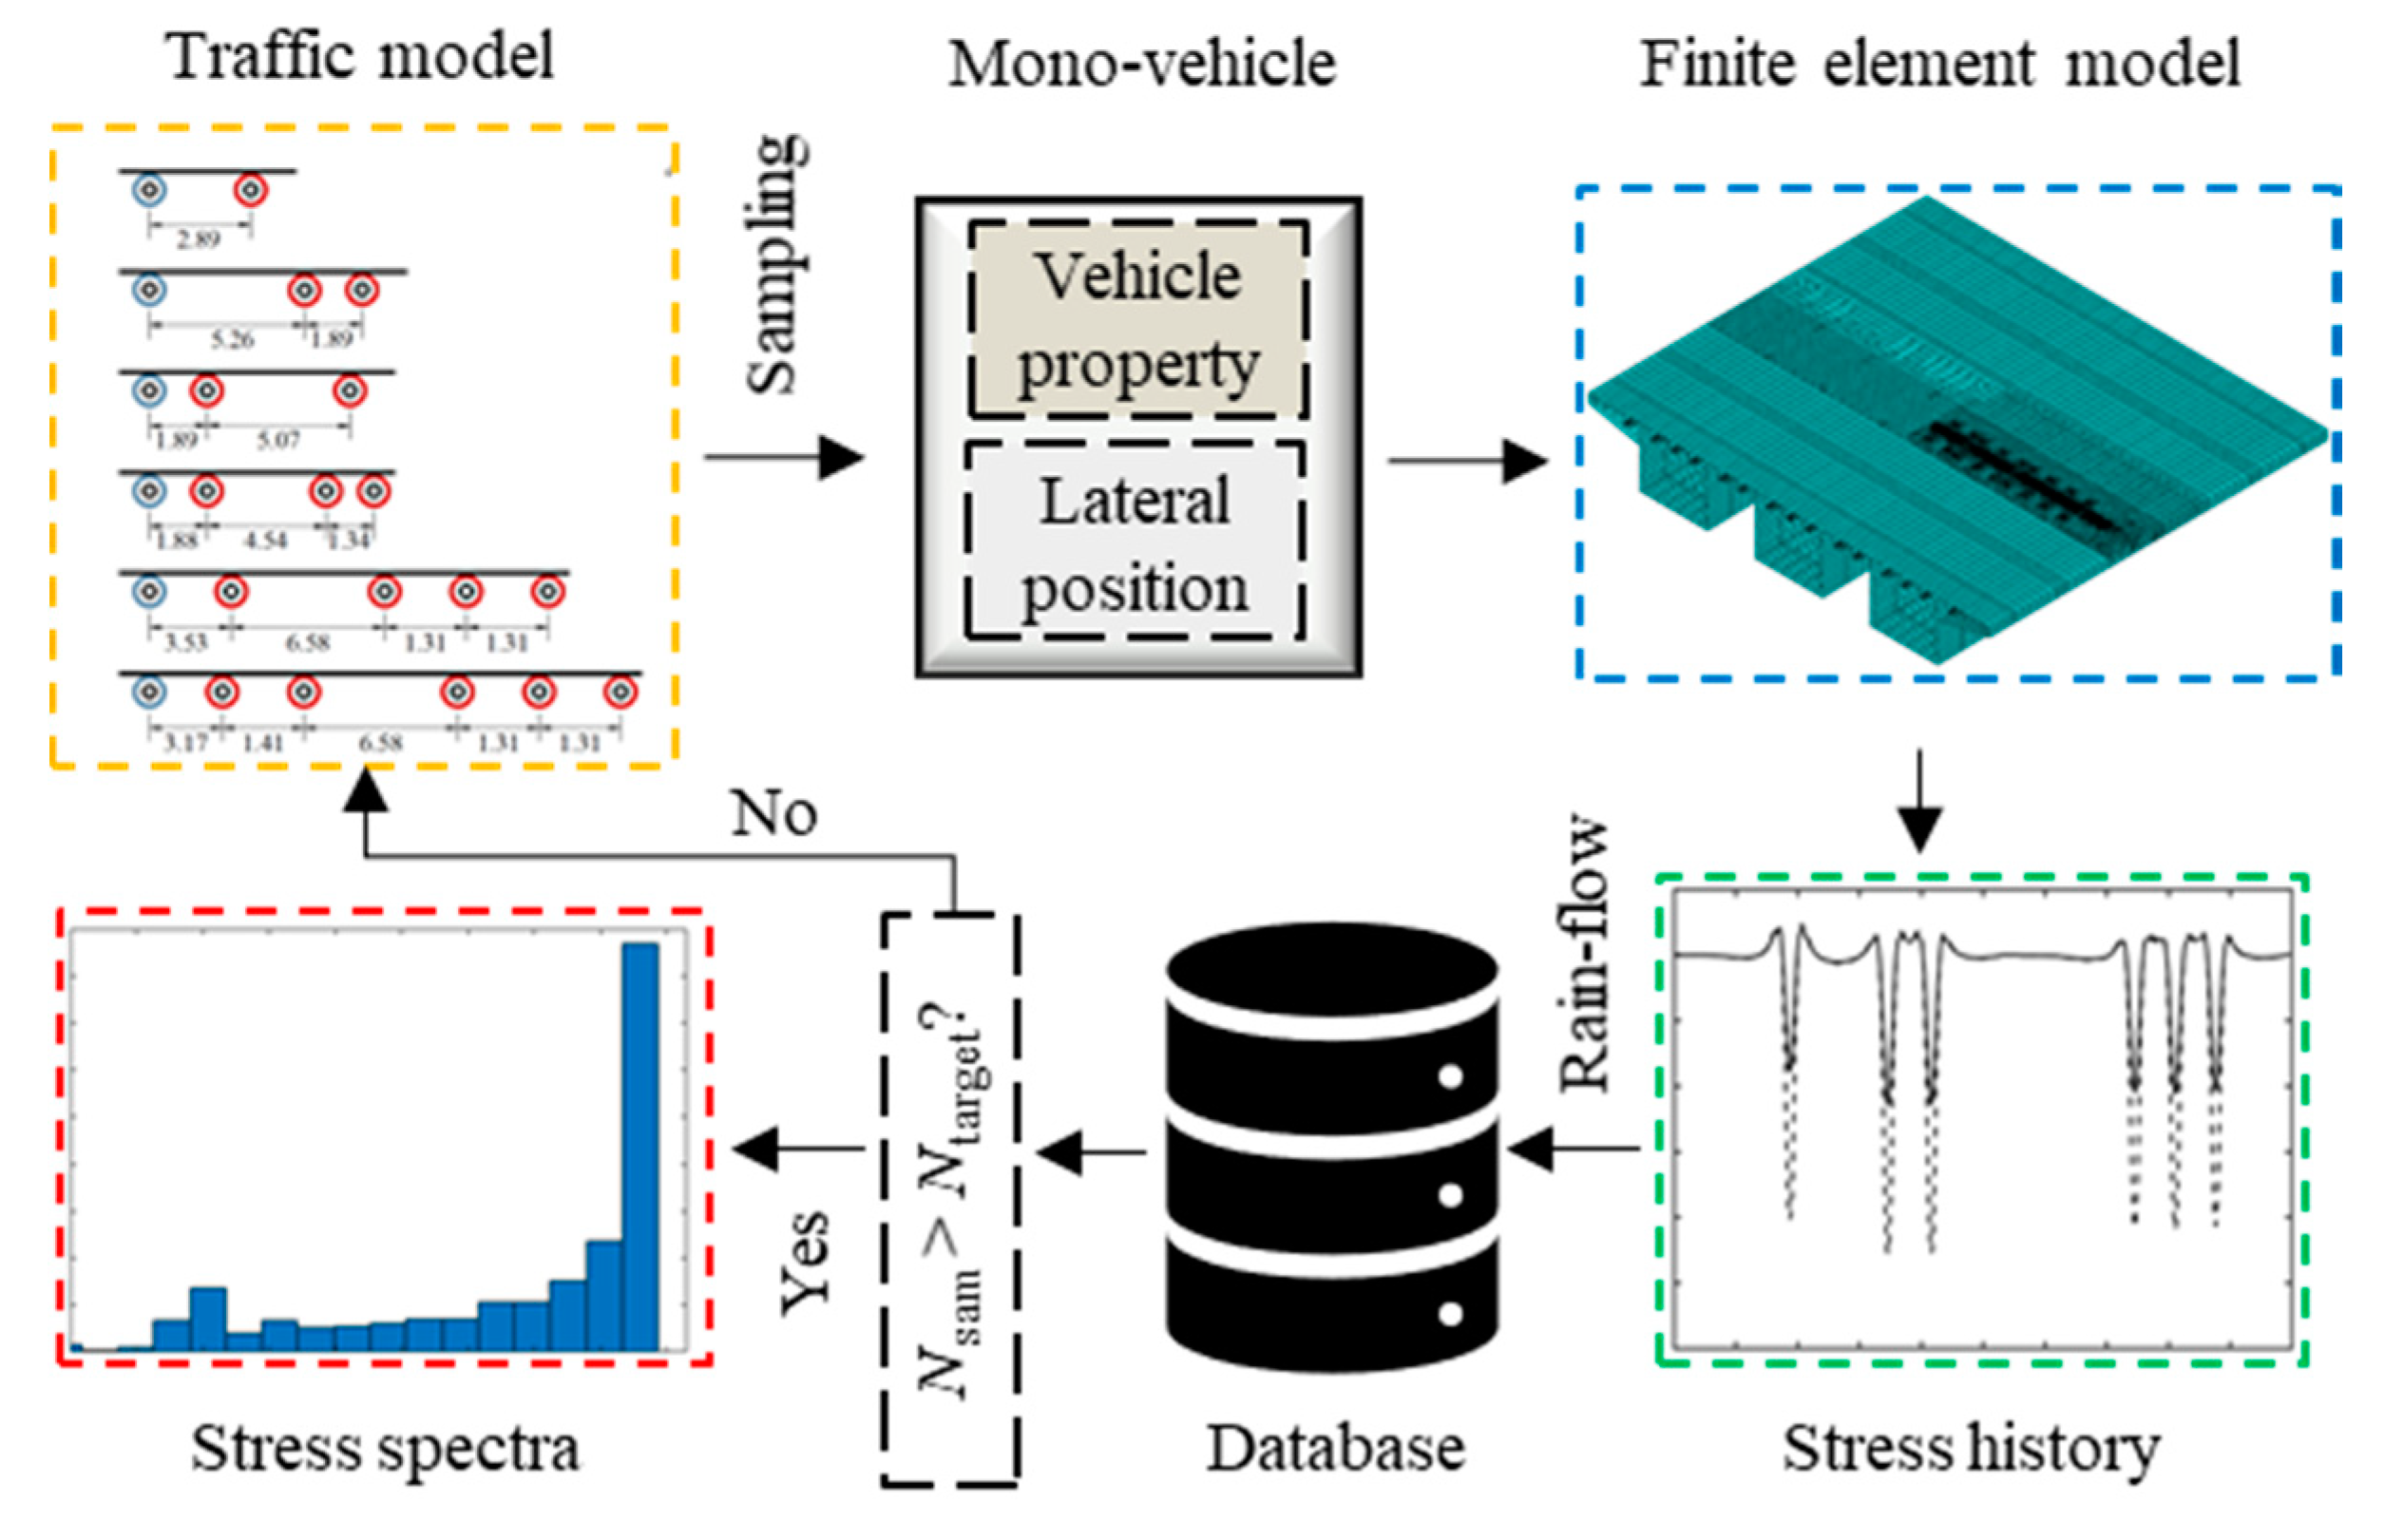
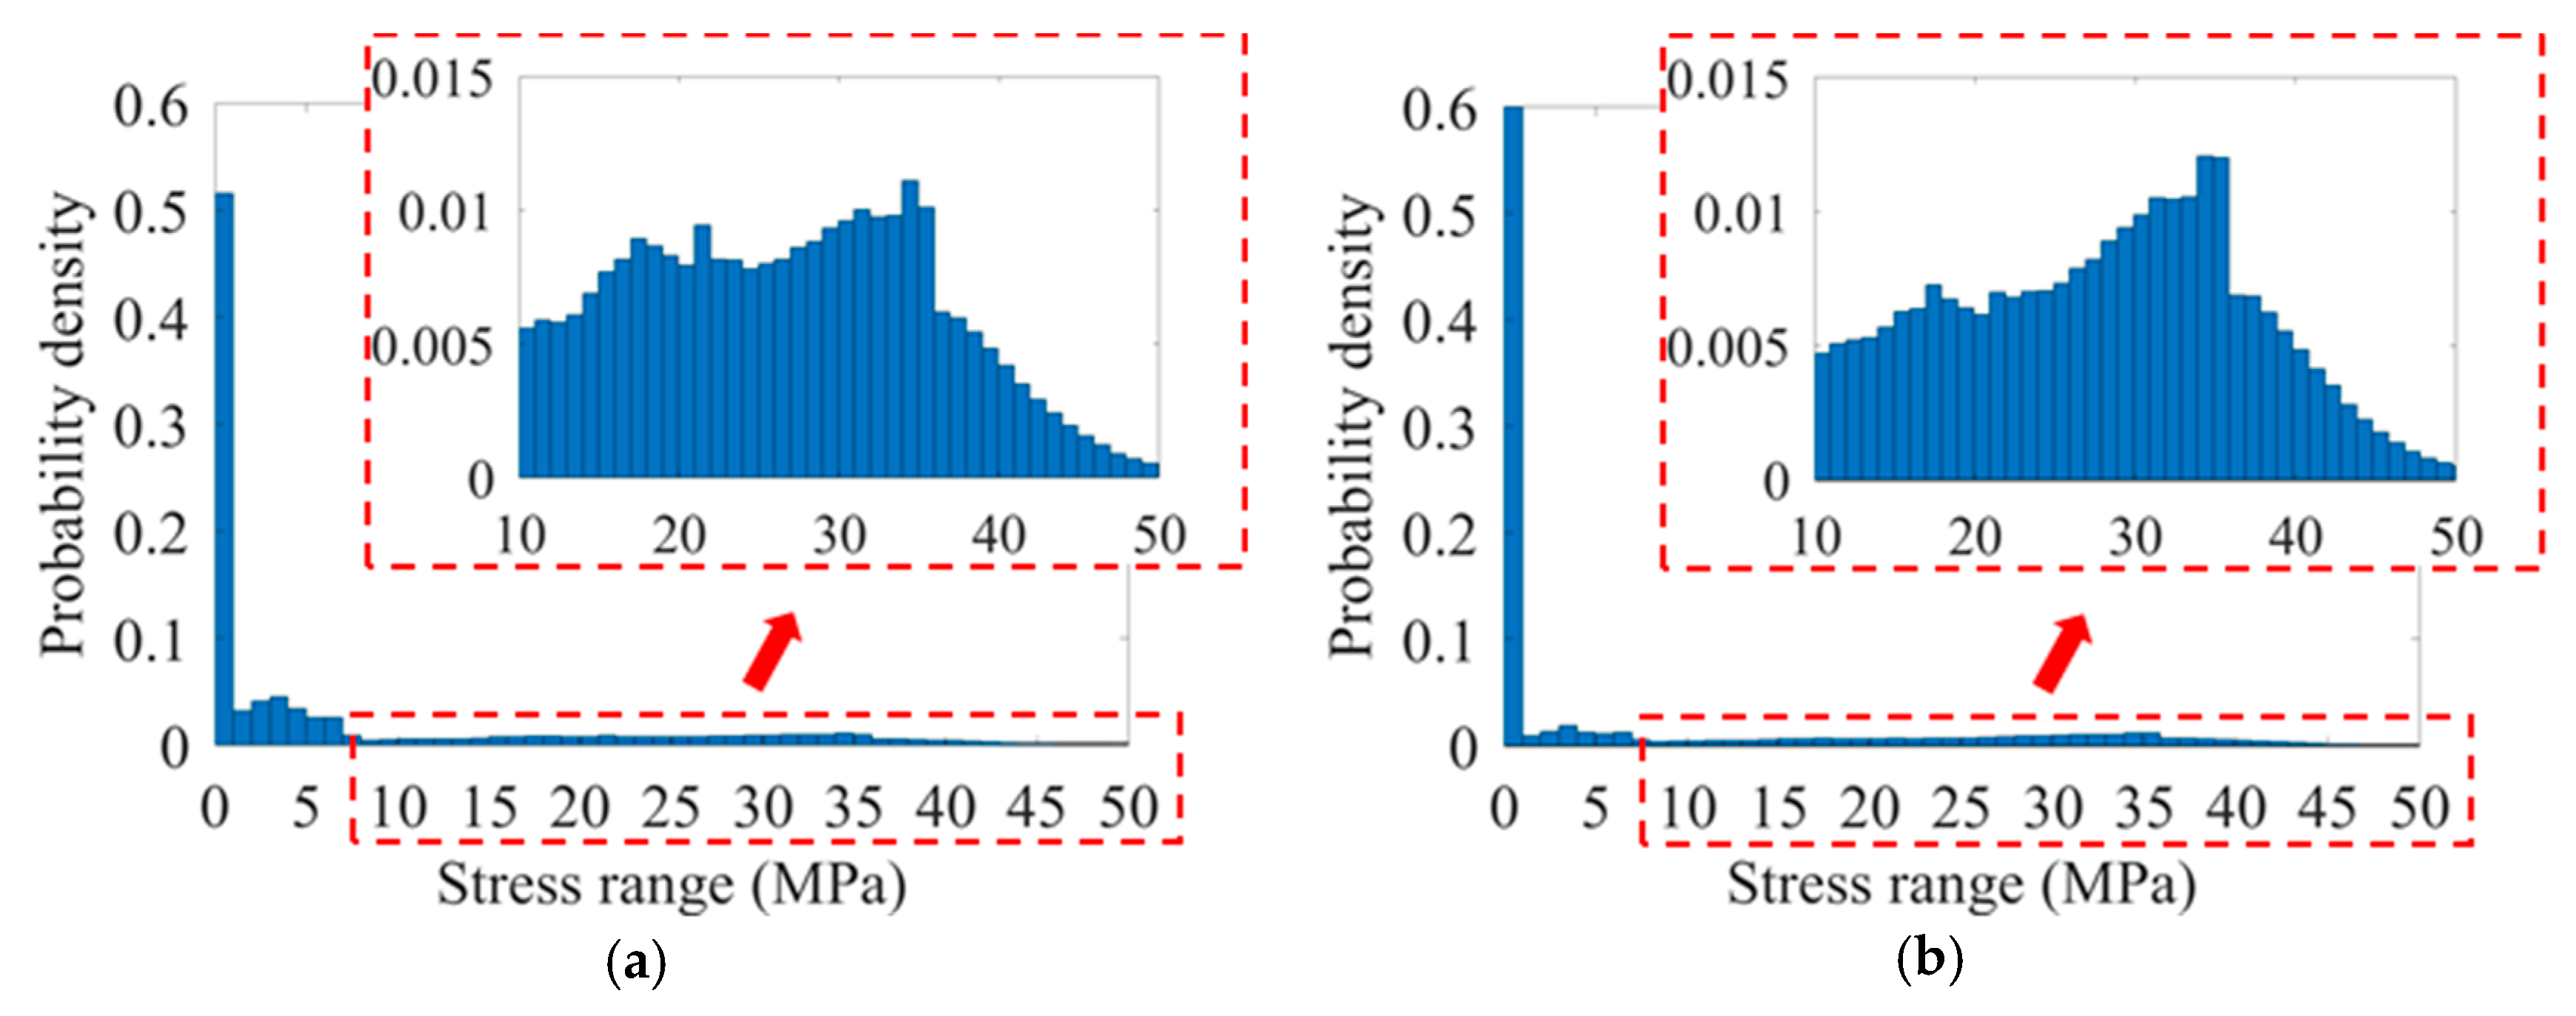
- A probabilistic framework was proposed to derive the stress spectra using the in-situ measurement data. In the derivation, a stochastic traffic model was applied to reflect the in-situ measurement of vehicles. Meanwhile, the multi-scale FE model of the selected prototype bridge was established to transfer the stochastic traffic into stress spectra. Through the large-scale sampling, the stress spectra of two critical RD joints were derived.
- (4)
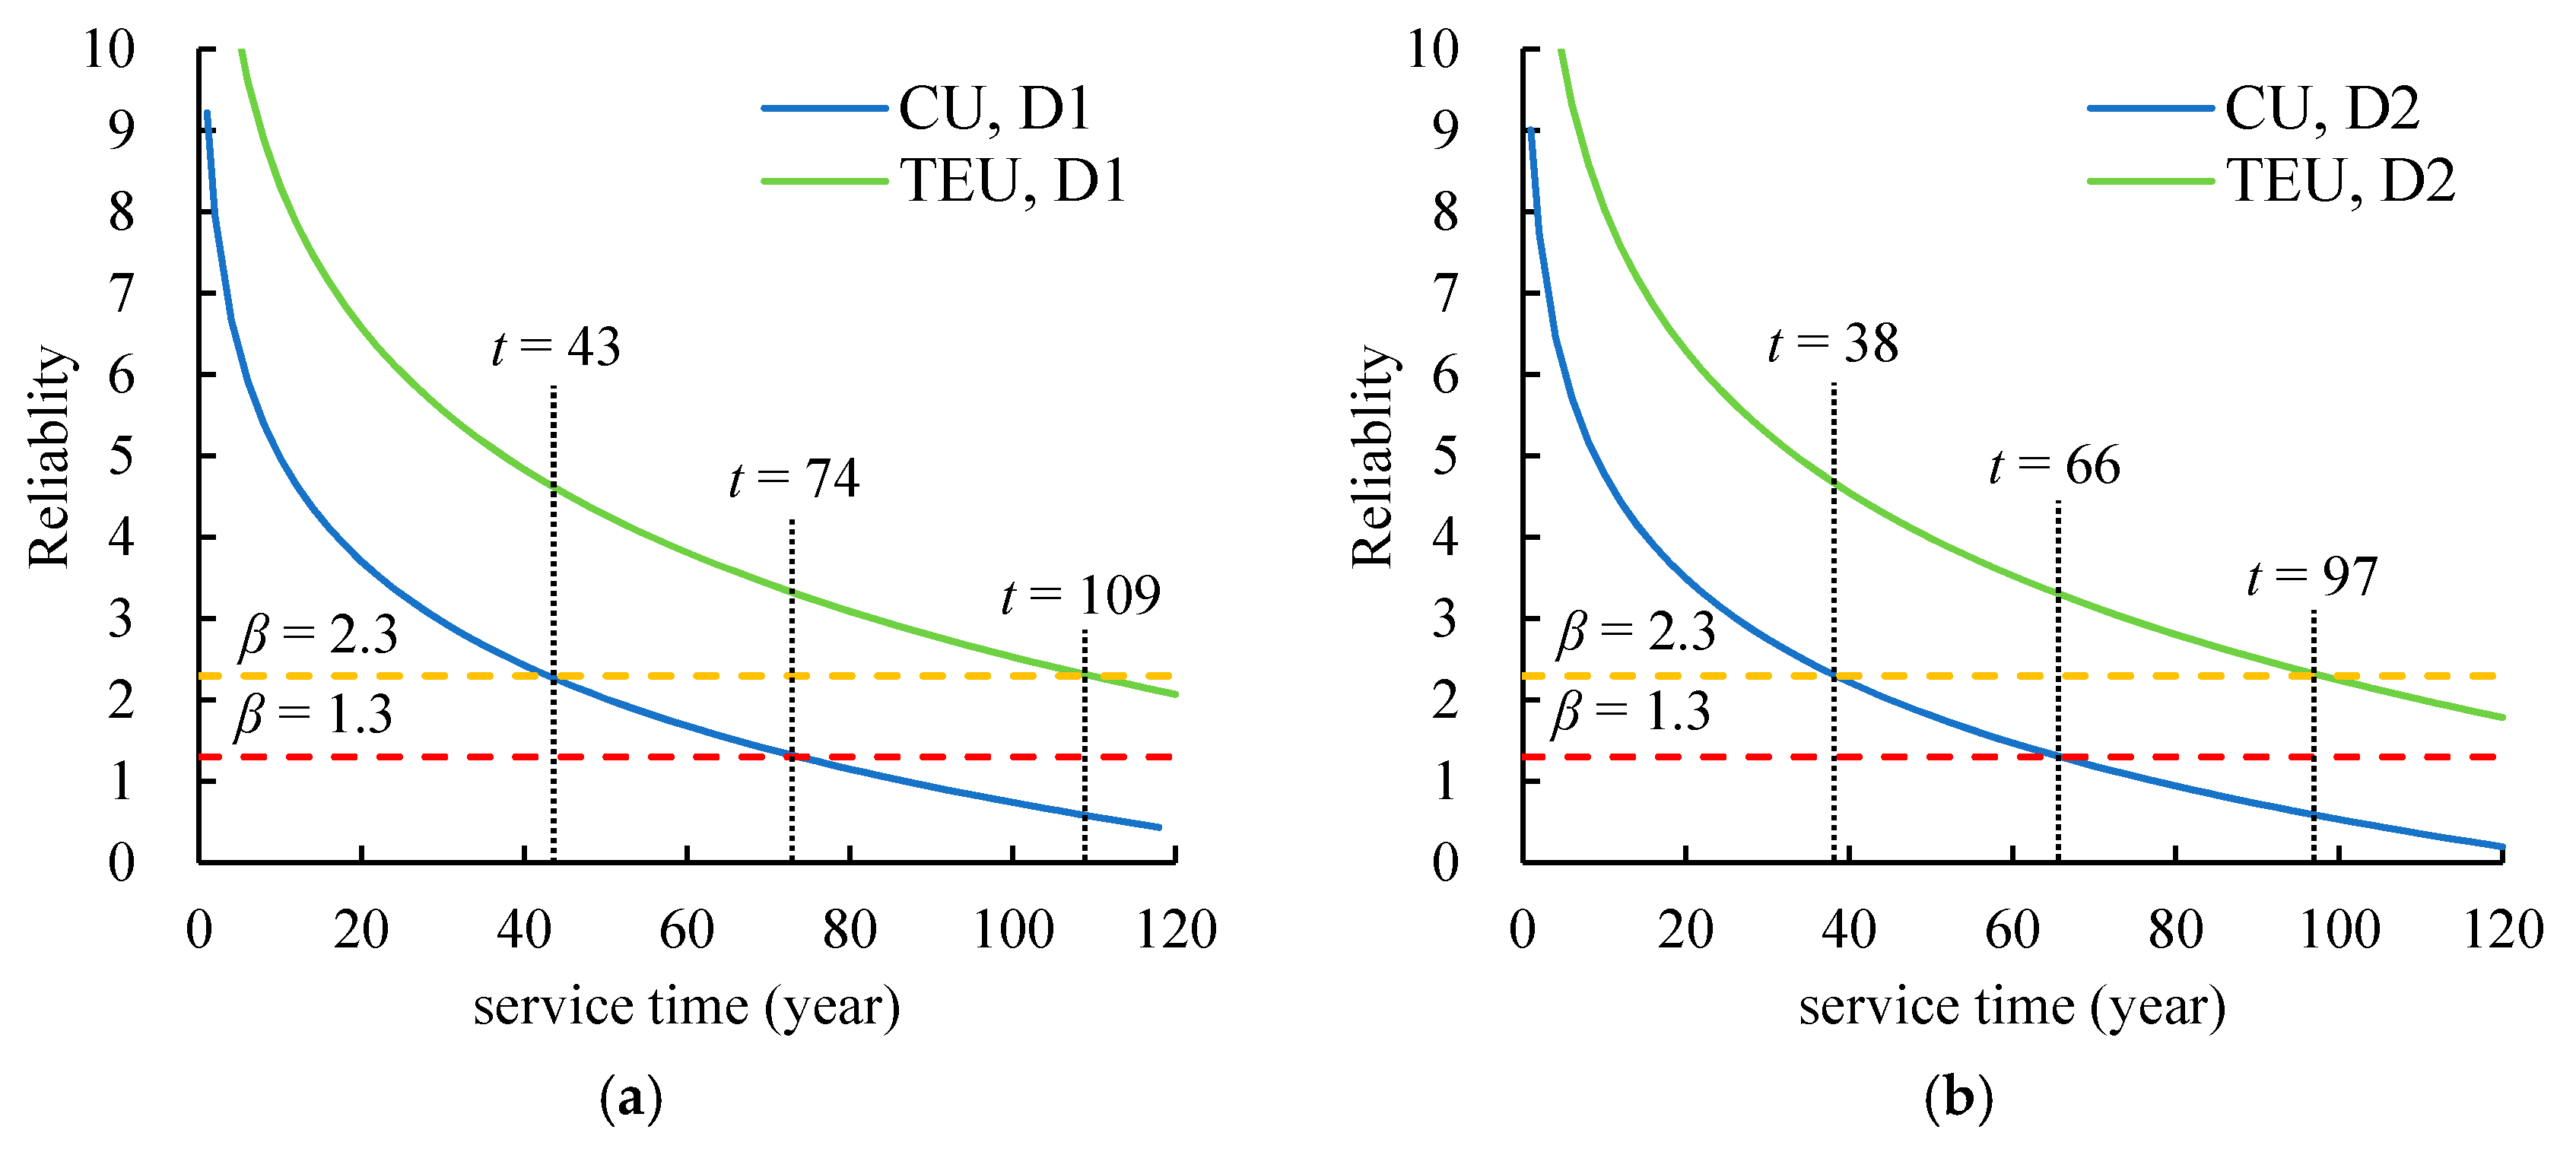
- Based on the S–N approach, the limit state function of fatigue cracking was established. Then, investigations were then performed on the fatigue reliability of the two critical RD joints selected, with the consideration of test data and in-situ measurements. The result indicated that the fatigue life of RD joints can be notably improved by using TEUs. For instance, under the target reliability of 2.3, the fatigue life of the two critical joints under the hot spot stress approach is increased by 153% and 155%, respectively. Meanwhile, the result also indicates the conservativeness of the hot spot stress approach over the nominal stress approach.
Author Contributions
Funding
Acknowledgments
Conflicts of Interest
References
- Connor, R.; Fisher, J.; Gatti, W.; Gopalaratnam, V.; Kozy, B.; Leshko, B.; Mc Quaid, D.L.; Medlock, R.; Mertz, D.; Murphy, T.; et al. Manual for Design, Construction, and Maintenance of Orthotropic Steel Deck Bridges; Federal Highway Administration: Washington, DC, USA, 2012.
- Wolchuk, R. Lessons from weld cracks in orthotropic decks on three European bridges. J. Struct. Eng. 1990, 116, 75–84. [Google Scholar] [CrossRef]
- Heng, J.; Zheng, K.; Kaewunruen, S.; Zhu, J.; Baniotopoulo, C. Dynamic Bayesian network-based system-level evaluation on fatigue reliability of orthotropic steel decks. Eng. Fail. Anal. 2019, 105, 1212–1228. [Google Scholar] [CrossRef]
- Fisher, J.W.; Roy, S. Fatigue of steel bridge infrastructure. Struct. Infrastruct. Eng. 2011, 7, 457–475. [Google Scholar] [CrossRef]
- Fisher, J.W.; Barsom, J.M. Evaluation of cracking in the rib-to-deck welds of the Bronx–Whitestone bridge. J. Bridge Eng. 2016, 21, 04015065. [Google Scholar] [CrossRef]
- Roy, S.; Mukherjee, S. Design and Fabrication of Orthotropic Deck Details; ATLSS Center, Lehigh University: Bethlehem, PA, USA, 2016. [Google Scholar]
- Wright, W. Orthotropic deck discussion group meeting. In Proceedings of the Orthotropic Bridge Design, Washington, DC, USA, 24 January 2011. [Google Scholar]
- Kolstein, M.H. Fatigue Classification of Welded Joints in Orthotropic Steel Bridge Decks; Delft University of Technology: Delft, The Netherlands, 2007. [Google Scholar]
- Haagensen, P.J.; Maddox, S.J. IIW Recommendations on Methods for Improving the Fatigue Strength of Welded Joints: IIW-2142-110; Woodhead Publishing: London, UK, 2013. [Google Scholar]
- Heng, J.; Zheng, K.; Gou, C.; Zhang, Y.; Bao, Y. Fatigue performance of rib-to-deck joints in orthotropic steel decks with thickened edge u-ribs. J. Bridge Eng. 2017, 22, 04017059. [Google Scholar] [CrossRef]
- Zhang, Q.; Li, J.; Yuan, D.; Bu, Y. Fatigue performance of rib-to-deck joint in orthotropic steel bridge deck with new type of both-side fillet welded joints. In Proceedings of the 40th IABSE Symposium, Nantes, France, 19–21 September 2018. [Google Scholar]
- Zhang, Q.; Liu, Y.; Bao, Y.; Jia, D.; Bu, Y.; Li, Q. Fatigue performance of orthotropic steel-concrete composite deck with large-size longitudinal U-shaped ribs. Eng. Struct. 2017, 150, 864–874. [Google Scholar] [CrossRef]
- Sim, H.B.; Uang, C.M.; Sikorsky, C. Effects of fabrication procedures on fatigue resistance of welded joints in steel orthotropic decks. J. Bridge Eng. 2009, 14, 366–373. [Google Scholar] [CrossRef]
- Ya, S.; Yamada, K.; Ishikawa, T. Fatigue evaluation of rib-to-deck welded joints of orthotropic steel bridge deck. J. Bridge Eng. 2011, 16, 492–499. [Google Scholar] [CrossRef]
- Meng, W.; Khayat, K.H.; Bao, Y. Flexural behaviors of fiber-reinforced polymer fabric reinforced ultra-high-performance concrete panels. Cem. Concr. Compo. 2018, 93, 43–53. [Google Scholar] [CrossRef]
- Liu, Y.; Zhang, Q.; Bao, Y.; Bu, Y. Static and fatigue push-out tests of short headed shear studs embedded in Engineered Cementitious Composites (ECC). Eng. Struct. 2019, 182, 29–38. [Google Scholar] [CrossRef]
- Liu, Y.; Zhang, Q.; Meng, W.; Bao, Y.; Bu, Y. Transverse fatigue behaviour of steel-UHPC composite deck with large-size U-ribs. Eng. Struct 2019, 180, 388–899. [Google Scholar] [CrossRef]
- Heng, J.; Zheng, K.; Kaewunruen, S.; Zhu, J.; Baniotopoulos, C. Probabilistic fatigue assessment of rib-to-deck joints using thickened edge U-ribs. Steel Compos. Struct. 2020, in press. [Google Scholar]
- Heng, J.; Zheng, K.; Zhang, Y.; Wang, Y. Enhancing fatigue performance of rib-to-deck joints in orthotropic steel decks using thickened edge U-ribs. In Proceedings of the Structures Congress 2018, Fort Worth, TX, USA, 19–21 April 2018. [Google Scholar]
- European Committee for Standardization (CEN). BS EN 1993:2005 Eurocode 3: Design of Steel Structures; CEN: Brussels, Belgium, 2005. [Google Scholar]
- American Association of State Highway and Transportation Officials (AASHTO). AASHTO LRFD Bridge Design Specifications, 6th ed.; AASHTO: Washington, DC, USA, 2012. [Google Scholar]
- Ministry of Transport of China (MOT). JTG D64-2015 Specifications for Design of Highway Steel Bridge; MOT: Beijing, China, 1 October 2015. (In Chinese)
- Zhu, J.; Zhang, W. Probabilistic fatigue damage assessment of coastal slender bridges under coupled dynamic loads. Eng. Struct. 2018, 166, 274–285. [Google Scholar] [CrossRef]
- Guo, T.; Frangopol, D.M.; Chen, Y. Fatigue reliability assessment of steel bridge details integrating weigh-in-motion data and probabilistic finite element analysis. Comput. Struct. 2012, 112–113, 245–257. [Google Scholar] [CrossRef]
- Fan, L.; Bao, Y.; Meng, W.; Chen, G. In-situ monitoring of corrosion-induced expansion and mass loss of steel bar in steel fiber reinforced concrete using a distributed fiber optic sensor. Compos. Part B-Eng. 2019, 165, 679–689. [Google Scholar] [CrossRef]
- Wu, M.; Zhu, J.; Heng, J.; Kaewunruen, S. Fatigue assessment on suspenders under stochastic wind and traffic loads based on in-situ monitoring data. Appl. Sci. 2019, 9, 3405. [Google Scholar] [CrossRef]
- Heng, J.; Zheng, K.; Kaewunruen, S.; Baniotopoulos, C. Stochastic traffic-based fatigue life assessment of rib-to-deck welding joints in orthotropic steel decks with thickened edge U-ribs. Appl. Sci. 2019, 9, 2582. [Google Scholar] [CrossRef]
- Tsakopoulos, P.A.; Fisher, J.W. Full-scale fatigue tests of steel orthotropic deck panel for the Bronx–Whitestone Bridge rehabilitation. Bridge Struct. 2005, 1, 55–66. [Google Scholar] [CrossRef]
- Zeng, Z. Classification and reasons of typical fatigue cracks in orthotropic steel deck. Steel Constr. 2011, 2, 9–15. (In Chinese) [Google Scholar]
- Kozy, B.; Connor, R. Fatigue Design of Orthotropic Steel Bridges. In Proceedings of the Structures Congress 2010, Orlando, FL, USA, 12–15 May 2010; pp. 541–550. [Google Scholar]
- Standardization Administration of the People’s Republic of China (SAC). GB/T 714-2008: Structural Steel for Bridge; Standards Press of China: Beijing, China, 2008. (In Chinese)
- Standardization Administration of the People’s Republic of China (SAC). GB/T 10045-2001: Carbon Steel Flux Cored Electrodes for Arc Welding; Standards Press of China: Beijing, China, 2001. (In Chinese)
- American Welding Society (AWS). AWS A5.20/A5.20M: 2005 Specification for Carbon Steel Electrodes for Flux Cored Arc Welding; AWS: Miami, FL, USA, 2005. [Google Scholar]
- MTS Systems Corporation. Mechanical Testing System; Eden Prairie, MN, USA. Available online: https://www.mts.com/ (accessed on 1 October 2019).
- Niemi, E.; Fricke, W.; Maddox, S.J. Fatigue Analysis of Welded Components: Designer’s Guide to the Structural Hot-Spot Stress Approach, 2nd ed.; Springer: Singapore, 2015. [Google Scholar]
- Hobbacher, A. Recommendations for Fatigue Design of Welded Joints and Components, 2nd ed.; Springer: Berlin, Germany, 2015. [Google Scholar]
- British Standards Institution (BSI). BS 7910: 2013+A1:2015 Guide to Methods for Assessing the Acceptability of flaws in Metallic Structures; BSI Standards Limited: London, UK, 2015. [Google Scholar]
- Wirsching, P.; Chen, Y. Considerations of probability-based fatigue design for marine structures. Mar. Struct. 1988, 1, 23–45. [Google Scholar] [CrossRef]
- Liu, Z.; Guo, T.; Chai, S. Probabilistic fatigue life prediction of bridge cables based on multiscaling and mesoscopic fracture mechanics. Appl. Sci. 2016, 6, 99. [Google Scholar] [CrossRef]
- Guo, T.; Liu, Z.; Zhu, J. Fatigue reliability assessment of orthotropic steel bridge decks based on probabilistic multi-scale finite element analysis. Steel Constr. 2015, 11, 334–346. [Google Scholar]
- Guo, T.; Liu, Z.; Pan, S.; Pan, Z. Cracking of longitudinal diaphragms in long-span cable-stayed bridges. J. Bridge Eng. 2015, 20, 04015011. [Google Scholar] [CrossRef]
- European Committee for Standardization (CEN). BS EN 1991-2 Eurocode 1: Actions on Structure, Part 2: Traffic Load on Bridges; CEN: Brussels, Belgium, 2003. [Google Scholar]
- ANSYS Inc. ANSYS Software; ANSYS Inc.: Canonsburg, PA, USA; Available online: https://www.ansys.com/ (accessed on 1 October 2019).
- ANSYS Inc. ANSYS Mechanical APDL Element Reference; ANSYS Inc.: Canonsburg, PA, USA, 2018. [Google Scholar]
- ANSYS Inc. ANSYS Mechanical APDL Advanced Analysis Guide; ANSYS Inc.: Canonsburg, PA, USA, 2018. [Google Scholar]
- Amzallag, C.; Gerey, J.; Robert, J.; Bahuaud, J. Standardization of the rainflow counting method for fatigue analysis. Int. J. Fatigue 1994, 16, 287–293. [Google Scholar] [CrossRef]
- Zhang, Q.; Cui, C.; Bu, Y.; Li, Q. Study on fatigue features of orthotropic decks in steel box girder of the Hong Kong-Zhuhai-Macao Bridge. China Civil Eng. J. 2014, 47, 110–119. [Google Scholar]
- Joint Committee on Structural Safety (JCSS). Probabilistic Model Code, Part 1: Basis of Design; JCCS: Aalborg, Denmark, 2000. [Google Scholar]


| CODE | Maximum Load | Minimum Load | Range of Loads |
|---|---|---|---|
| CU6 | 15 | 50 | 35 |
| CU7 | 15 | 50 | 35 |
| TEU7 | 15 | 50 | 35 |
| TEU8 | 18 | 60 | 42 |
| TEU9 | 19 | 65 | 46 |
| TEU10 | 19 | 65 | 46 |
| TEU11 | 22 | 74 | 52 |
| CODE | Measured Stress Range (MPa) | Failure Cycles (×104) | Equivalent Fatigue Strength (MPa) | Average Equivalent Fatigue Strength (MPa) | |||
|---|---|---|---|---|---|---|---|
| Nominal | Hot Spot | Nominal | Hot Spot | Nominal | Hot Spot | ||
| CU1 * | 81 | 98 | 269 | 89 | 108 | 103 (13.0) 1 | 128 (12.5) |
| CU2 * | 103 | 121 | 255 | 112 | 131 | ||
| CU3 * | 123 | 149 | 91 | 95 | 115 | ||
| CU4 * | 58 | 81 | 824 | 93 | 130 | ||
| CU5 * | 81 | 113 | 314 | 94 | 131 | ||
| CU6 | 115 | 135 | 206 | 116 | 136 | ||
| CU7 | 111 | 132 | 263 | 121 | 145 | ||
| TEU1 * | 114 | 144 | 147 | 103 | 130 | 125 (14.1) | 155 (14.9) |
| TEU2 * | 119 | 146 | 162 | 111 | 136 | ||
| TEU3 * | 125 | 154 | 234 | 132 | 162 | ||
| TEU4 * | 129 | 153 | 193 | 127 | 151 | ||
| TEU5 * | 78 | 113 | 648 | 115 | 167 | ||
| TEU6 * | 106 | 131 | 223 | 110 | 136 | ||
| TEU7 | 114 | 144 | 333 | 135 | 171 | ||
| TEU8 | 139 | 160 | 204 | 140 | 161 | ||
| TEU9 | 151 | 187 | 129 | 130 | 162 | ||
| TEU10 | 147 | 170 | 210 | 149 | 173 | ||
| TEU11 | 174 | 211 | 75 | 125 | 152 | ||
| Parameter | Type | CU Specimens | TEU Specimens | |||
|---|---|---|---|---|---|---|
| Nominal | Hot Spot | Nominal | Hot Spot | |||
| Mean (×1012) | Lognormal | 2.271 | 4.299 | 4.068 | 7.586 | |
| COV | 0.590 | 0.482 | 0.329 | 0.273 | ||
| ∆ | Mean | Lognormal | 1.0 | |||
| COV | 0.3 | |||||
| Mean | Deterministic | 3.0 | ||||
| Model | Property | Description |
|---|---|---|
| Vehicle model | Axle number | The number of axles in a vehicle |
| Axle spacing | The distance between the center of axles | |
| Axle weight | The weight of each axle in a vehicle | |
| Axle track | The distance between wheels in the same axle | |
| Footprint | The contact area of wheels on the deck | |
| Lateral distribution | Occupancy rate | The distribution of the vehicle in different lanes |
| In-lane position | The lateral position of the vehicle within a lane |
© 2019 by the authors. Licensee MDPI, Basel, Switzerland. This article is an open access article distributed under the terms and conditions of the Creative Commons Attribution (CC BY) license (http://creativecommons.org/licenses/by/4.0/).
Share and Cite
Zheng, K.; Feng, X.; Heng, J.; Zhu, J.; Zhang, Y. Fatigue Reliability Analysis of Rib-To-Deck Joints Using Test Data and In-Situ Measurements. Appl. Sci. 2019, 9, 4820. https://doi.org/10.3390/app9224820
Zheng K, Feng X, Heng J, Zhu J, Zhang Y. Fatigue Reliability Analysis of Rib-To-Deck Joints Using Test Data and In-Situ Measurements. Applied Sciences. 2019; 9(22):4820. https://doi.org/10.3390/app9224820
Chicago/Turabian StyleZheng, Kaifeng, Xiaoyang Feng, Junlin Heng, Jin Zhu, and Yu Zhang. 2019. "Fatigue Reliability Analysis of Rib-To-Deck Joints Using Test Data and In-Situ Measurements" Applied Sciences 9, no. 22: 4820. https://doi.org/10.3390/app9224820
APA StyleZheng, K., Feng, X., Heng, J., Zhu, J., & Zhang, Y. (2019). Fatigue Reliability Analysis of Rib-To-Deck Joints Using Test Data and In-Situ Measurements. Applied Sciences, 9(22), 4820. https://doi.org/10.3390/app9224820