Abstract
Three-dimensional (3D) reconstruction techniques are increasingly used to obtain 3D representations of buildings due to the broad range of applications for 3D city models related to sustainability, efficiency and resilience (i.e., energy demand estimation, estimation of the propagation of noise in an urban environment, routing and accessibility, flood or seismic damage assessment). With advancements in airborne laser scanning (ALS), 3D modeling of urban topography has increased its potential to automatize extraction of the characteristics of individual buildings. In 3D building modeling from light detection and ranging (LIDAR) point clouds, one major challenging issue is how to efficiently and accurately segment building regions and extract rooftop features. This study aims to present an investigation and critical comparison of two different fully automatic roof segmentation approaches for 3D building reconstruction. In particular, the paper presents and compares a cluster-based roof segmentation approach that uses (a) a fuzzy c-means clustering method refined through a density clustering and connectivity analysis, and (b) a region growing segmentation approach combined with random sample consensus (RANSAC) method. In addition, a robust 2.5D dual contouring method is utilized to deliver watertight 3D building modeling from the results of each proposed segmentation approach. The benchmark LIDAR point clouds and related reference data (generated by stereo plotting) of 58 buildings over downtown Toronto (Canada), made available to the scientific community by the International Society for Photogrammetry and Remote Sensing (ISPRS), have been used to evaluate the quality of the two proposed segmentation approaches by analysing the geometrical accuracy of the roof polygons. Moreover, the results of both approaches have been evaluated under different operating conditions against the real measurements (based on archive documentation and celerimetric surveys realized by a total station system) of a complex building located in the historical center of Matera (UNESCO world heritage site in southern Italy) that has been manually reconstructed in 3D via traditional Building Information Modeling (BIM) technique. The results demonstrate that both methods reach good performance metrics in terms of geometry accuracy. However, approach (b), based on region growing segmentation, exhibited slightly better performance but required greater computational time than the clustering-based approach.
1. Introduction
Significant acceleration of the urbanization rate is contributing to a persistent vertical expansion in many cities in order to meet the increasing demand for living and working space [1]. In this context, the three-dimensional form of a city has important implications for a city’s sustainability, efficiency, and resilience [2]. Considering the expected urban expansion in the near future across the globe [3], understanding the relation between the three-dimensional urban form, critical infrastructure operations, and quality-of-life measures is one of the most important research and technical challenges. The growing interest in generating 3D city models is motivated by a broad range of applications, such as estimation of solar irradiation, energy demand estimation, classification of building types, visibility analysis, 3D cadastre, visualization for navigation, urban planning, emergency response, computation fluid dynamics, change detection, flooding, archaeology, forest management, and virtual tours [4].
Moreover, a decrease in the cost of remote sensing technology and data storage in recent years has contributed to the expansion of urban morphology studies [4,5]. In particular, the emergence of airborne laser, a leading technology for the extraction of information about physical surfaces, enables substantial advances of in-depth availability of data on buildings and infrastructure, as well as over large scales. By directly providing measurements of surface heights with high point density and high level of accuracy, light detection and ranging (LIDAR) technology can improve the automation level in accurate and efficient 3D reconstruction of urban models [6,7,8,9]. The 3D information about buildings and related structures that can be retrieved from the data acquired by airborne LIDAR is usually characterized by directness and simplicity. However, practice shows that the massive number of points requires introducing some level of organization into the data before extraction of information can become effective (e.g., aggregating points with similar features into segments in the form of surfaces) [10]. Therefore, producing 3D building reconstruction by manual or semi-automatic methods could be a very time consuming and challenging task. Hence, the generation of 3D building models in a simple and quick way is becoming attractive [11]. Indeed, in the last decade, the automatic 3D reconstruction of buildings from airborne data is an active area of research among photogrammetry, computer graphics, and remote sensing communities [3,5,12,13,14].
Among the great variety of reconstruction methods from airborne laser scanning (ALS) proposed in literature (see [3] for a complete review), the data-driven polyhedral method is one of the most commonly used rooftop modeling techniques and can be adapted for generating building models with both simple and complex roof topology [5]. Moreover, polyhedron buildings are quite common in urban areas [7]. These methods use a bottom-up approach that begins with the extraction of primitives (e.g., planes, cylinders, cones and spheres), followed by analysing primitive topology in 3D space, extracting and grouping them to form building models. In summary, the problem of building rooftop reconstruction based on a data-driven framework is transformed into a problem of consistency maintenance of topological relationships among rooftop primitives, primitive boundaries or their combinations: The common assumption is that the building has only planar roofs, based on which various model detection methods in pattern recognition can be adopted for building extraction.
The 3D reconstruction process from airborne LIDAR data is principally based on the segmentation of the raw data sets into building points; the segmentation refers to the task of dividing data into non-overlap homogeneous regions that constitute the complete data sets [7]. The efficiency and accuracy of the segmentation method results are one of the major challenges in 3D building reconstruction. Region growing methods and the clustering algorithm are the most used in literature for segmentation purpose. Region growing approaches (e.g., [15]) usually start with a selected seed point, calculate its properties, and compare them with adjacent points based on certain connectivity measures to form the region. Alternatively, the cluster techniques (e.g., [7,11]) first summarize the variability in the data by computing the attributes for all points and then group data that cluster together. Each point in the point cloud is classified into one of the clusters of predefined number based on its distances to the clusters’ centroid. Other approaches, such as the Hough Transform [16] and random sample consensus (RANSAC) [17], can be used to extract straight lines from boundary points. Finally, the voxel-based algorithm (e.g., [18]) divides a point cloud into voxels with equal size, then the neighboring voxels with elevation differences of less than a threshold are classified iteratively into the same subset and segmented from other points.
This study aims to present an investigation and critical comparison of two different fully automatic approaches for roof segmentation used in 3D building reconstruction. In particular, we present a stable solution approach (a), described in Section 2.1, for building roof extraction based on a fuzzy c-means [19] that uses a potential-based clustering method for initial clusters center determination and clusters number determination [20,21]. At the end of the clustering processes, a density-based and connectivity analysis, as proposed by [7], is used to improve the results of the above clustering process through separation of the planar and coplanar planes. Moreover, a second approach (b), based on a region growing segmentation method [22] using smoothness constrain and curvature consistency refined with application of RANSAC [23] to remove any potential over-segmentation issues, is described in Section 2.2.
The roofs extracted by these two segmentation approaches were used for 3D building reconstruction. After the extraction of the boundary points, as described in [24], a 2.5D dual-contouring approach, proposed by [25], was adopted to create vertical walls connecting the extracted rooftops to the ground.
Both the proposed approaches have been evaluated (Section 3) in terms of geometry accuracy against the real measurements in two different case studies (in terms of types of urban development and ALS data input data resolution) in Matera (Italy) and Toronto (Canada). The results indicate that both approaches have precisely reconstructed the geometric features of the test building preserving topology. In particular, the approach (b) based on region growing segmentation has exhibited slightly better performance but required a computational time that is double that of the clustering-based approach (a). Finally, Section 4 presents the conclusion and main remarks on the investigation presented in this paper.
2. Materials and Methods
This section describes in detail the data used in this study (see Section 2.1) and the steps of the workflow pipeline used in the two proposed fully automatic segmentation approaches (see Section 2.2 and Section 2.3) that process airborne LIDAR point cloud data for the purpose of building modeling and 3D reconstruction, as described in the Section 2.3.
2.1. LIDAR Data Set
The first data set was captured over downtown Toronto (Canada). Optech’s ALTM-ORIONM was used to acquire the ALS data at a flying height of 650 m in six strips with a point density of about 6 points/m2. The area contains a mixture of low- and high-storey (58) buildings, showing various degrees of complexity in rooftop structures. The reference for building detection and for 3D building reconstruction was generated by stereo plotting. The accuracy of well-defined points is 20 cm in planimetry and 15 cm in height. For more details, refer to [26] and the web site of the test [27]. The scene also contains trees and other urban objects.
The second data set was captured over a complex building in downtown Matera (Italy). The LIDAR survey in the historical center of Matera (Italy) (Figure 1a,b) was carried out by GEOCART S.p.A. using a full-waveform scanner [28], RIEGL LMS-Q560 on board a helicopter to obtain a higher spatial resolution. The flight was operated with a share of around 400 m, a speed of 25.7 m/s, and an opening angle at 60°. The scanner acquired data in the direction SN–EW, with a divergence of the radius 0.5 mrad, and a pulse repetition rate at 180,000 Hz. The average point density value of the dataset was about 30 points/m2. The accuracy was 25 cm in x, y and 10 cm in z (altitude). The raw data of a small tile extracted by the survey have been orthorectified and radiometrically corrected in order to provide a ready-to-use point cloud to realize as output a group of watertight mesh models that could be used for various applications, such as energy demand estimation, classification of building types, visibility analysis, 3D cadastre, visualization for navigation, urban planning, emergency response, or flooding [4]. The LIDAR data is provided as a group of unorganized discrete points in which each individual point has x, y and z value, plus the intensity value that represents the reflective proprieties of surface encountering (Figure 1b).
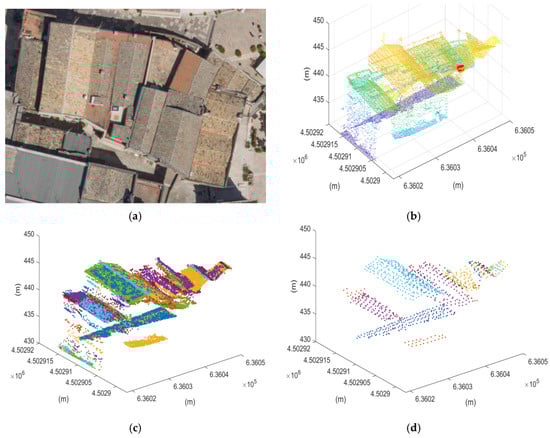
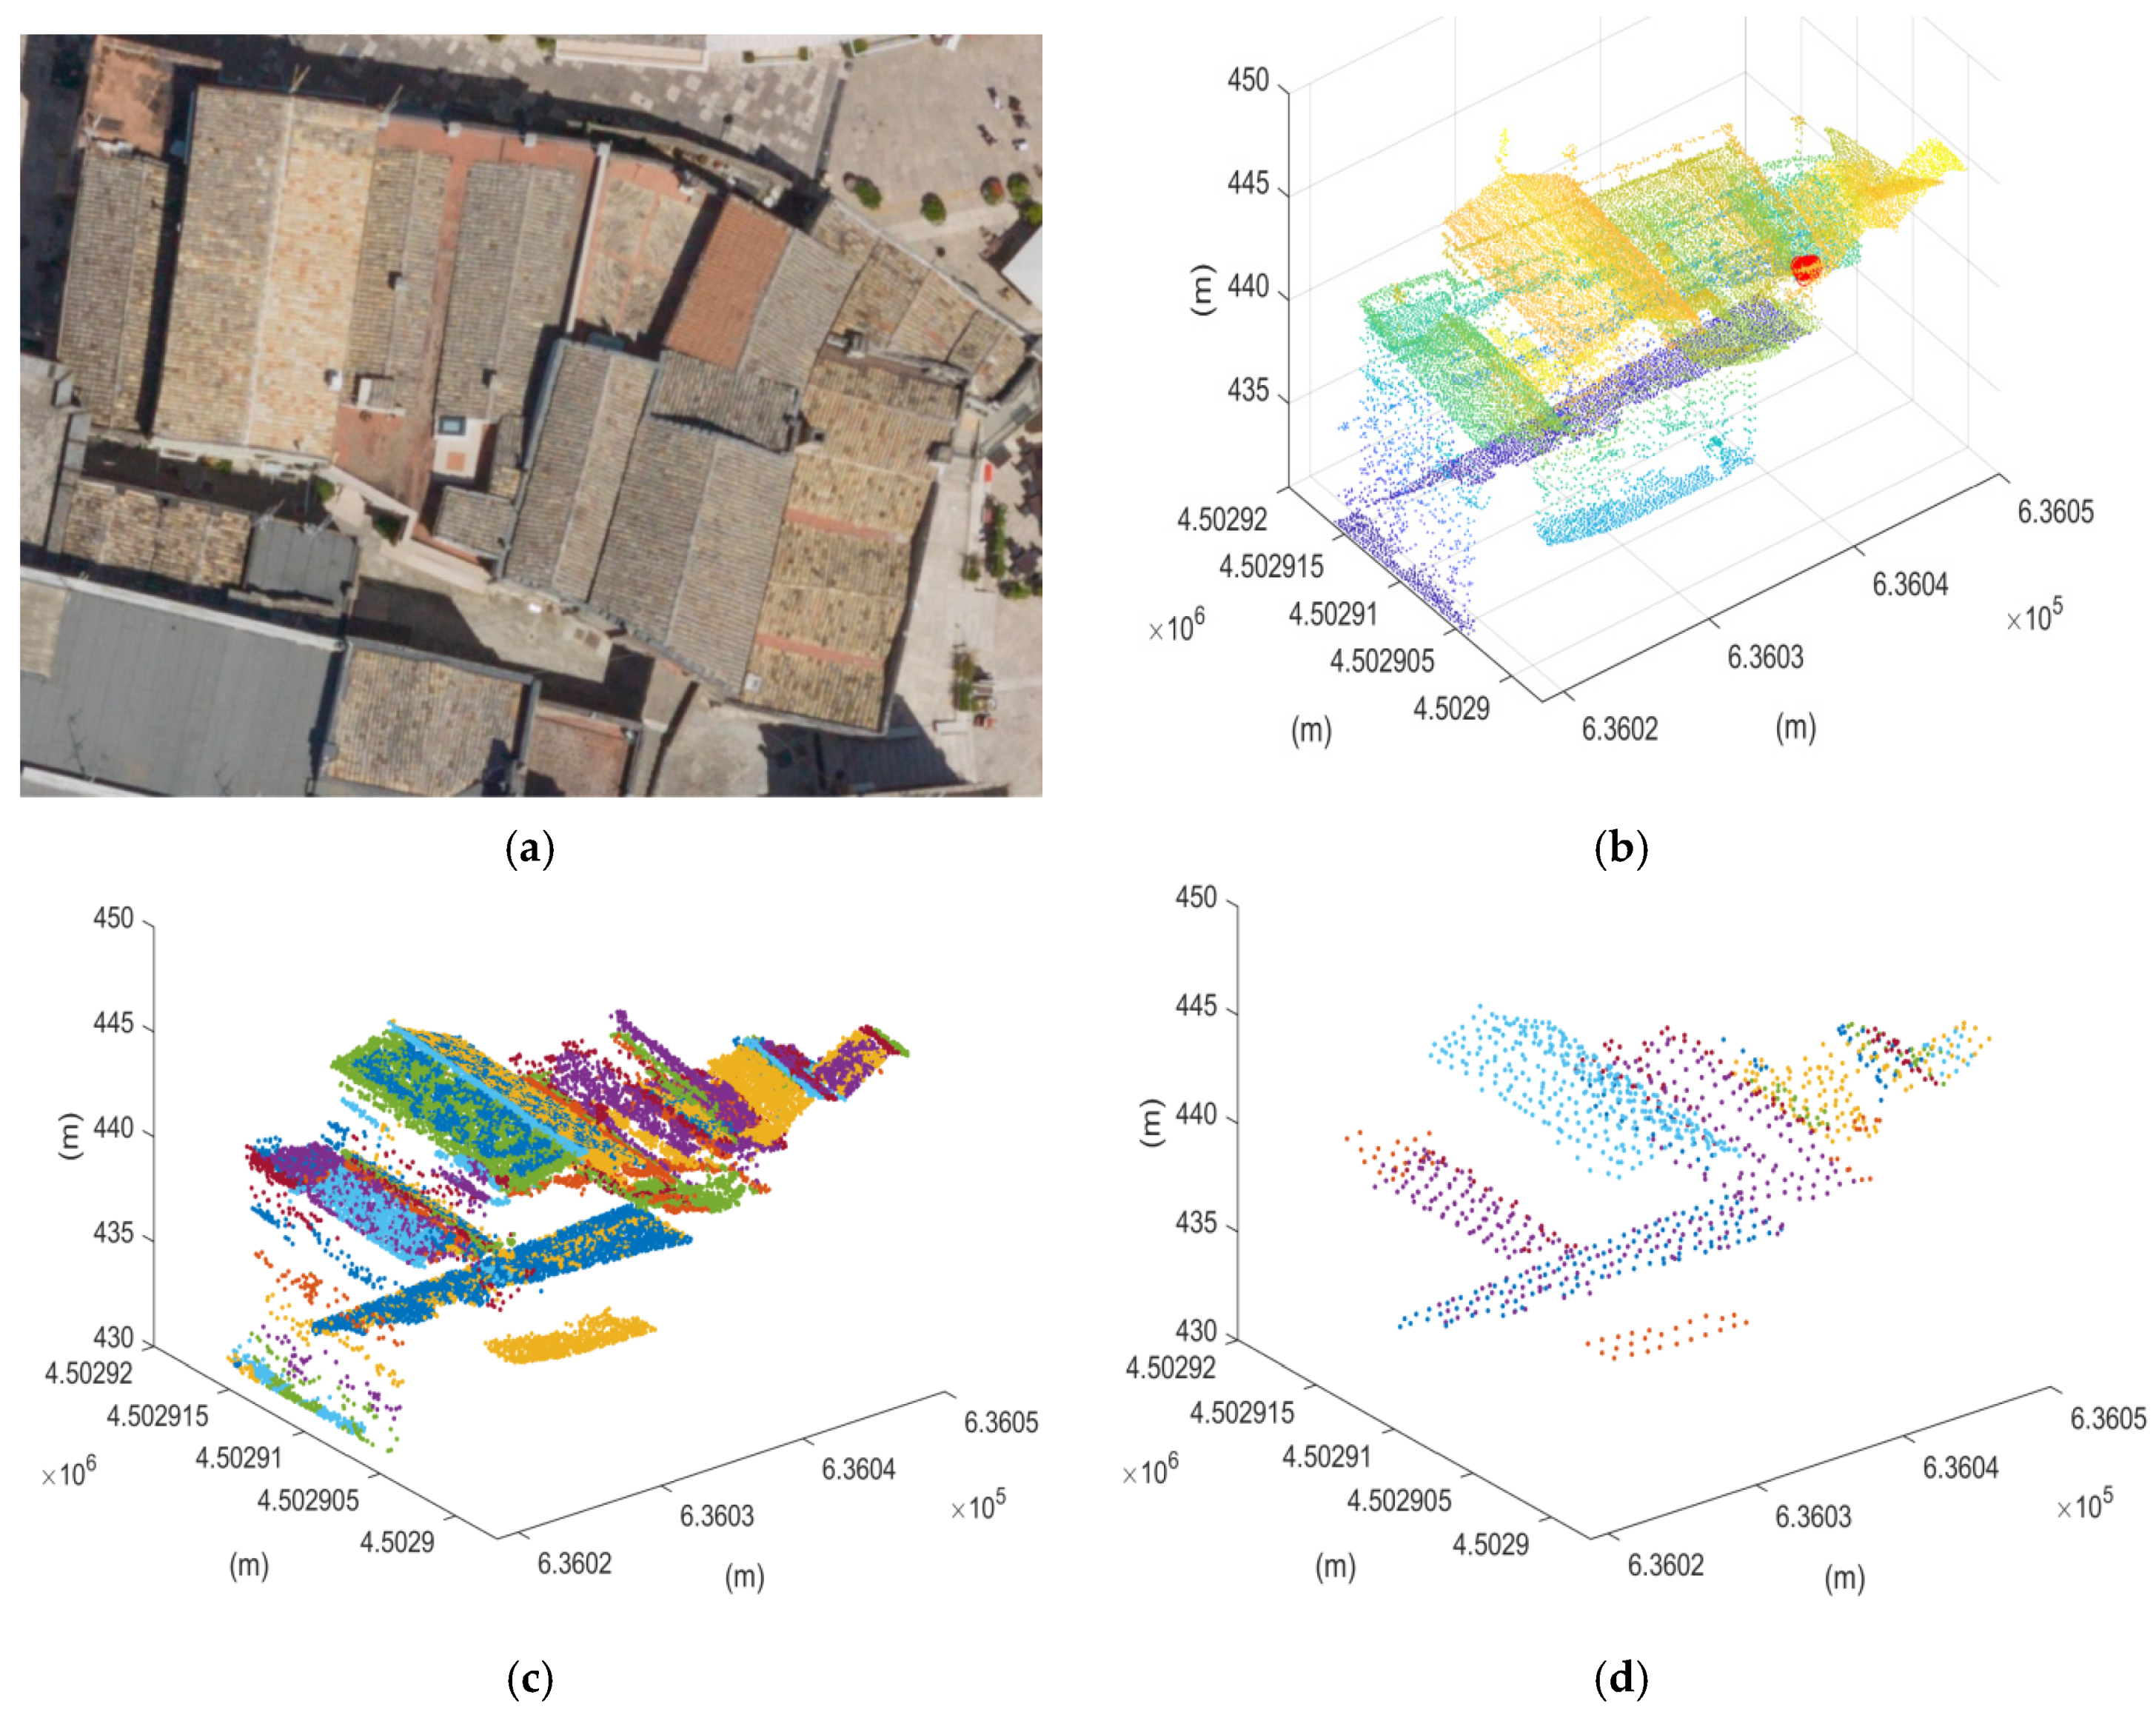
Figure 1.
Clustering and segmentation of roof light detection and ranging (LIDAR) points. (a) orthopotho provided by GEOCART; (b) LIDAR points; (c) clustered points; (d) Planar segments.
2.2. Roof Segmentation Clustering Approach
In 3D building modeling, the segmentation process generally aims to find which LIDAR cloud points belong to which specific rooftop segments and to represent them with as many details as possible. In particular, the segmentation process begins with exploration of the proprieties of local distribution of the points’ normal vector (Ni) that uniquely determines the direction of a roof plan in order to return the planes with the same normal vectors.
This section describes an approach in which this is treated as a cluster problem, as widely proposed in literature studies (e.g., [6,7,19,20]). In particular, the fuzzy c-means method was used to determine the clusters (see Figure 1c). This method belongs to the partitioning methods clustering category, relocating iteratively data points among various clusters until they achieve the greatest distinction. In this method, a data point does not belong to only one cluster entirely. Instead, it can belong to any of the clusters at a certain degree of belonging estimated measuring the similarity, that is, the inverse distance measure of each data point to the cluster centers.
The fuzzy c-means algorithm requires determination of the number of clusters and their approximate centers in order to start the iterative computation. In this context, the LIDAR data is pre-processed for c-means clustering using a potential-based clustering approach. The point with high potential (i.e., the highest number of data points within its (fixed-distance) sphere of influence) is used to determine the first cluster center; the potential () of data point (Ni) is calculated as:
where j is the number of data points, is the jth data point and rf is the radius of the point Ni sphere of influence.
The other cluster center’s potential () is then estimated based on the distance to the previously selected cluster centre(s) to reduce the possibility of two cluster centers being close:
where and are the previously selected center and its potential, respectively. To avoid obtaining closely spaced cluster centers, we set to be somewhat greater than , i.e., .
This process stops when the cumulative potential reaches a threshold that is below 15% of the first potential . If the potential falls between 15% and 50% of the first potential, we check if the data point provides a good trade-off between having a sufficient potential and being sufficiently far from existing cluster centers, as evaluated by [19].
This algorithm has been implemented iteratively, changing the value of the radius of the sphere of influence. This results in a set of scenarios depending on the radius r of the sphere of influence utilized, where the final number of the clusters is inversely proportional with the magnitude of the r. Selection of the best approximation value of the cluster numbers and the cluster center positions was determined by the likelihood (i.e., compactness) of each cluster, calculated as in the following equation:
where di is the mean distance in cluster i of data points to its respective clusters and c the number of clusters.
Finally, rooftop segmentation was refined by the separation of parallel and coplanar planes as well, as proposed in [7], because the planes may have roof segments that are parallel to each other or roof segments that are mathematically the same but are separated spatially (see Figure 1d).
The flow of the proposed approach is depicted in Figure 2.
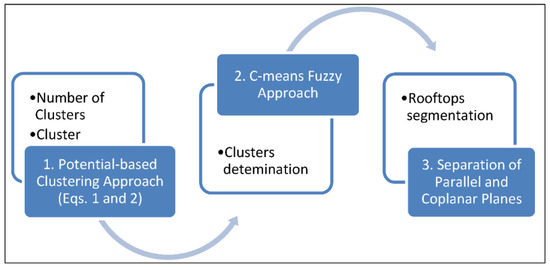
Figure 2.
Schematic representation of the workflow of the clustering segmentation approach described in Section 2.2.
2.3. Roof Segmentation Region Growing Approach
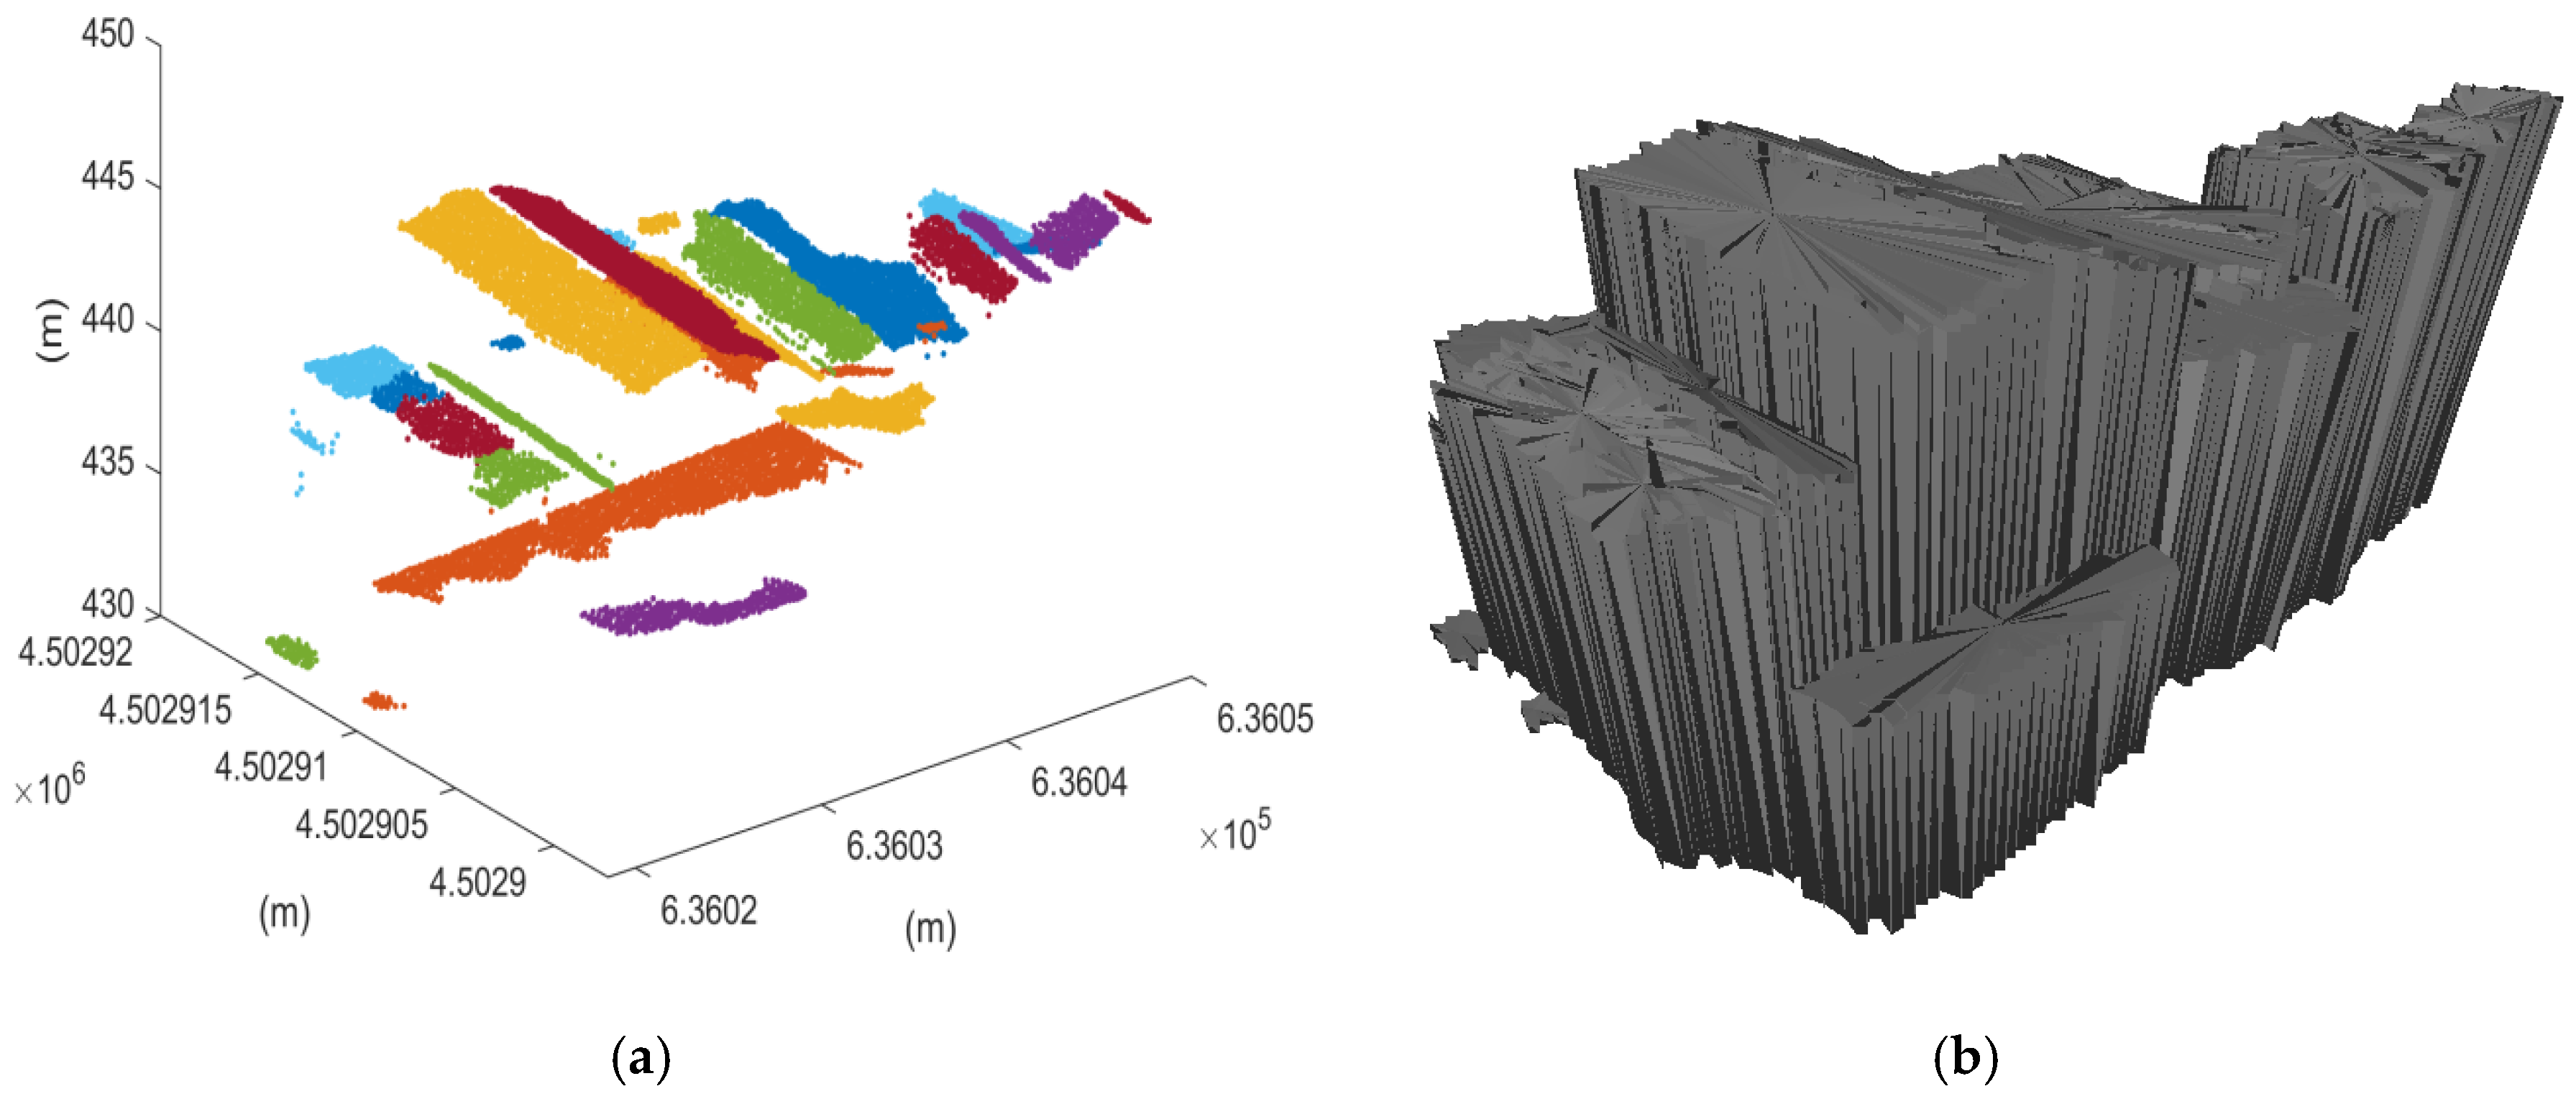
The second approach uses the region growing segmentation method proposed by [24] in order to describe each individual building rooftop with the best spatial detail possible (see Figure 3). This region growing segmentation process uses the point normals (Ni) and their curvatures (Ci) to detect every significant feature on the rooftop:
where is the eigenvalue of the LIDAR points subdivided by their three dimensionalities.
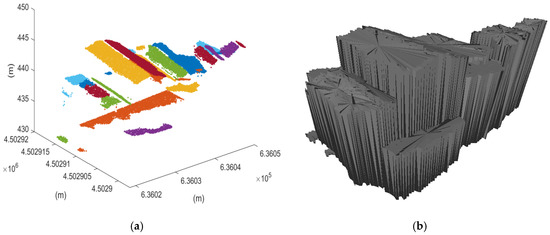
Figure 3.
Region growing approach. (a) Segmentation of roof light detection and ranging (LIDAR) points displayed in Figure 1b. (b) 3D building reconstruction.
The process examines the points surface smoothness and picks the point with the smallest curvature value as a seed point. The algorithm then examines the local connectivity among the neighboring points, grouping the points with direction similar to the seed point normal, that is, lesser than a predetermined threshold (the angular difference threshold applied here is equal to 4°).
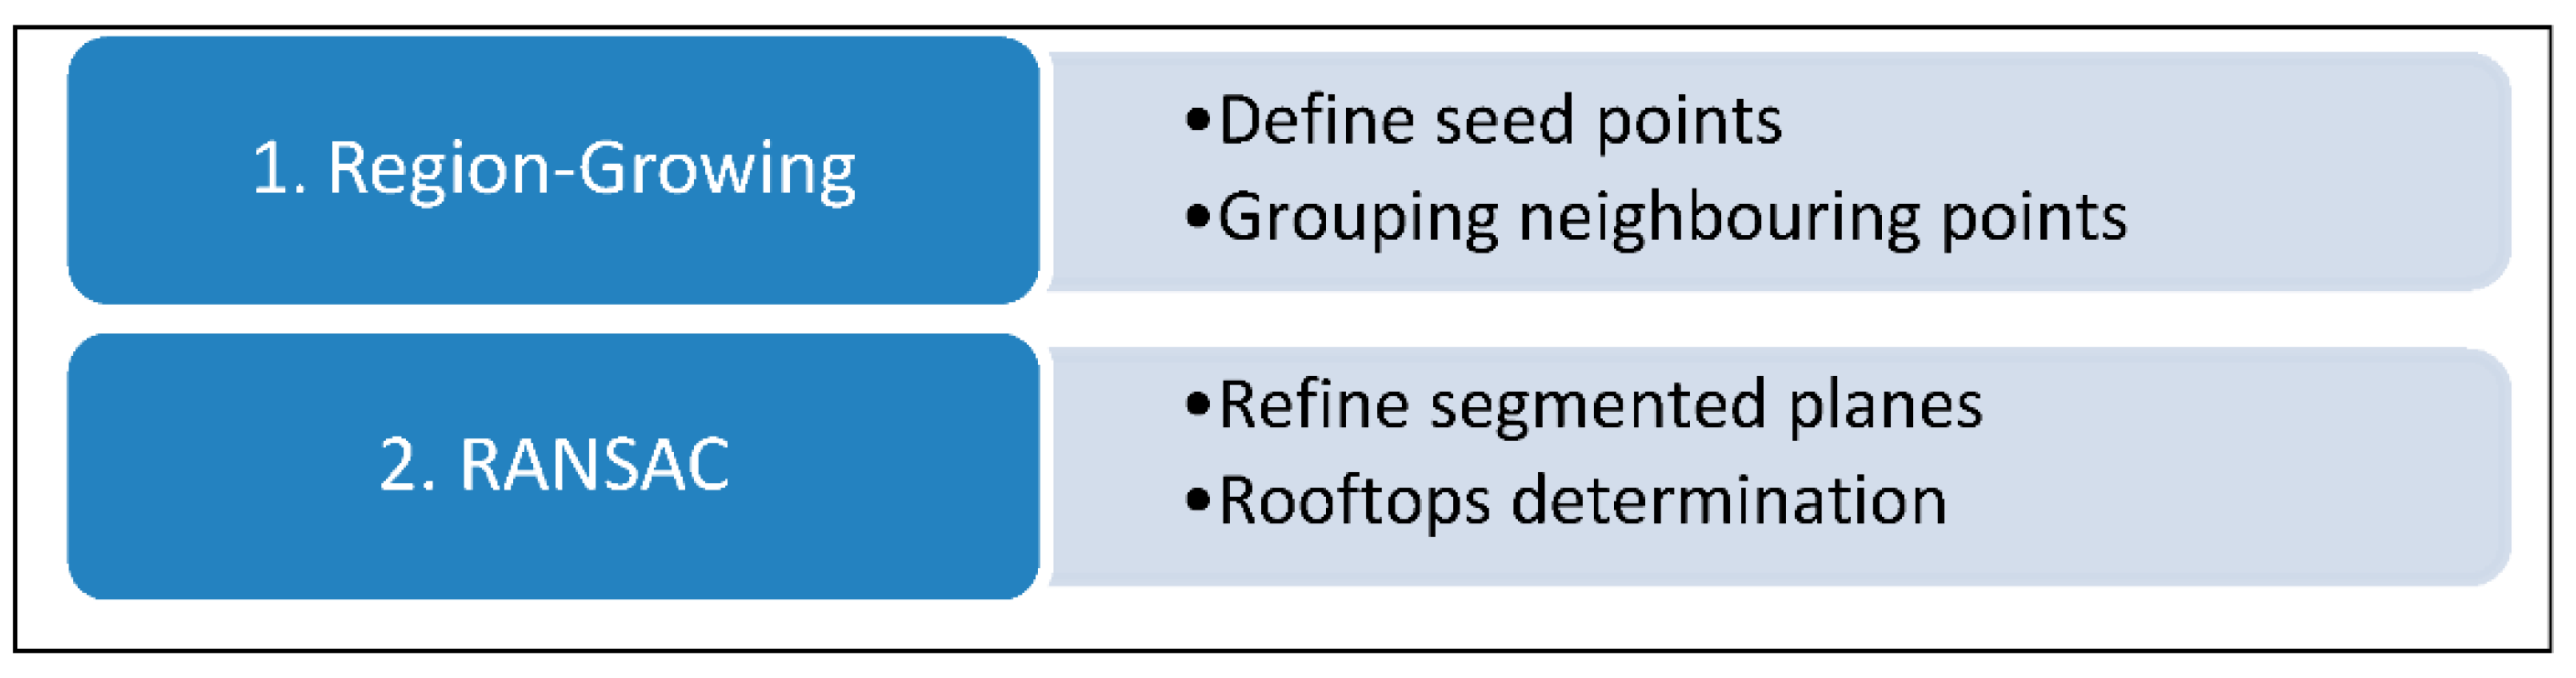
Among those points which have been grouped together by the seed point, points with curvature values lower than a predetermined threshold (equal to 0.01) are chosen as future seed points. The procedure continues in the same fashion and stops when all points have been visited. Finally, for each segmented region, RANSAC is applied to fit a virtual plane from the candidate points and then the points are forced to move on to this estimated plane in order to assign a perfect flatness property to each surface [24]. The main steps of the proposed approach are depicted in Figure 4.
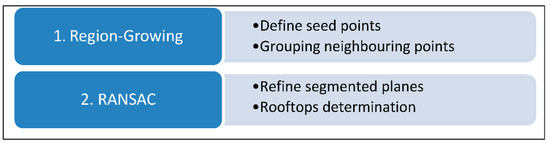
Figure 4.
Schematic representation of the steps of the region-growing segmentation approach described in Section 2.3.
2.4. 3D Modeling
Successful extraction of major rooftop features, as proposed in Section 2.2 and Section 2.3, is not sufficient to deliver 3D building modeling. Therefore, the next steps are (i) to produce possible boundary points for all features on the rooftops which are used, and (ii) to create vertical walls connecting rooftops to the ground.
Points on the boundaries of all detected parts on the rooftop are generated by applying rectilinear fitting: A 2D grid is overlaid on the LIDAR points in the x, y plane and each cell of the 2D grid is marked as being occupied and, thus, its boundary represents the shapes of all parts, if there are at least a minimum number of cloud points (based on their density). A robust 2.5D dual contouring method [25] is then utilized to generate facetized, watertight building models (see Figure 3b).
2.5. Evaluation of the Performance Measurements
The results of 3D building reconstruction of two different segmentation approaches described in Section 2.2 and Section 2.3 were evaluated in terms of the geometrical accuracy of the roof polygons and/or final 3D building model. The mean, standard deviation, and Root Mean Square Error (RMSE) of the Euclidean distance (along x, y and z dimension) of each vertex (all the points) of the reconstructed 3D building model and the relative roof polygons and the nearest neighbors of the corresponding reference point were used:
In Equation (5), is the mean of the Euclidean distance (along x, y and z direction) between the i-th point of each segmentation model and of the corresponding nearest neighbors point of the reference data set.
3. Results
The two proposed fully automatic segmentation approaches were tested on two case studies with very different characteristics (e.g., different types of urban development and average point density value of the ALS input data) in order to increase the robustness and completeness of the proposed investigation.
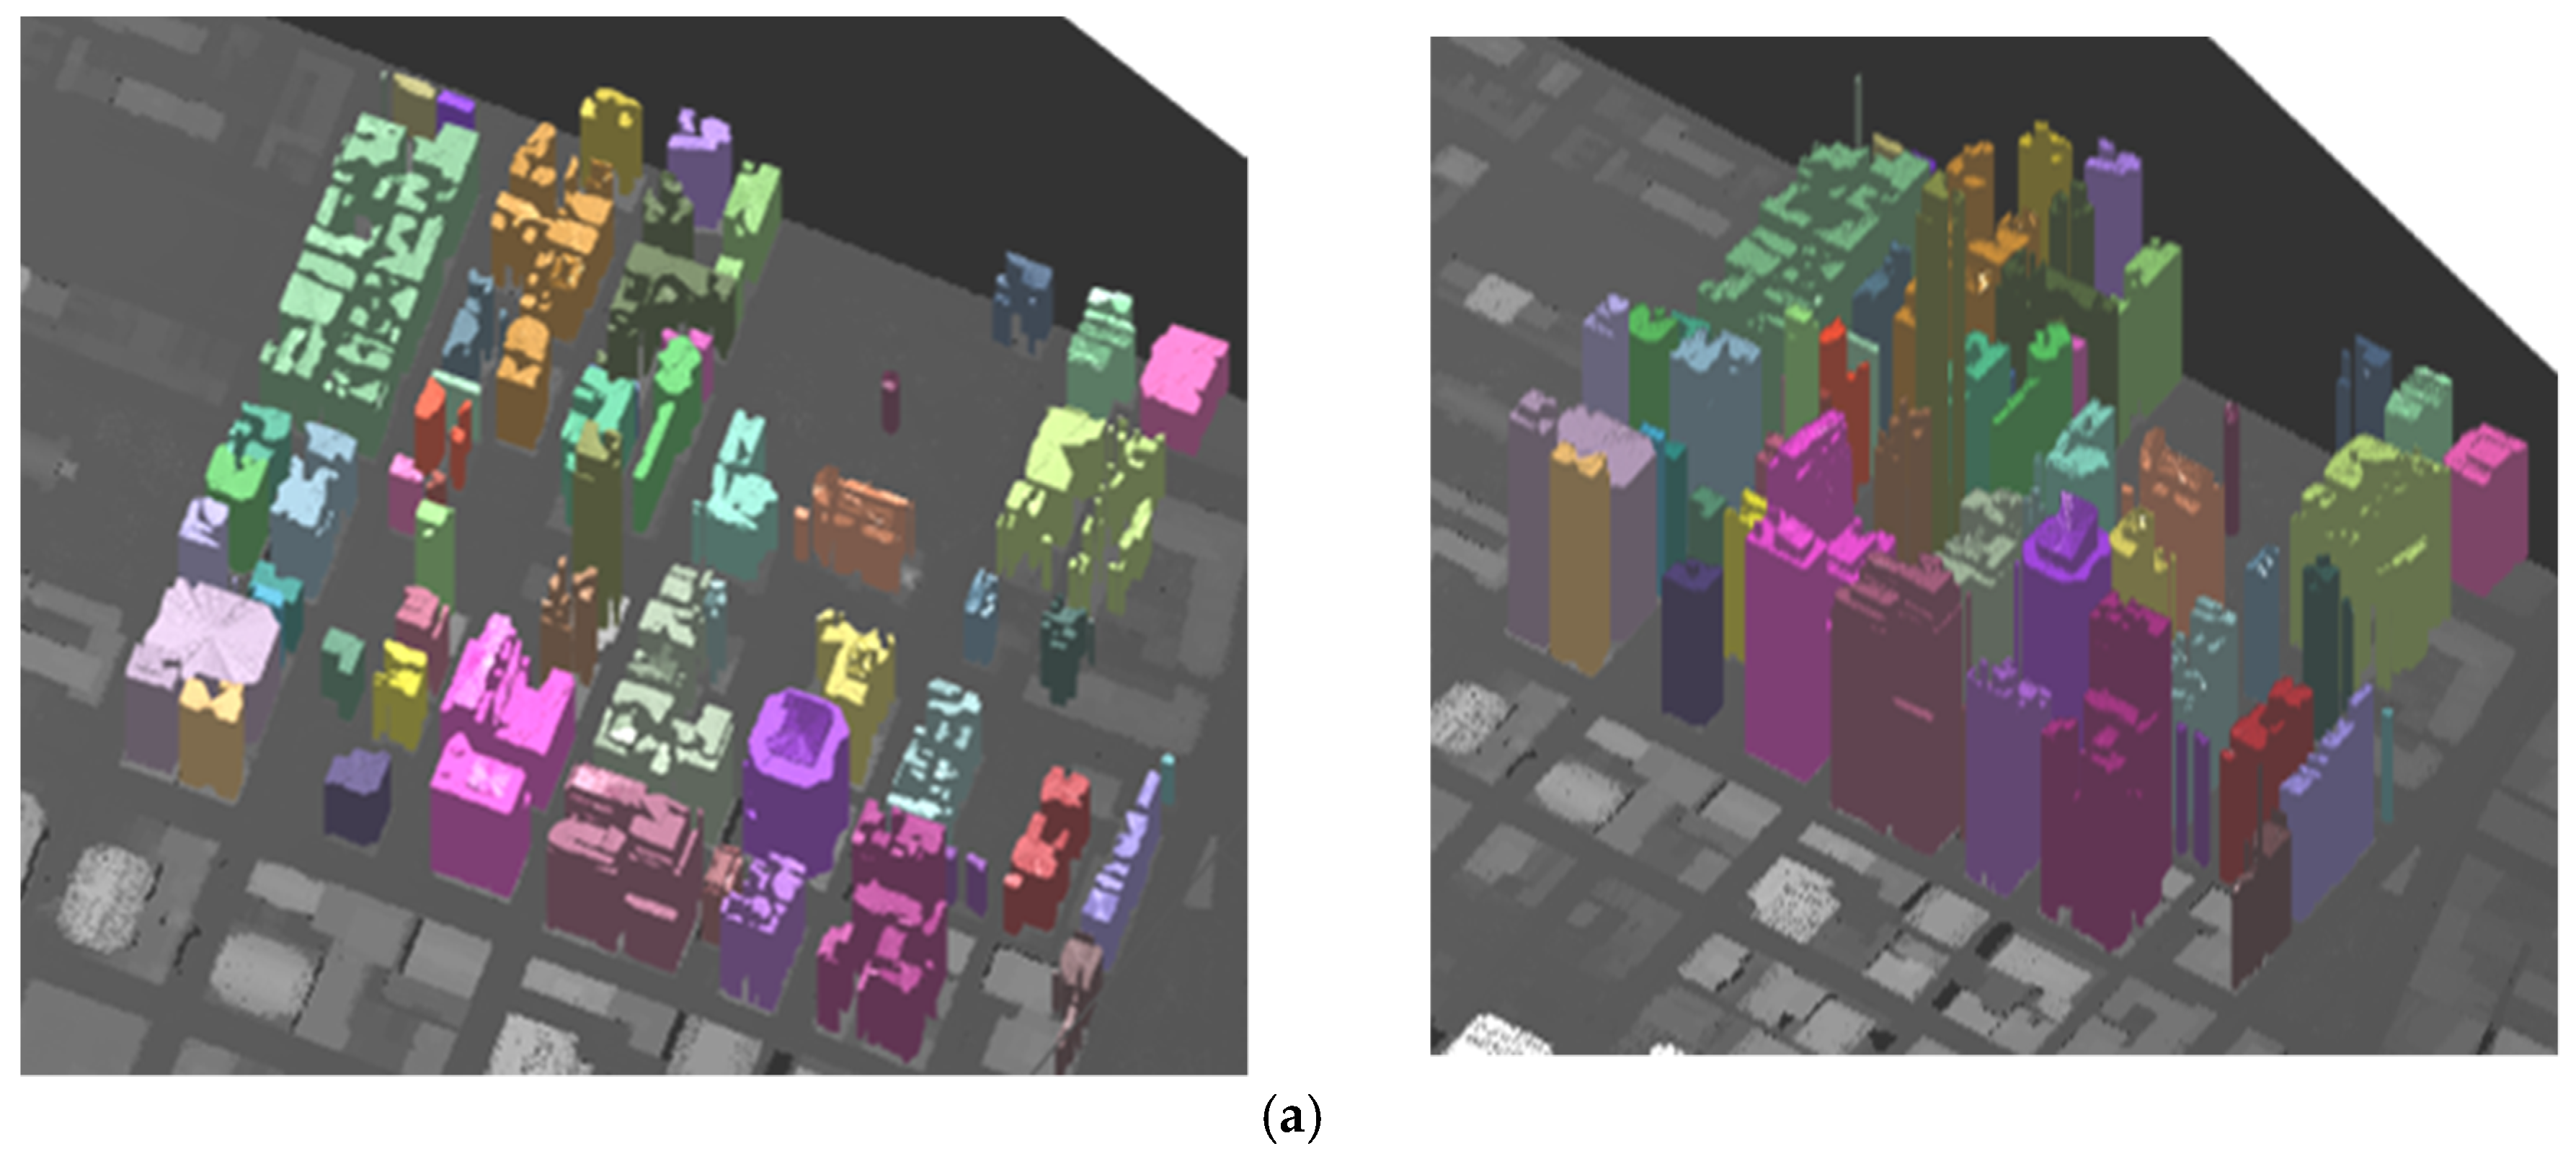
First, an ALS data set with reference data made available via the International Society for Photogrammetry and Remote Sensing (ISPRS) web site [27] over downtown Toronto (Canada) was used to evaluate the performance of the two above-described segmentation approaches. This test case contained a mixture of 58 low and high-storey buildings; readers can refer to [26] for a more detailed description of characteristics and technical specifications of this benchmark dataset. Figure 5 shows a visual result of the 3D reconstruction using the proposed segmentation methods. Processing was conducted on a consumer laptop (Intel Core i7, 8G RAM). The average performances over the 58 buildings of the two roof segmentation approaches are shown in Table 1. The region growing segmentation approach exhibited slightly better performances but required a greater computational time than the clustering-based approach.
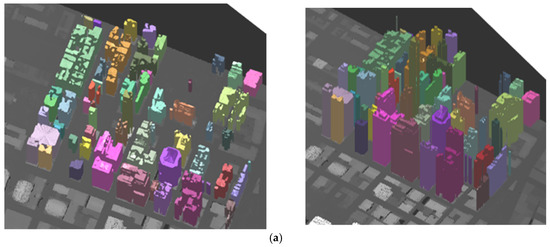
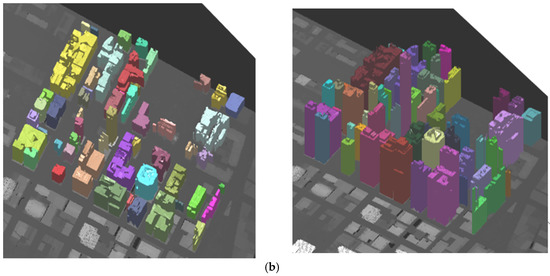
Figure 5.
Results of 3d buildings reconstruction over downtown Toronto (Canada) using (a) the clustering roof segmentation approach and (b) the region growing approach.

Table 1.
Average performances of the geometry accuracy on the 58 buildings over downtown Toronto (Canada) of each of the two segmentation approaches compared with the reference data.
A 3D reconstruction of one complex palace, constructed in the 1950s with a total surface of 3690 m2, located in one of the main squares of the historical center of Matera (see Figure 6a), for which building a celerimetric survey made through a total station is available, was carried out from a LIDAR point cloud (see Figure 6a). This complex building was then manually reconstructed in 3D, as shown in Figure 6b, using commercial software that implements Building Information Modeling (BIM) technology [29]. This manually reconstructed 3D building is considered the gold standard because it is based on detailed survey measurements and, therefore, it can be compared with the outcomes of the two proposed segmentation approaches in order to evaluate their vertex geometry accuracy. Figure 6c,d shows the reconstruction results for the data collected for the building test case in Matera. Processing was conducted on a consumer laptop (Intel Core i7, 8G RAM) and is presented as solid models with simplified facades and faithfully reflected roof structure considering that the aims of these kinds of approaches are to realize an interactive visualization covering large areas. The performance of the two approaches, evaluated as described in Section 2.5, are shown in Table 2. The region growing segmentation approach exhibited slightly better performances but required a greater computational time (two times greater) than the clustering-based approach, similar to the performance in the previously described case study over downtown Toronto. Hence, the region growing approach analysing the LIDAR cloud points one by one can be more efficient to reach the best spatial detail possible but, at the same time, this process is more time-consuming. However, the potential-based method can also yield a stable estimate on the number of clusters and initial cluster centers which are needed for the following fuzzy k-means clustering calculation for an efficient segmentation process, saving computational resources. The better performances of both proposed methodologies on the Matera building with respect to the Toronto case study could be associated with the different quality of input ALS data adopted. This is confirmed by the fact that the minimum value of the RSME (using both segmentation methods) evaluated for each of the Toronto buildings is equal to 0.76 m, slightly higher than the value shown in Table 2 (i.e., 0.7 m).
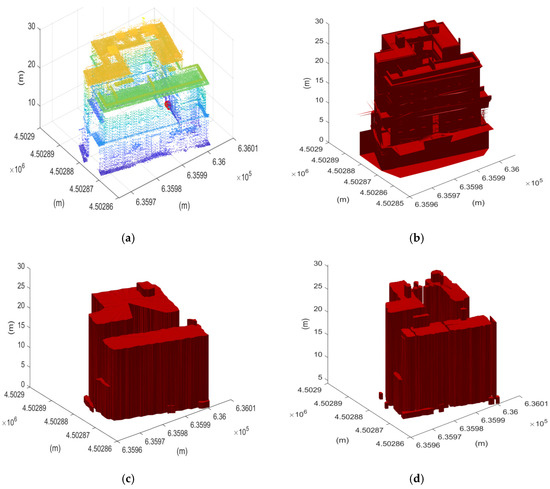
Figure 6.
Results of the models for 3D reconstruction of the building located in Matera. (a) Light detection and ranging (LIDAR) points provided by GEOCART; (b) 3D Building Information Modeling (BIM) building reconstruction; (c) 3D building reconstruction using the clustering segmentation approach; (d) 3D building reconstruction using the region growing segmentation approach.
Table 2.
Performances of the geometry accuracy of each of the two fully automatic reconstruction approaches compared with the 3D BIM model for the case study in Matera (Italy).
In both applications, each side of a rooftop is connected to the ground by a simple, vertical wall which is obviously not always indicative of the true architectural form. In addition, the 2.5D dual contouring method [15] is a robust algorithm although it does not respond to our ideal outline refinement.
4. Conclusions
Rottensteiner, F et al. [30] have tried to analyse a few of the great variety of detection and reconstruction applications from airborne laser scanning (ALS) proposed in the literature by identifying common problems of existing studies and by giving indications about the most promising applications. However, a research demand is still needed for comparing the results of different segmentation methodologies for 3D building reconstruction. Indeed, this study presents an investigation of fully automatic segmentation approaches for 3D building detection and modeling by processing airborne LIDAR point clouds. The first method proposed in this study for the extraction of rooftop patches uses a fuzzy c-means clustering method refined with the separation of planar and coplanar planes, which can be fairly easily accomplished based on planar equations and connectivity, respectively. In a second segmentation approach, a region growing based segmentation combined with RANSAC method was used to detect all significant features on the rooftop. Finally, the boundary regularization approach and the 2.5D dual-contouring method was adopted for the 3D modeling process using the outcome of each of these two segmentation approaches.
The results of both approaches were tested on two case studies that differ in their types of urban development and input data characteristics. The (i) benchmark LIDAR point clouds with the related reference data (generated by stereo plotting) over downtown Toronto (Canada) and (ii) the LIDAR data of a complex building in Matera (Italy) with the relative 3D BIM model (Building Information Modelling) (generated though celerimetric survey measurement with a total station) were used to evaluate the geometrical quality of roofs under different operating system of the above described segmentation approaches. Performances were evaluated in terms of computational time but also in terms of mean, standard deviation and Root Mean Square Error of the Euclidean distance (along x, y and z dimension) of each vertex (all the points) of the modeled roof polygons and the nearest neighbors of the corresponding reference point. The results of these two different case studies show that both methods reach good performance metrics in terms of geometry accuracy, demonstrating their transferability in other contexts. However, the approach based on region growing segmentation exhibited slightly better performances than the clustering-based approach and required greater computational time.
Funding
This research received no external funding.
Acknowledgments
The author gratefully acknowledges GEOCART S.p.A. for providing the LIDAR point clouds of Matera (Italy) and the author would like to acknowledge the provision of the Downtown Toronto data set by Optech Inc., First Base Solutions Inc., GeoICT Lab at York University, and ISPRS WG III/4.
Conflicts of Interest
The author declares no conflict of interest.
References
- Bonczak, B.; Kontokosta, C.E. Large-scale parameterization of 3D building morphology in complex urban landscapes using aerial LiDAR and city administrative data. Comput. Environ. Urban Syst. 2019, 73, 126–142. [Google Scholar] [CrossRef]
- Ma, Z.; Liu, S. A review of 3D reconstruction techniques in civil engineering and their applications. Adv. Eng. Inf. 2018, 37, 163–174. [Google Scholar] [CrossRef]
- Wang, R. 3D building modeling using images and LiDAR: A review. Int. J. Image Data Fusion 2013, 4, 273–292. [Google Scholar] [CrossRef]
- Zlatanova, S.; Çöltekin, A.; Ledoux, H.; Stoter, J.; Biljecki, F. Applications of 3D city models: State of the art review. ISPRS Int. J. Geo Inf. 2015, 4, 2842–2889. [Google Scholar]
- Wang, R.; Peethambaran, J.; Chen, D. LiDAR point clouds to 3-D urban models: A review. IEEE J. Sel. Top. Appl. Earth Obs. Remote Sens. 2018, 11, 606–627. [Google Scholar] [CrossRef]
- Shan, J.; Sampath, A. Building extraction from LiDAR point clouds based on clustering techniques. Topogr. Laser Ranging Scanning 2010, 11, 421–444. [Google Scholar]
- Sampath, A.; Shan, J. Segmentation and reconstruction of polyhedral building roofs from aerial lidar point clouds. IEEE Trans. Geosci. Remote Sens. 2010, 48, 1554–1567. [Google Scholar] [CrossRef]
- Pahlavani, P.; Amini Amirkolaee, H.; Bigdeli, B. 3D reconstruction of buildings from LiDAR data considering various types of roof structures. Int. J. Remote Sens. 2017, 38, 1451–1482. [Google Scholar] [CrossRef]
- Jung, J.; Jwa, Y.; Sohn, G. Implicit regularization for reconstructing 3D building rooftop models using airborne LiDAR data. Sensors 2017, 17, 621. [Google Scholar] [CrossRef]
- Cao, R.; Zhang, Y.; Liu, X.; Zhao, Z. Roof plane extraction from airborne lidar point clouds. Int. J. Remote Sens. 2017, 38, 3684–3703. [Google Scholar] [CrossRef]
- Filin, S.; Pfeifer, N. Segmentation of airborne laser scanning data using a slope adaptive neighborhood. ISPRS J. Photogramm. Remote Sens. 2006, 60, 71–80. [Google Scholar] [CrossRef]
- Haala, N.; Brenner, C. Extraction of buildings and trees in urban environments. ISPRS J. Photogramm. Remote Sens. 1999, 54, 130–137. [Google Scholar] [CrossRef]
- Fischer, A.; Kolbe, T.H.; Lang, F.; Cremers, A.B.; Förstner, W.; Plümer, L.; Steinhage, V. Extracting buildings from aerial images using hierarchical aggregation in 2D and 3D. Comput. Vis. Image Underst. 1998, 72, 185–203. [Google Scholar] [CrossRef]
- Suveg, I.; Vosselman, G. 3D reconstruction of building models. Int. Arch. Photogramm. Remote Sens. 2000, 33, 538–545. [Google Scholar]
- Cheng, L.; Wu, Y.; Wang, Y.; Zhong, L.; Chen, Y.; Li, M. Three-dimensional reconstruction of large multilayer interchange bridge using airborne LiDAR data. IEEE J. Sel. Top. Appl. Earth Obs. Remote Sens. 2015, 8, 691–708. [Google Scholar] [CrossRef]
- Morgan, M.; Habib, A. Interpolation of lidar data and automatic building extraction. ACSM-ASPRS Annu. Conf. Proc. 2002. [Google Scholar]
- Fischler, M.A.; Bolles, R.C. Random sample paradigm for model consensus: A apphcatlons to image fitting with analysis and automated cartography. Commun. ACM 1981, 24, 381–395. [Google Scholar] [CrossRef]
- Dimitrov, A.; Golparvar-Fard, M. Segmentation of building point cloud models including detailed architectural/structural features and MEP systems. Autom. Constr. 2015, 51, 32–45. [Google Scholar] [CrossRef]
- Jain, A.K.; Murty, A.M.N.; Flynn, P.J. Data clustering: A review. ACM Comput. Surv. 1999, 31, 264–323. [Google Scholar] [CrossRef]
- Chiu, S. Fuzzy model identification based on cluster estimation. J. Intell. Fuzzy Syst. 1994, 2, 267–278. [Google Scholar]
- Tibshirani, R.; Walther, G.; Hastie, T. Estimating the number of clusters in a data set via the gap statistic. J. R. Stat. Soc. Ser. B Stat. Methodol. 2001, 63, 411–423. [Google Scholar] [CrossRef]
- Rabbani, T.; van Den Heuvel, F.; Vosselmann, G. Segmentation of point clouds using smoothness constraint. Int. Arch. Photogramm. Remote Sens. Spat. Inf. Sci. 2006, 36, 248–253. [Google Scholar]
- Zuliani, M. Ransac forDummies, with Examples Using the RANSAC Toolbox for Matlab and More. 2014. Available online: http://citeseerx.ist.psu.edu/viewdoc/download?doi=10.1.1.475.1243&rep=rep1&type=pdf (accessed on 1 September 2018).
- Sun, S.; Salvaggio, C. Airborne LiDAR point clouds. IEEE J. Sel. Top. Appl. Earth Obs. Remote Sens. 2013, 6, 1440–1449. [Google Scholar] [CrossRef]
- Zhou, Q.-Y.; Neumann, U. 2.5D dual contouring: A robust approach to creating building models from aerial lidar point clouds. Comput. Vis. ECCV 2010, 6313, 115–128. [Google Scholar]
- Rottensteiner, G.; Sohn, M.; Gerke, J.D.; Wegner, U.; Breitkopf, J. Jung results of the ISPRS benchmark on urban object detection and 3D building reconstruction. ISPRS J. Photogram. Rem. Sens. 2014, 93, 256–271. [Google Scholar] [CrossRef]
- ISPRS. Web Site of the ISPRS Test Project on Urban Classification and 3D Building Reconstruction. 2013. Available online: http://www2.isprs.org/commissions/comm3/wg4/tests.html (accessed on 15 October 2019).
- Mallet, C.; Bretar, F.; Roux, M.; Soergel, U.; Heipke, C. Relevance assessment of full-waveform lidar data for urban area classification. ISPRS J. Photogramm. Remote Sens. 2011, 66, S71–S84. [Google Scholar] [CrossRef]
- Eastman, C.; Teicholz, P.; Sacks, P.; Liston, K. BIM Handbook: A Guide to Building Information Modeling for Owners, Managers, Designers, Engineers and Contractors; Wiley: Hoboken, NJ, USA, 2008. [Google Scholar]
- Rottensteiner, F.; Sohn, G.; Gerke, M.; Wegner, J.D. Theme section “Urban object detection and 3D building reconstruction”. ISPRS J. Photogramm. Remote Sens. 2014, 93, 143–144. [Google Scholar] [CrossRef]


© 2019 by the author. Licensee MDPI, Basel, Switzerland. This article is an open access article distributed under the terms and conditions of the Creative Commons Attribution (CC BY) license (http://creativecommons.org/licenses/by/4.0/).