1. Introduction
In active sonar systems, clutter degrades the performance of target detection and overwhelms sonar operators conducting antisubmarine warfare (ASW). Clutter consists of reflected signals from underwater surfaces, the bottom, rocks, fish, and other ships not of interest to sonar operators. Traditionally, underwater target detection depends on the decisions of well-trained sonar operators. This method can be highly inaccurate due to the need for continuous monitoring of the operating sonar console. Moreover, varying underwater environments and target moving patterns make continuous detection and classification difficult, highlighting the need for effective detection and classification algorithms in such an environment.
Underwater moving target detection is challenging for the following reasons:
Complex underwater environment: Underwater target detection is a complex pattern classification problem involving time-varying and mixed environments. Environmental noise causes acoustic signal waveform distortion, loss of signal information, and incomplete received acoustic signals due to the complexity of the sound propagation medium.
Unknown target orientation: Normally the target’s orientation is unknown. Aspect-dependent target strength results in a variable signal-to-noise ratio (SNR) and causes the loss of feature information.
Continuous target tracking: Continuous classification and tracking of weak target echoes should be desirable because a target can be a threat and can take action upon recognizing it has been detected.
Less feature information: Active sonar for long-range target detection has low-resolution data, so a feature vector extraction algorithm is necessary.
Long interval ping-to-ping: In order to detect long-range targets, a long pulse repetition interval (PRI) is used; this means that a relatively small amount of data is acquired over time.
Lack of data in many cases: It is difficult to acquire sufficient and representative sea experiment data.
Many algorithms have been applied to active sonar detection and classification. Detection using a Markov random field [
1], a contrast box detector based on statistical features of reverberation, and morphology detection of an object [
2,
3] were studied for the separation of targets from reverberation. The morphology detector distinguishes the characteristics of the target and reverberation signal and processes them under the condition that the target signal is in an isolated area and the reverberation signal has a distribution of several clutters. These techniques are effective for reverberation removal but have the disadvantage of lowering the target detection rate in a single ping. Multiple ping imaging techniques using temporal and spatial features of clutter and the target have been proposed [
4,
5]. The cumulative processing of multiple ping data reduces the classification rate in a single ping. It also has the disadvantage of using multiple ping signals because signals that are not filtered out of a single ping are used in multiple pings. There are also many approaches to mine detection using side-scan sonar [
6,
7,
8] with high-resolution data. Mine detection approaches are for a near field detection environment that processes high-resolution image data. Therefore, it is difficult to apply in active sonar for long-range target detection with low-resolution data. Much research has been carried out since a mine’s sonar signature exhibits variable characteristics according to its position and the ping’s angle of incidence at the seafloor.
Seo et al. [
9] studied target separation from clutter using spectral feature information on the seabed floor. In [
9], the mathematical model of a cylindrical object proposed by Ye [
10] was used to generate target signals, and clutter signals based on the K-distribution model introduced by Abraham and Lyons [
11,
12] were generated. A logistic regression model with discrete Fourier transform (DFT) features trained with the simulated data was applied to experimental data to evaluate classification performance. It is difficult to acquire experiment data for training in underwater environments. Therefore, the results show that this approach could be an alternative method due to a lack of experiment data. In other target echo analyses, many statistical models representing target backscattering have been studied, such as Weibull; log-normal (LN) models with varying levels of physical basis, such as the Rician distribution; and Swerling models and their extensions [
13,
14,
15]. A scheme based on a time-reversal technique was proposed to improve the detection of a cylindrical object placed proud on the seafloor [
16]. However, there is a lack of research on long-range target detection that considers the aspect angle of a moving target and the variety of underwater environments.
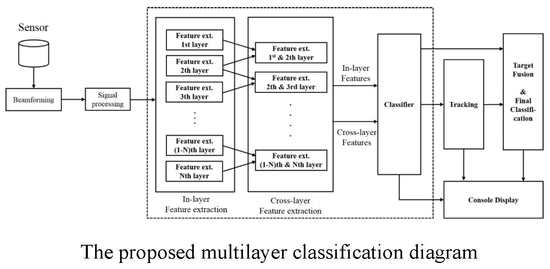
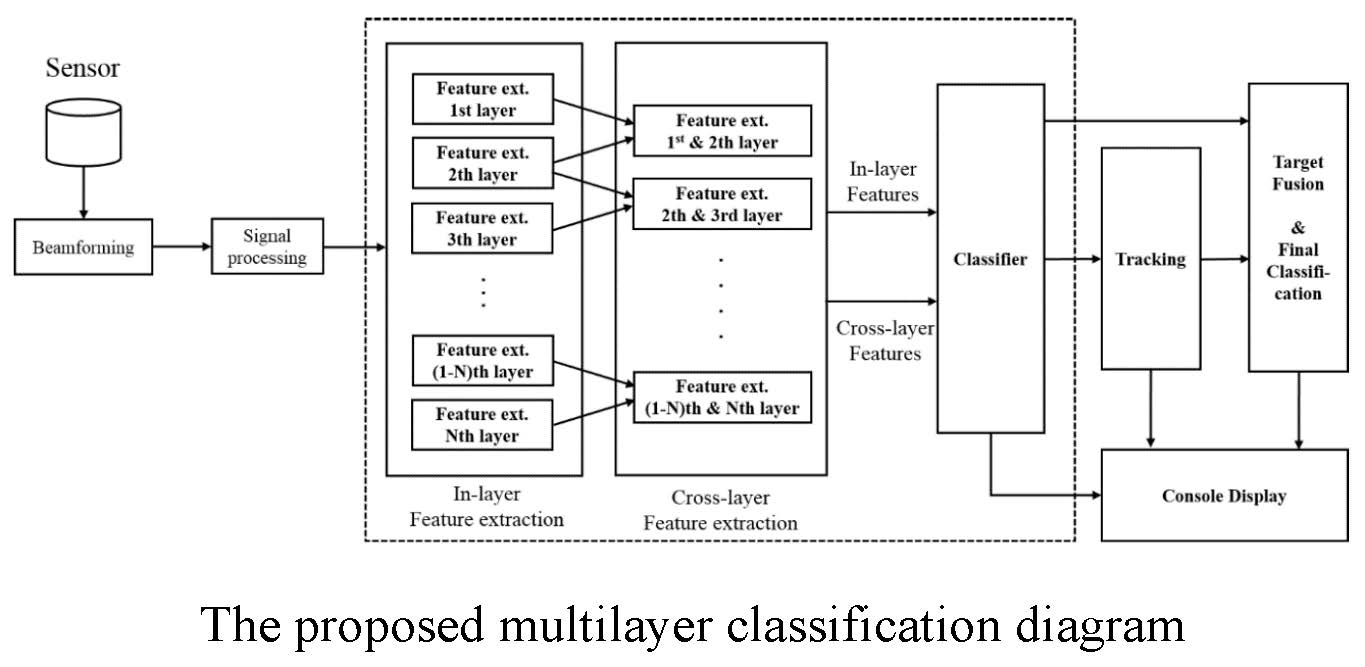
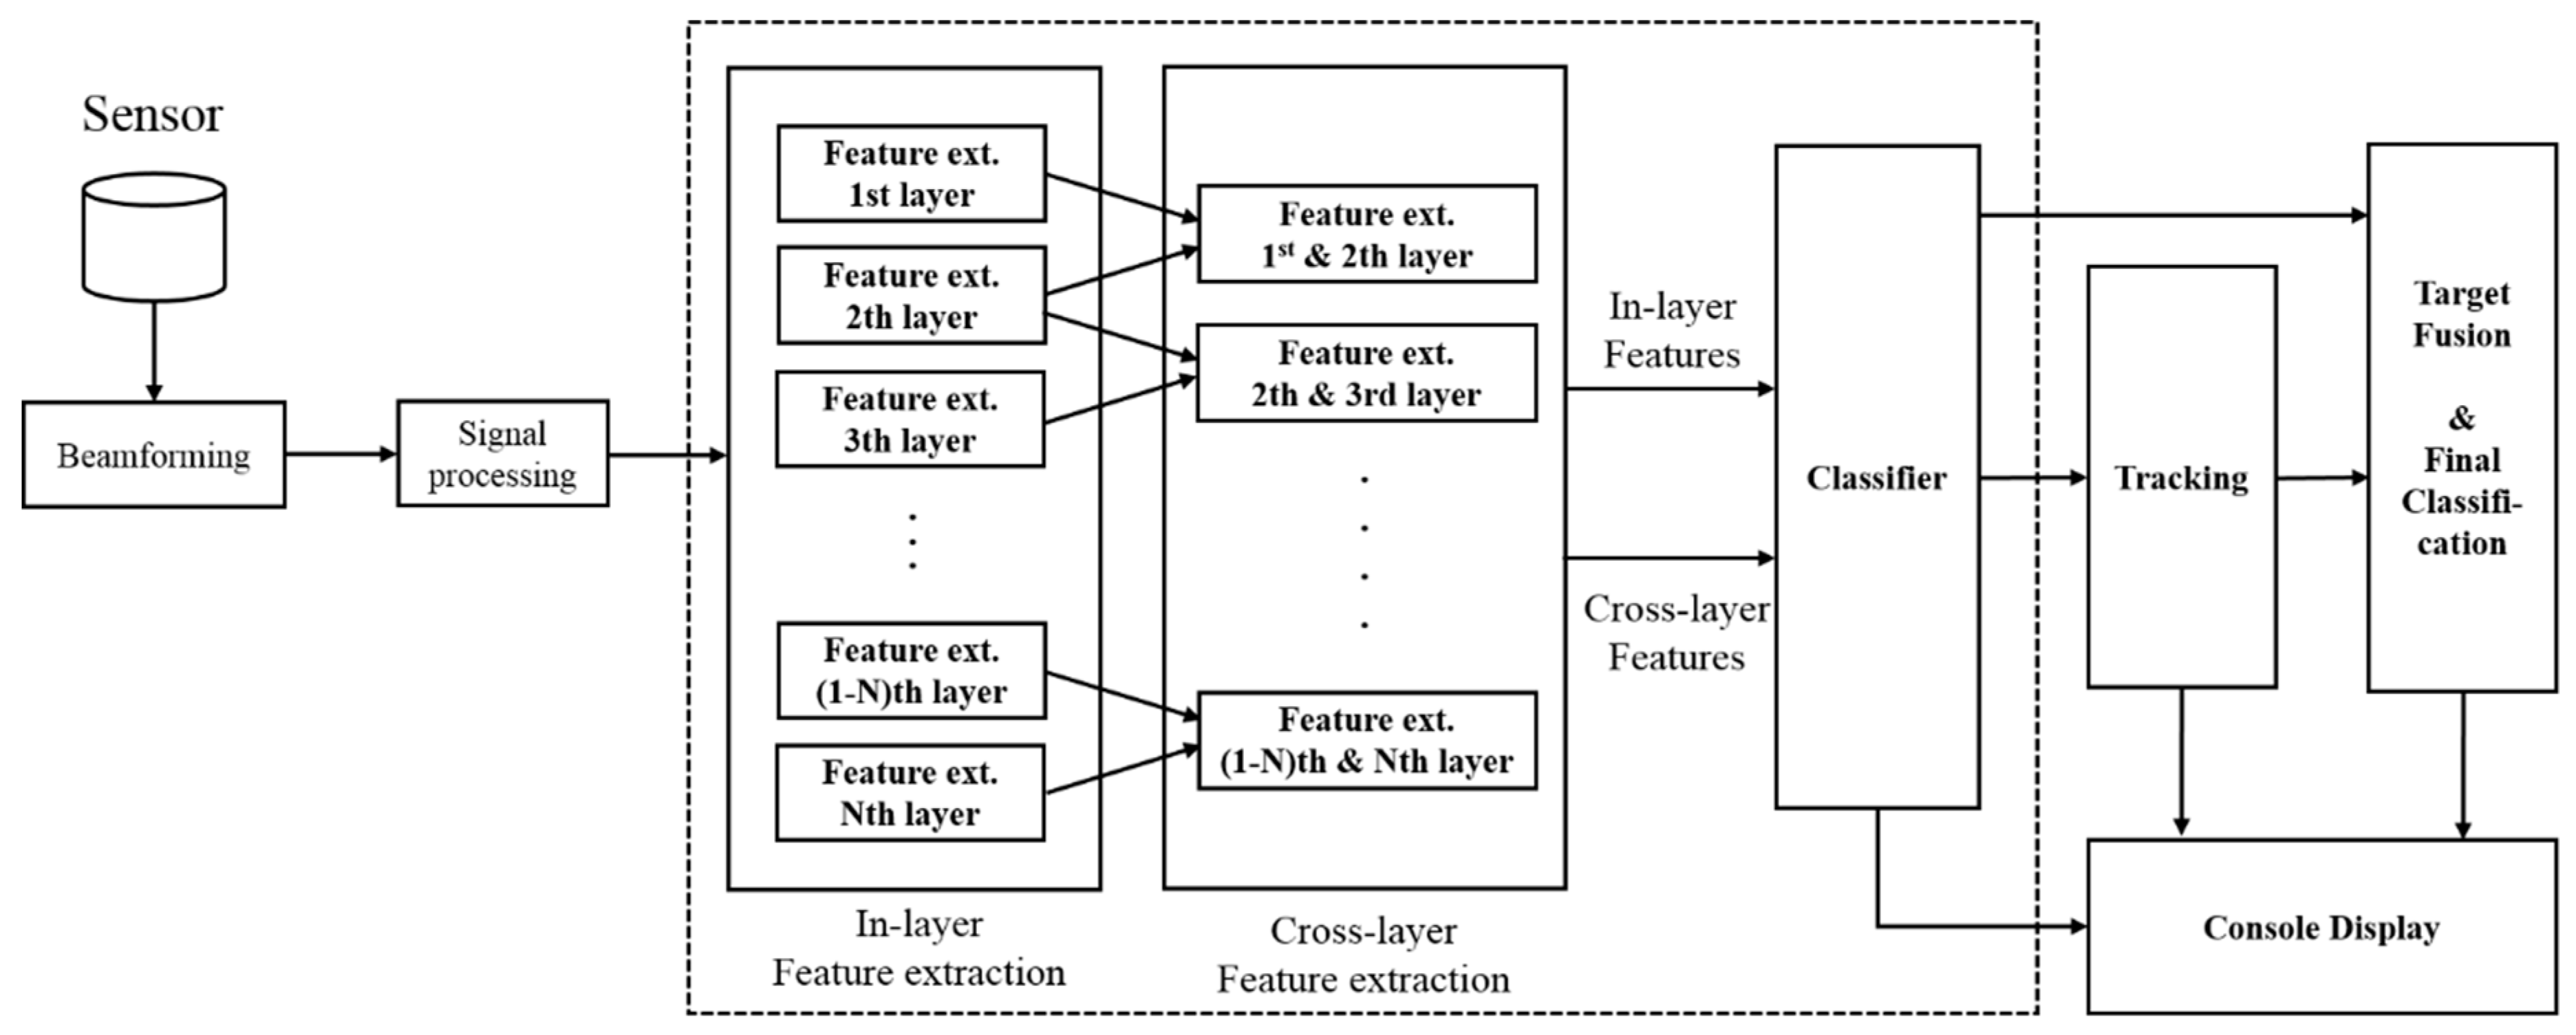
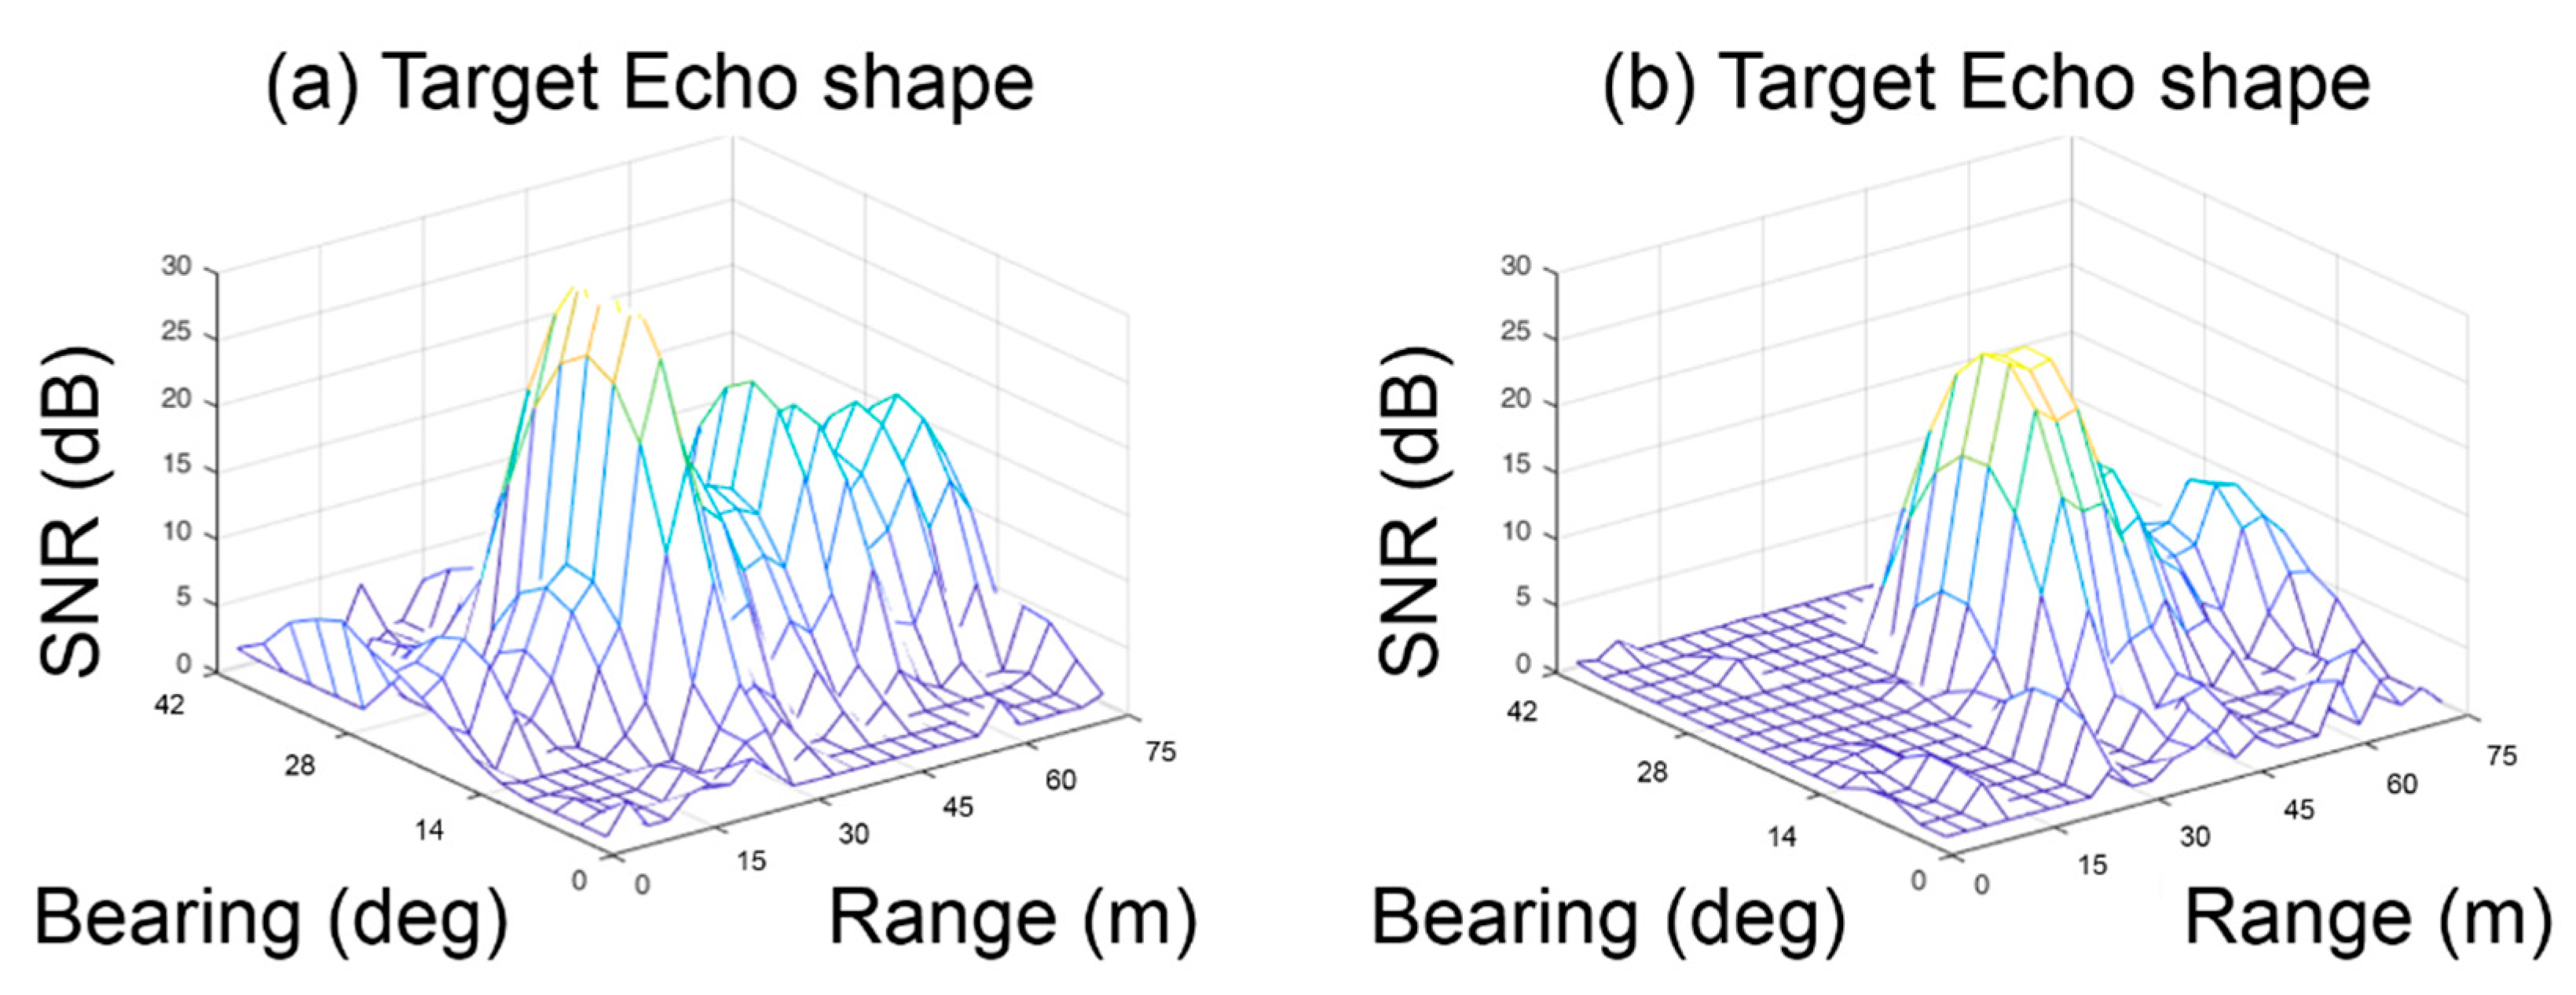
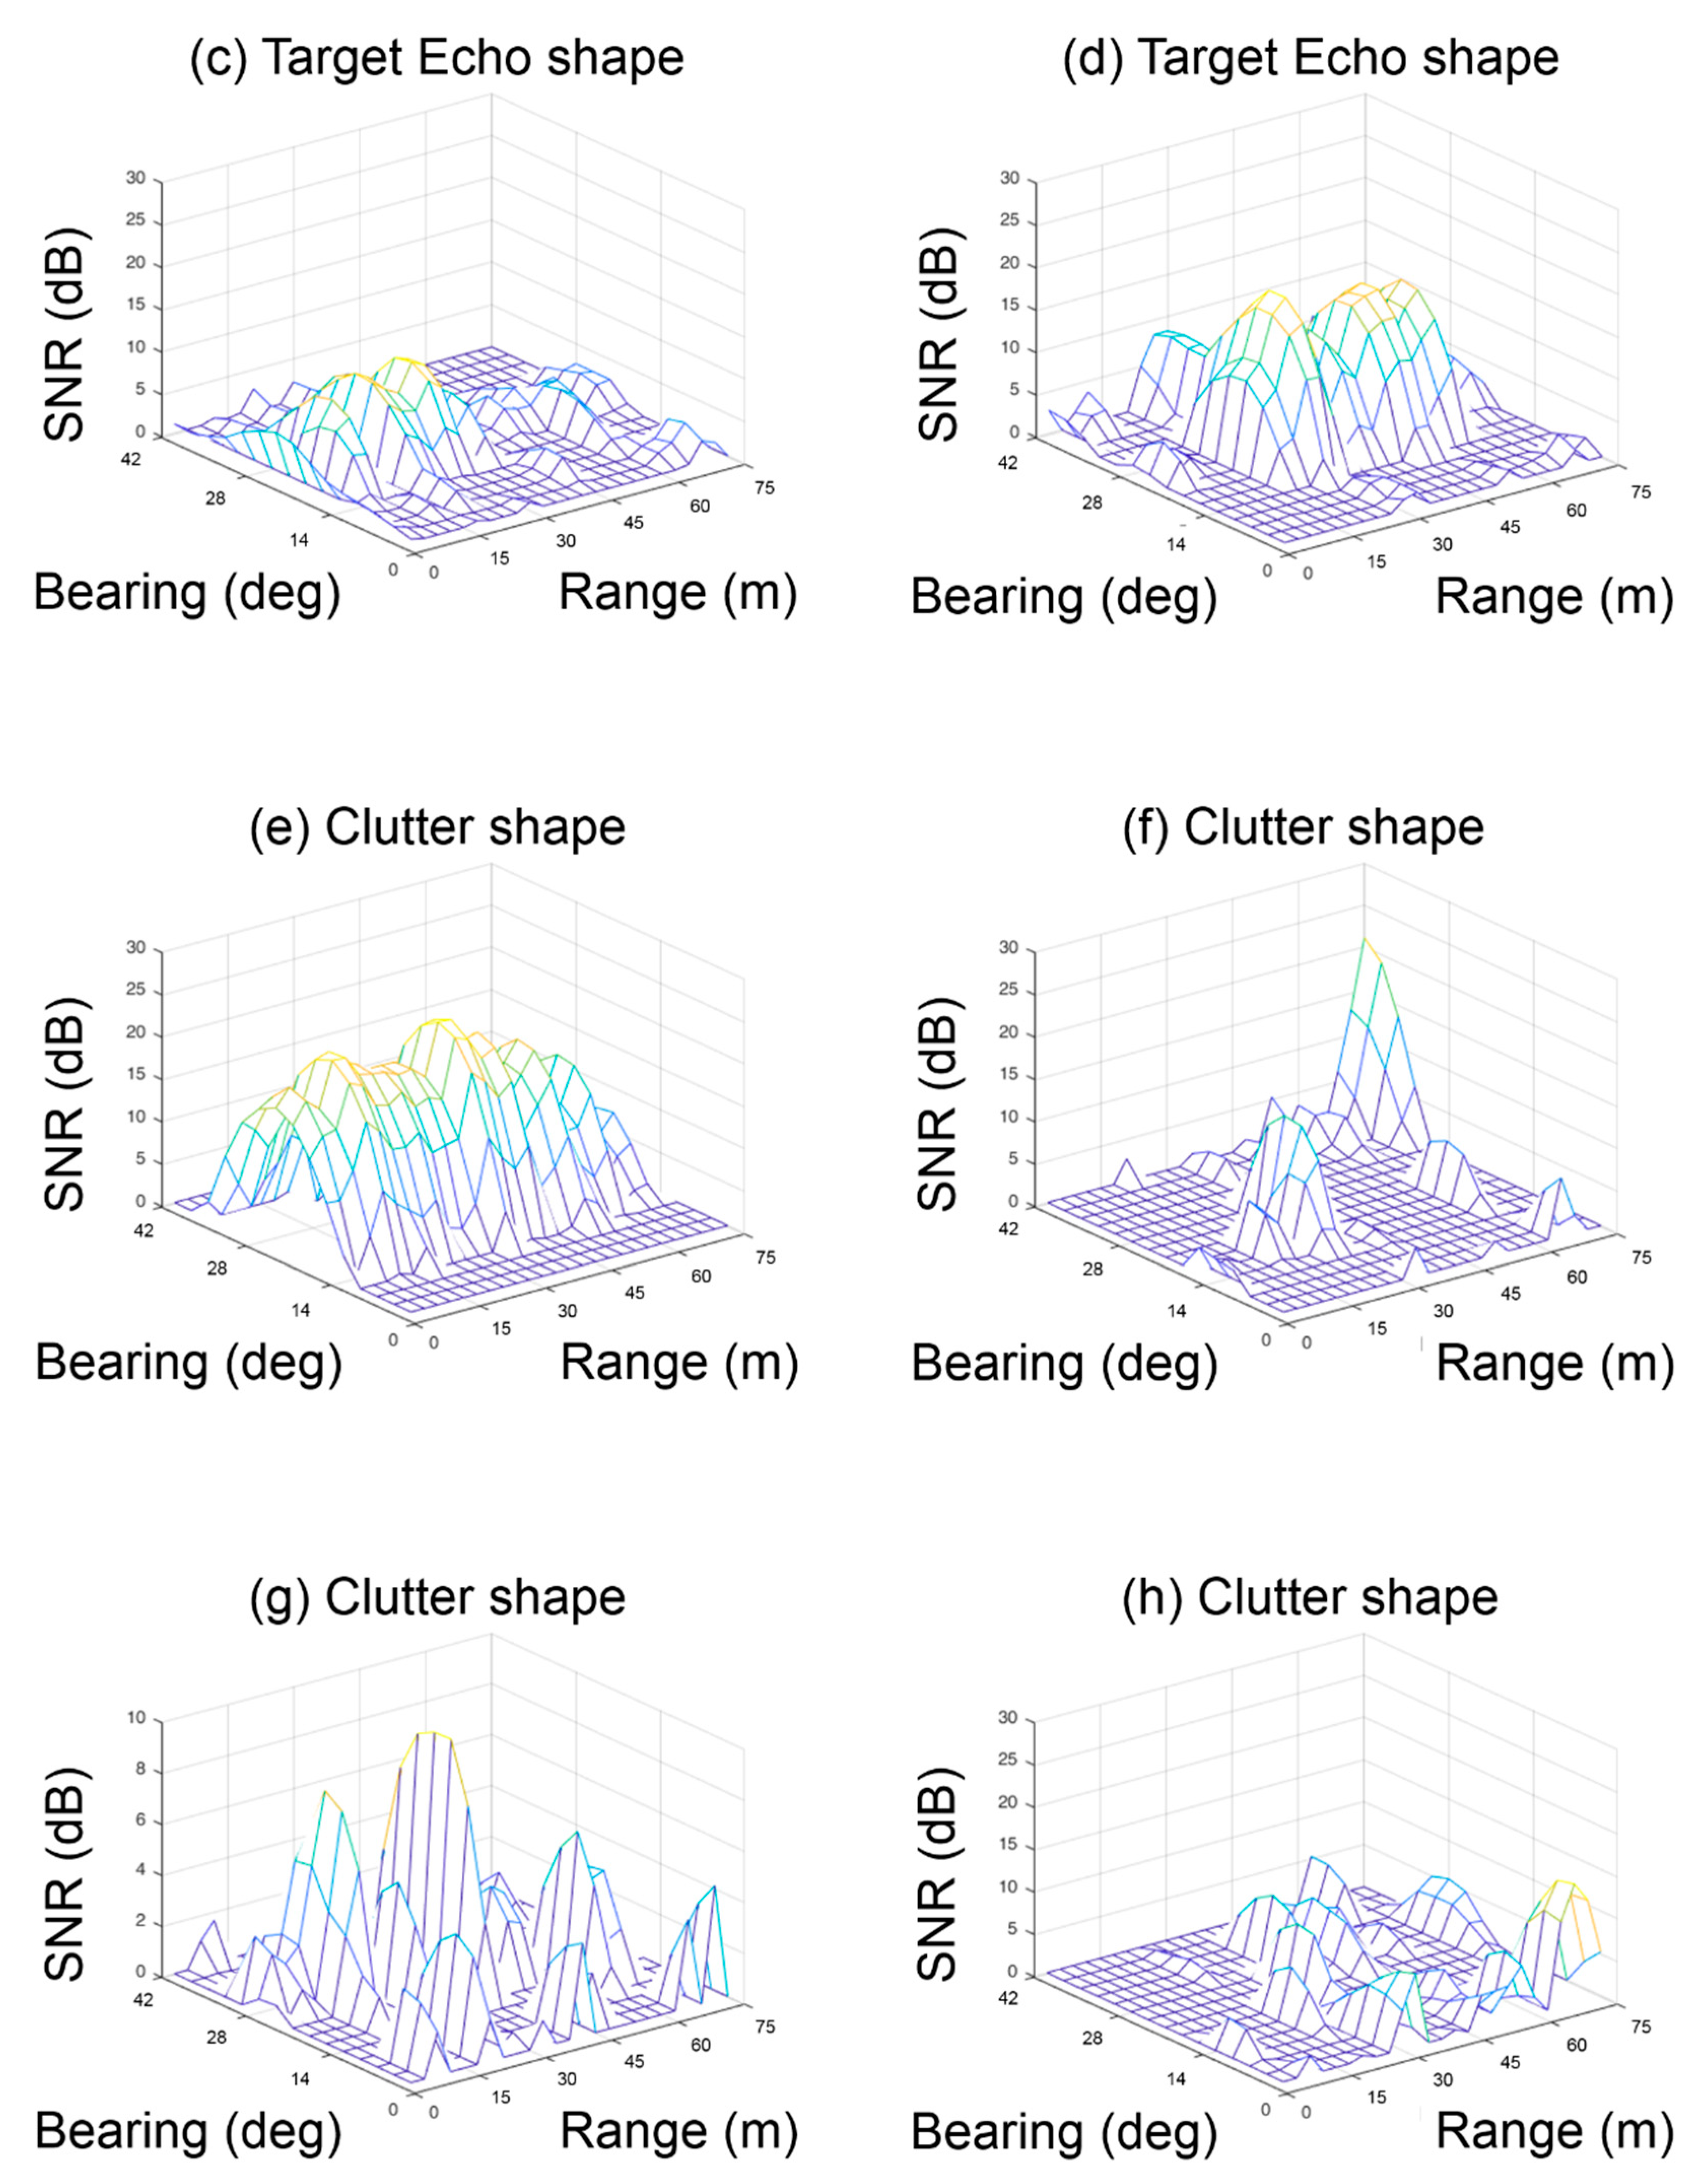
The underwater noise level is a function of the environment’s elements, such as the sea state and surrounding sea traffic; this ultimately affects the intensity and patterns of echoes. The target’s echo strength mainly depends on the type of target and the aspect angle of the incident-transmitted signal. These factors affect the SNR of the target echo and echo patterns. They eventually lead to variable SNR in a sonar’s signal processing and make it more difficult to continuously detect and classify targets. In particular, low SNR signals do not yield enough feature information to distinguish them from clutter. For this reason, much research has studied returns above a preset threshold to solve the classification problem. These signals in the matched filter output data are selected for tracking, classification, and console display by sonar operators. However, the extraction process of these signals is inaccurate since the operators empirically adjust the threshold. If target echo SNR is under the threshold by the operators, the target cannot be detected and classified. Thus, extracted data from the matched filter output are very important because the data affect the operator’s manual tracking and classification performance. In most military applications, it is important to continuously track and classify the target. The long PRI required to detect long-range targets means that less data can be obtained over time, so it is hard to know the changes in environmental noise and target strength soon enough to take action. For this reason, we propose a multilayer classification algorithm, which is applicable to all signals without presetting the threshold in one ping’s data regardless of the signal SNR.
In this paper, the approach to obtaining feature information incorporates two factors. One is that since a target submarine has a typical type, size, material and volume, the distributed energy pattern of its echo can be different than that from clutter. Second, the sources affecting the SNR of echoes are the ambient noise and target strength according to the ping’s incident angle. These sources are reflected in the signal processing output and can be extracted as feature vectors from different echo areas. In general, the target return strength for a ping abeam (long side) of a submarine target is 15 dB while a head-on ping off the front is known to be 5 dB [
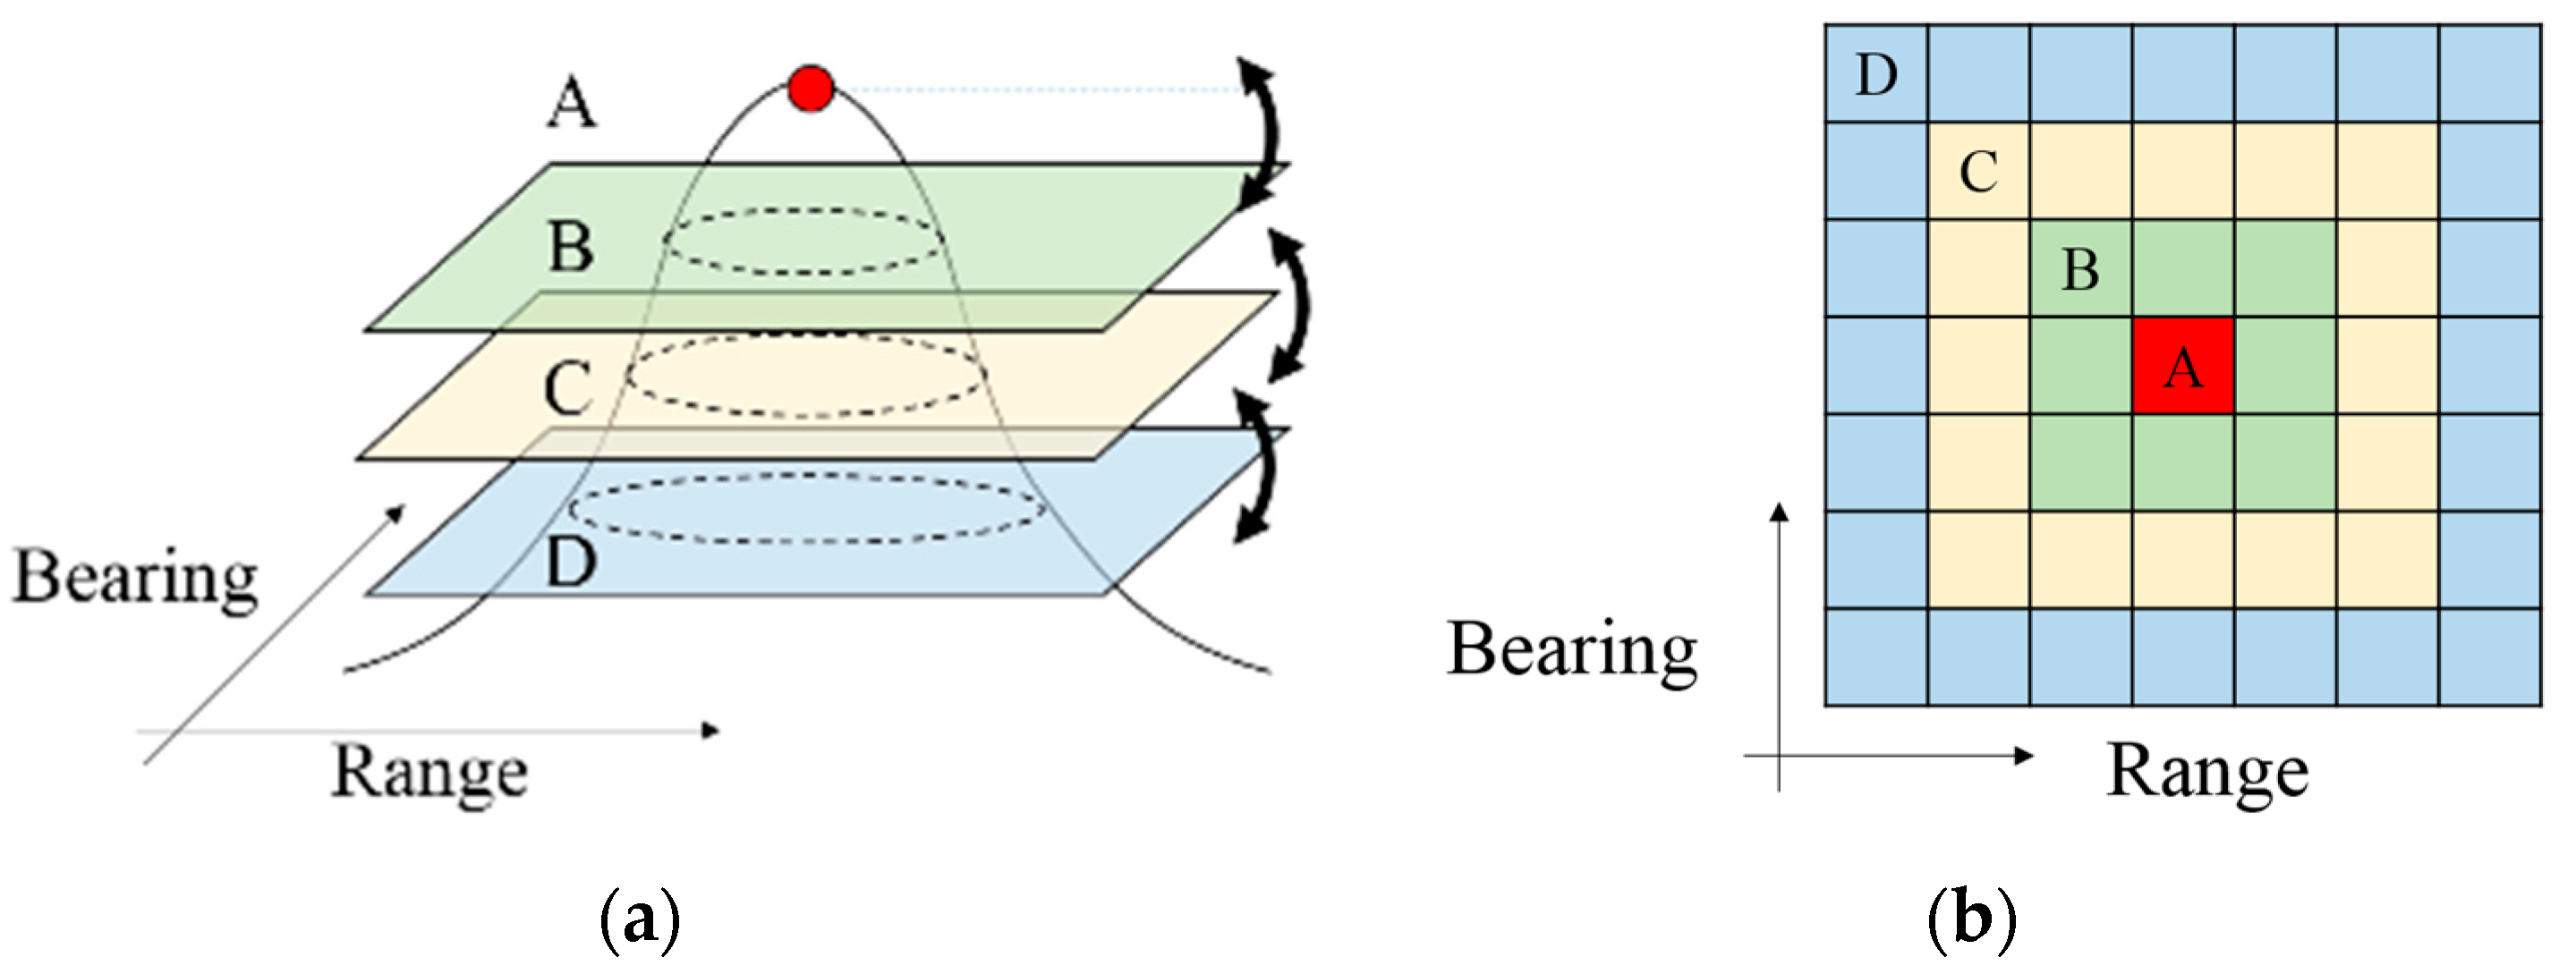
17]. This means that the SNR of the target signal varies over at least a 10-dB difference according to the aspect angle of a submarine, and thus may lead to classification performance degradation. Even if the energy in the edge region of the target echo is reduced by noise or decreased by the target aspect, the feature information of the remaining echo energy region near the center point can be retained. We focus on the surviving classifiable feature components from variations in target echo strength by extracting the spatial feature information in the sonar’s matched filter output.
Much research has concentrated on the separation of feature vectors by labeling target signals and clutter signals of sufficient intensity. There have also been efforts to separate ambient reverberations. In this paper, we consider a real target as prior target information and assume that it has characteristic features governing the echo appearance of the matched filter output (range-bearing output) using statistical parameters. The performance of the proposed algorithm is evaluated in terms of classification [
18,
19] and the false alarm rate. A support vector machine (SVM) is utilized to separate the feature vectors. The rest of this paper is organized as follows: In
Section 2, the SVM is introduced.
Section 3 describes the multilayer classification algorithm.
Section 4 shows the experiment, results, and discussions. Finally, in
Section 5, we summarize our conclusions.
2. Introduction to the Support Vector Machine
The SVM enables linear separation by transforming an input space with nonlinear characteristics into a feature space of more dimensions by using a kernel function that can provide an optimal solution. It has attracted a great deal of attention due to the novelty of the concepts that it brings to pattern recognition, its strong mathematical foundation, and its excellent results in practical problems [
20,
21].
We assume that data samples are as follows:
where
and
are input samples and the number of samples, respectively.
We find a hyper-plane
with the smallest norm of the coefficient
having the largest margin (
), where
and
are weight vector and bias, respectively. To find an optimal hyper-plane, we use the minimized function
under the constraint
, where the operation is an inner product. The solution to this optimization is given by the saddle point of the Lagrangian as:
where
is the Lagrange multiplier.
A multi-layer perceptron neural network (MLP NN) and support vector machine (SVM) were used to analyze the classification performance and SVM showed better results for sonar signals [
20]. In [
20], MLP NN had been shown to be easily affected by learning algorithms, input samples, and initial variables. In contrast, it showed that SVM has a relatively robust classification capability. The performance analysis of four classifier algorithms, multivariate Gaussian, evidential K-nearest neighbor (K-NN), probabilistic neural network (PNN), and SVM, were conducted from data for near-field detection [
22]. The result showed that the SVM had better performance for high dimensional features and the kernel function was an important factor. In [
22], the results showed that SVM was more robust for an unbalanced number of training samples, that is, the number of the target sample is small and the clutter is huge. In addition, SVM was less affected by the scattered and mixed characteristics of the underwater environment. A study on sonar data classification according to the kernel function of SVM [
23] was performed. In [
23], the results showed that the radial basis function (RBF) kernel had better performance than polynomial kernel. For these reasons, we use a SVM classifier and a Gaussian function type RBF kernel, which has already been widely used for sonar classification.
4. Experimental Results and Discussion
In this section, the proposed approach is verified with real sea trial data. As mentioned, the experiments were conducted with naval ships in the East Sea of Korea for several years. In order to acquire representative data from the sea area, we collected data over various sea areas, seasons, target moving patterns, water depths, sea states (from 0 to 2), and other environmental influences. We followed and checked all of the target routes for accurate analysis. Finally, we acquired data from 1123 pings spread across all experiments. Only a single target echo from each ping was used, and other echoes were regarded as clutter. We illustrate the characteristics of the proposed algorithm in scatter diagrams of several feature vectors and quantitatively summarize the performance in classification tables of all data.
4.1. The Experiments in the Sea
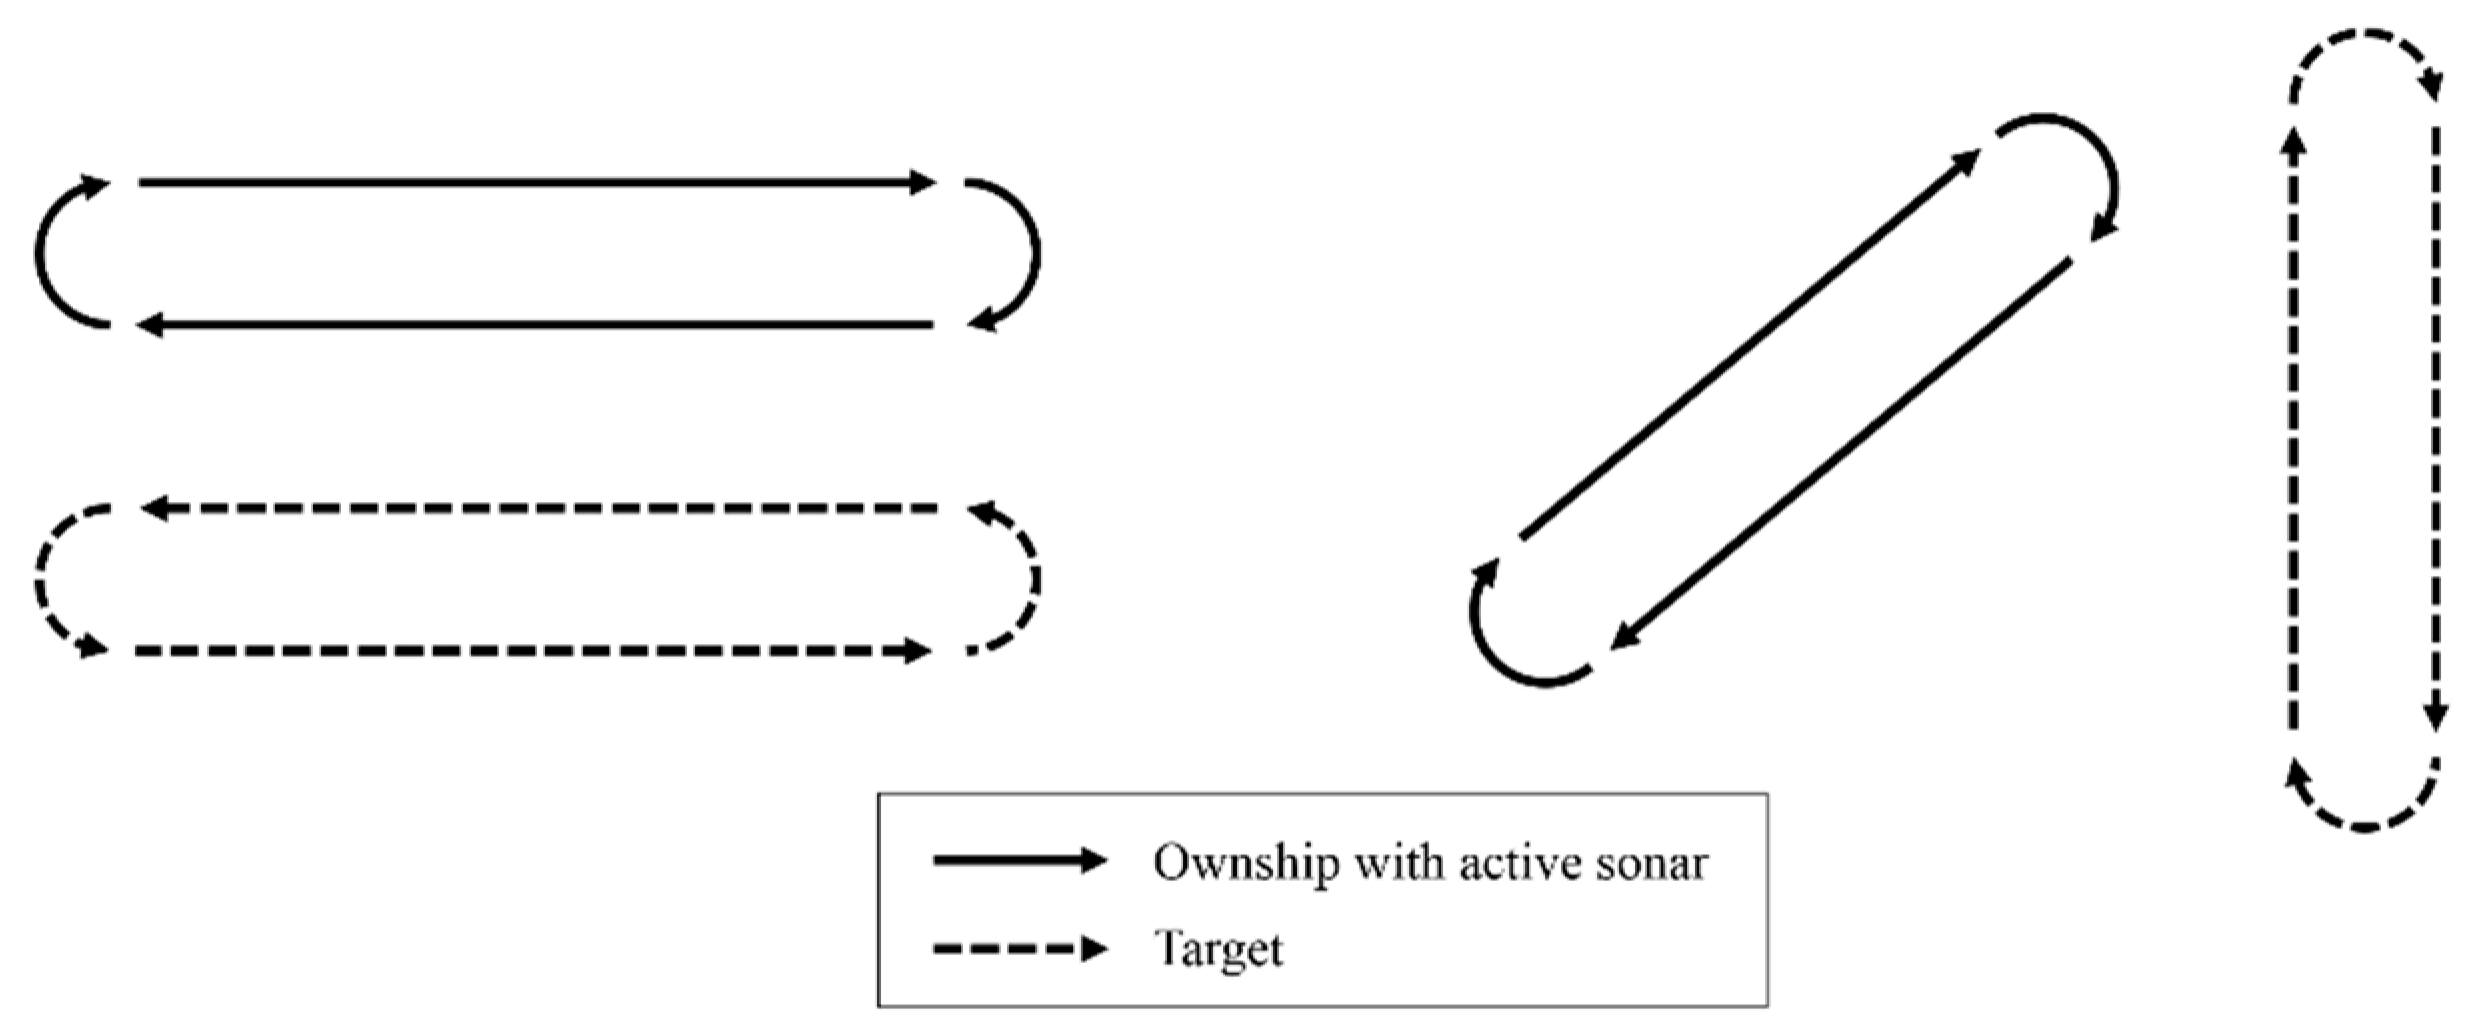
In this paper, we consider the use of an active hull-mounted sonar system to detect a moving underwater target. Two schematics of several experiment situations considered are described in
Figure 5. In conventional algorithms, the target detection and classification are done by comparing the matched filter signal to a preset threshold. In this case, target and clutter signals with SNRs above the threshold are labeled. In long-range detection, several classification schemes are applied with appropriately high SNR signals that have enough feature information to separate target and clutter components. These schemes can increase the false alarm rate when the clutter signals are stronger than the target signals and also decrease the classification rate for weak target signals. It is essential to detect targets with continuing false alarms because any target can be a threat. Thus, it is very important to constantly attempt target detection even if the probability of false alarm sometimes goes up.
The experimental data were obtained in the East Sea of South Korea in 2006, 2008, 2009, 2011, and 2012 with hull-mounted active sonar systems (DSQS21BZ and SQS-240K) operating on Korean Navy ships. The experiments were designed to cover a variety of underwater environments and general target maneuvers. We included both summer and winter data with their opposing sonic propagation characteristics and data from the beam to the bow direction to obtain a variety of target echo strengths as a function of the incident angle. The feature component analysis experiments were continuously conducted until the target signal was lower than the ambient noise. The target size was less than 100 m long; the East Sea of Korea is approximately 500 to 3000 m deep. The range to the target from ownship was about 4 to 15 kyds (approximately 3.6 to 13.7 km). The active sonar was operated with LFM and CW signals having a center frequency 5 to 10 kHz and a pulse length under 500 ms.
Figure 5 shows examples of the experimental ownship and target movement paths.
Matched filter outputs were acquired from the signal processing unit of the experimental active sonar system. First, we extracted all echoes having a peak signal above the noise level. Typically, most extracted patches are clutter because the real target is a single return, and it is especially difficult to separate low SNR target signals from clutter. Echo characteristics are determined by the target size, target shape, ping incident angle, multipath effect, and elongation effect. In this paper, we focus on an adaptive approach for continuous detection. Normally, if the reflected signal level is low, it is harder to separate the target from clutter because sufficient feature vectors cannot be extracted, decreasing the classification rate. In order to process low SNR target echoes, we continuously checked and acquire data in situations where the target echo is both lower and higher than the noise level. The orientation of the target, the active sonar PRI, and the GPS position and orientation of ownship are used to confirm the target echo.
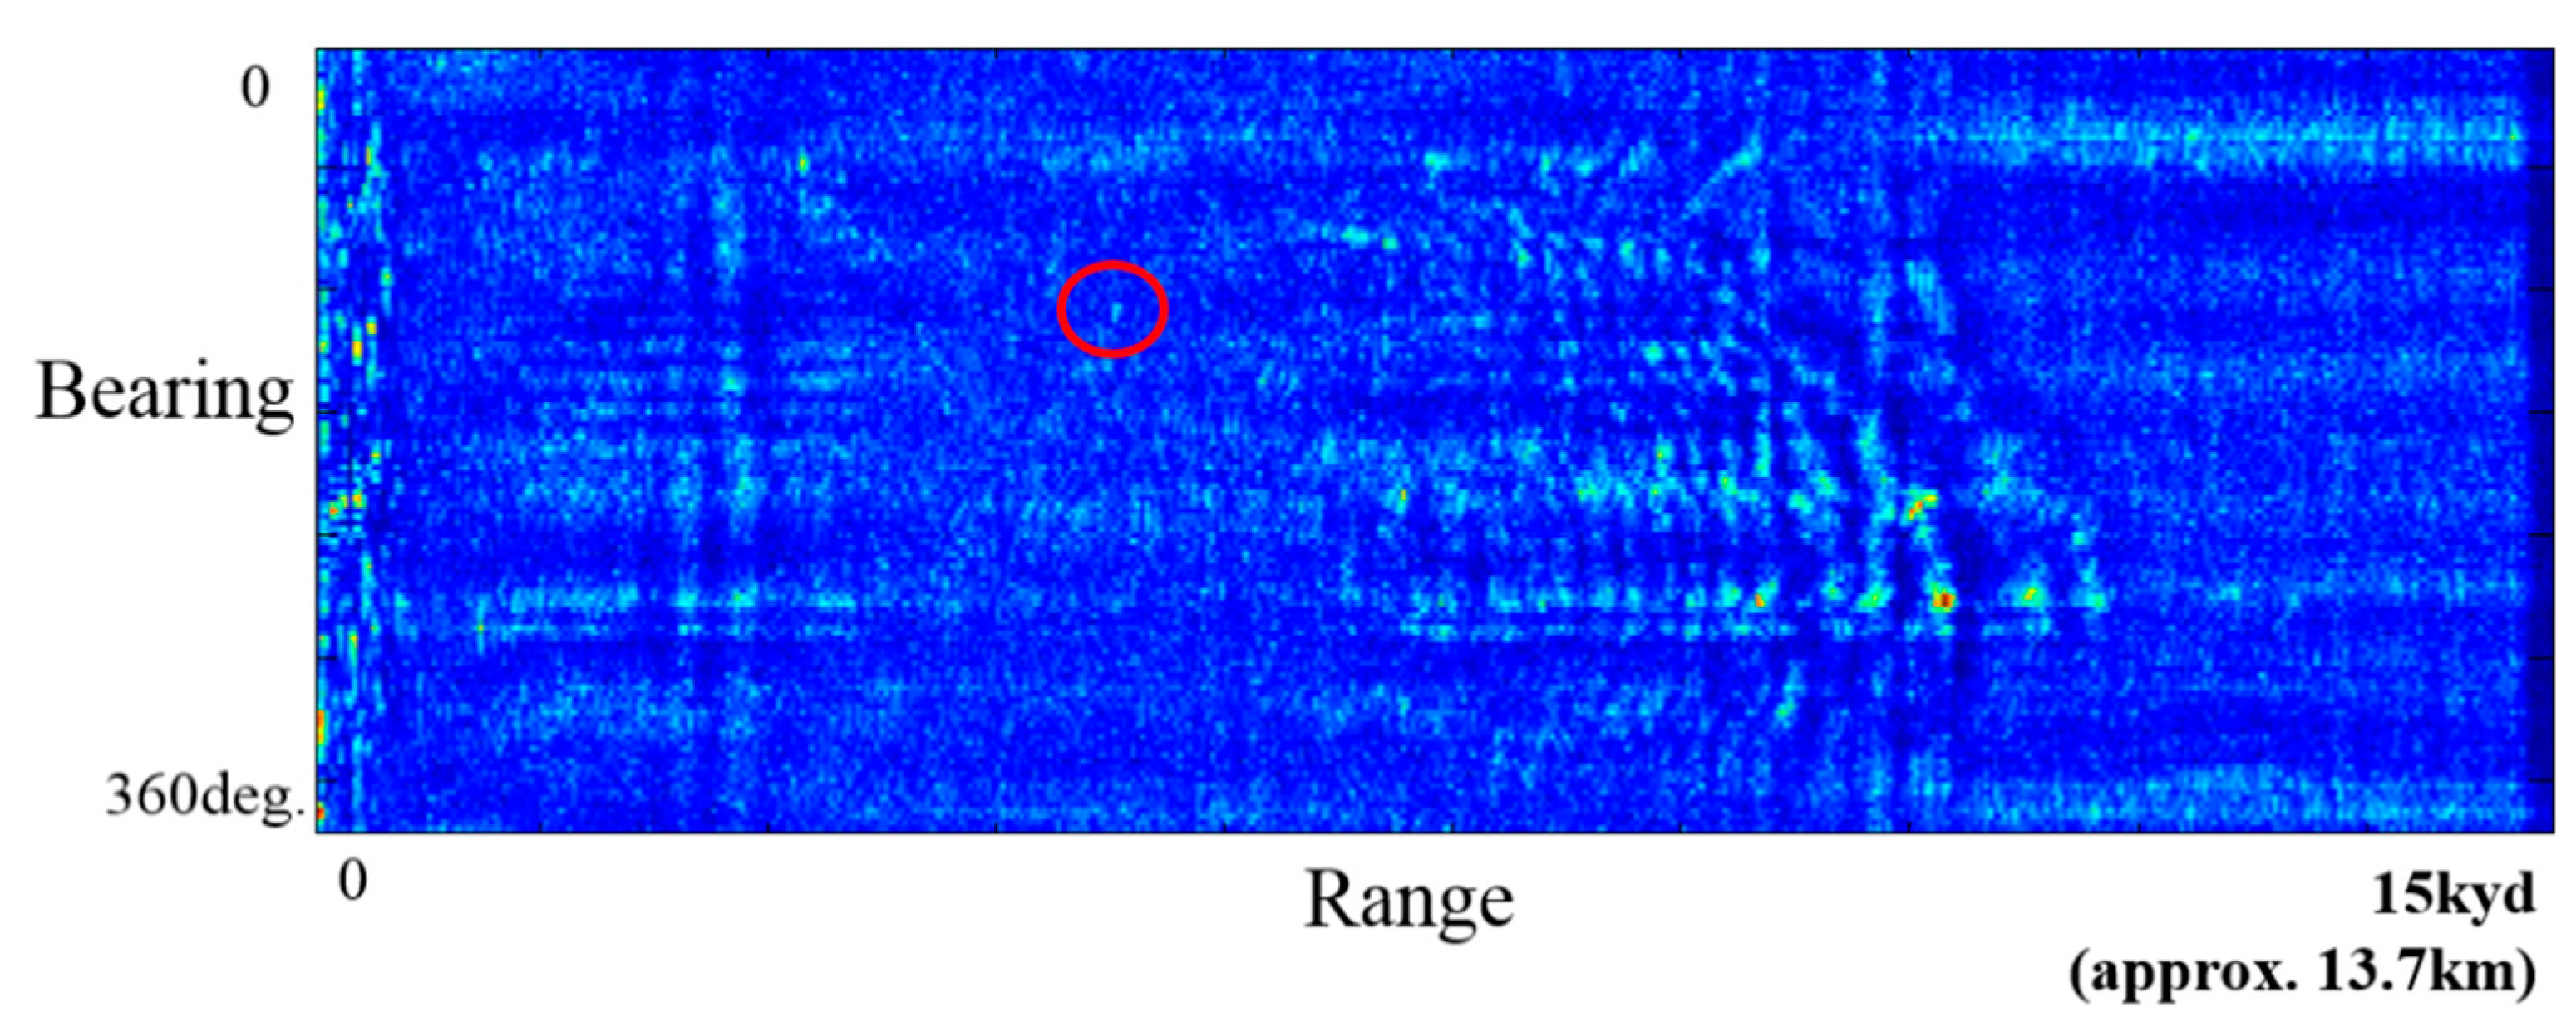
Figure 6 shows one example from several experiments of a normalized matched filter output in the bearing-range domain. In
Figure 6, the red circle indicates the target position; we can see that the SNR of many clutters is higher than that of the target. In this case, if a preset threshold higher than the target SNR is applied, the target echo may not be detected. For this reason, a weak target echo should be classified regardless of the threshold.
4.2. Experiment Data
In the experiments, ownship with active sonar, a single target, and a few surface ships in the vicinity were employed. The frequency range of the active system was 5–10 kHz and the pulse length was under 500 ms for CW and LFM transmissions. In order to test the performance, shuffle and split cross-validation was used. In total, 80% of the total data set were randomly selected for training and the remaining data were used for testing. This cross-validation was carried out 1000 times to evaluate the average detection performance.
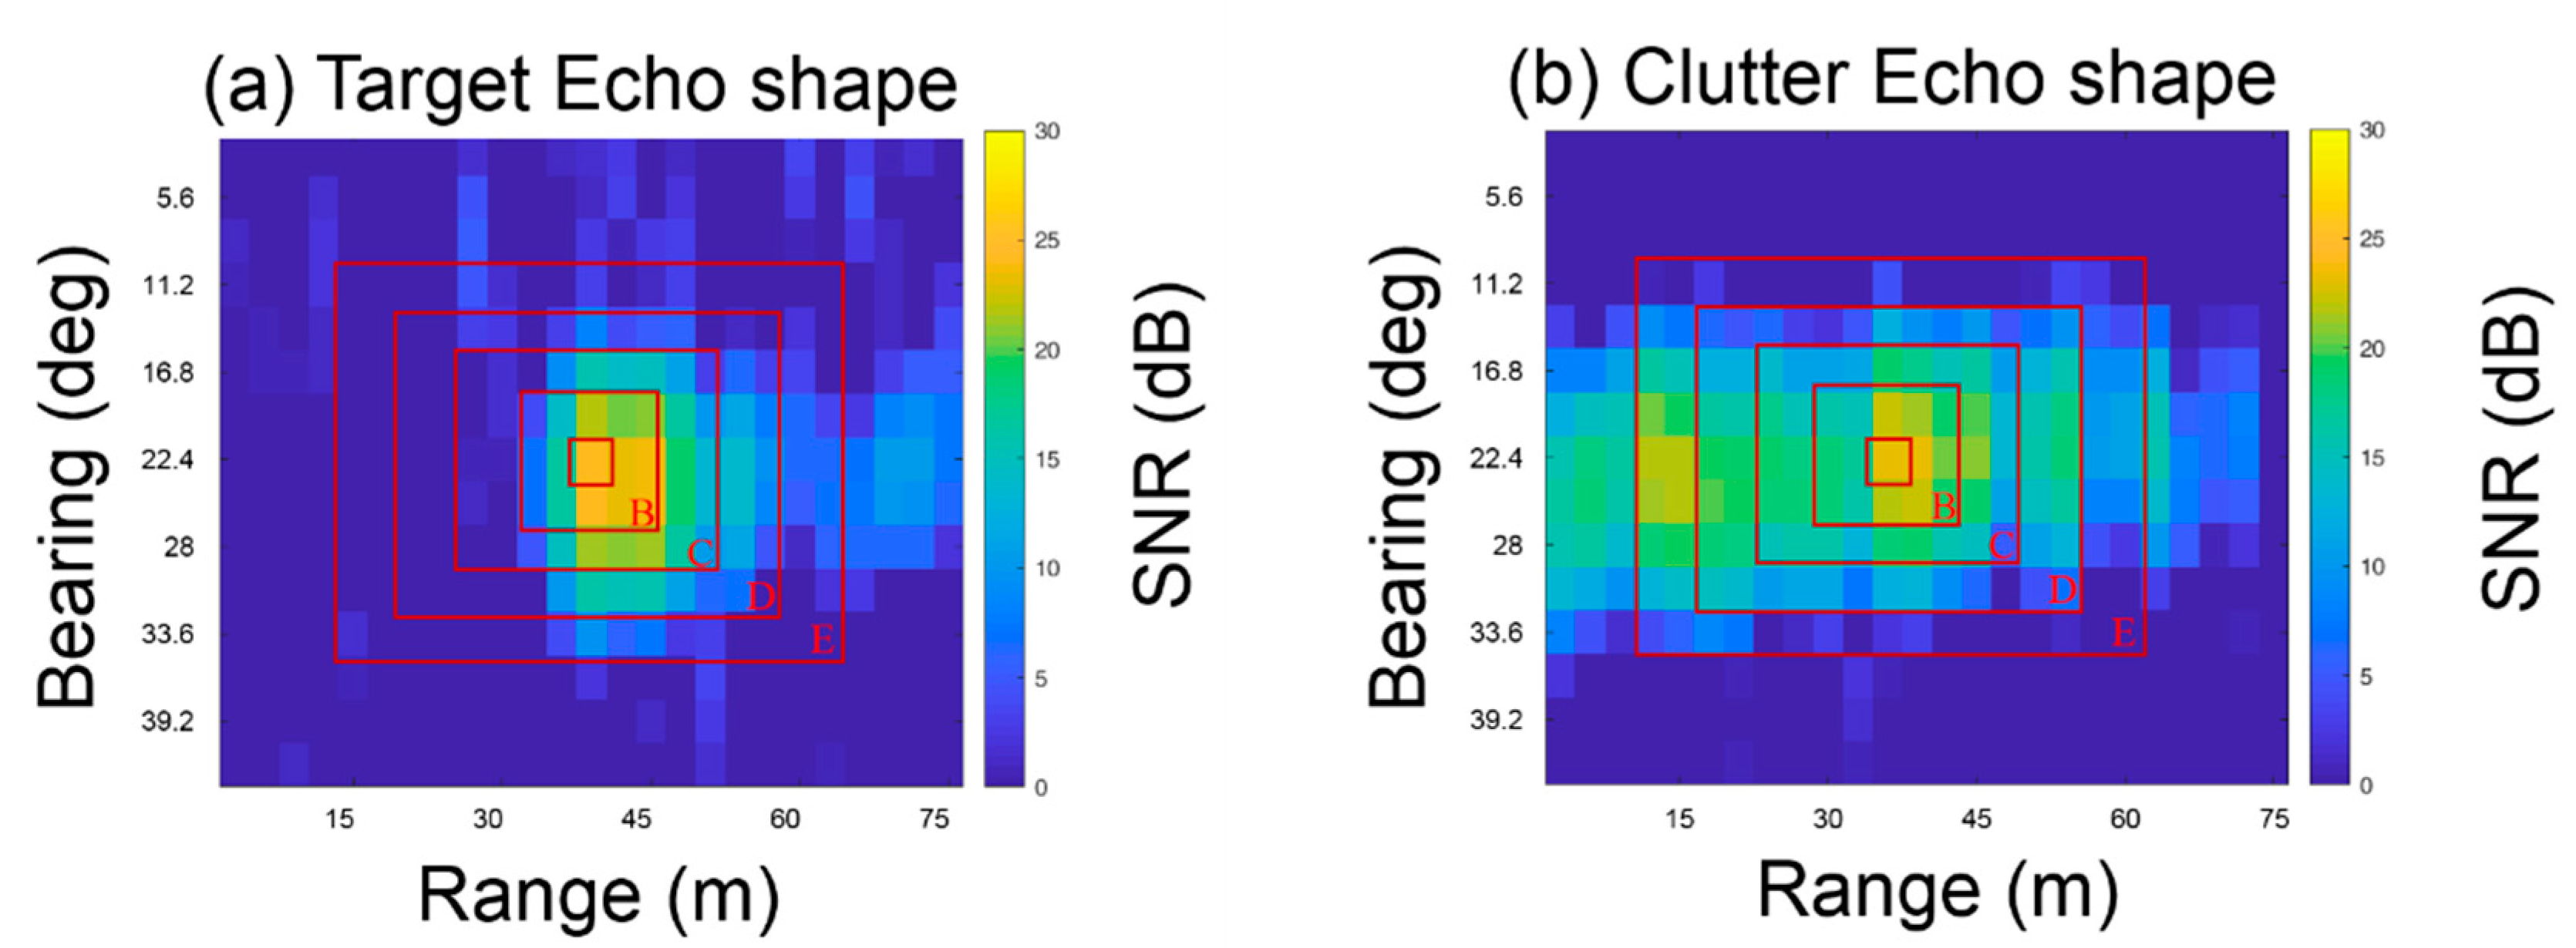
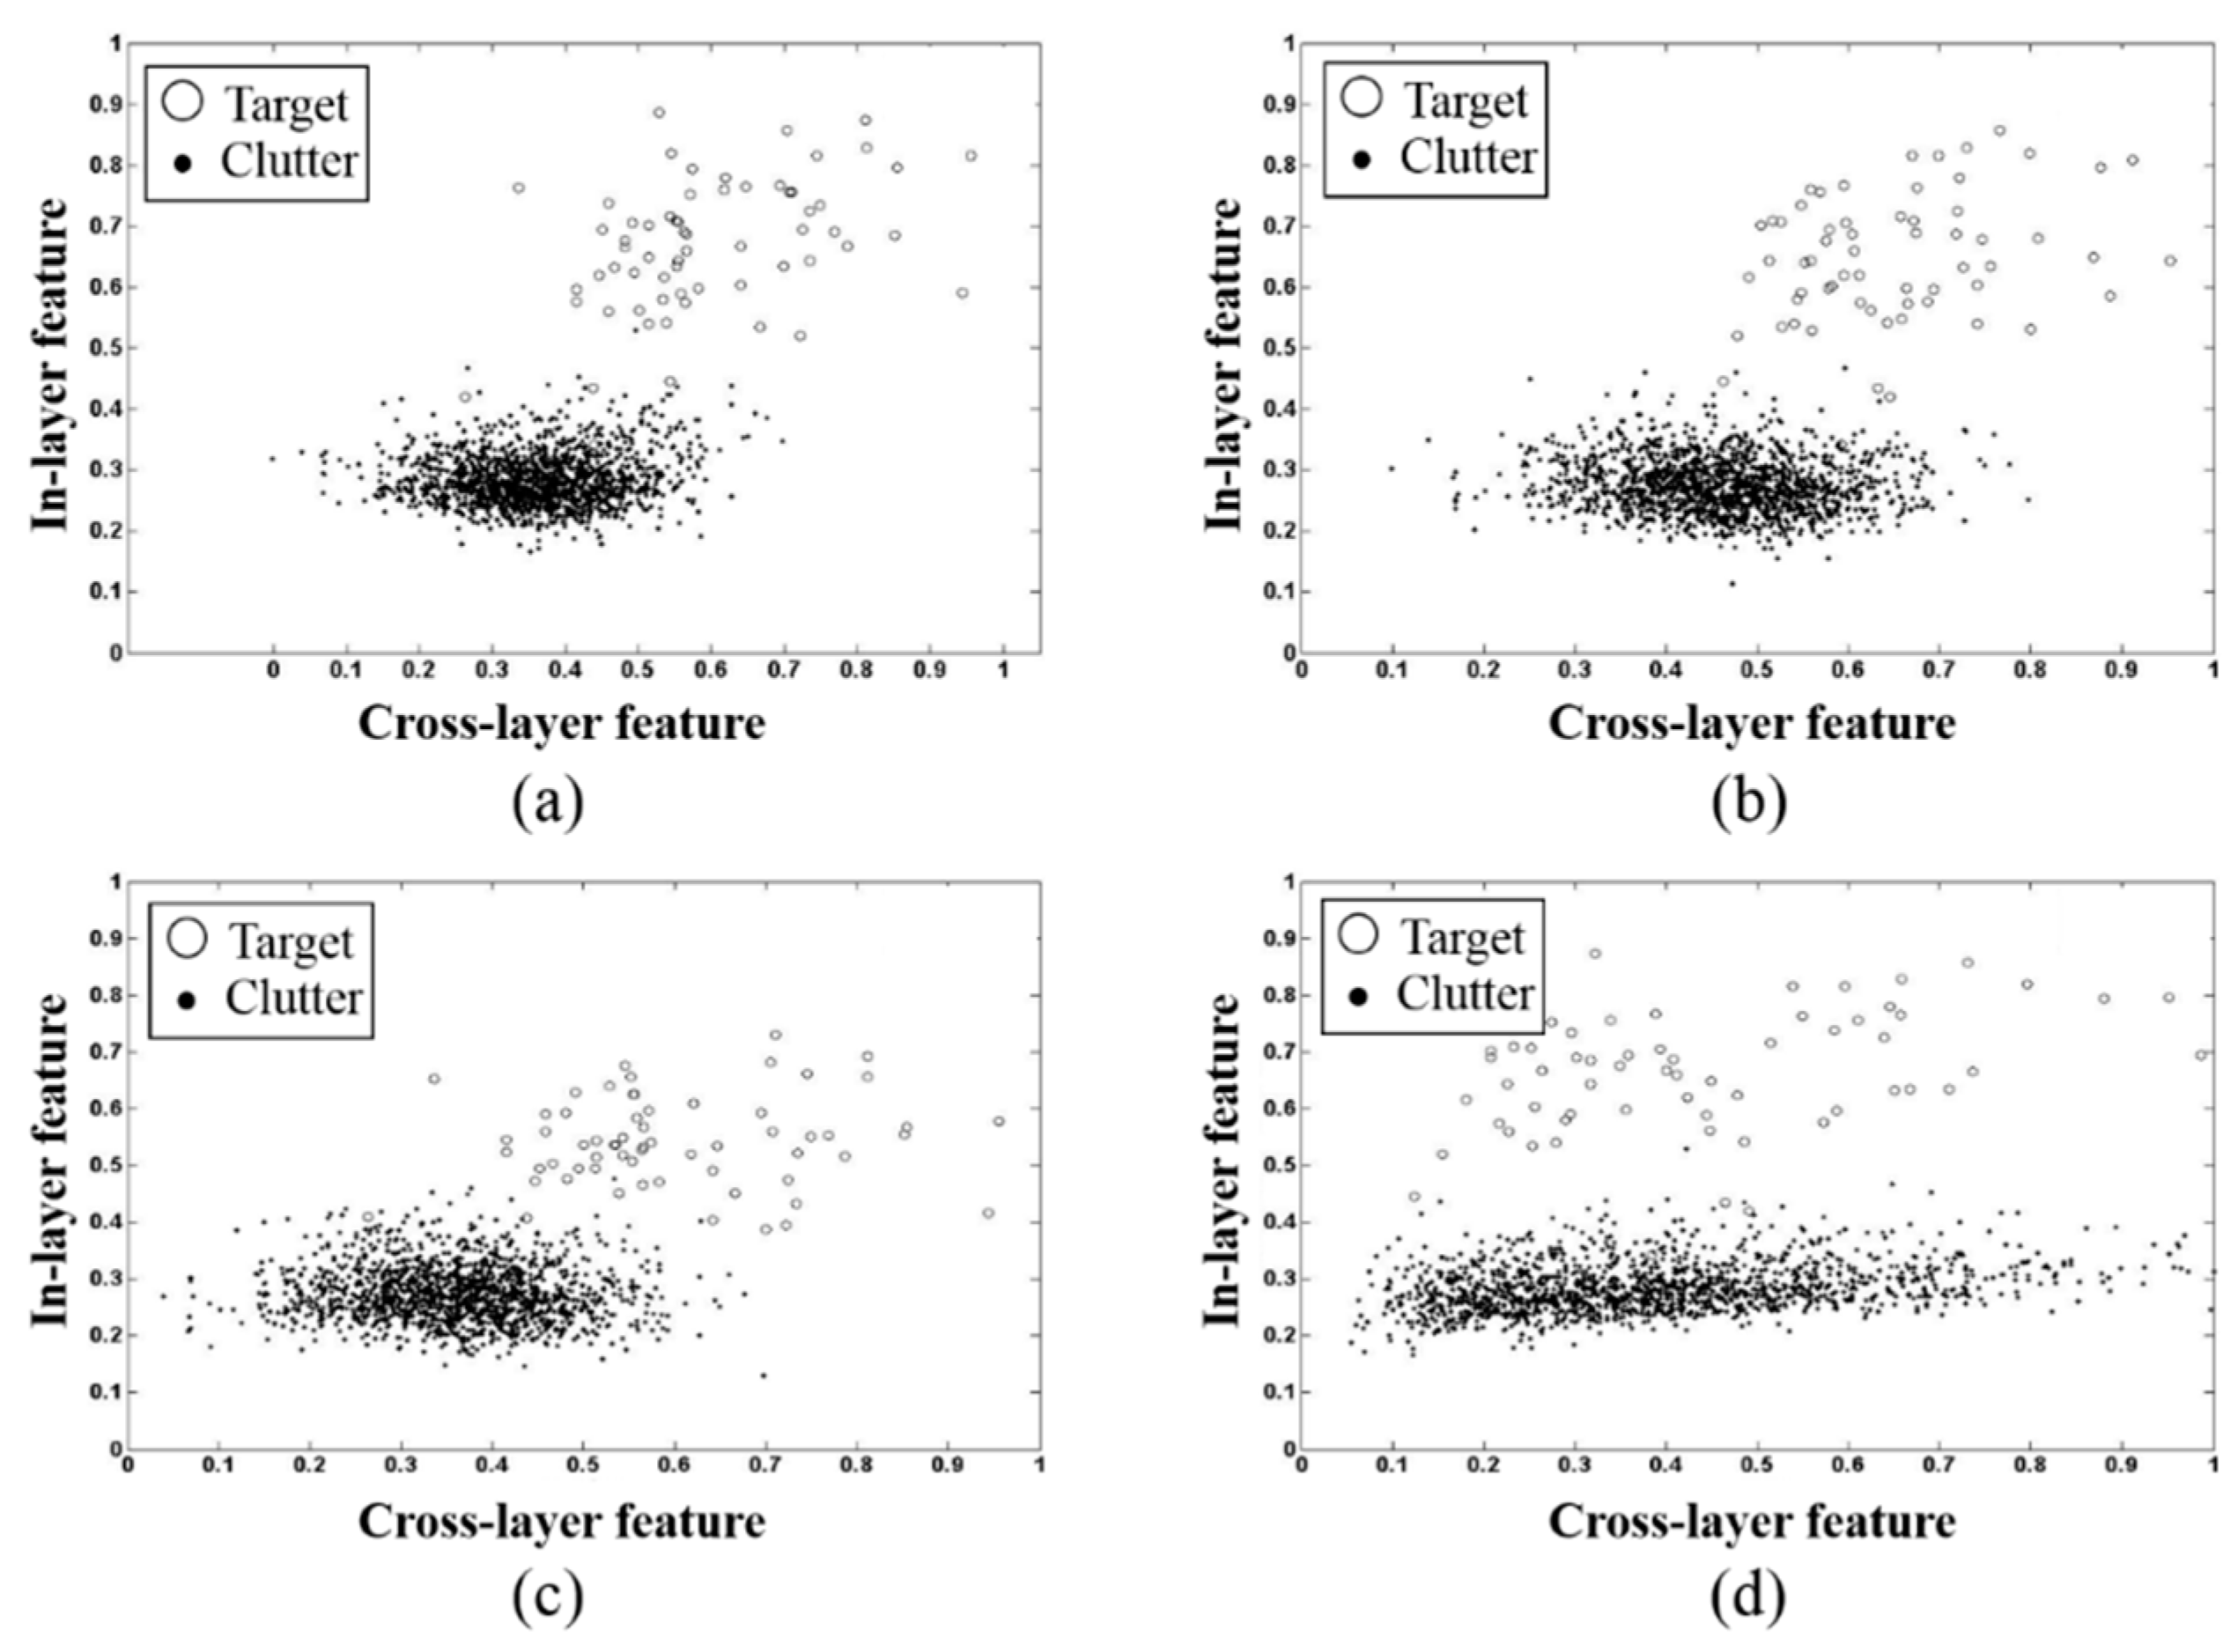
For each ping, clutter was extracted for all peak data above the noise level. We did not categorize clutters into similar groups; we simply focused on separating targets from clutters. In order to extract all peak candidates, we scanned each ping’s matched filter output data in two dimensions. Since we knew the target position and moving route from the ship’s log file, we labeled and extracted target echo areas manually from the 1123 ping data sets for an exact target position search. Because multipath echoes show target-like patterns in terms of shape and geographical position, we categorized the multipath echoes as clutters according to their time delay and the known target position. In addition, for an evaluation of weak target classification, we divided all extracted data into two groups as weak or strong. The weak signal group was defined as the lower half of an SNR-ordered list of the signals extracted, and the strong signal group was defined as the upper half. In
Figure 7, scatter diagrams show that in-layer and cross-layer feature vectors can separate targets from clutter efficiently.
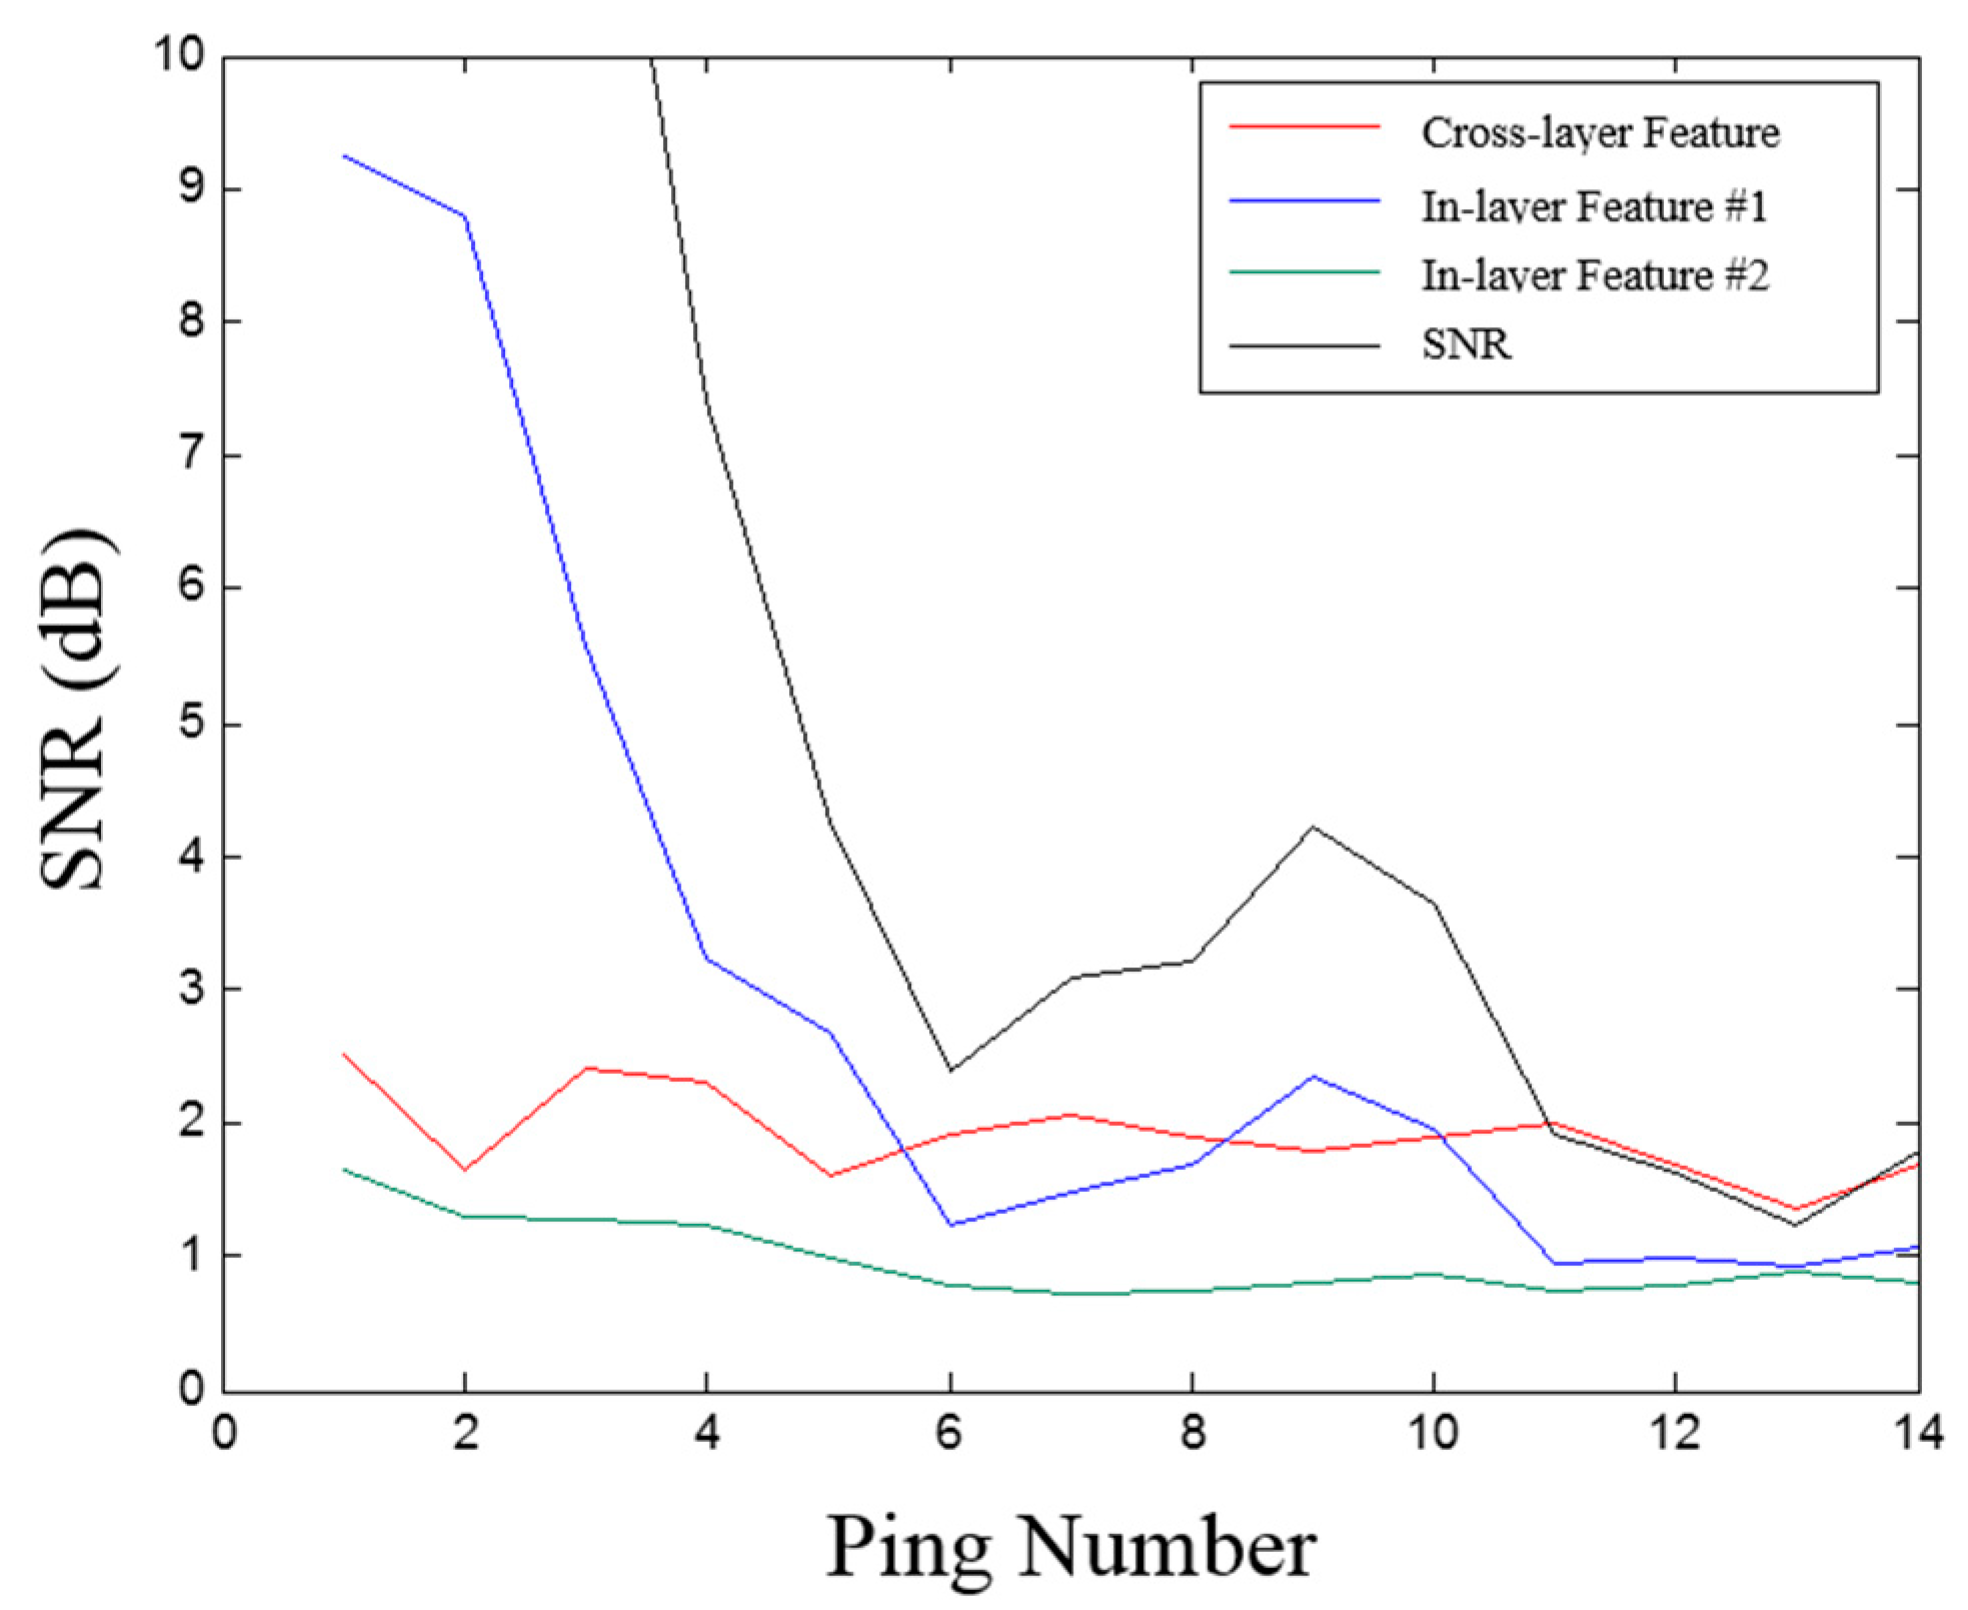
As mentioned, one of the purposes of this study was to investigate whether it is possible to detect a weak target. Thus, we followed the history of the real target echo SNR, and when the SNR came down, we analyzed the effect of the feature vectors. In
Figure 8, in-layer feature #1 is the feature value of the B layer near the peak of the echo. In-layer feature #2 is the feature value of the E layer region (edge area) furthest from the peak.
Figure 8 shows that the energy of the edge region is already low, similar to the noise level, so there is little change in the target echo’s SNR. Thus, in-layer feature #1 for the region where the echo energy is distributed is proportional to the SNR of target.
Figure 8 shows that in-layer features have fewer components to separate for a weak target. In contrast, the figure shows that the peak area feature of cross-layer feature vectors does not change much when the SNR of the target goes down to the noise level. This means that the remaining portion of the energy still has some feature components to classify a target in the cross-layer features. Thus, cross-layer features can detect a weak target efficiently and constantly, making the target continuously detectable.
4.3. Results and Discussions
We evaluated the average classification performance with 1000 simulations using weak, strong, and all data. For weak target detection analysis, 512 weak data were selected from the lower half of all data based on SNR and 611 remaining data were used for strong data. In total, 1000 clutters in each ping were randomly selected from the experimental data because the number of clutters greater than the noise level was huge. Weak and strong clutters were selected by the same algorithm used for target echoes.
Table 2 shows the classification performance over all experimental data, and
Table 3 shows the classification for weak and strong signals. In
Table 2, the proposed algorithm is effective in terms of both the classification percentage and false alarm percentage. In
Table 3, feature vectors trained in
Table 2 are tested for weak and strong signals, and the results are comparable to the results in
Table 2. The classification ratio is almost the same, especially for weak target signals. This means that the proposed algorithm has outstanding performance even for weak target signals and can be an effective scheme for active sonar system long-range detection applications.
In order to analyze the influence of strong clutters, only strong clutters were selected and trained. Thereafter, the process was the same as in the case where all data was analyzed. In
Table 4, the target classification rate is about 8% lower than the results of
Table 1, and the false alarm ratio is similar to the results of
Table 2. This result indicates that clutters for training should be selected according to clutter distributions of the experimental area for weak target classification; otherwise, the target classification performance can be degraded. Thus, even if there is no target in the sea, data acquisition with active sonar in the underwater environment is needed to accumulate clutter distributions.
Table 4 shows the average results of the classification performance when only the strong clutters are trained. In
Table 5, the weak and strong target classification percentages are 74.3% and 85.3%, respectively. This shows that the trained clutters affect target classification, so all of the clutters should be trained for classification performance improvement as mentioned above.
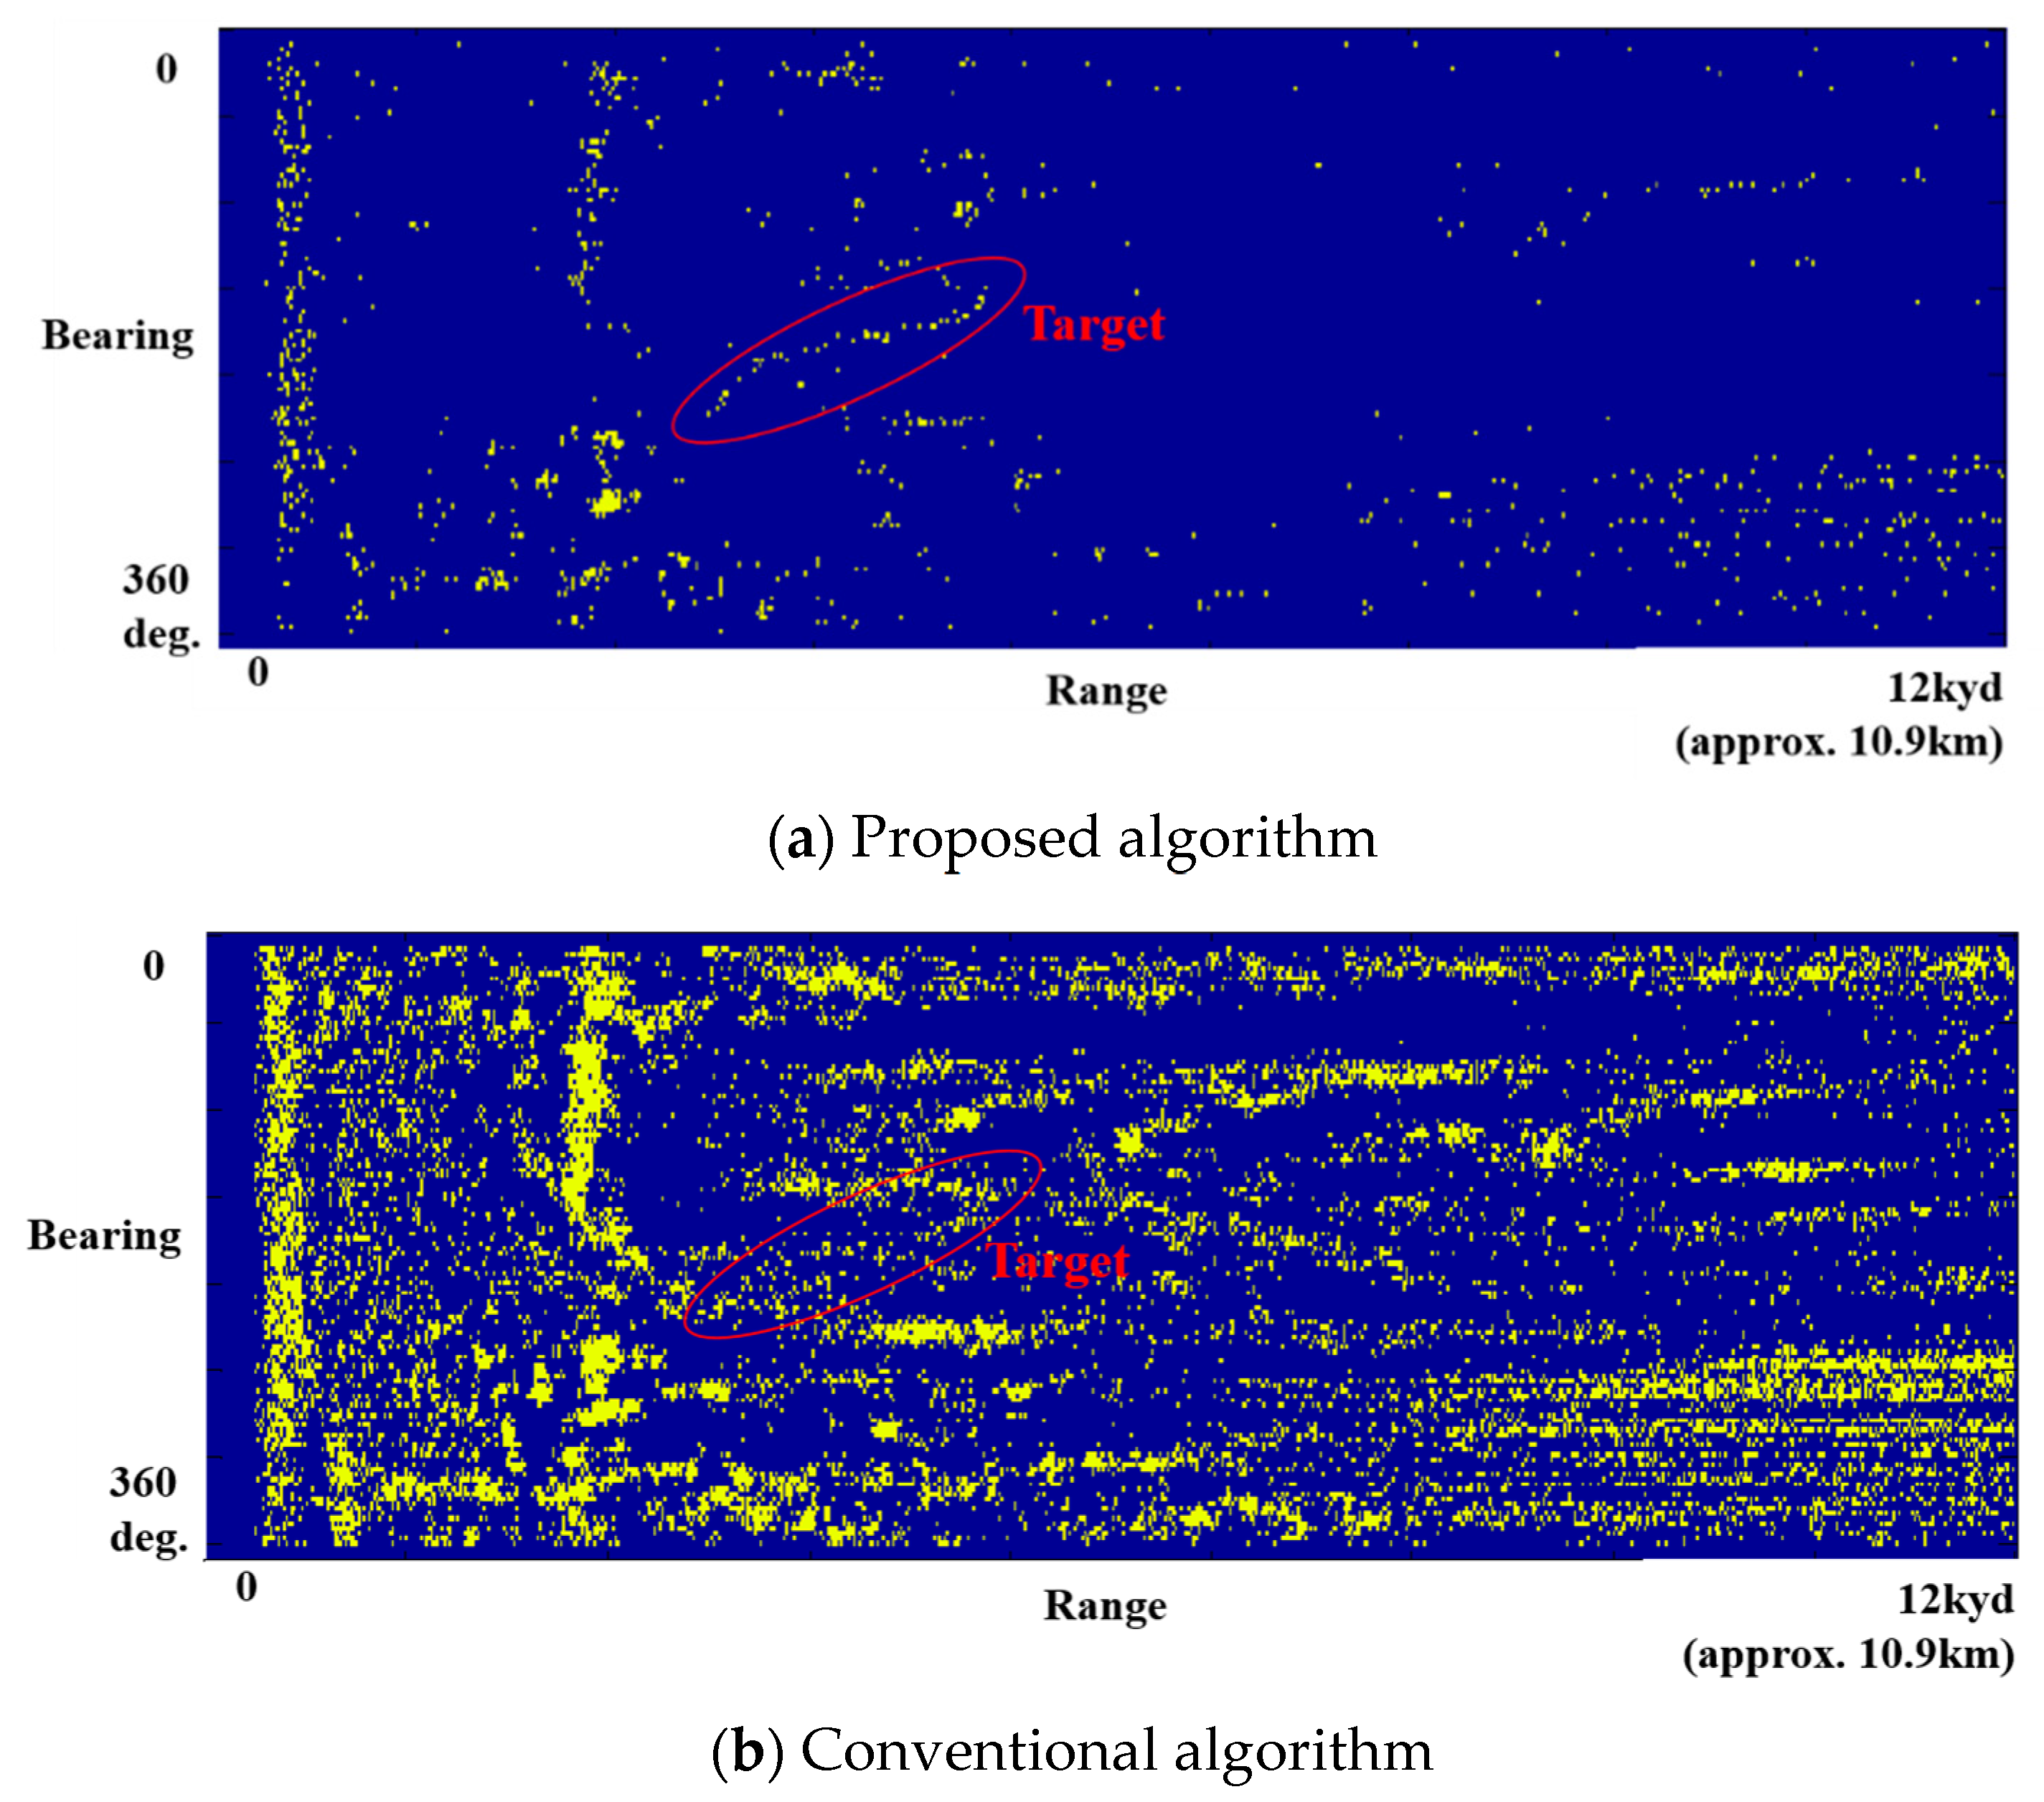
Figure 9 shows a ping history (50 pings of accumulated data) display comparing the proposed and conventional algorithms. The conventional algorithm is employed by presetting a threshold at 3 dB and extracting all signals that show the shape of the energy distribution up to the local minimum, the form of the largest peak center, and the gradually decreasing shape around the peak. This conventional algorithm is currently being applied to sonar systems and may not be the existing state of the art. We consider, however, that it is effective to compare the performance of the proposed algorithm. The situation is that the target comes toward the ownship and turns to the left during the last 10 pings. In the proposed algorithm result, target echoes are well classified and displayed. In addition, the number of clutters is greatly reduced compared with the conventional algorithm. This result shows that the proposed algorithm has a better performance in terms of the classification rate and false alarms. It can also help sonar operators greatly when detecting a target manually.
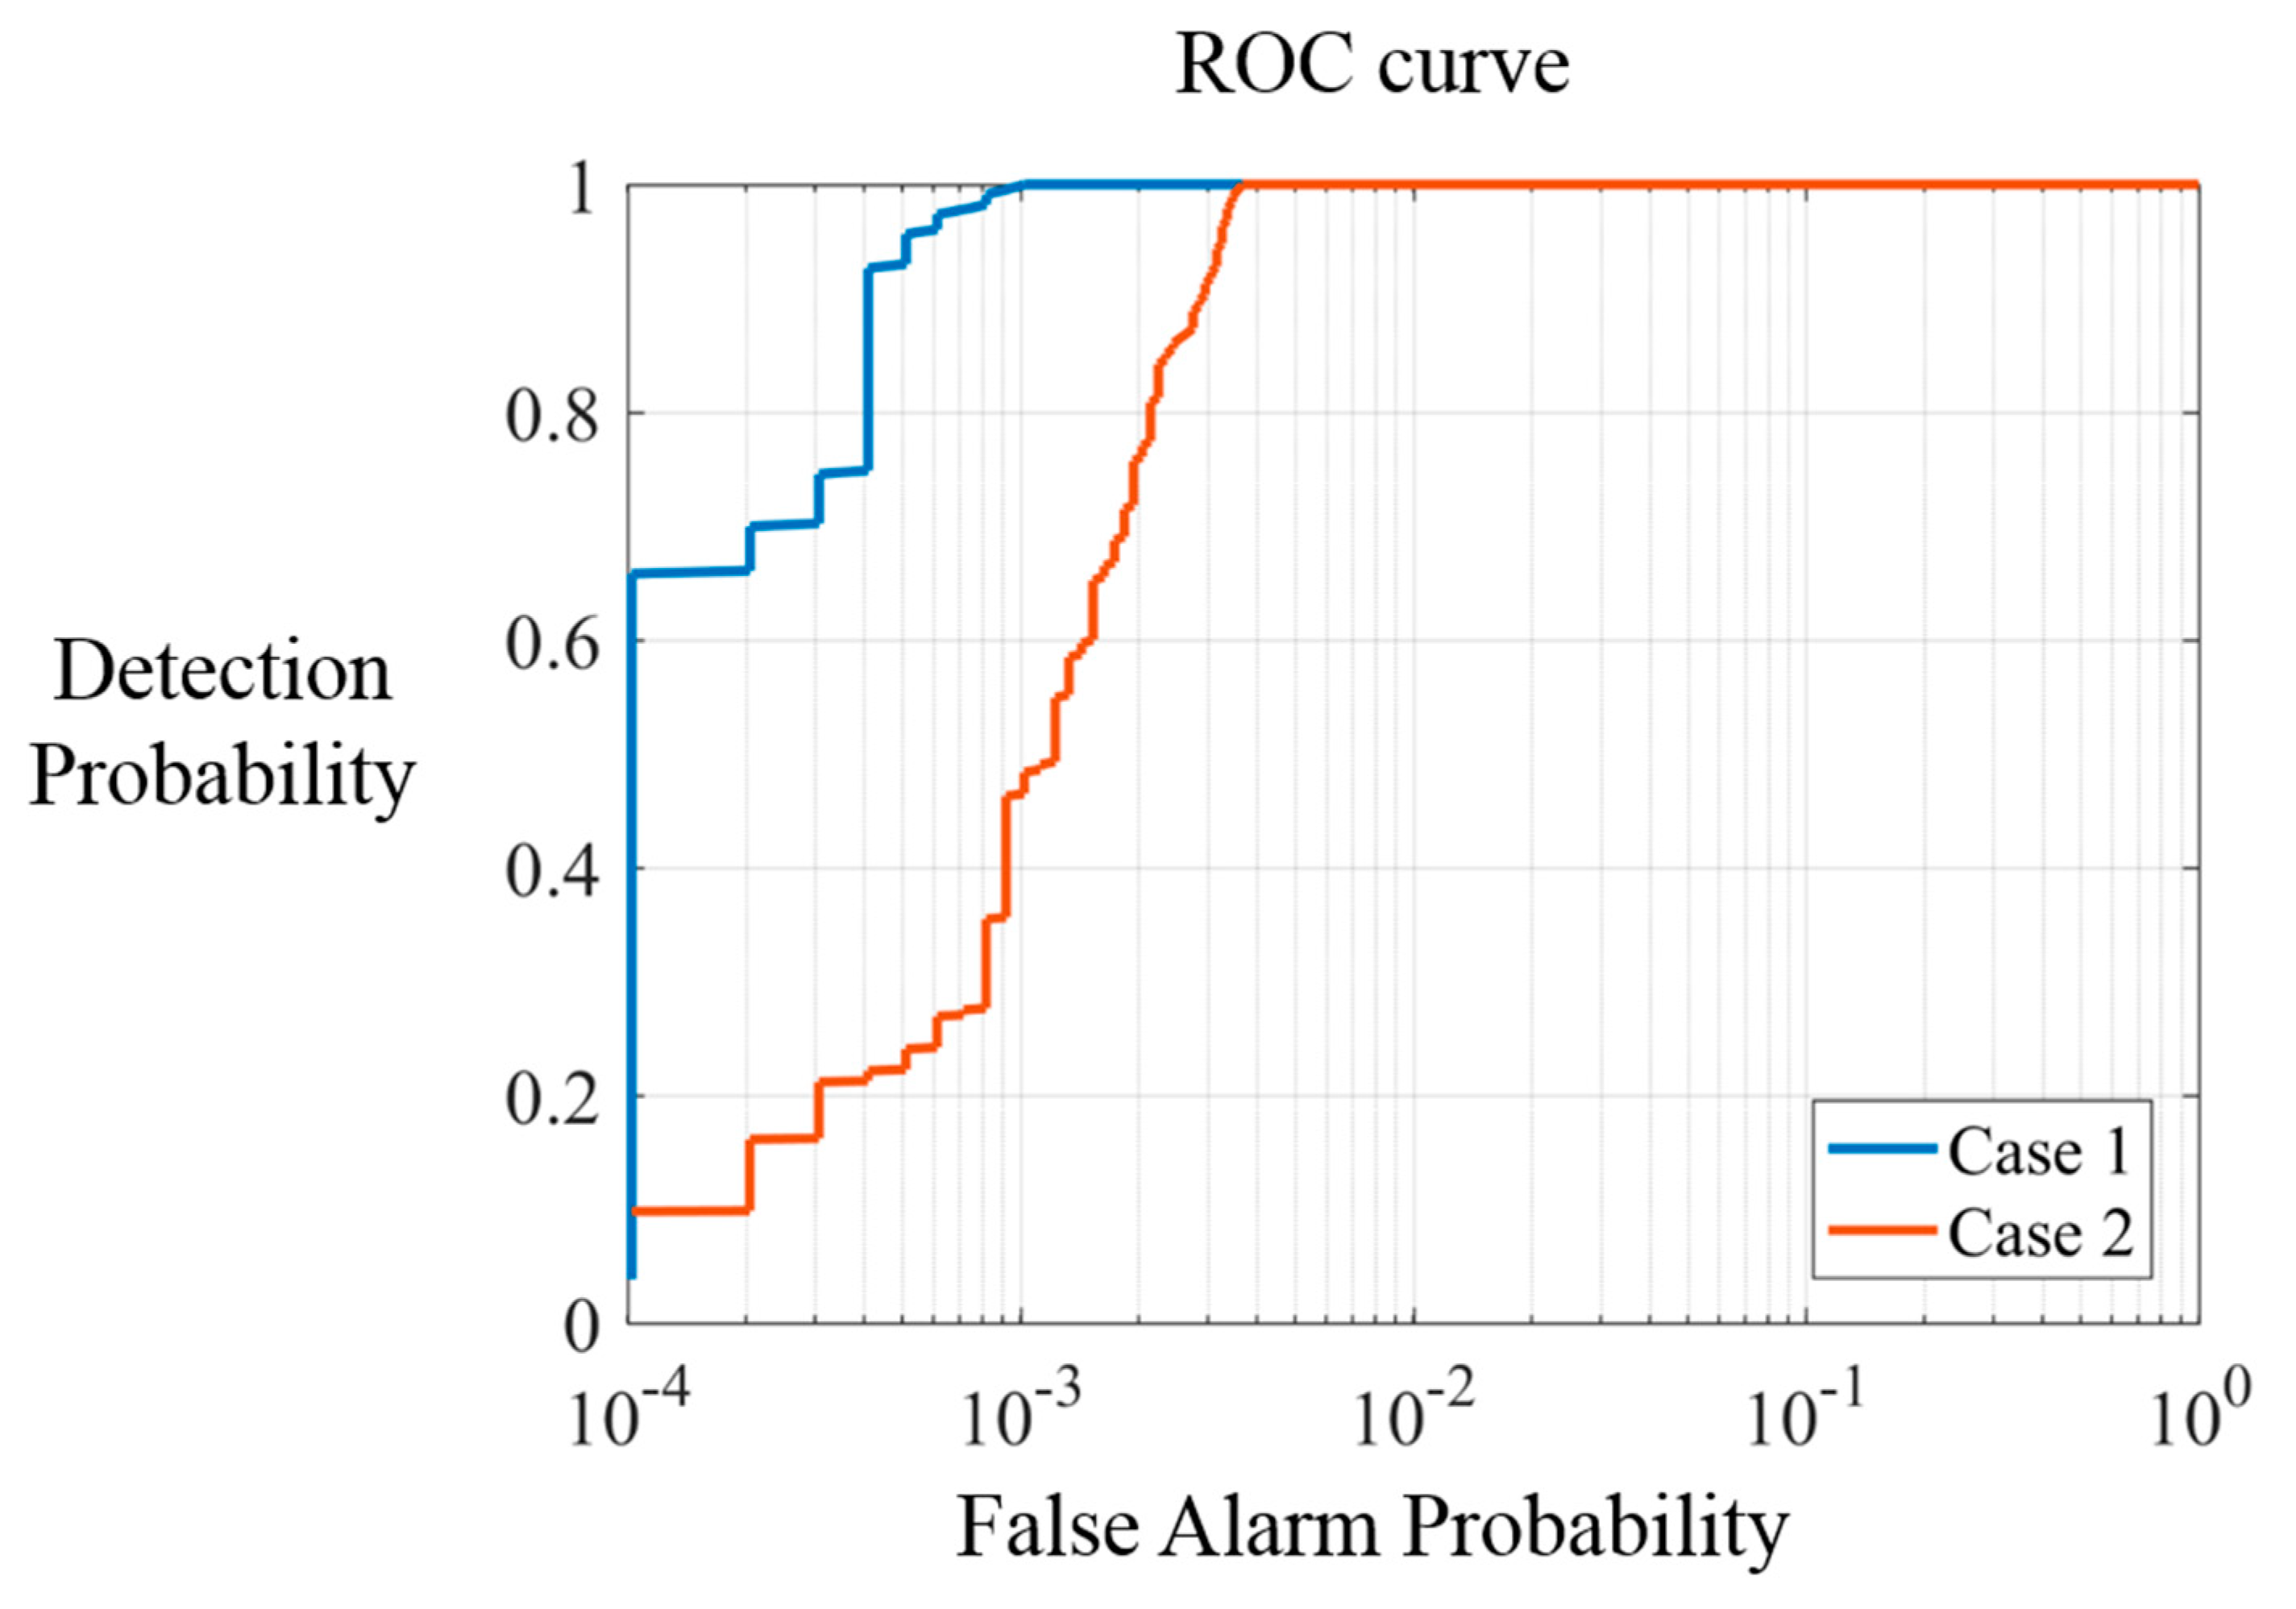
For the 1123 data set, the receiver operating characteristic (ROC) curves of
Table 2 and
Table 4 are displayed in
Figure 10. The results show that case 1 has a much better performance than case 2.
5. Conclusions
In this paper, we investigated whether targets and clutters can be distinguished with a multilayer algorithm in various environments. The proposed algorithm was applied to all data above the noise level without a preset threshold and the performance was analyzed and presented according to weak, strong, and all data. The evaluation results confirmed that a target can be detected and separated from clutters by the proposed algorithm in real underwater environments, even for low SNRs. Thus, the proposed algorithm is very useful and effective for underwater target classification at long ranges. Furthermore, this conclusion is based on experimental data acquired over several years via the application of a real active sonar system. Note that the experimental data may not represent all the characteristics of underwater environments, but we think that the data are sufficient to verify the possibility of applying our proposed algorithm to sonar systems; this is because the data were collected under a wide variety of field conditions, including different seasons, varied target motion, and wide sea areas.
This study shows that the spatial characteristics in multilayered areas can be used as feature vectors that lead to a high classification rate with a low false alarm rate. Ping history results also indicated that the proposed approach is better than the conventional one. The ability to classify targets without the use of thresholds is a huge advantage in anti-submarine operations. Note that the proposed algorithm can be applied to all the signals without a threshold so that it attempts detection for signals that would be ignored by a conventional threshold exclusion process. Thus, the proposed algorithm can greatly improve the performance of classification and tracking, and a sonar operator’s detection capability. In addition, we believe the algorithm is practical because it is the result of using real data from an active sonar operating on a naval ship in real underwater environments. For further study, the cepstrum may be a good candidate for the feature vector component due to its scale invariance property, and the fusion of different approaches may also be a useful approach for active sonar systems.


