Monitor Cotton Budding Using SVM and UAV Images


 ,
,  ,
,
Abstract
Featured Application
Abstract
1. Introduction
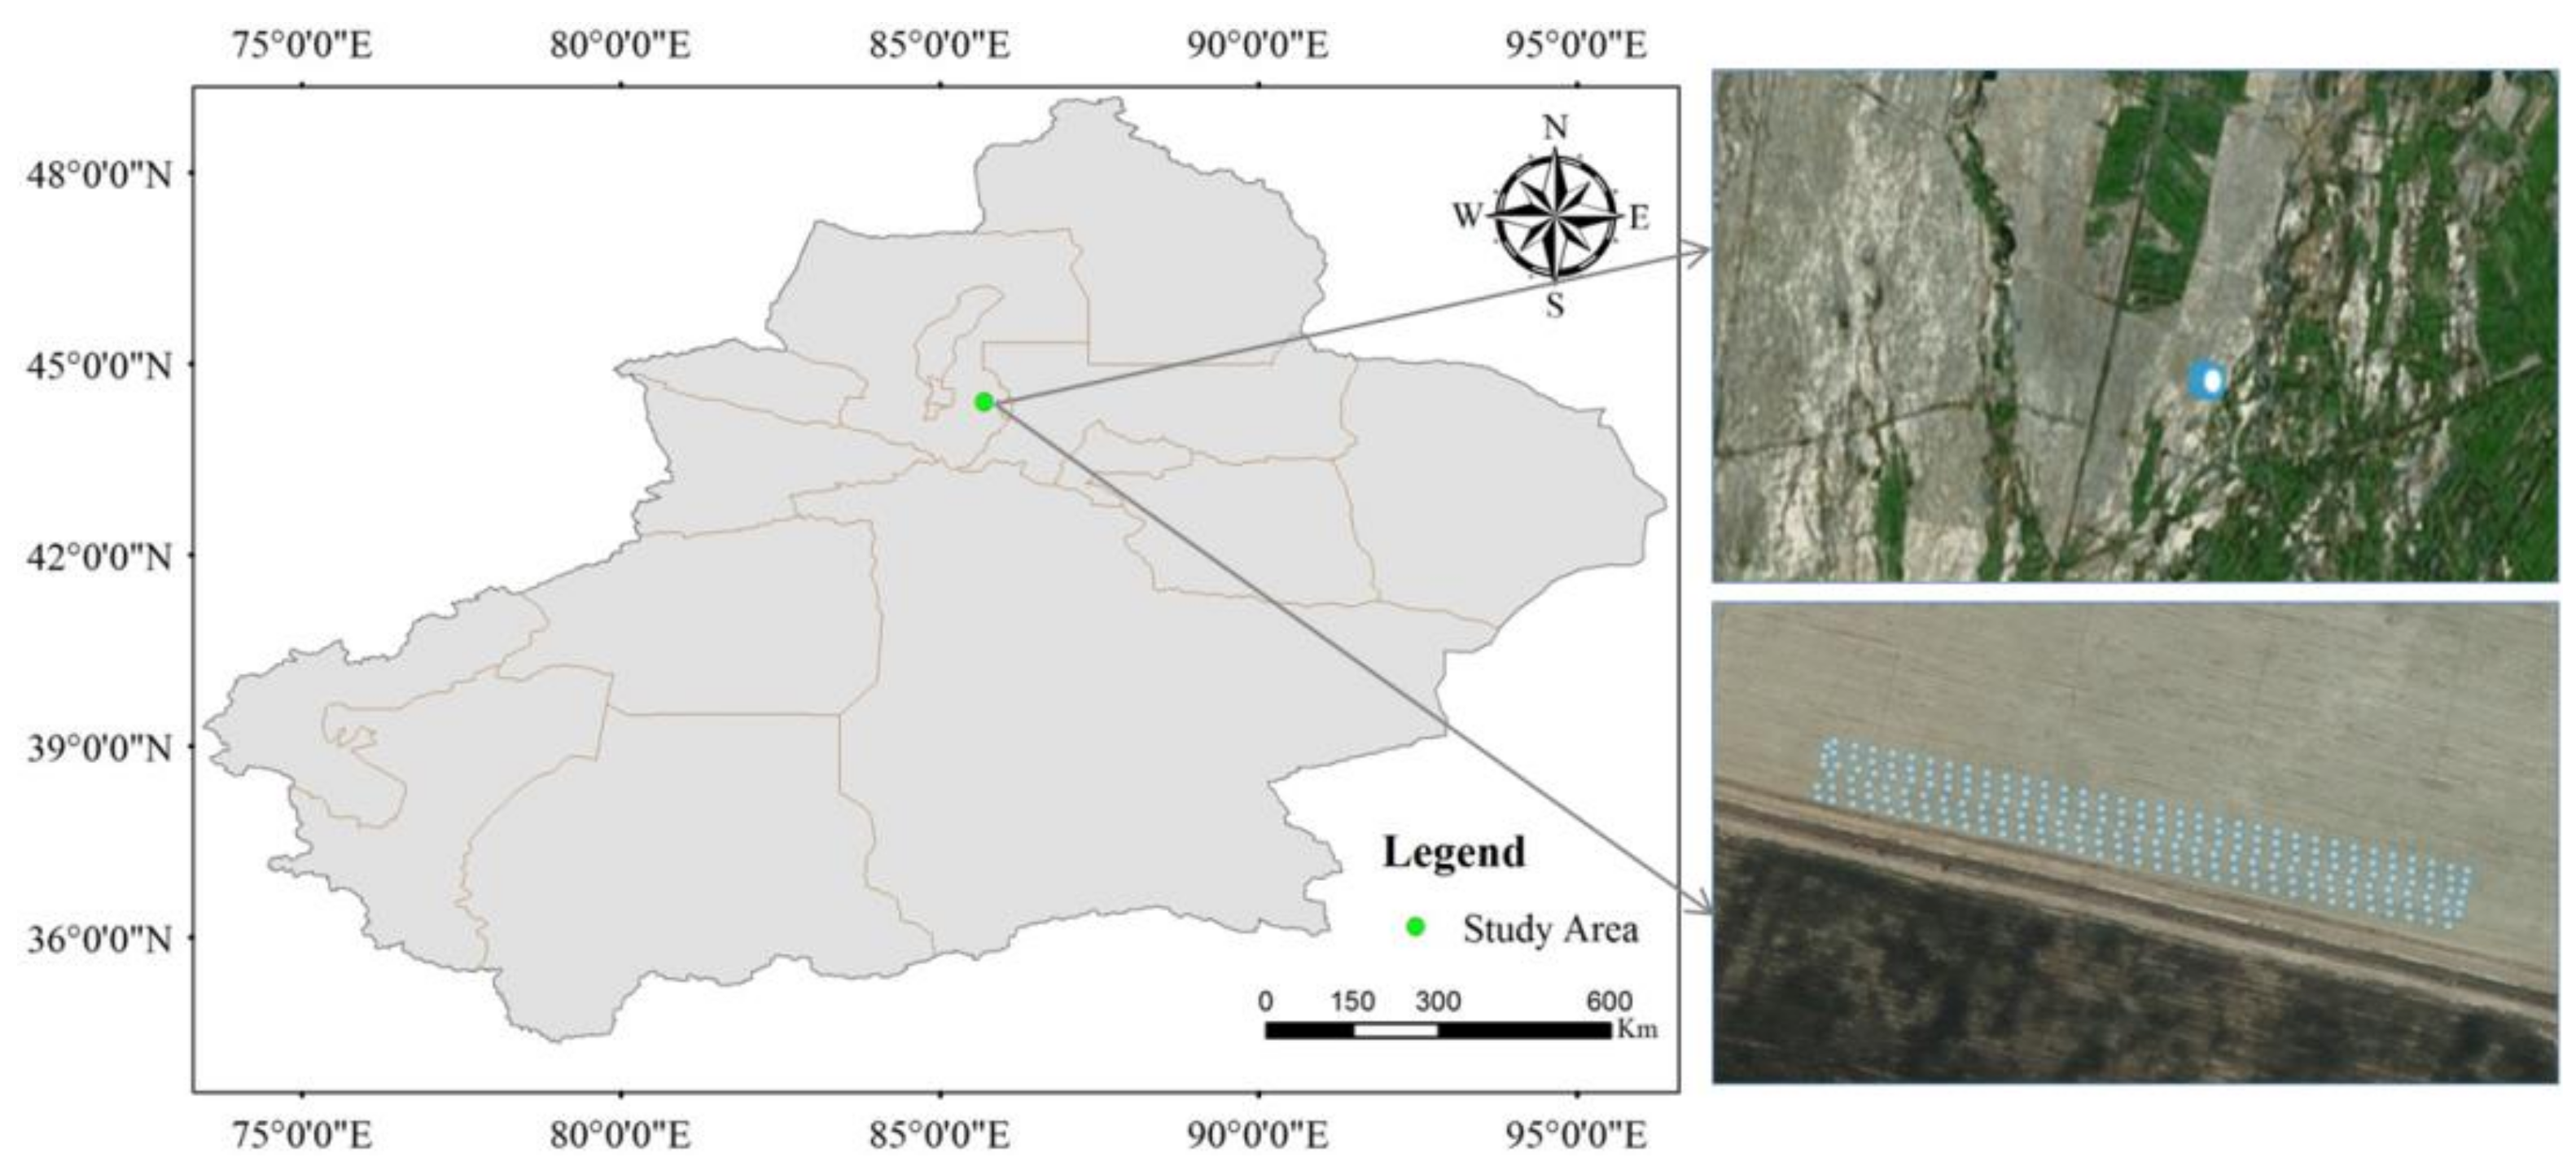
2. Background and Experiment
3. Evaluation of Budding Rate
3.1. Image Stitching
3.2. Image Classification by SVM
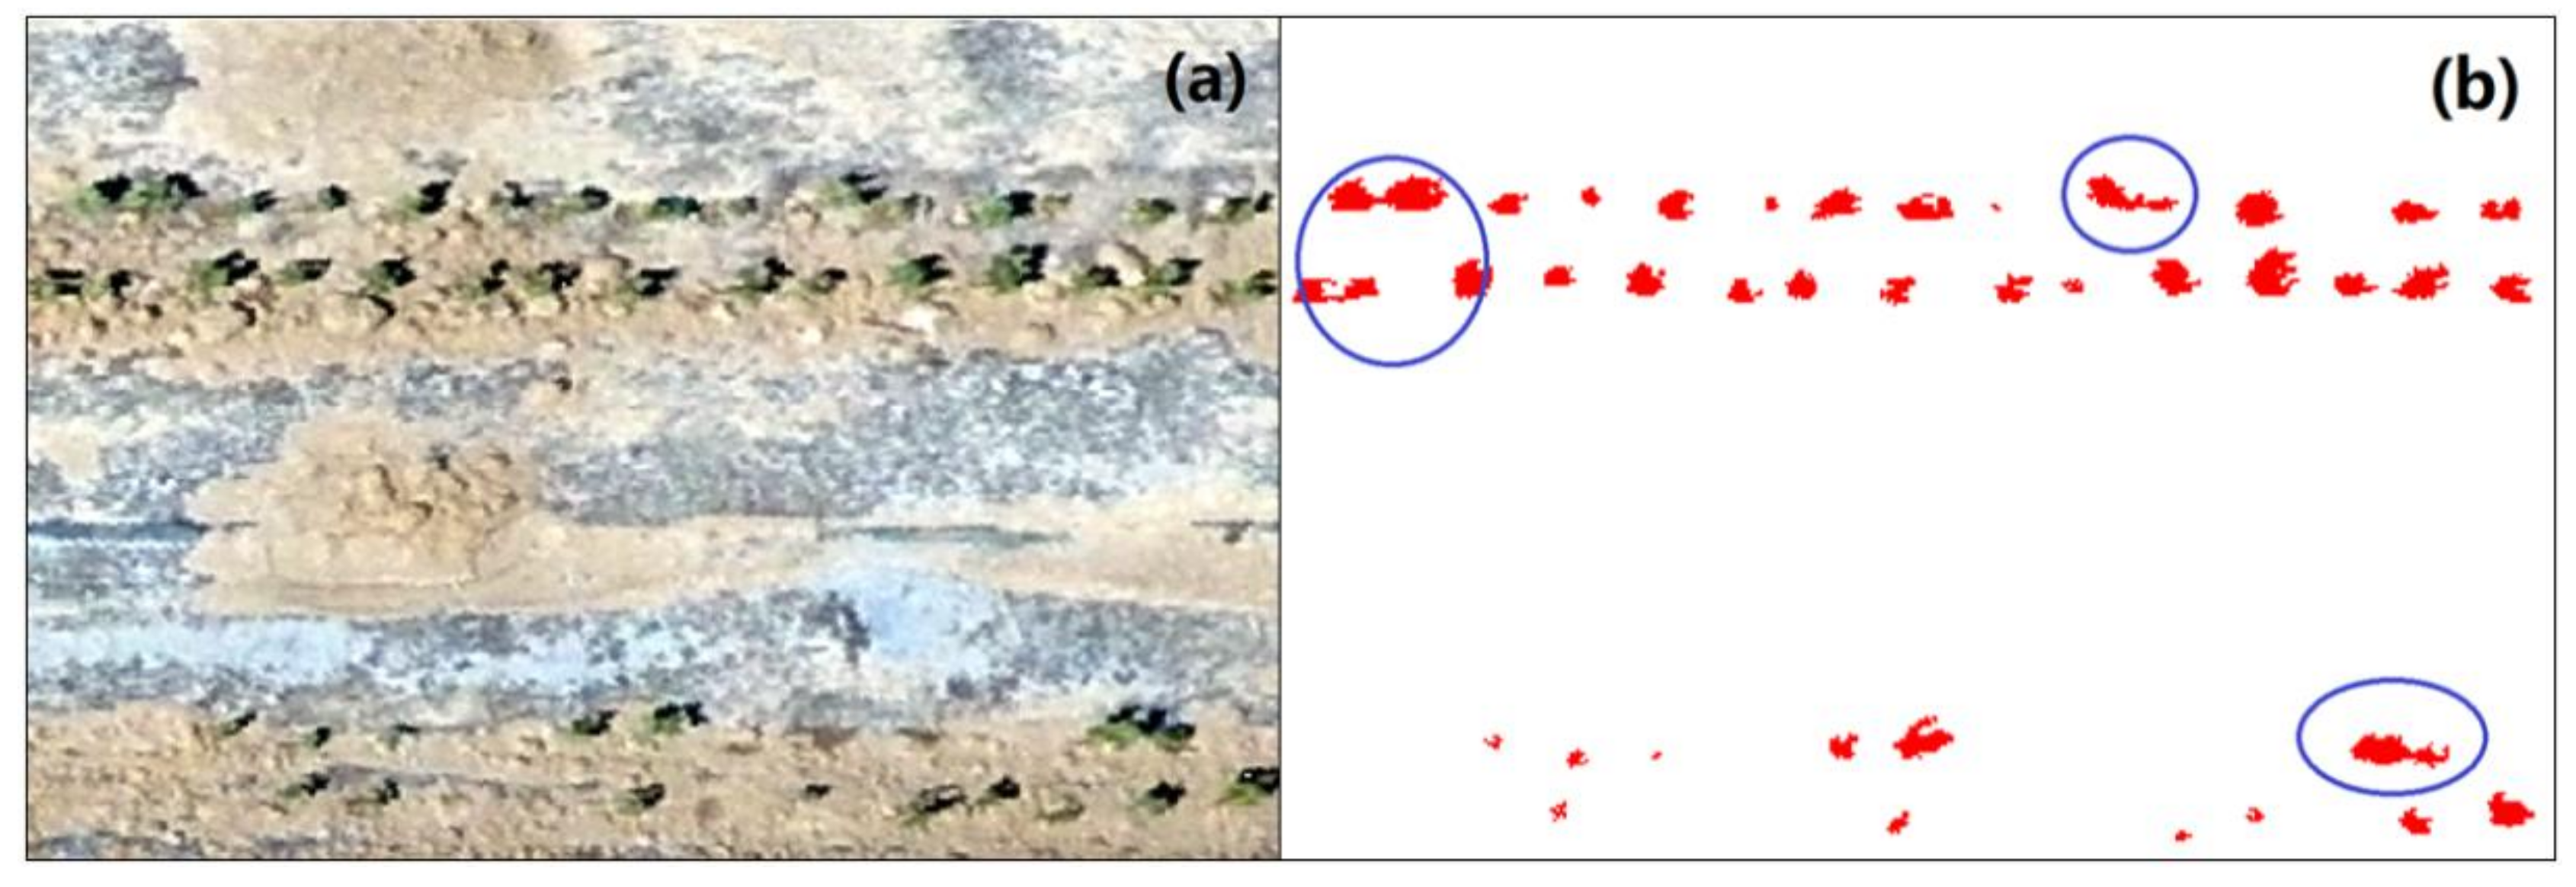
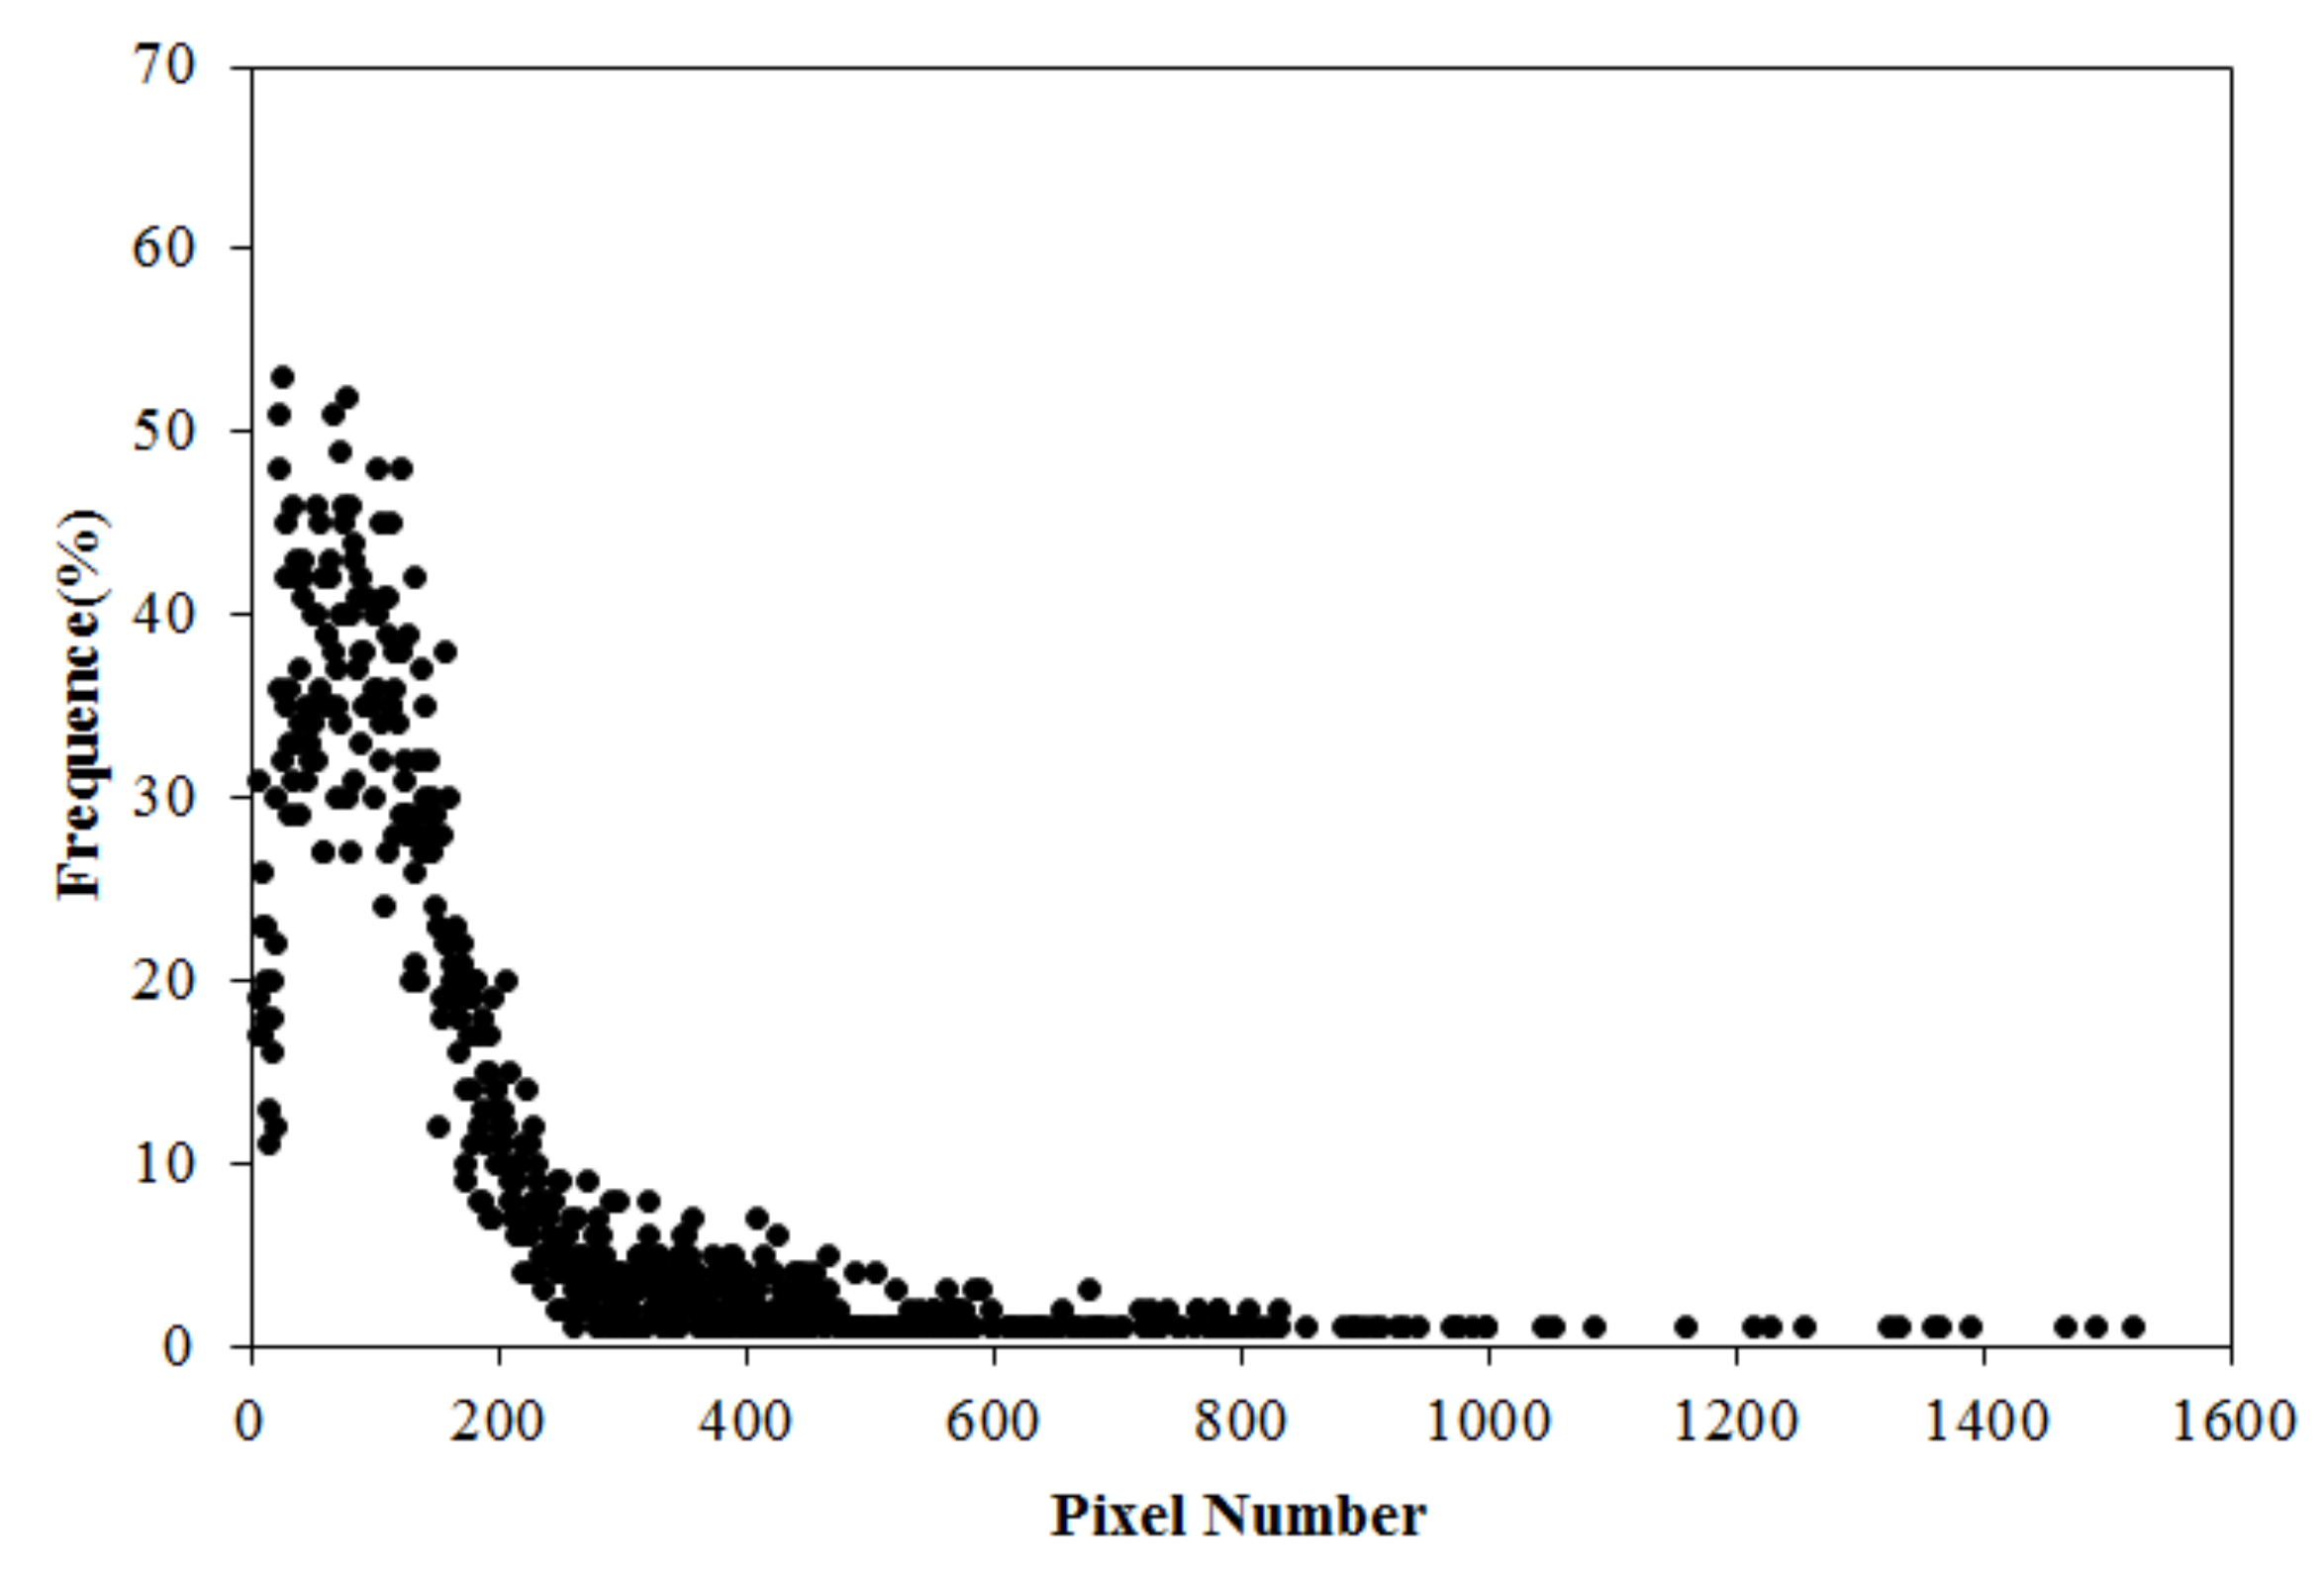
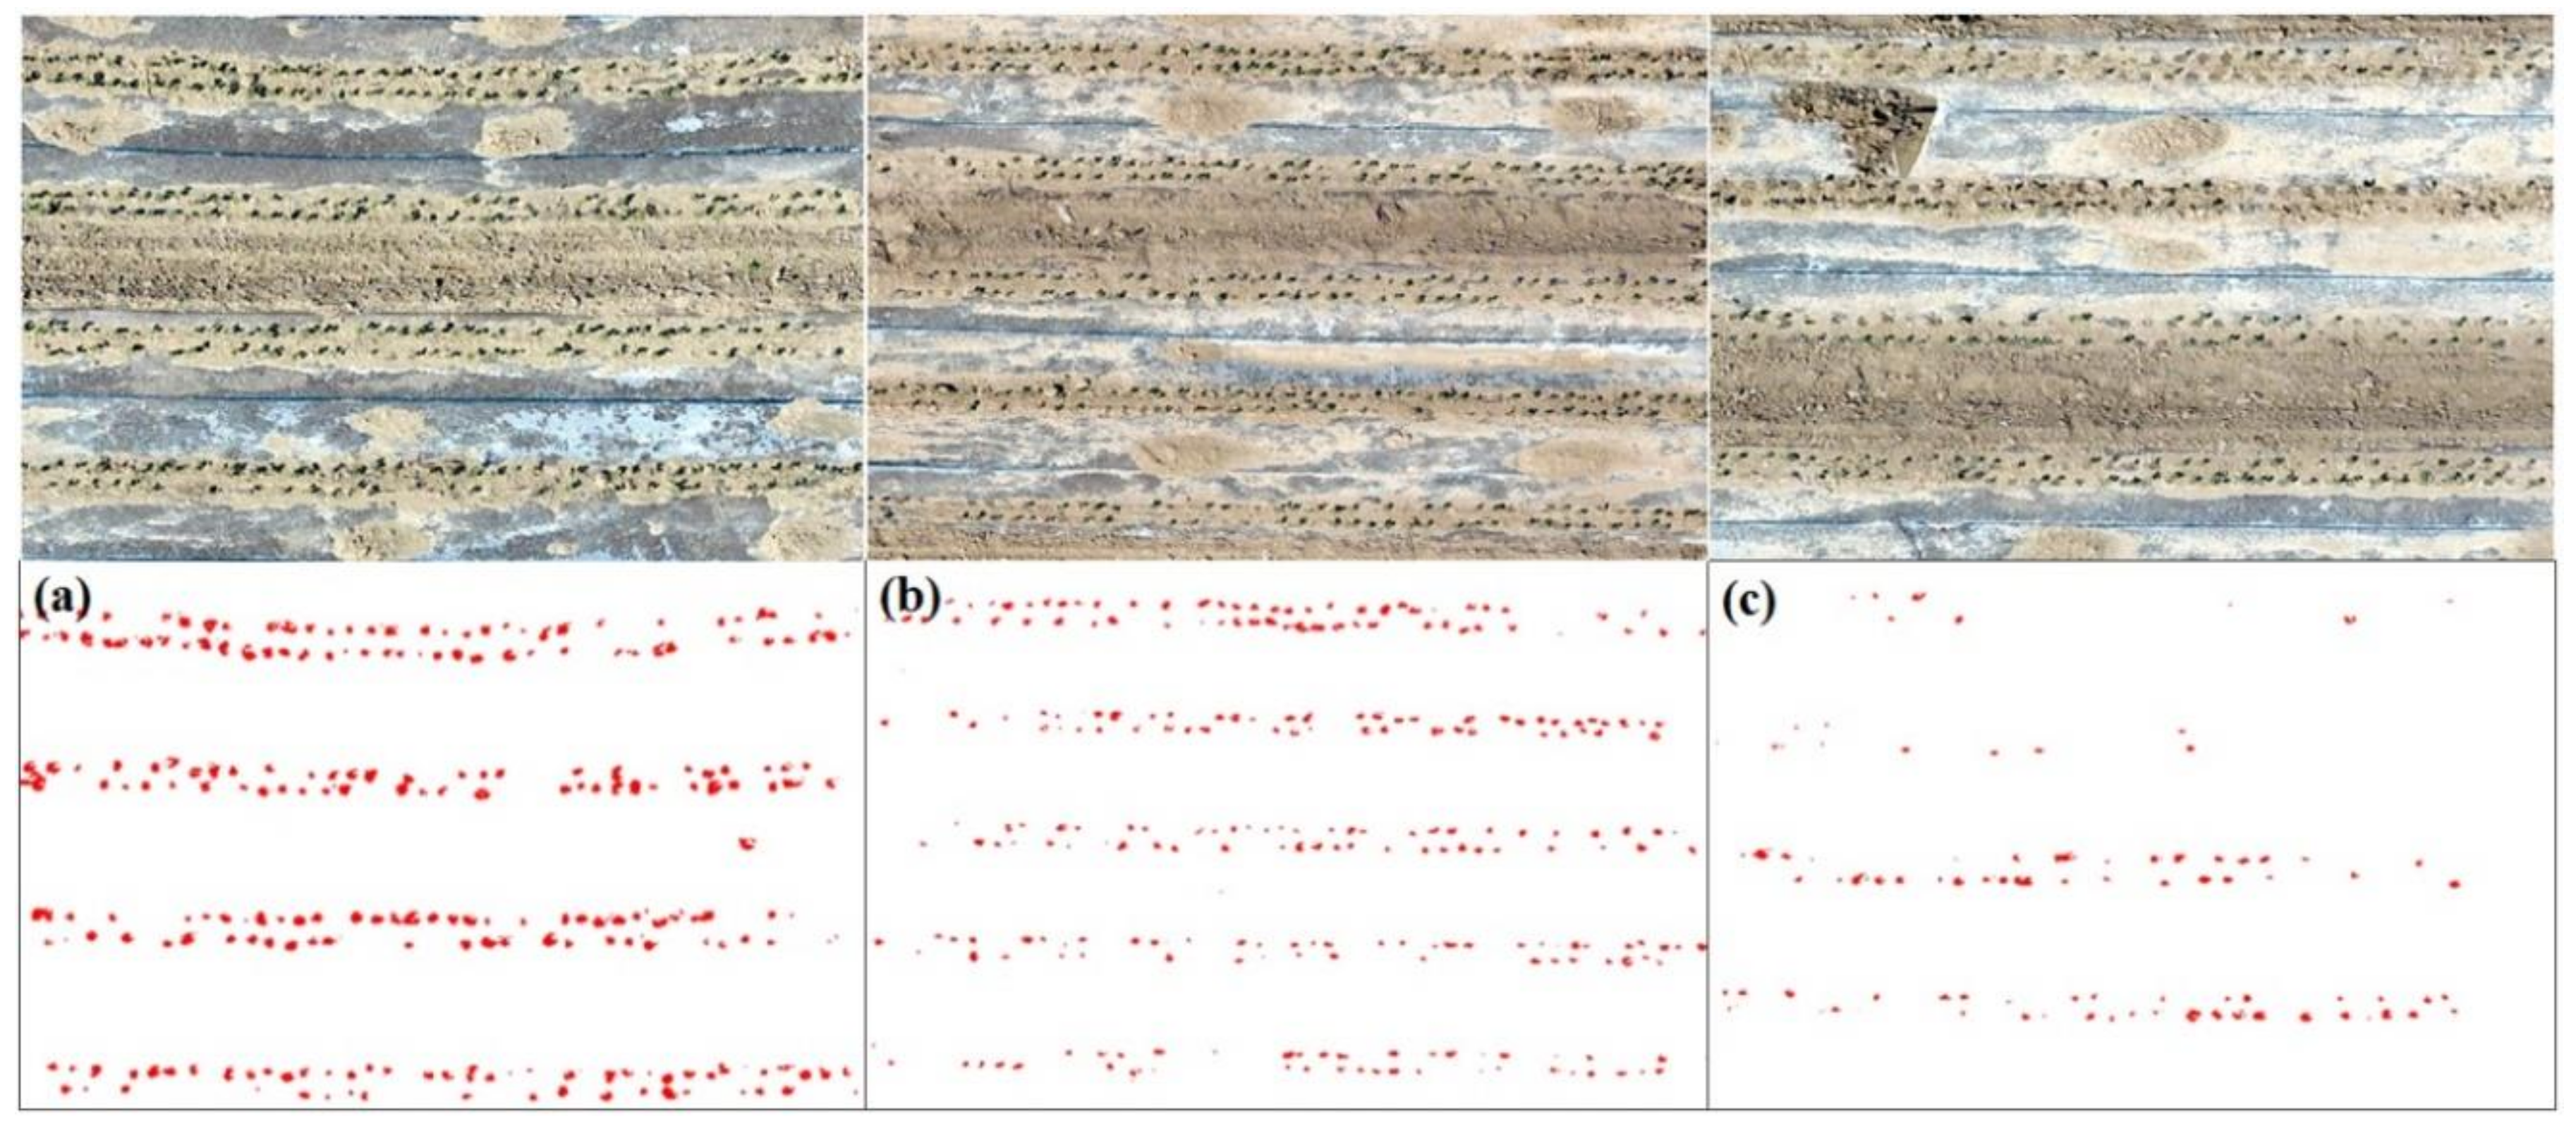
3.3. Identification of Cotton Plants
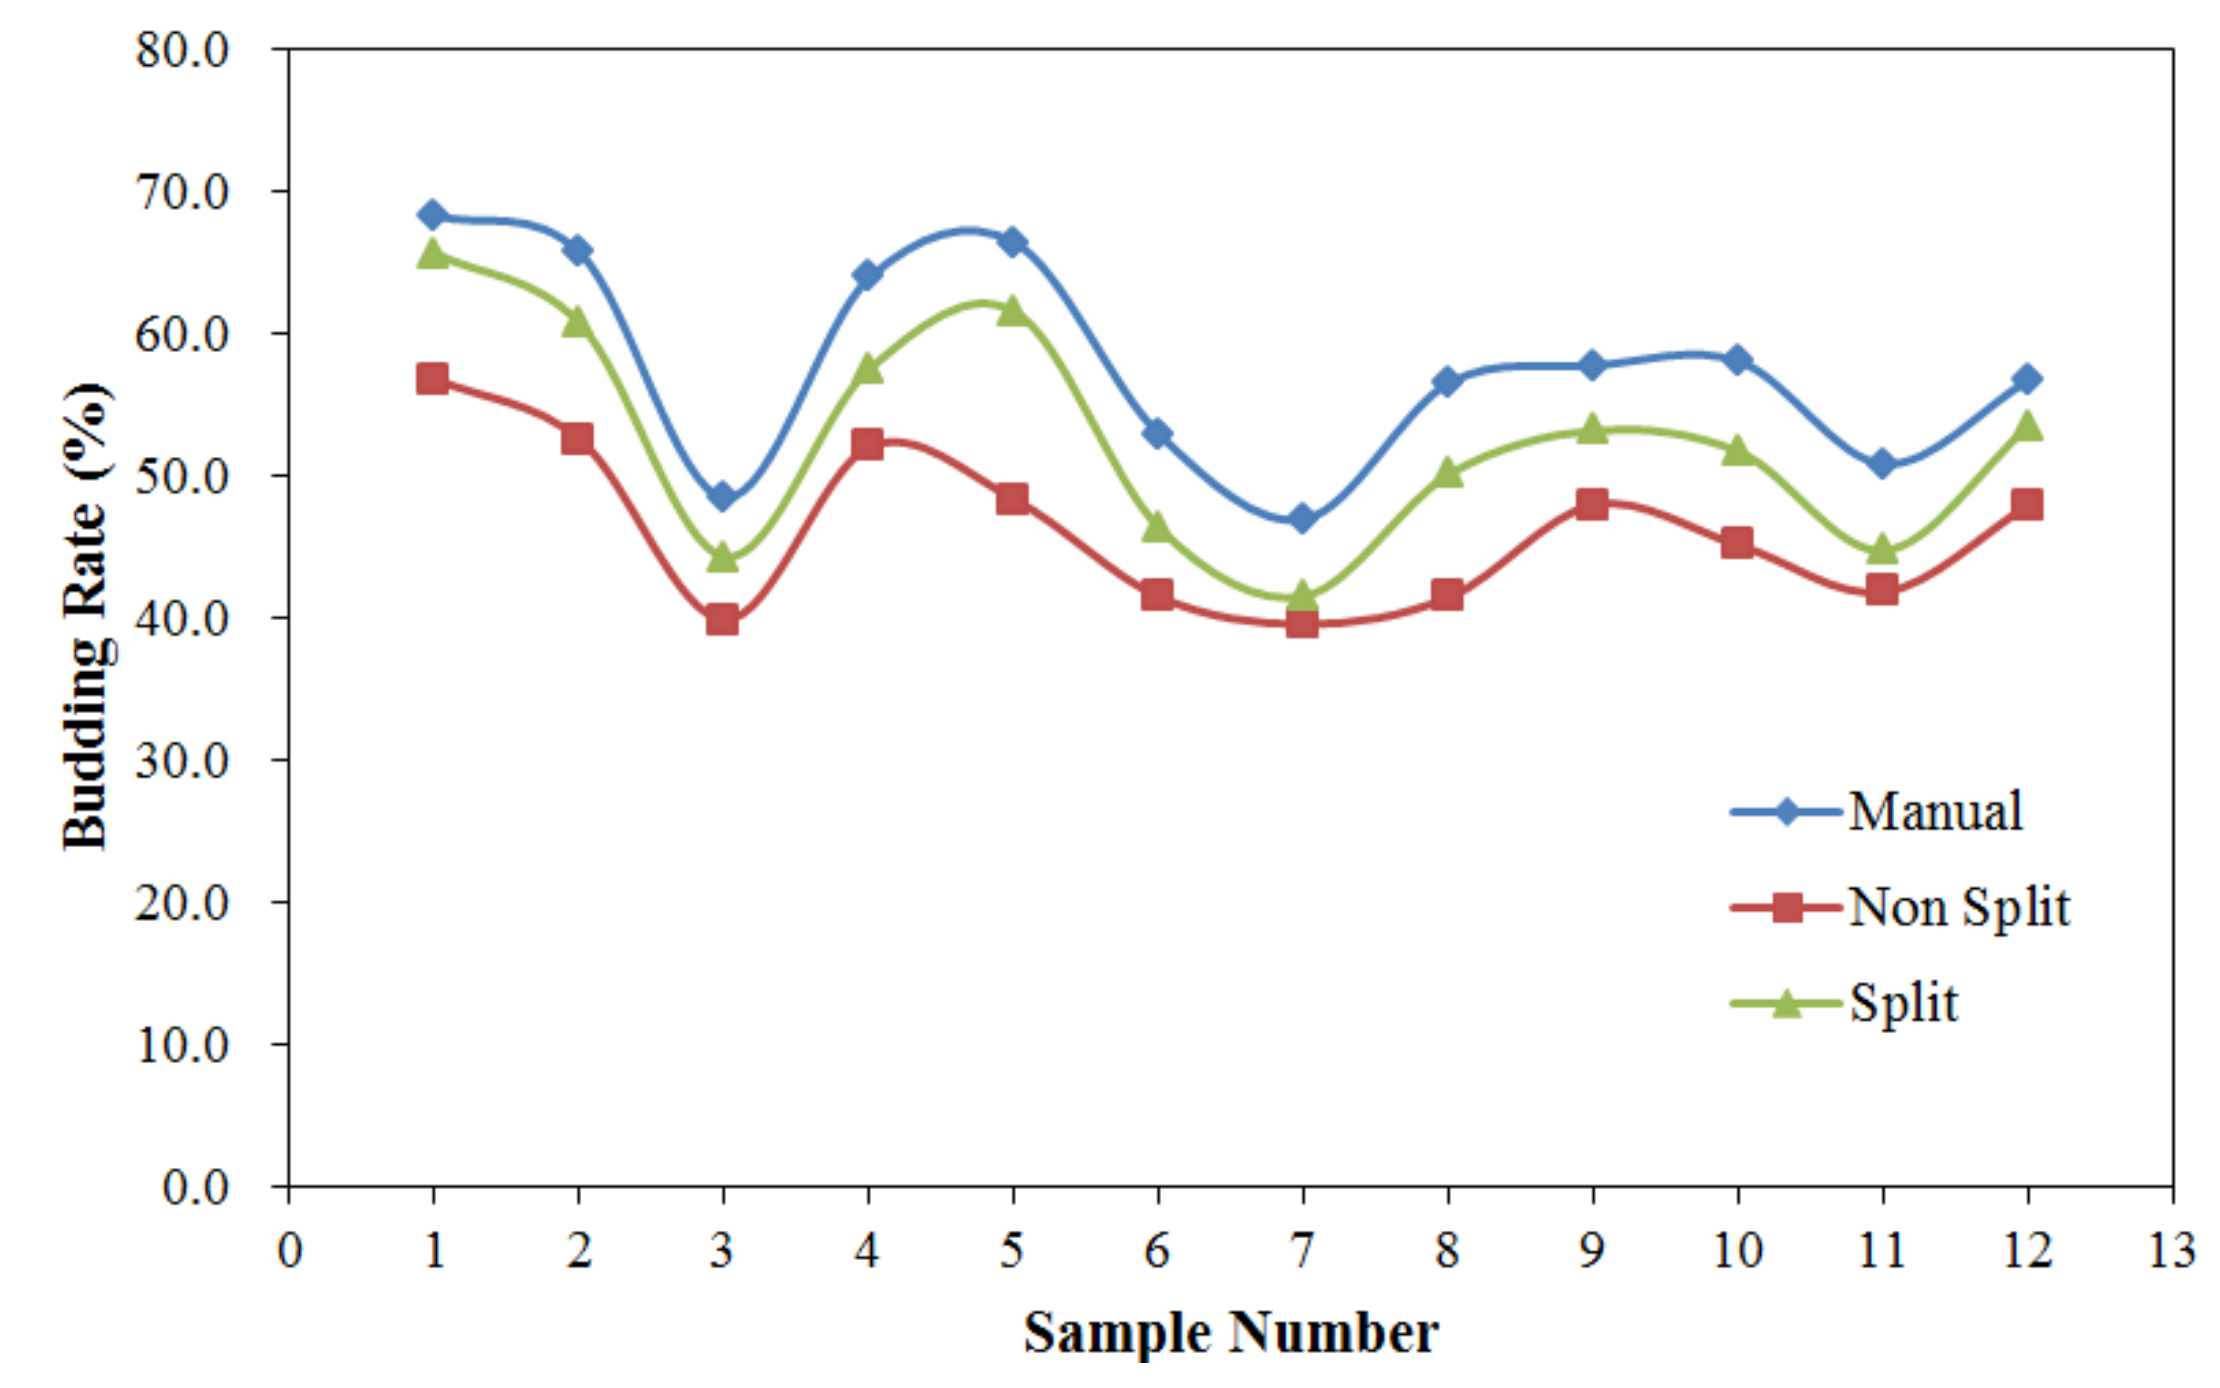
3.4. Calculation Budding Rate
4. Results
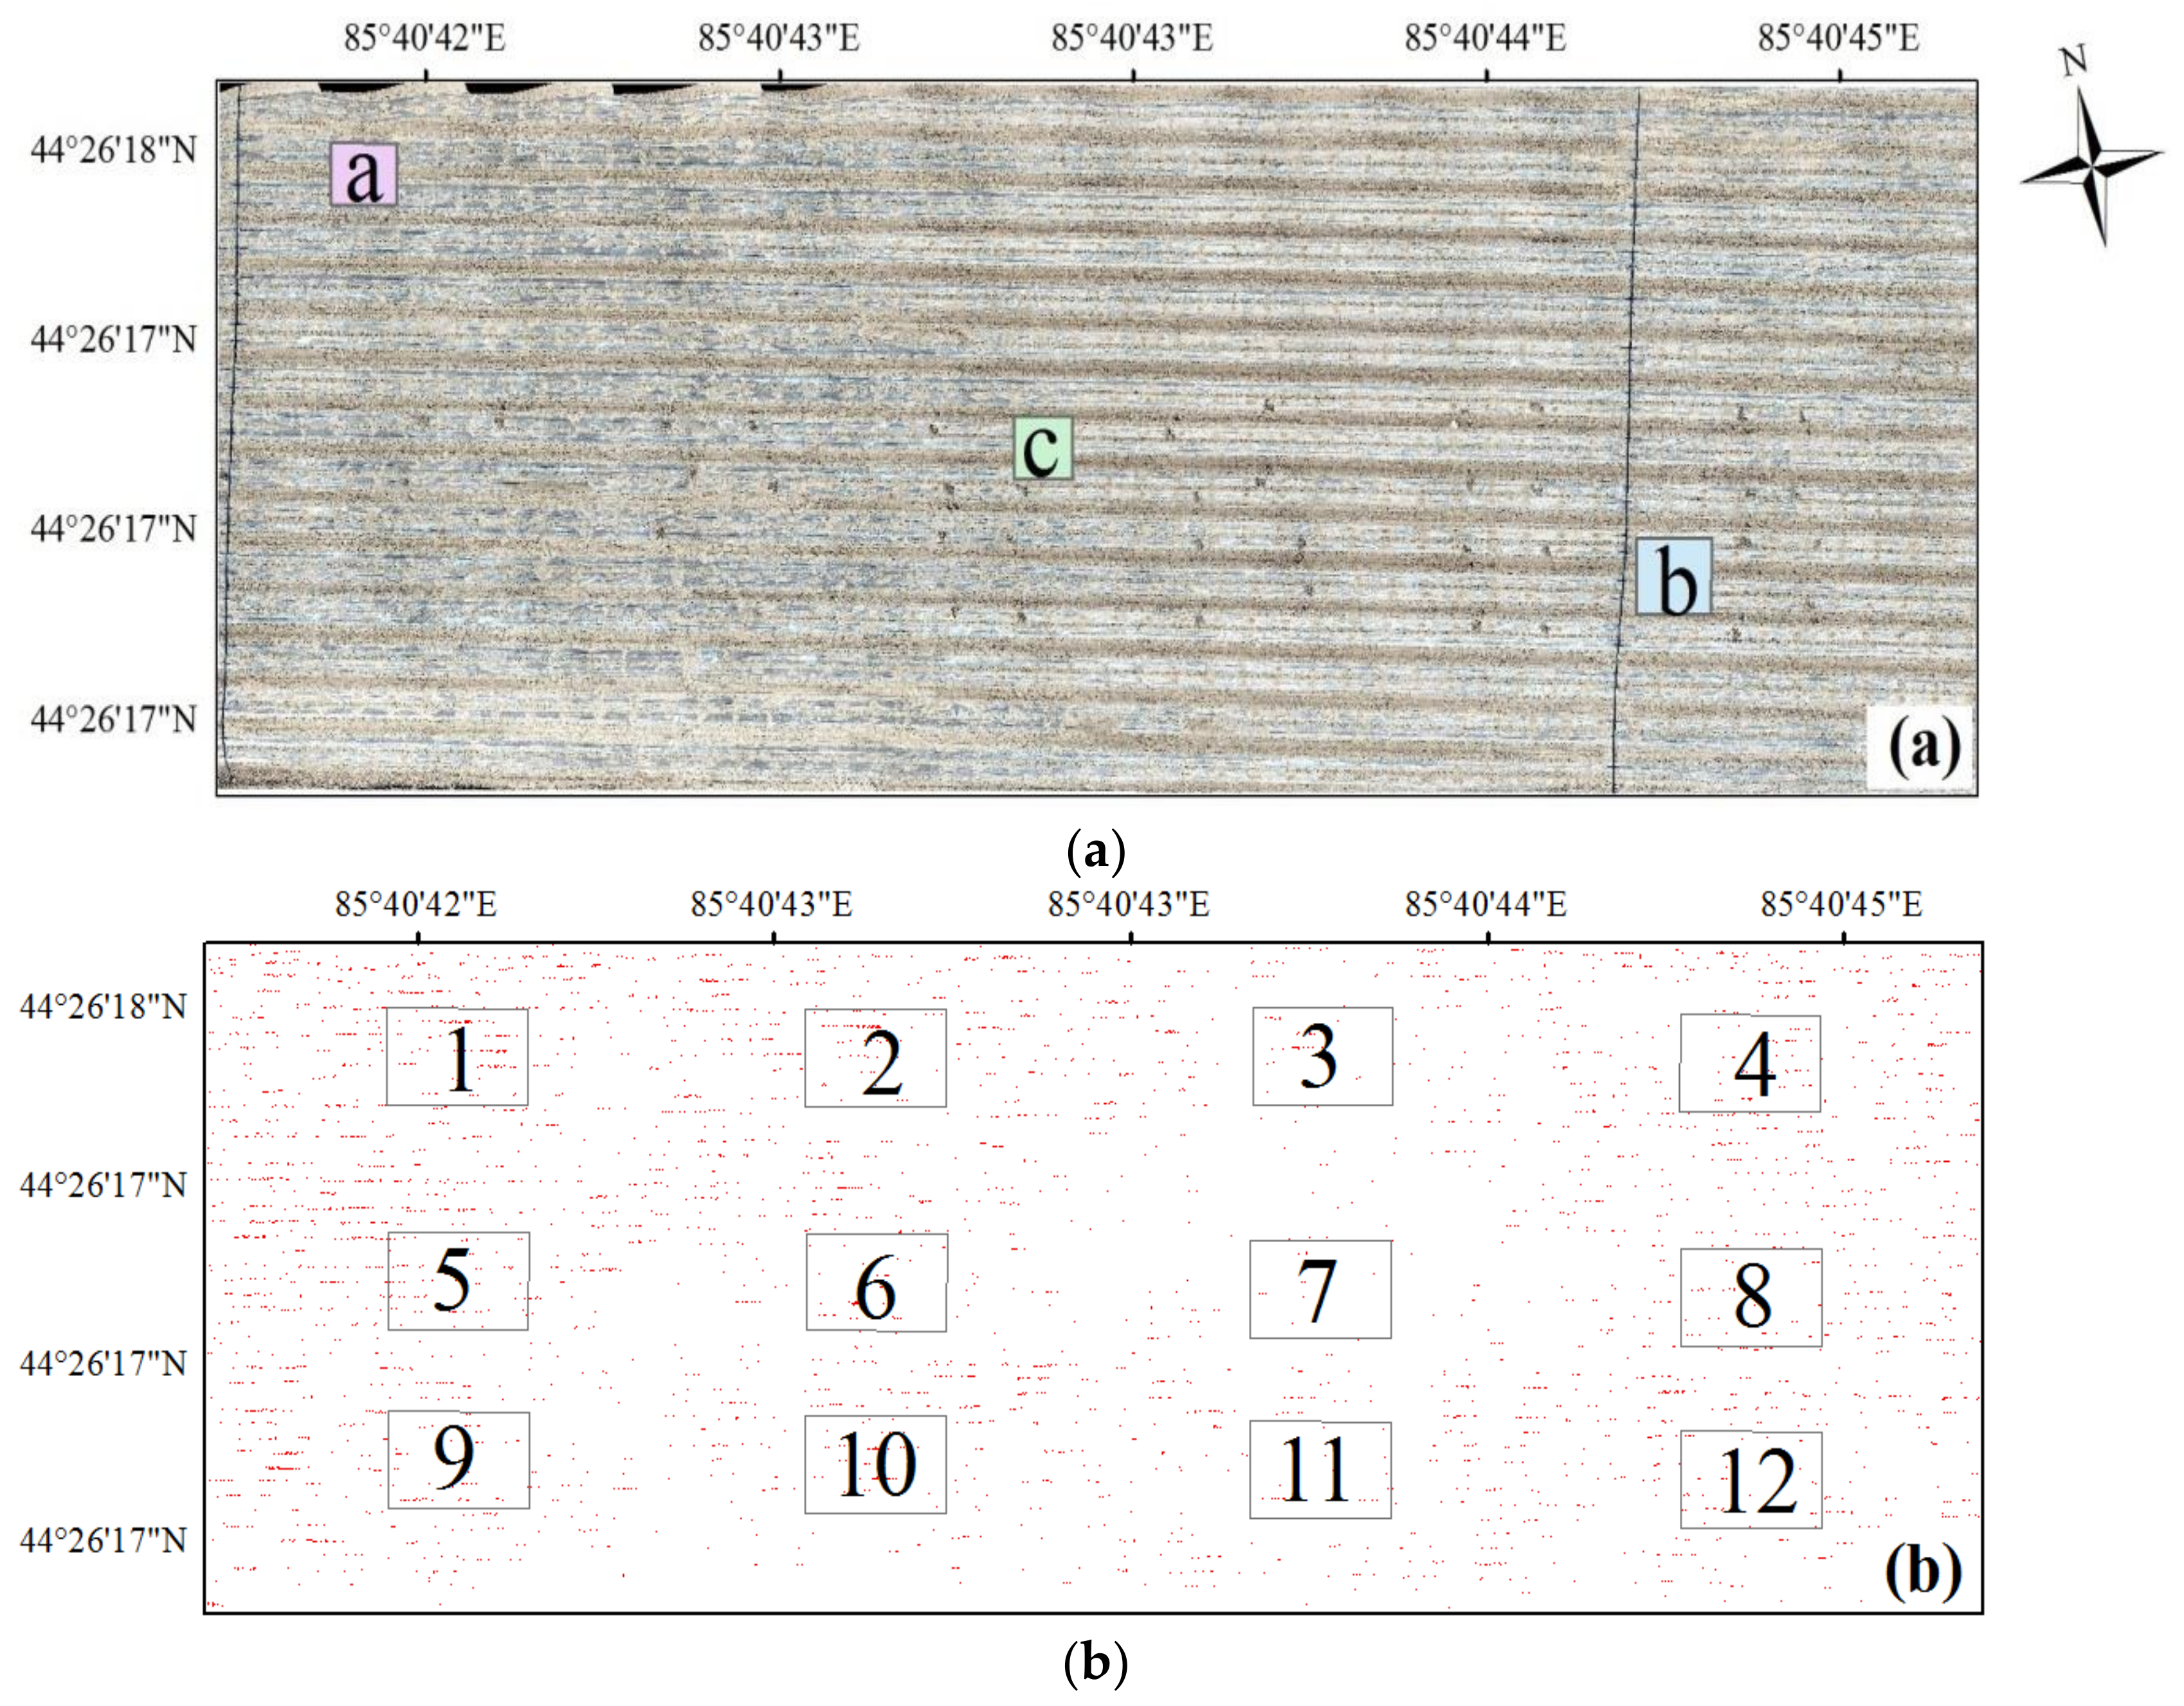
4.1. Results
4.2. Accuracy Evaluation
5. Discussion
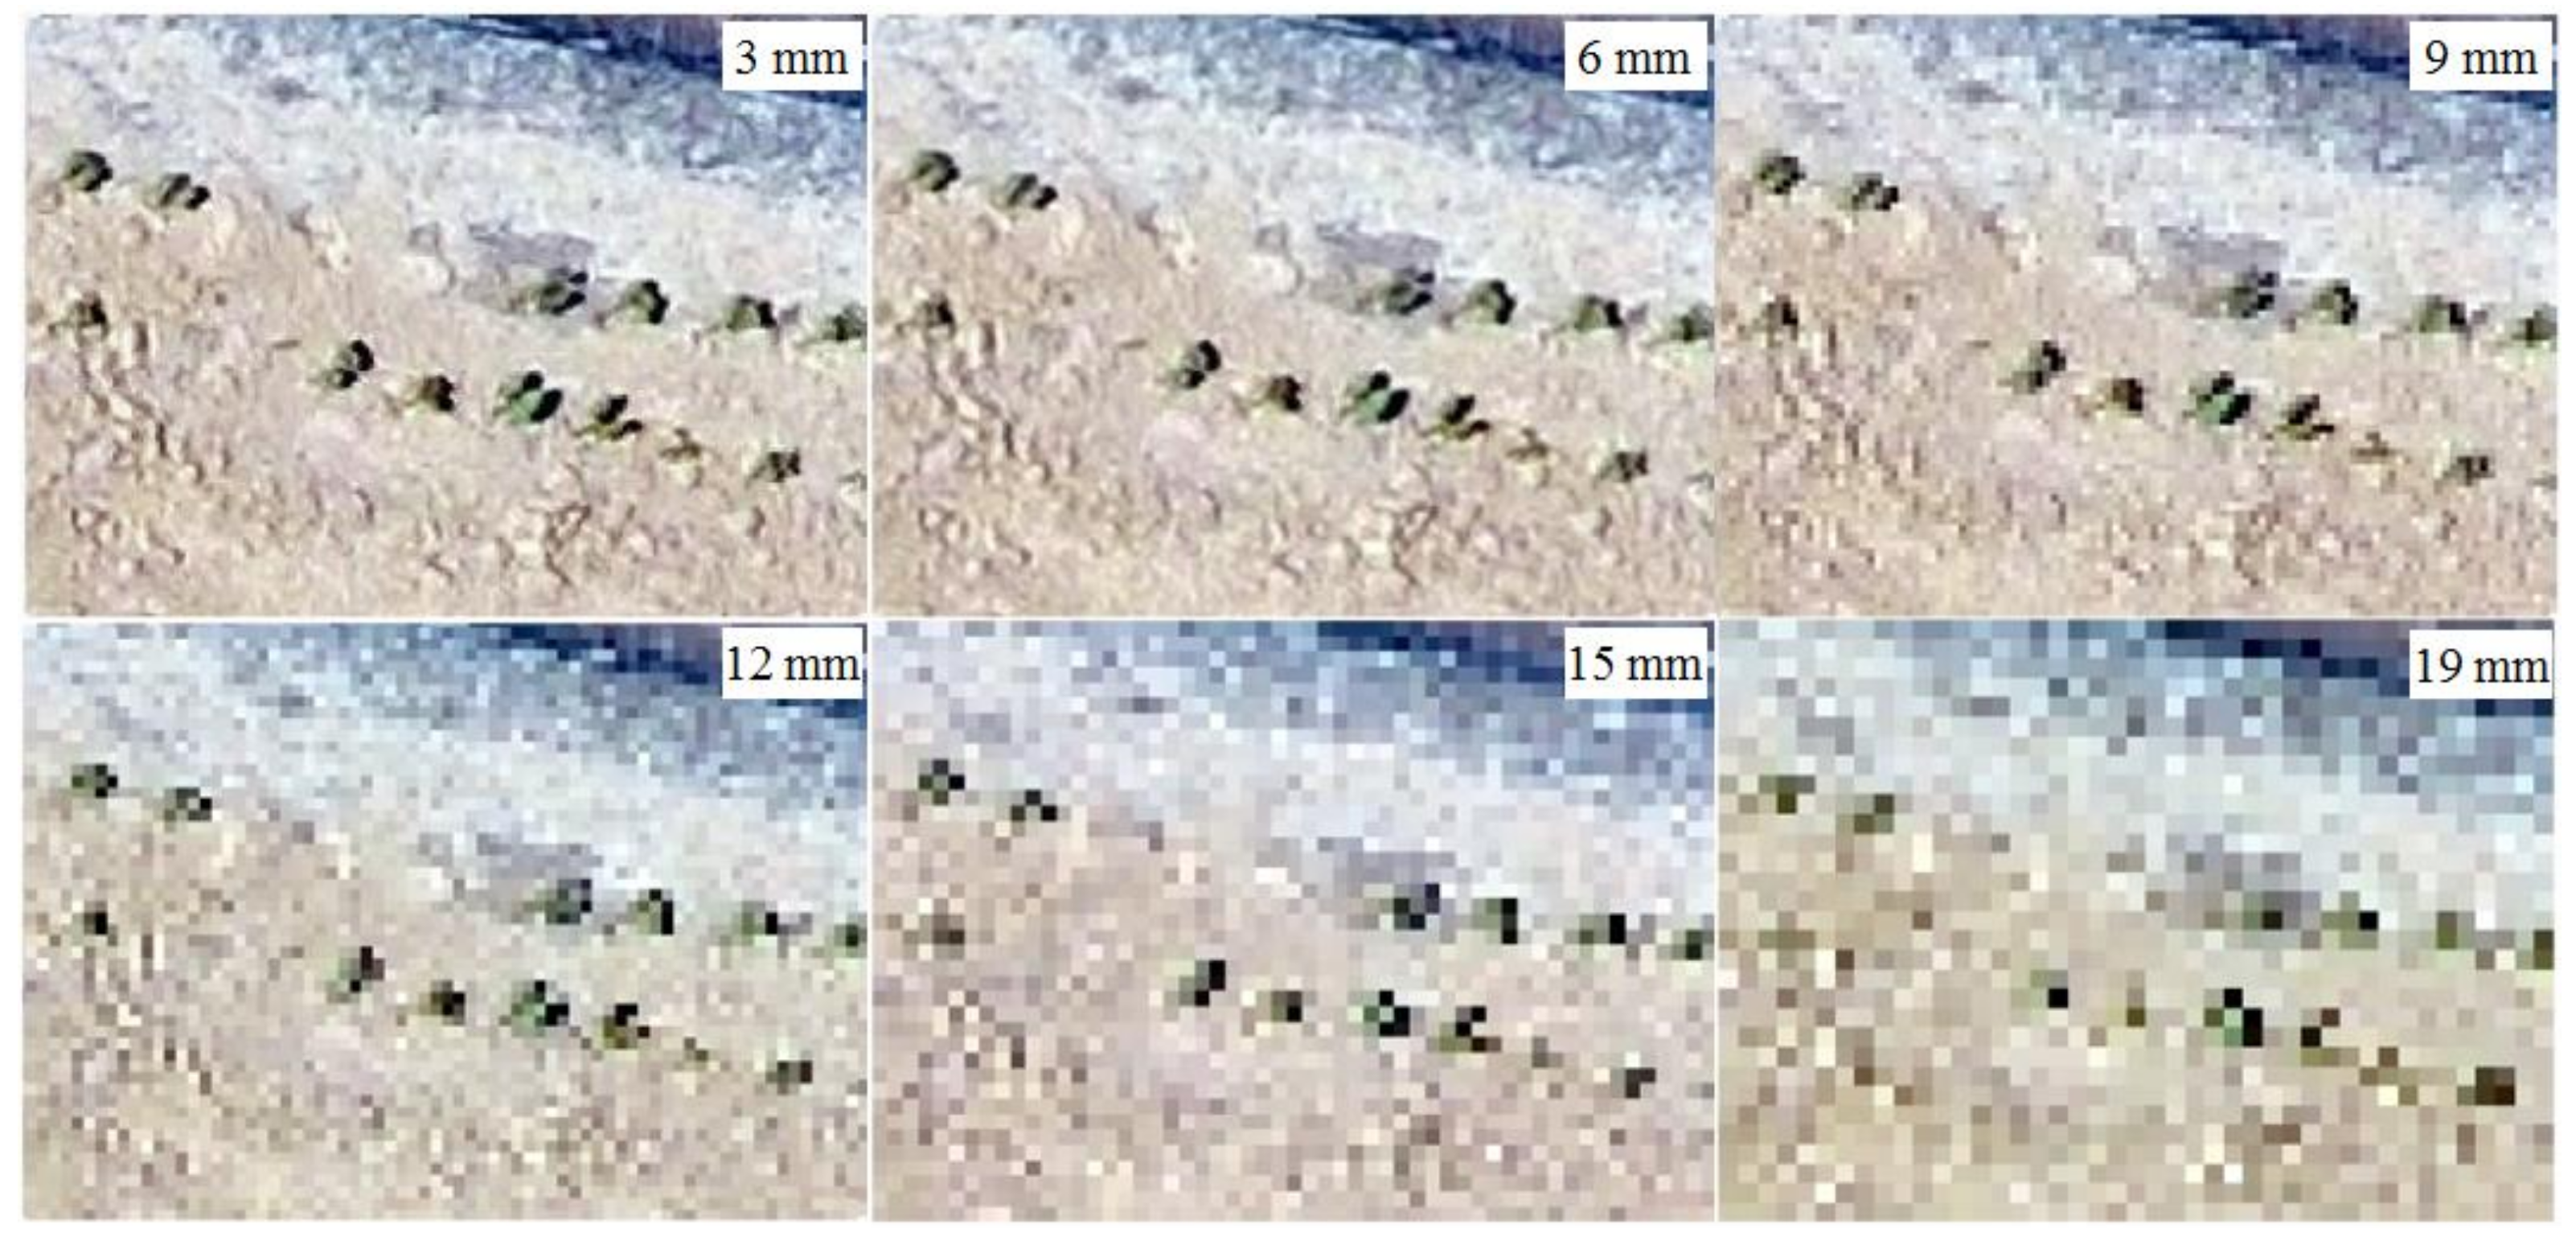
5.1. Influence of Resolution
5.2. Influences of Emergence Date and Weeds
5.3. Possible Improvements and Comparison with Other Studies
6. Conclusions
Author Contributions
Acknowledgments
Conflicts of Interest
References
- Clevers, J.G.P.W.; van Leeuwen, H.J.C. Combined use of optical and microwave remote sensing data for crop growth monitoring. Remote Sens. Environ. 1996, 56, 42–51. [Google Scholar] [CrossRef]
- Zhao, F.; Xu, B.; Yang, X.; Jin, Y.; Li, J.; Xia, L.; Ma, H. Remote sensing estimates of grassland aboveground biomass based on MODIS net primary productivity (NPP): A case study in the Xilingol grassland of Northern China. Remote Sens. 2014, 6, 5368–5386. [Google Scholar] [CrossRef]
- Xia, L.; Zhao, F.; Mao, K.; Yuan, Z.; Zuo, Z.; Xu, T. SPI-based analyses of drought changes over the past 60 years in China’s major crop-growing areas. Remote Sens. 2018, 10, 171. [Google Scholar] [CrossRef]
- Bobbink, R.; Hornung, M.; Roelofs, J.G. The effects of air-borne nitrogen pollutants on species diversity in natural and semi-natural European vegetation. J. Ecol. 1998, 86, 717–738. [Google Scholar] [CrossRef]
- Kwak, G.-H.; Park, N.-W. Impact of texture information on crop classification with machine learning and UAV images. Appl. Sci. 2019, 9, 643. [Google Scholar] [CrossRef]
- Zhou, C.; Ye, H.; Xu, Z.; Hu, J.; Shi, X.; Hua, S.; Yue, J.; Yang, G. Estimating maize-leaf coverage in field conditions by applying a machine learning algorithm to UAV remote sensing images. Appl. Sci. 2019, 9, 2389. [Google Scholar] [CrossRef]
- Carvajal-Ramírez, F.; Agüera-Vega, F.; Martínez-Carricondo, P.J. Effects of image orientation and ground control points distribution on unmanned aerial vehicle photogrammetry projects on a road cut slope. J. Appl. Remote Sens. 2016, 10, 34004. [Google Scholar] [CrossRef]
- Zein, T. Fit-for-purpose land administration: An implementation model for cadastre and land administration systems. In Proceedings of the Land and Poverty Conference 2016: Scaling up Responsible Land Governance, Washington, DC, USA, 14–18 March 2016. [Google Scholar]
- Stöcker, C.; Bennett, R.; Nex, F.; Gerke, M.; Zevenbergen, J. Review of the current state of UAV regulations. Remote Sens. 2017, 9, 459. [Google Scholar] [CrossRef]
- Xia, L.; Zhang, R.R.; Chen, L.P.; Zhao, F.; Jiang, H.J. Stitching of hyper-spectral UAV images based on feature bands selection. IFAC-PapersOnLine 2016, 49, 1–4. [Google Scholar] [CrossRef]
- Pilli, S.K.; Nallathambi, B.; George, S.J.; Diwanji, V. eAGROBOT-A robot for early crop disease detection using image processing. In Proceedings of the IEEE Sponsored 2nd International Conference on Electronics and Communication System (ICECS 2015), Coimbatore, India, 26–27 February 2015. [Google Scholar]
- Reiser, D.; Sehsah, E.-S.; Bumann, O.; Morhard, J.; Griepentrog, H.W. Development of an autonomous electric robot implement for intra-row weeding in vineyards. Agriculture 2019, 9, 18. [Google Scholar] [CrossRef]
- Chen, R.; Chu, T.; Landivar, J.A.; Yang, C.H.; Maeda, M.M. Monitoring cotton (Gossypium hirsutum L.) germination using ultrahigh-resolution UAS images. Precis. Agric. 2018, 19, 161–177. [Google Scholar] [CrossRef]
- Berni, J.A.J.; Zarco-Tejada, P.J.; Suárez, L.; Elias, F. Thermal and narrowband multispectral remote sensing for vegetation monitoring from an unmanned aerial vehicle. IEEE Trans. Geosci. Remote Sens. 2009, 47, 722–738. [Google Scholar] [CrossRef]
- Leduc, M.-B.; Knudby, A.J. Mapping wild leek through the forest canopy using a UAV. Remote Sens. 2018, 10, 70. [Google Scholar] [CrossRef]
- Guimarães, T.T.; Veronez, M.R.; Koste, E.C.; Gonzaga, L.; Bordin, F.; Inocencio, L.C.; Larocca, A.P.C.; de Oliveira, M.Z.; Vitti, D.C.; Mauad, F.F. An alternative method of spatial autocorrelation for chlorophyll detection in water bodies using remote sensing. Sustainability 2017, 9, 416. [Google Scholar] [CrossRef]
- Diago, M.P.; Sanz-Garcia, A.; Millan, B.; Blasco, J.; Tardaguila, J. Assessment of flower number per inflorescence in grapevine by image analysis under field conditions. J. Sci. Food Agric. 2014, 94, 1981–1987. [Google Scholar] [CrossRef]
- Dias, P.A.; Tabb, A.; Medeiros, H. Multispecies fruit flower detection using a refined semantic segmentation network. IEEE Robot. Autom. Lett. 2018, 3, 3003–3010. [Google Scholar] [CrossRef]
- Cortes, C.; Vapnik, V. Support-vector networks. Mach. Learn. 1995, 20, 273–297. [Google Scholar] [CrossRef]
- Ho, T.K. The random subspace method for constructing decision forests. IEEE Trans. Pattern Anal. Mach. Intell. 1998, 20, 1–22. [Google Scholar]
- Hu, W.; Huang, Y.; Wei, L.; Zhang, F.; Li, H. Deep convolutional neural networks for hyperspectral image classification. J. Sens. 2015, 2015, 258619. [Google Scholar] [CrossRef]
- Friedman, N.; Geiger, D.; Goldszmidt, M. Bayesian network classifiers. Mach. Learn. 1997, 29, 131–163. [Google Scholar] [CrossRef]
- Erbek, F.S.; Özkan, C.; Taberner, M. Comparison of maximum likelihood classification method with supervised artificial neural network algorithms for land use activities. Int. J. Remote Sens. 2004, 25, 1733–1748. [Google Scholar] [CrossRef]
- Snavely, N.; Seitz, S.M.; Szeliski, R. Modeling the world from internet photo collections. Int. J. Comput. Vis. 2008, 80, 189–210. [Google Scholar] [CrossRef]
- Shen, S. Accurate multiple view 3D reconstruction using patch-based stereo for large-scale scenes. IEEE Trans. Image Process. 2013, 22, 1901–1914. [Google Scholar] [CrossRef] [PubMed]
- Kazhdan, M.M.; Bolitho, M.; Hoppe, H. Poisson surface reconstruction. In Proceedings of the Fourth Eurographics Symposium on Geometry Processing, Cagliari, Italy, 26–28 June 2006. [Google Scholar]
- Waechter, M.; Moehrle, N.; Goesele, M. Let there be color! Large-scale texturing of 3D reconstructions. In Computer Vision—ECCV 2014. Lecture Notes in Computer Science 2014; Fleet, D., Pajdla, T., Schiele, B., Tuytelaars, T., Eds.; Springer: Cham, Switzerland, 2014. [Google Scholar]
- Landis, J.R.; Koch, G.G. The measurement of observer agreement for categorical data. Biometrics 1977, 33, 159–174. [Google Scholar] [CrossRef]
- Krzyzanowski, F.C.; Delouche, J.C. Germination of cotton seed in relation to temperature. Rev. Bras. Sementes 2011, 33, 543–548. [Google Scholar] [CrossRef]
- Suo, C.; McGovern, E.; Gilmer, A. Coastal dune vegetation mapping using a multispectral sensor mounted on an UAS. Remote Sens. 2019, 11, 1814. [Google Scholar] [CrossRef]
- He, J.; Zhang, N.; Su, X.; Lu, J.; Yao, X.; Cheng, T.; Zhu, Y.; Cao, W.; Tian, Y. Estimating leaf area index with a new vegetation index considering the influence of rice panicles. Remote Sens. 2019, 11, 1809. [Google Scholar] [CrossRef]


| Truth | ||||||
|---|---|---|---|---|---|---|
| Predication (Pixel) | Class | Cotton | Soil | Shadow | Plastic | Total |
| cotton | 943 | 0 | 0 | 0 | 943 | |
| soil | 19 | 2879 | 131 | 54 | 3083 | |
| shadow | 6 | 88 | 1184 | 155 | 1433 | |
| Plastic | 0 | 0 | 8 | 8537 | 8545 | |
| Total | 971 | 2967 | 1326 | 8750 | 14,014 | |
| Truth | ||||||
|---|---|---|---|---|---|---|
| Predication (percent) | Class | Cotton | Soil | Shadow | Plastic | Total |
| cotton | 96.70 | 0 | 0 | 0 | 6.69 | |
| soil | 1.96 | 97.03 | 10.69 | 0.56 | 22.02 | |
| shadow | 1.34 | 2.97 | 88.42 | 1.67 | 10.20 | |
| Plastic | 0 | 0 | 0.90 | 97.77 | 61.09 | |
| Total | 100 | 100 | 100 | 100 | 100 | |
| Sample | Number of Cotton Plants | Germination Rate | |||||
|---|---|---|---|---|---|---|---|
| Manual | Non Split | Split | Sown | Manual | Non Split | Split | |
| 1 | 820 | 682 | 788 | 1200 | 0.683 | 0.568 | 0.657 |
| 2 | 920 | 736 | 850 | 1400 | 0.657 | 0.526 | 0.607 |
| 3 | 582 | 479 | 532 | 1200 | 0.485 | 0.399 | 0.443 |
| 4 | 768 | 625 | 691 | 1200 | 0.640 | 0.521 | 0.576 |
| 5 | 930 | 677 | 862 | 1400 | 0.664 | 0.484 | 0.616 |
| 6 | 635 | 498 | 556 | 1200 | 0.529 | 0.415 | 0.463 |
| 7 | 564 | 475 | 499 | 1200 | 0.470 | 0.396 | 0.416 |
| 8 | 679 | 498 | 602 | 1200 | 0.566 | 0.415 | 0.502 |
| 9 | 809 | 672 | 745 | 1400 | 0.578 | 0.480 | 0.532 |
| 10 | 813 | 632 | 724 | 1400 | 0.581 | 0.451 | 0.517 |
| 11 | 712 | 586 | 627 | 1400 | 0.509 | 0.419 | 0.448 |
| 12 | 795 | 672 | 750 | 1400 | 0.568 | 0.480 | 0.536 |
| Total/mean | 9027 | 7232 | 8226 | 156,00 | 0.577 | 0.463 | 0.526 |
© 2019 by the authors. Licensee MDPI, Basel, Switzerland. This article is an open access article distributed under the terms and conditions of the Creative Commons Attribution (CC BY) license (http://creativecommons.org/licenses/by/4.0/).
Share and Cite
Xia, L.; Zhang, R.; Chen, L.; Huang, Y.; Xu, G.; Wen, Y.; Yi, T. Monitor Cotton Budding Using SVM and UAV Images. Appl. Sci. 2019, 9, 4312. https://doi.org/10.3390/app9204312
Xia L, Zhang R, Chen L, Huang Y, Xu G, Wen Y, Yi T. Monitor Cotton Budding Using SVM and UAV Images. Applied Sciences. 2019; 9(20):4312. https://doi.org/10.3390/app9204312
Chicago/Turabian StyleXia, Lang, Ruirui Zhang, Liping Chen, Yanbo Huang, Gang Xu, Yao Wen, and Tongchuan Yi. 2019. "Monitor Cotton Budding Using SVM and UAV Images" Applied Sciences 9, no. 20: 4312. https://doi.org/10.3390/app9204312
APA StyleXia, L., Zhang, R., Chen, L., Huang, Y., Xu, G., Wen, Y., & Yi, T. (2019). Monitor Cotton Budding Using SVM and UAV Images. Applied Sciences, 9(20), 4312. https://doi.org/10.3390/app9204312