2.1. Modeling of Joint Force
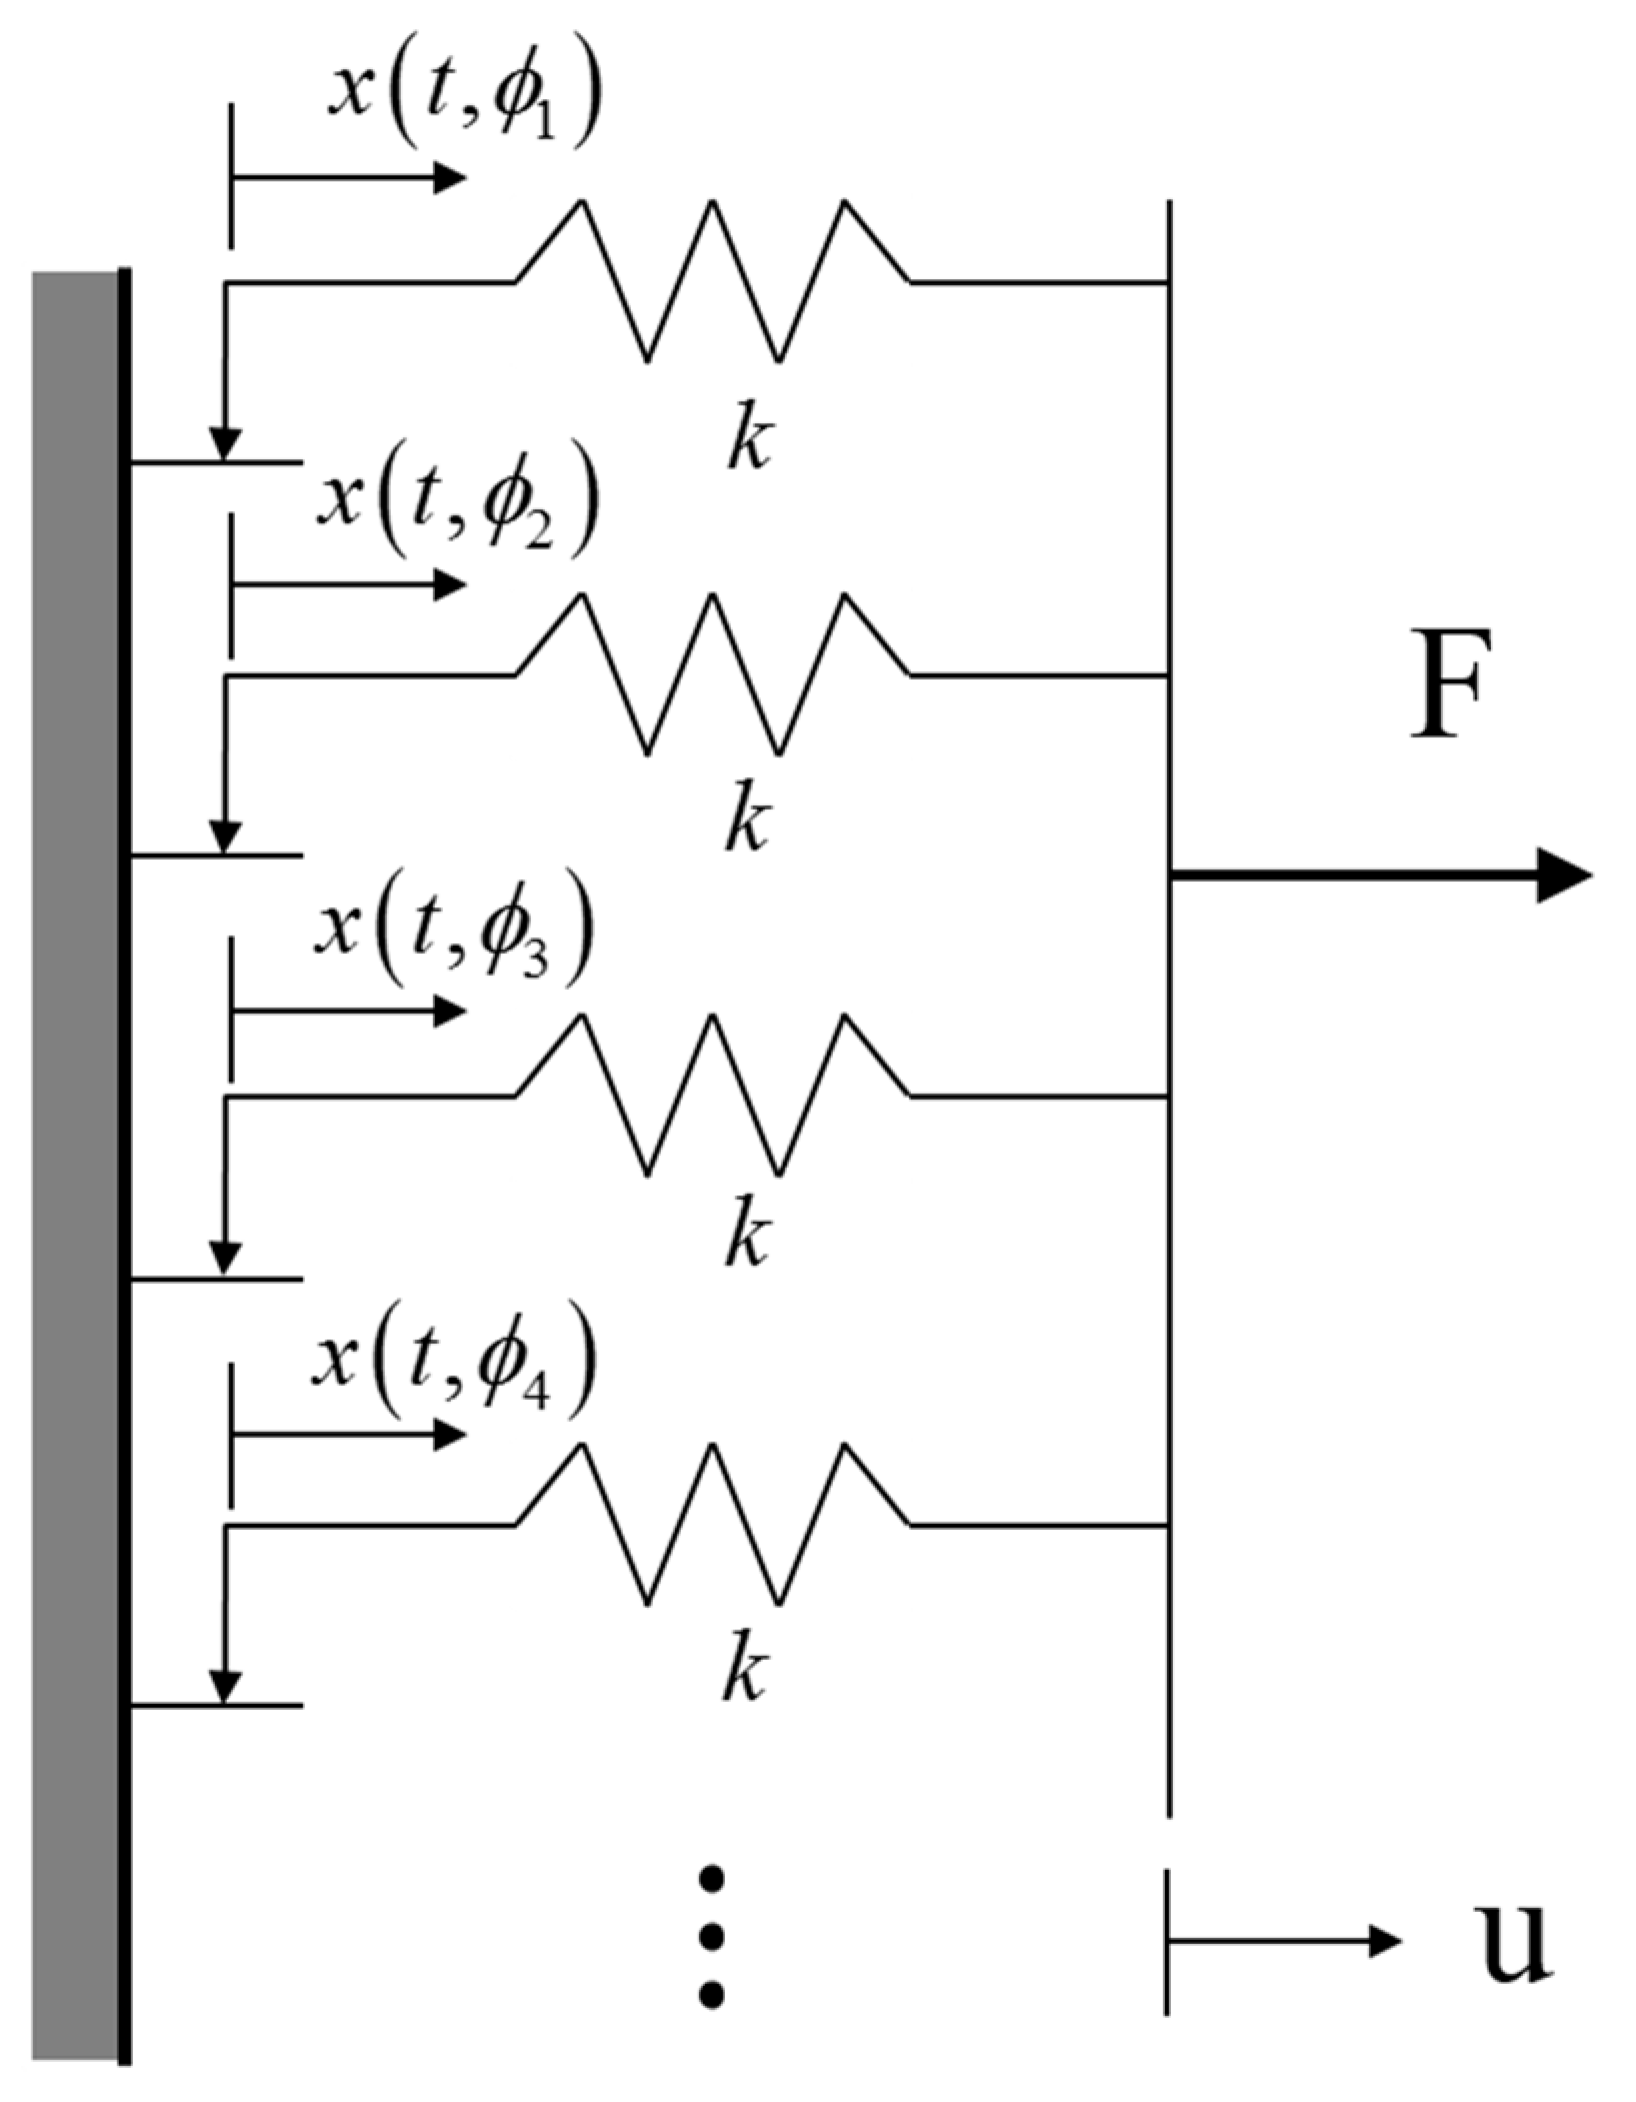
Figure 1 shows the parallel-series Iwan model that has an equivalent stiffness
k. The mathematical description of this model is as follows:
In Equation (1), F denotes the applied force.
denotes the sliding distance of each element and
denotes the population density of Jenkins element of strength
.
u denotes the imposed distance and
x denotes the slider displacement. Each quantity has the following dimensions. F has the dimension of force (N).
,
u and
x have the dimension of length (m). The slider displacement
x(t,
) evolves from the imposed displacement
u(t).
In Equation (2),
and
represent the slider velocity and the imposed velocity, respectively. If
u is subject to frequency ω and amplitude A, it means
Then, Equation (1) can be represented as follows:
The second term on the right-hand side of Equation (4) can be obtained because
for all
> A. If one re-arranges Equation (4),
.
In Equation (5),
KT represents the added stiffness by joints in built-up structures. △
FS represents the variation force for the occurring slip. We adopt the representation of the density function
in Reference [
12] to investigate in more detail the result in this equation; this representation is composed of the 4 parameters and is shown below:
In Equation (6),
R, χ,
and
S are four parameters that describe the density function. Here,
R is the parameter related to the magnitude of the density function. χ is a constant, which has a value between −1 and 0.
is a constant representing the border line that determines the micro-slip and macro-slip in the contact surfaces of two objects. S is a constant to describe the dynamic characteristics when macro-slip occurs. In addition, H and δ in this equation represent the Heaviside function and the Dirac delta function, respectively. These four parameters {
R, χ,
and
S} can be transformed into the following four parameters {χ,
KT, F
S and
β}. In these newly introduced parameters, χ is the existing parameter in the original set and
KT represents the introduced added stiffness by joint in Equation (4). The other remaining parameters have the following relations [
12]:
In the results of Equation. (7),
FS represents the critical force to generate macro-slip.
β is the constant related to the curvature in the backbone curve. If one assumes that the constitutive model in Equation. (3) behaves in the micro-slip region, then the variation force in Equation. (5) can be represented as the following:
In Equation (8), the slider displacement
x is related to the imposed velocity
as follows [
9,
13]:
Substituting Equation (9) in Equation (8), then,
In Equation (10), the superscripts + and – refer to the moment when
has positive and negative values, respectively. If one substitutes Equation (3) into the results of Equation (10), then,
.
If one attempts to represent the variation force for one period, as shown in Equation (11), which is divided into two regions in the time domain by a Fourier series, the following is obtained:
where
Equation (12) shows the variation force, which is represented in the Fourier series. Equation (13) shows the forms of every coefficient of this equation. In Equation (13),
T denotes one period of time (i.e.,
T = 2π/ω). If one applies Equation (11) to Equation (12) and represents the variation force using only the fundamental frequency component (i.e., the first harmonic component), then the following result can be obtained (a detailed description on how to obtain this result is in
Appendix A):
Configurations of
and
in Equation (14) refer to Equation (A15). If one considers the more practical case of the imposed displacement compared to the case in Equation (3),
The variation force with respect to the case in Equation (15) can be obtained as follows if one follows a similar procedure to obtain the result in Equation (14).
Re-representing Equation (16) after substituting Equation (15) into this equation, produces the following:
It can be confirmed from Equation (A15) that
and
will have negative and positive values, respectively. Therefore, one can re-represent Equation (17) as follows:
The above equation approximately represents the induced force when harmonic dynamic behavior occurs in the constitutive model.
2.2. Modal Formulation of the Full Structure
In this section, the configuration of the variation force, which is generated in the constitutive model during dynamic behavior, is examined through a 2 degrees-of-freedom (DOF) system. In addition, this result is extended to a multi-degree-of-freedom system, which involves the constitutive model. The configuration of the FRF for this system with respect to the harmonic excitation is obtained. The methodology, which is intended in this study to estimate certain parameters out of the parameters of the constitutive model, is introduced through these results.
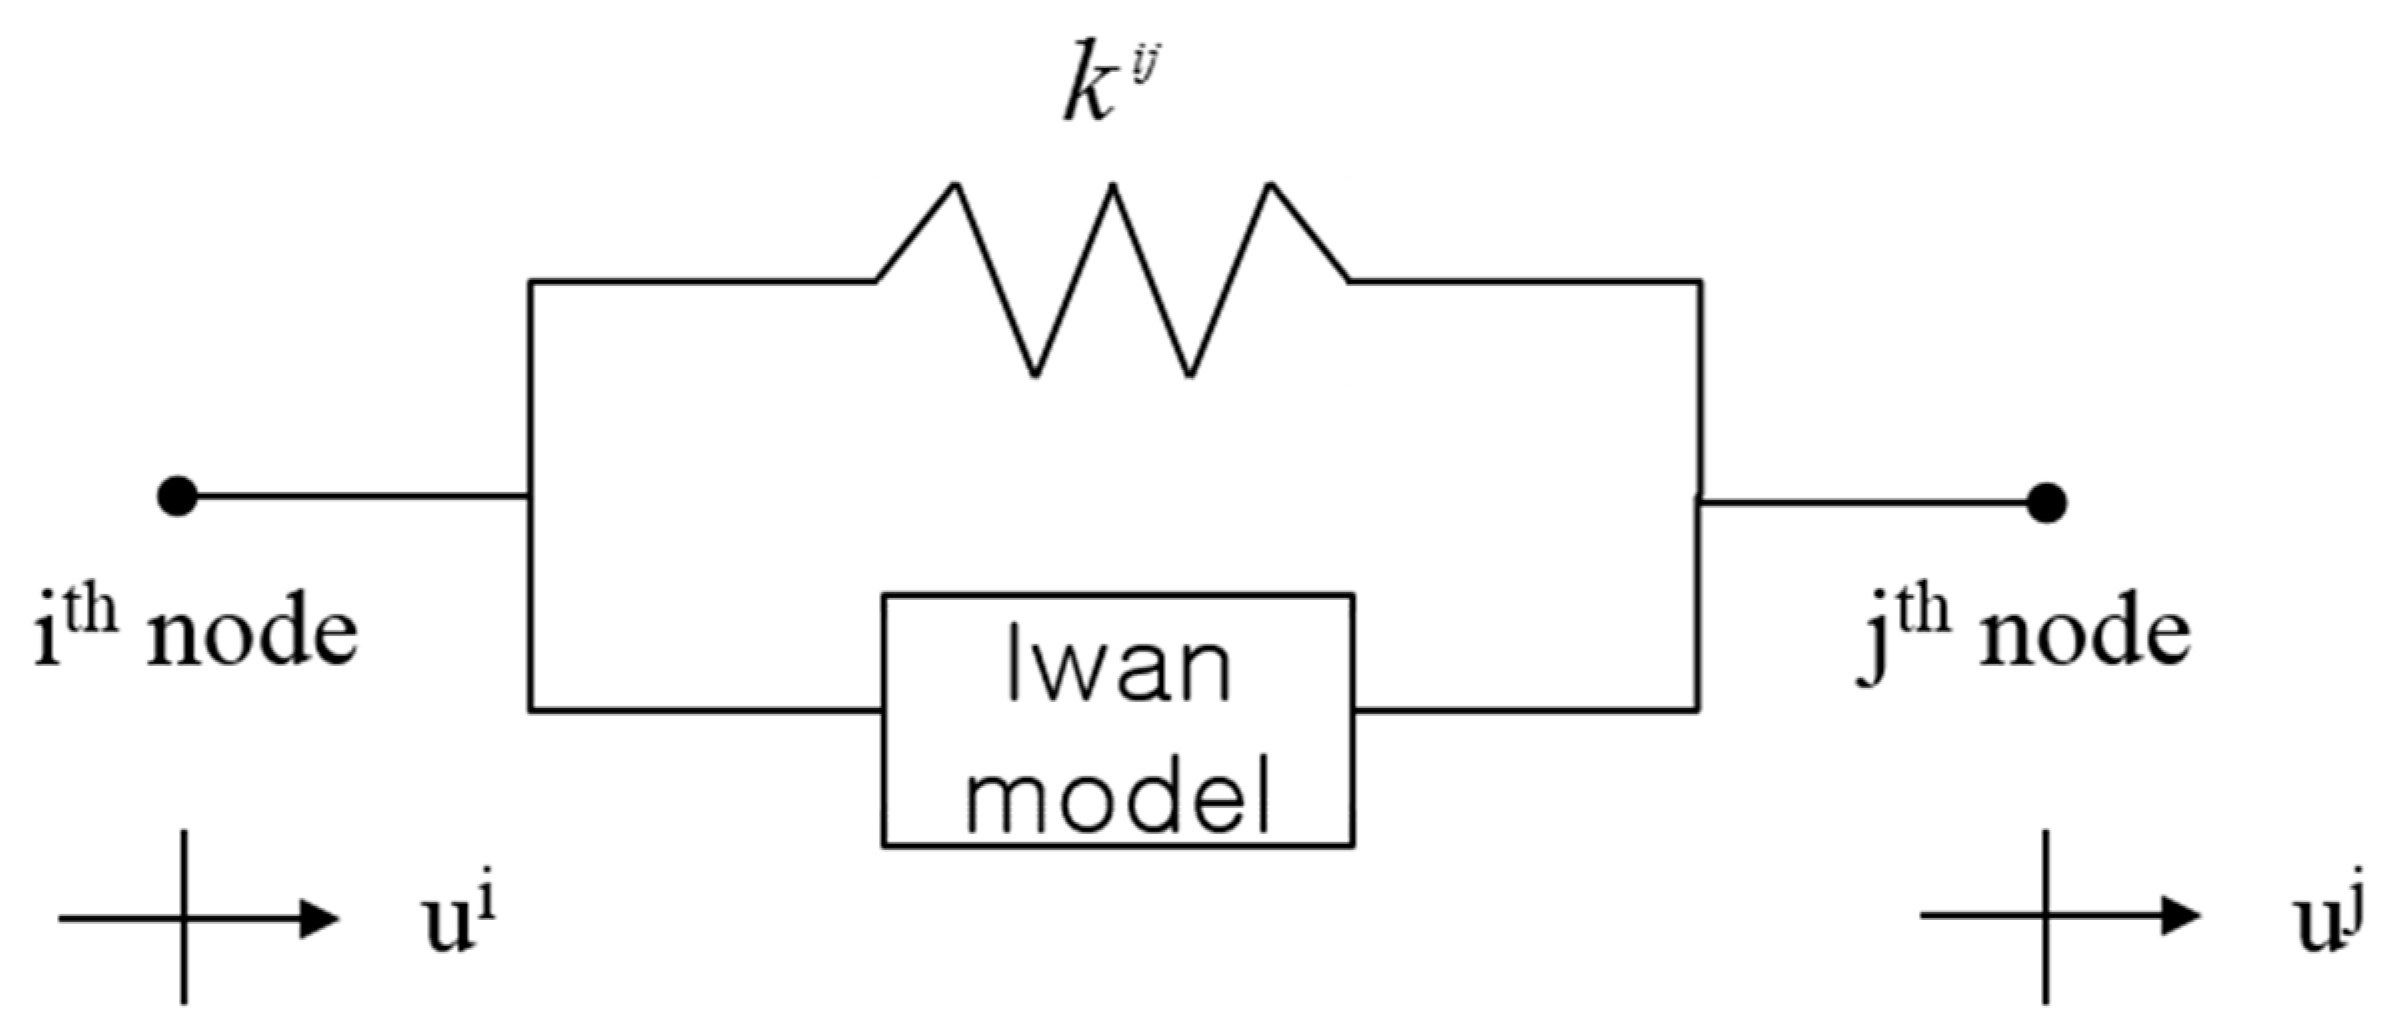
Figure 2 represents a 2 DOF system, which is connected by the stiffness k
ij and the Iwan model. Here, u
i and u
j represent the displacement at each node. The relative displacement between these two nodes when an external force is applied can be represented as follows:
In Equation (19),
denotes the amplitude of the relative displacement between the
ith and
jth nodes. By using this equation, the restoring force in the stiffness and the generating force in the Iwan model can be represented in vector-matrix form using Equations (5) and (18):
where
Equations (20) and (21) represent the restoring force in the stiffness and the variation force in the constitutive model when an external force is applied, respectively. Detailed configurations on each element of Equation. (21) are introduced in Equation. (22). In this equation, the matrix
denotes a matrix that is composed of combinations of the added stiffness (
KT) by joints, which is one of the parameters defining the Iwan model. The matrix
denotes a matrix that is composed of the combinations of relative displacement between nodes. Actually, the results in these equations can be extended without a loss of generality for general built-up structures. This means that the results of Equations (20)–(22) can be regarded as the local matrix for the interface between the jointed surfaces of general built-up structures. If one represents the equilibrium of force in general built-up structures by a vector summation form according to the Newton’s second law, then,
In Equation. (23), the subscripts I, e, c, r and J denote the force by inertia, the external force, the force by damping, the restoring force by stiffness and the force occurring in the joint component, respectively. If the equation of motion for the full structure is represented with this equation, then the following is obtained:
On the left side of Equation (24),
M,
C and
K denote the mass, damping and stiffness matrices for the full system, respectively. Note that, in general, there are multiple numbers of joint components in the built-up structures. Therefore, as mentioned in [
13], “if one wants to estimate information on a certain constitutive model for a certain joint, the other joint components should be excepted from the full built-up structures apart from the joint component of interest”. Hence, the numerical model for the full structure, which includes the joint component shown in Equation (24), indicates that only the joint component of interest is connected in the full system. In this study, the full system stands for the same meaning of this statement. On the right side of Equation (24), every term apart from the external forcing vector
represents forces generated from the joint in a global coordinate system. In particular, matrices
and
are all of the symmetric matrices and are composed of real values. Re-arranging Equation (24) after transferring all of the terms in the right hand side of the equation apart from the term in the external forcing vector to the left side produces the following:
where
.
denotes the stiffness matrix in a static state and both
and
denote the effects in the joint component by the dynamic behavior of the system. It can be confirmed through the signs of these two matrices that each term of these two effects of dynamic behavior will cause a decrease of stiffness and an increase of damping in the full system. These confirmations are consistent with previous research [
13,
17]. In addition, assuming an external force with a harmonic component, then the velocity vector can be expressed by the multiplication of
with the displacement vector. Here,
j stands for the imaginary value. From this assumption,
From Equation (26), it is also confirmed that the increased damping due to dynamic behavior shows the form of structural damping (hysteric damping). It is a natural consequence because the hysteric behavior in elastoplastic elements is described in bi-linear form in Reference [
9]. In conclusion, the physical meaning of Equations (25) and (26) are representative of the full system; if the joint component is connected, then the original stiffness
K is increased by
. In addition, if dynamic behavior is initiated by external forces, then slip occurs at the interface of the jointed structures and results in an increase in damping and decrease in stiffness. The type of damping variation during dynamic behavior shows the form of structural damping. Hereafter, the frequency response function will be obtained for the full system. To this end, the eigenvalue problem of Equation (26) is solved. For the case of no external force, there are no dynamic effects (
,
), and therefore, this equation can be transformed into a simpler form. First, for the un-damped case, the n
th eigenvalue and eigenvector can be represented by
and
, respectively. These two results are composed of all real values.
where
.
Equation (27) shows the configuration of the n
th eigenvalue and eigenvector. Here, the eigenvector represents the mass normalized eigenvector. The superscript
T stands for the transpose. If assuming proportional damping (e.g.,
; here,
a and
b are real constants), then the eigenvector will have the equivalent to the eigenvector in Equation (27), and the eigenvalue will have following form;
If the effect of stiffness in the static state is much larger than the effect of the variation stiffness by dynamic behavior, it is suggested that the following conditions are satisfied,
one can obtain the following results:
where,
.
From the results in Equation (30), Equation (26) can be represented by the model summation form.
In Equation (31), the term in the bracket represents the frequency response function of a built-up structure that includes the joint component. In the term, the values of
and
in the denominator represent a real and imaginary part, respectively, and indicate the amount of the decreased natural frequency and increased damping by slip at the interface of jointed structures during dynamic behavior. The amount of the damping variation during dynamic behavior will be investigated in more detail. The amount of this quantity for a certain mode is
In Equation (32),
P represents a quadratic polynomial with variables of the
lth eigenvector.
M denotes the number of the Iwan model.
A represents the magnitude of the relative displacement between the connected nodes by the constitutive model. If the magnitude of the initially applied force was assumed to be
and the experiment was performed by increasing the applied force
z times, then the relative displacement
A also increased
z times. By using this assumption, the variation of damping in each experiment could be expressed as:
where
Equation (33) shows the variation in the magnitude of damping values between each sequential experiment when the magnitude of the external force was increased
z times based on
. The total number of experiments shown in Equation (33) was
+1. However, the variation of damping values in each experiment shown in Equation (33) was difficult to identify practically. Therefore, the relative variation of damping values between sequential experiments was investigated.
Taking the logarithm of the terms on both sides of Equation (34) and using
z as the logarithm base, the following was obtained:
where
.
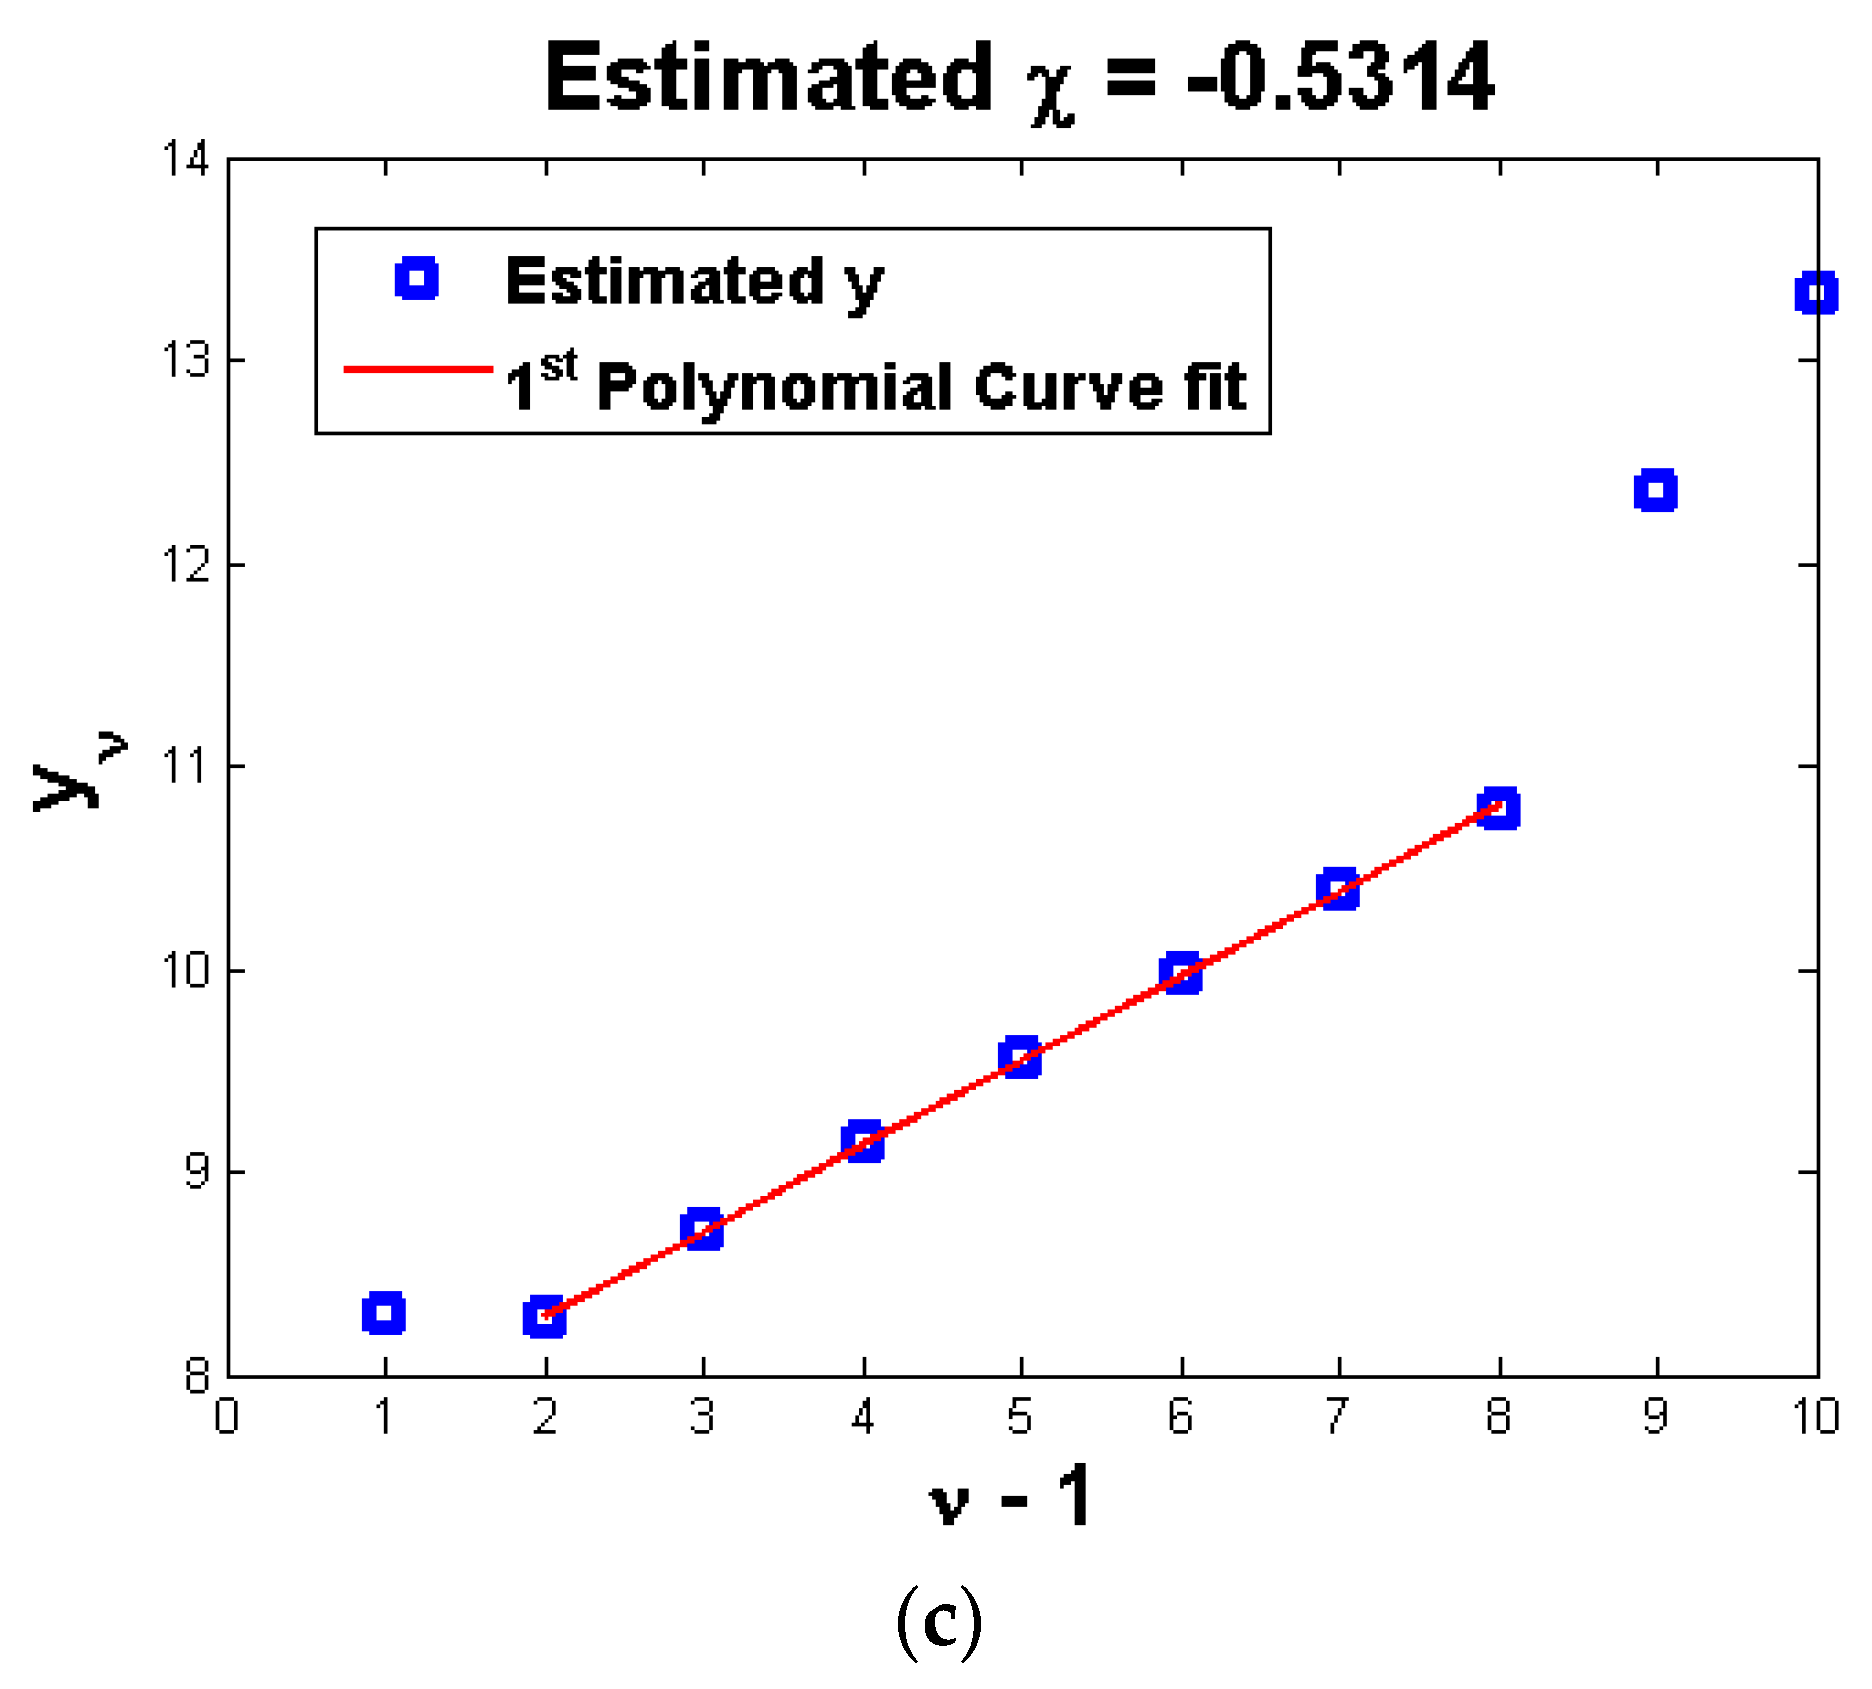
Equation (35) shows the difference in the damping values of sequential experiments in which the external force was increased z times in each trial. The results of this equation were obtained experimentally. If the results are plotted after taking the logarithmic function, which has z as the logarithm base, then the slope of this plot is . Here, the abscissa indicated a negative one order for the performed experiments, and the ordinate indicated the measured values. This concept was similar to the conventional method used to estimate the value of by converting the dissipated energy with respect to the external harmonic force to a logarithmic scale. To estimate using Equation (35), linear curve fitting was performed on the measured damping values converted to a logarithmic scale. Here, the y intercept was regarded as . Since z could be measured through experiments or as the magnitude ratio of the applied force in successive experiments, was estimated through a0 in Equation (35). This was the same as in Equation (33). As a result, every in Equation (33) could be estimated.
By combining Equations. (33), (34), and (A15), the following relations were obtained:
In Equation (36), all of the variables except the constant
B could be estimated by experiments. If a numerical model for the full system exists, then the stiffness
in Equations (24) and (25) can be estimated, which was the case for the absence of joint components. If an experiment was performed by applying a very small force to the built-up structure, which includes the joint component, then the added stiffness
at the interface could be estimated. Eventually, a static stiffness
could be obtained. From this result, the mode shape for an undamped system could be estimated. In addition, if the external forces used in the experiments were applied to the numerical model to obtain the results in Equation (33), then the relative displacement at the contact surface could be estimated. Using these results, Equation (36) was re-arranged:
where
.
The superscript tilde in Equation (37) indicates estimated values from the numerical model. This equation indicates that if was estimated using the mode shape and the relative displacements at the contact surface, which were obtained from the numerical model, then the parameter could be estimated.


