Article

Viscoelastic Properties of Asphalt Mixtures with Different Modifiers at Different Temperatures Based on Static Creep Tests

College of Transportation, Jilin University, Changchun 130025, China
*
Author to whom correspondence should be addressed.
Appl. Sci. 2019, 9(20), 4246; https://doi.org/10.3390/app9204246
Submission received: 10 September 2019 / Revised: 1 October 2019 / Accepted: 8 October 2019 / Published: 11 October 2019
(This article belongs to the Special Issue Asphalt Materials)

Abstract

:
To obtain the viscoelastic parameters of asphalt mixtures and analyze the effect of temperatures and modifiers on viscoelastic properties of asphalt mixtures, the creep compliances of the neat asphalt mixture (AM), compound diatomite and basalt fibers reinforced asphalt mixture (DBFAM), and styrene-butadiene-styrene modified asphalt mixture (SBSAM) were tested and calculated by the static creep tests. And the creep compliances of the three asphalt mixtures at −20 °C, −10 °C, and 0 °C are deducted by the time–temperature equivalence principle (TTEP) and Arrhenius equation. Further, the relaxation modulus of the three asphalt mixtures from −20 °C to 50 °C at 10 °C increments are calculated by the convolution integral and Simpson method. Subsequently, the Burgers model, the generalized Kelvin model, and the generalized Maxwell model are applied to analyze the viscoelastic properties of the three asphalt mixtures at different temperatures. The results show that the generalized Kelvin model and the generalized Maxwell model are superior to the Burgers model in describing the variation of viscoelastic properties of asphalt mixtures with loading time. At low temperatures, asphalt mixtures have excellent properties in resisting permanent deformation and releasing internal stress. Besides, the addition of SBS modifier and compound diatomite and basalt fibers modifier can significantly raise the viscosity η1 and the elastic modulus E1 of the asphalt mixture, respectively.

1. Introduction

With the increase of the traffic volume in recent years, neat asphalt mixtures have been difficult to cover all the required specifications in the design of asphalt pavements [1]. Therefore, more and more modifiers and reinforced materials are used to improve the performance of neat asphalt mixtures, such as styrene-butadiene-styrene (SBS), diatomite, and basalt fibers. Some researchers have pointed out that the basalt fibers and diatomite reinforced asphalt mixture (DBFAM), as well as SBS modified asphalt mixture (SBSAM), have excellent mechanical properties [2,3,4,5,6,7,8,9,10,11,12].
Zhang et al. [2] pointed out that the addition of diatomite significantly decreased the equivalent brittle point of asphalt, thus diatomite could greatly improve the low-temperature performance of asphalt. Tan et al. [3] studied the low-temperature performance of diatomite modified asphalt mixtures by static creep tests, thermal stress restraint tests, and thermal conductivity tests, and the results showed that the low-temperature performance of diatomite modified asphalt mixture is better than that of neat asphalt mixture. Yang et al. [5] claimed that the addition of diatomite could improve the water damage resistance and the permanent deformation resistance of neat asphalt mixtures, but could not improve the crack and fatigue resistance of asphalt mixtures.
Qin et al. [13] introduced that the stress could be dispersed and the development of cracks of asphalt could be suppressed by a stable three-dimensional network made by basalt fibers in the asphalt. Zhang et al. [14,15] found that the low-temperature cracking resistance of asphalt mixtures could be improved by adding basalt fibers, but this improvement was different by the variation of basalt fibers content. Zheng et al. [16] pointed out that the bending performance at low temperature and fatigue property of asphalt mixtures under the complicated environment such as chloride erosion and freezing–thawing environment could be improved by adding moderate basalt fibers content.
To further and comprehensively improve the properties of asphalt mixtures, some researchers proposed diatomite and basalt fibers were used simultaneously to enhance the performance of asphalt mixtures. Cheng et al. [17,18] reported that the basalt fibers and diatomite compound reinforced asphalt mastic and asphalt mixture exhibited excellent high- and low-temperature performance and fatigue resistance. According to the multi-objection orthogonal experimental design, the optimal proportions of basalt fibers and diatomite in asphalt mixtures were 0.32% and 14%, respectively [19]. Davar et al. [20] pointed to that basalt fibers could significantly improve the low-temperature performance of diatomite modified asphalt mixture, and can prolong the fatigue life of diatomite modified asphalt mixture.
In addition, SBS, as an organic modifier, is often used to improve the engineering performance of asphalt mixtures. Some studies indicated that the SBS modifier could significantly reinforce the cracking resistance and the rutting resistance of asphalt and asphalt mixtures, and reduce the temperature and moisture susceptibility of asphalt and asphalt mixtures [6,7,9,10,11,12,21]. Swamy et al. [22] investigated the viscoelastic properties of SBS modified asphalt binder using the Burgers model, and the results showed that the addition of SBS could improve the viscoelastic properties of the binder. Ameri et al. [1] studied that the fatigue resistance of SBS modified asphalt using the energy approach and the viscoelastic continuum damage method, and the results showed that the fatigue resistance of asphalt could be significantly enhanced by adding SBS.
It can be found from the above that DBFAM and SBSAM have outstanding high- and low- temperature properties, yet less work has been done to study the creep and relaxation properties of DBFAM and SBSAM. Asphalt mixtures have typical viscoelastic properties in working temperature range, and their mechanical properties are closely related to the loading time and ambient temperature [23,24,25]. Moreover, many linear viscoelastic models (e.g., Burgers model, generalized Kelvin model, and generalized Maxwell model) and nonlinear viscoelastic models (e.g., Schapery’s model) were applied to analyze creep and relaxation properties of asphalt mixtures [26,27,28]. However, the Burgers model, generalized Kelvin model, and generalized Maxwell model have a simple constitutive equation and can better characterize the deformation of asphalt mixture after loading, and the parameters of these models can be obtained by the simple test and calculation method.
Accordingly, in this paper, the creep compliances of asphalt mixture (AM), SBSAM, and DBFAM were tested at 10 °C, 20 °C, 30 °C, 40 °C, and 50 °C. Subsequently, the creep compliances at −20 °C, −10 °C, and 0 °C of the three asphalt mixtures are deducted by the time–temperature equivalence principle (TTEP) and the Arrhenius equation. Further, the relaxation modulus of the three asphalt mixtures at a temperature between −20 °C and 50 °C (at 10 °C increments) are calculated by the convolution integral, the generalized Kelvin model and the Simpson method. Also, the Burgers model, the generalized Kelvin model, and the generalized Maxwell model are applied to compare and analyze the trend of the viscoelastic properties of the three asphalt mixtures with the test temperature and the loading time. Besides, the viscoelastic properties of fibers reinforced asphalt mixtures (DBFAM) and polymers modified asphalt mixtures (SBSAM) were compared. This research could provide some references for the engineering application in a variety of climatic conditions and the numerical simulation analysis under variable temperature conditions of the three asphalt mixtures.

2. Materials and Methods
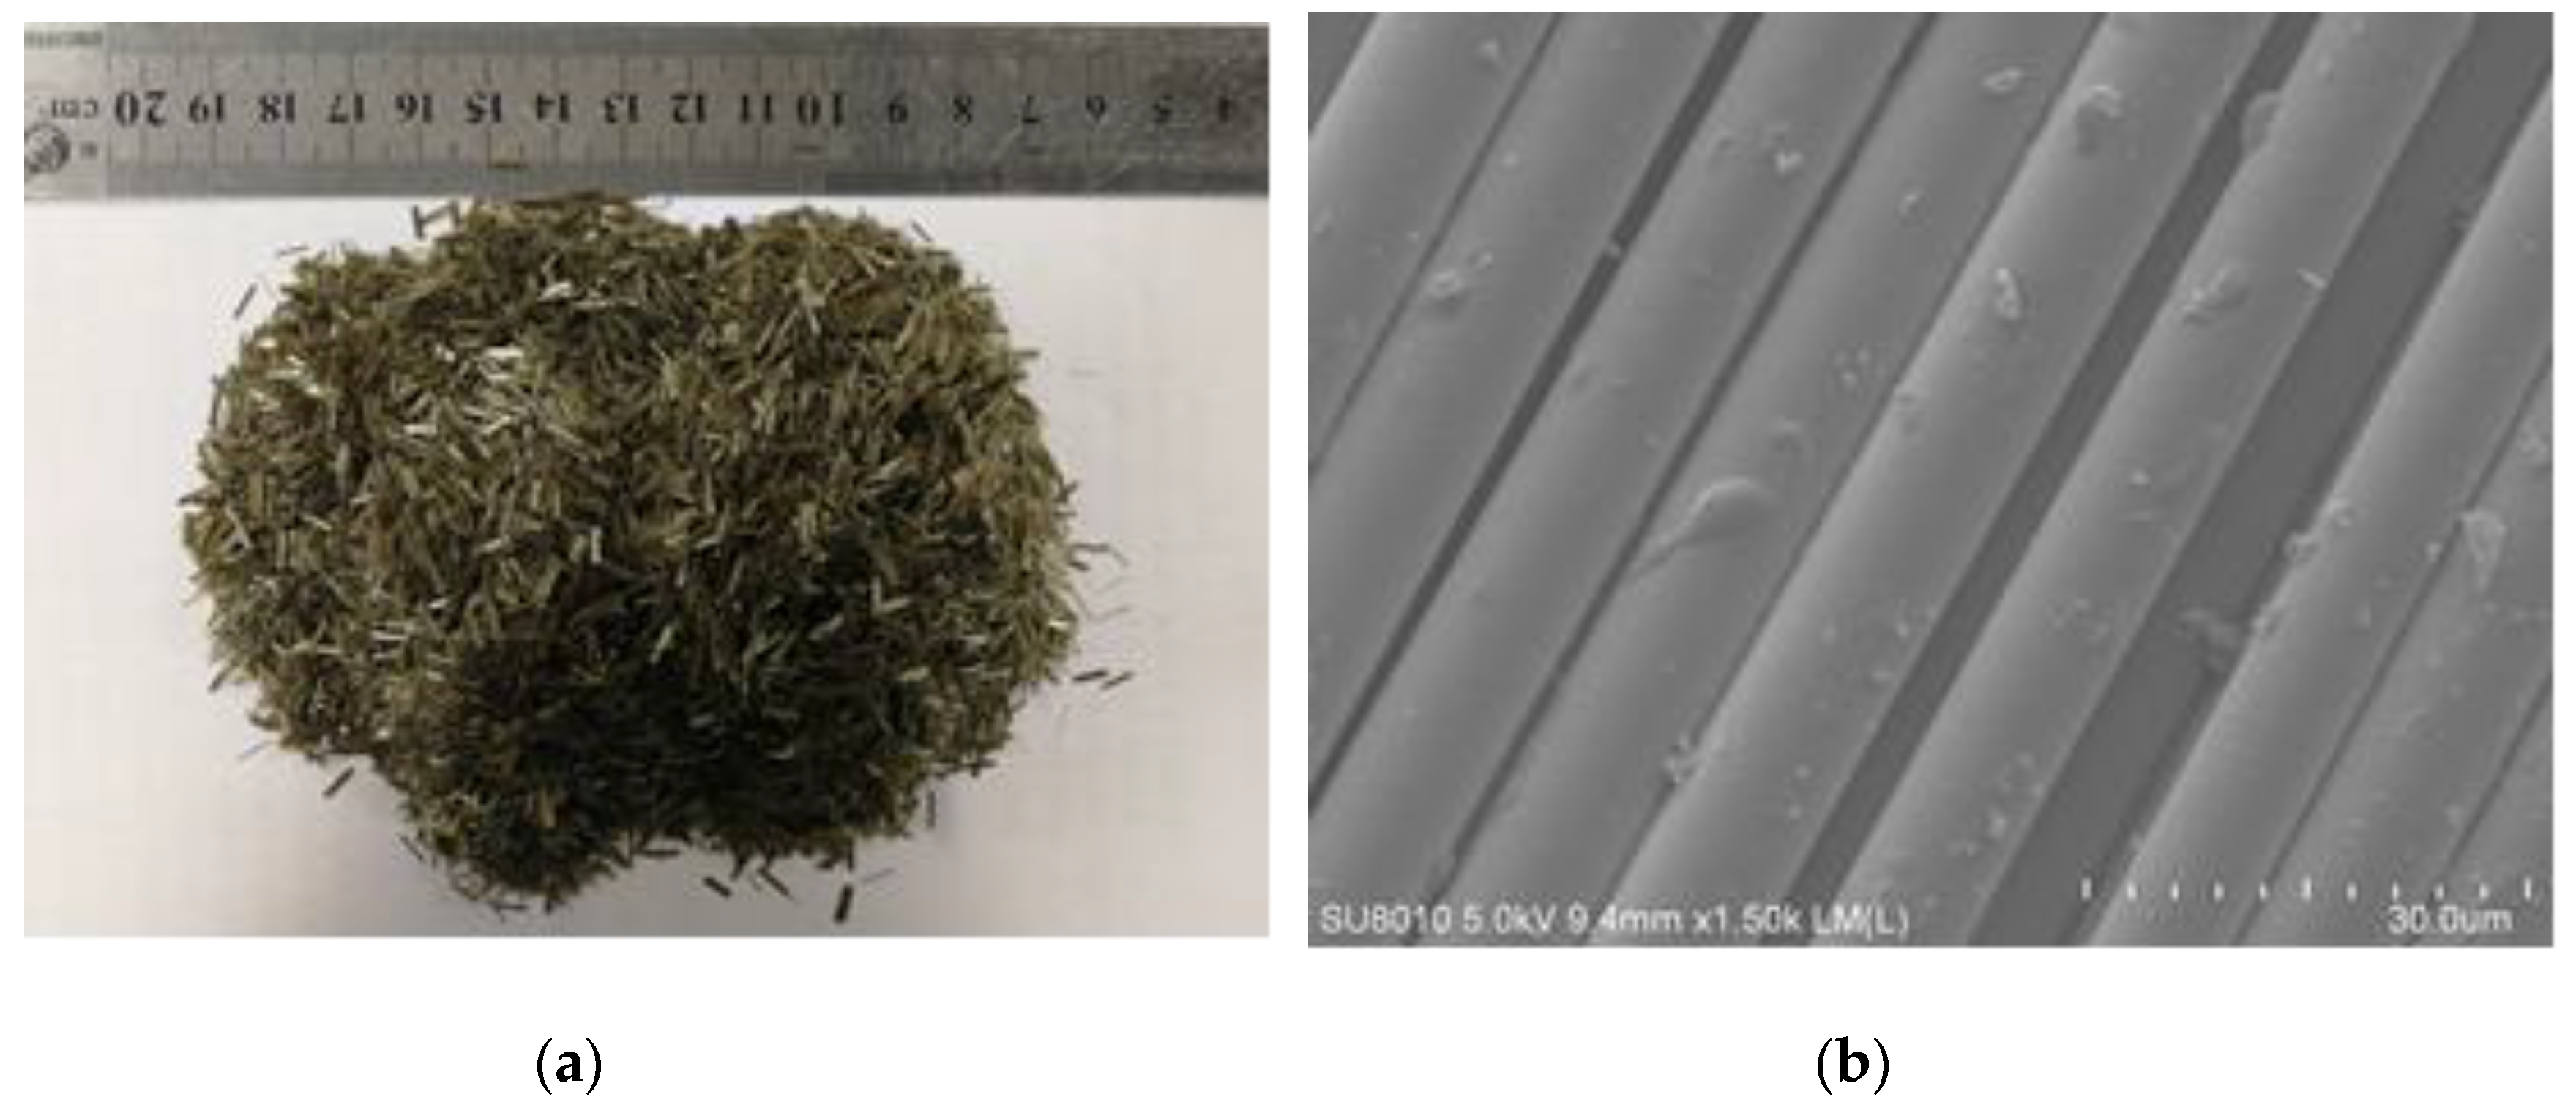
2.1. Materials

In this paper, the A-90# asphalt and SBS modified asphalt were used as the binder. They were obtained from one of the asphalt productions plants in Jilin Province. The physical properties are presented in Table 1. The basalt fibers with a diameter of 10–13 μm and a length of 6 mm were provided by Jiuxin Basalt Industry Co, Ltd, Jilin province, and its properties and features are shown in Figure 1 and Table 2. The diatomite was supplied from Changbai Mountain in Jilin province, with a size below 0.075 mm, and its chemical composition is presented in Table 3. Three typical asphalt mixtures were fabricated by using the Superpave gyratory compacter according to Standard Test Methods of Bitumen and Bituminous Mixtures for Highway Engineering (JTG E20-2011), with a dense-graded asphalt mixture and the nominal maximum aggregate size of 13 mm, shown in Table 4. The asphalt aggregate rate of AM, DBFAM, and SBSAM was 4.8%, 5.5%, and 4.9%, respectively [29]. The DBFAM contained 0.32 wt.% basalt fibers (relative to mineral mass ratio) and 14 wt.% diatomite (added in substitution to mineral filler) [19].

2.2. Experimental Method

To analyze the effect of temperature on viscoelasticity of asphalt mixtures and compare viscoelasticity between different asphalt mixtures, the static creep tests of DBFAM, SBSAM, and AM were performed at 10 °C, 20 °C, 30 °C, 40 °C, and 50 °C. For the static creep tests, the cylindrical asphalt mixture specimens with 100 mm in diameter and 63.5 mm in height were fabricated accordance with the previous researches [30,31,32,33]. And a contact pressure of 200 kPa (σ0) was applied on these specimens after 5-hour drying at experimental temperature. The loading is continued for 1 h at experimental temperature.

2.3. Interconversion between Relaxation Modulus and Creep Compliance

Asphalt mixture is typical viscoelasticity with creep and relaxation properties. Some studies have shown that there is a relationship between the creep compliance and the relaxation modulus as shown in Equation (1) [34,35,36]. The relaxation modulus of asphalt mixture can be calculated according to the corresponding creep compliance by Equation (1). The integral interval in Equation (1) is divided into n intervals to obtain Equation (2).
0 t n S ( ξ ) J ( t n ξ ) d ξ = t n
where S(ξ) is the relaxation modulus at time ξ, and J(t-ξ) is the creep compliance at time t-ξ.
0 t n S ( ξ ) J ( t n ξ ) d ξ = i = 1 n t i 1 t i S ( ξ ) J ( t n ξ ) d ξ = t n
For a sufficiently small integral interval [ti-1 ti], S(ξ) can be regarded as a constant S ( t i 1 + t i 2 ) , so Equation (2) can be written as Equation (3).
i = 1 n t i 1 t i S ( ξ ) J ( t n ξ ) d ξ = i = 1 n S ( t i 1 + t i 2 ) t i 1 t i J ( t n ξ ) d ξ = t n
According to the Simpson Rule Summary (Equation (4)), the Equation (3) can be further expressed as Equation (5) [24].
a b f ( t ) d t = b a 6 [ f ( a ) + 4 f ( a + b 2 ) + f ( b ) ]
where f(t) is integral function. a and b are upper and lower limits of the integral.
i = 1 n S ( t i 1 + t i 2 ) × t i t i 1 6 [ J ( t n t i 1 ) + 4 J ( t n t i 1 + t i 2 ) + J ( t n t i ) ] = t n
which can be written as a matrix form
A x = B
where A is a lower-triangular matrix, and vector x expresses the unknown values of the relaxation modulus. For example, the components for Equation (5) is given by
A i j = { ( t i t i 1 ) [ J ( t j t i 1 ) + 4 J ( t j t i 1 + t i 2 ) + J ( t j t i ) ] , i f j i 0 , i f j < i
x i = S ( t i 1 + t i 2 )
B i = 6 t i
for i , j { 1 , 2 , , n } .

3. Results and Discussion

3.1. Creep Compliance of Asphalt Mixtures at Different Temperatures

According to the static creep tests, the creep compliances of three samples with each asphalt mixture were tested and calculated from 10 °C to 50 °C at 10 °C increments. The average results of the three asphalt mixtures are shown in Figure 2. It can be seen from Figure 2 that in the initial stage, the creep compliances of the three asphalt mixtures grow rapidly with the increase of the loading time and the test temperature, respectively, and grows slowly in the late stage.
According to the TTEP, the creep compliances of asphalt mixtures at low temperatures can be obtained by horizontally shifting the high-temperature creep curves in logarithmic coordinates [37,38]. The shifting distance is called the shift factor and can be obtained by the overlap area surrounded by the displacement curve and the reference curve. And the shift factors can be calculated by Equation (10) [39]. The calculation results of the shift factors of the three asphalt mixtures at different temperatures are shown in Table 5.
According to the Arrhenius equation, there is a relationship between the shift factors of asphalt mixture and the experimental temperatures, which is shown in Equation (11) [25,40]. Using the Origin numerical processing software, the trends of shift factors with test temperatures for three asphalt mixtures are fitted by the Arrhenius equation. The fitting results of the parameters are shown in Table 6. Using the fitting results of the Arrhenius equation in Table 6, the shift factors of 0 °C, −10 °C, −20 °C relative to 50 °C are calculated as shown in Table 5. The creep compliance curves at 0 °C, −10 °C, −20 °C can be obtained by the calculated shift factors and the creep results measured by experiments, as shown in Figure 3.
log α T = k = 1 m + n ( x k y k + 1 x k + 1 y k ) ( y m y 1 + y m + 1 y m + n )
where log α T is the shift factor of the shift creep curve at T °C relative to the reference creep curve at T0 °C; m and n are the number of points on the reference curve and the shift curve in the overlap region, respectively; x k and y k are the horizontal and vertical coordinates on the creep curve in logarithmic coordinates, respectively; y 1 and y m are the minimum ordinate and the maximum ordinate of the overlap region of the reference curve in logarithmic coordinates, respectively; y m + 1 and y m + n are the maximum ordinate and the minimum ordinate of the overlap region of the reference curve in logarithmic coordinates; respectively.
α T = A × exp [ E R × ( 1 T 1 T 0 ) ]
where A is a constant of the material; E is the creep activation energy, kJ; R is the universal gas constant, 8.314 J/(mol∙K); T and T0 are the test temperature and the reference temperature, respectively, both of which are absolute temperature, K.

3.2. Creep Characteristics of the Three Asphalt Mixtures

3.2.1. Fitting Analyses of Creep Compliance

To better characterize the creep properties of the three types of asphalt mixtures, the Burgers model and the generalized Kelvin model are used to fit the curve of the creep compliances (J(t)) of the asphalt mixtures with time. The expressions of the Burgers model and the generalized Kelvin model are shown in Equation (12) and (13), respectively [25,41,42].
J ( t ) = 1 E 1 + t η 1 + 1 E 2 [ 1 exp ( E 2 t η 2 ) ]
The Burgers model is composed of a Maxwell model and a Kelvin model in series. E1 and η1 are the elastic modulus and the viscosity coefficient of the Maxwell model, respectively; E2 and η2 are the elastic modulus and the viscosity coefficient of the Kelvin model, respectively.
J ( t ) = J 0 + t η 0 + i = 1 n J i [ 1 exp ( t τ i ) ]
where J0 is the glassy compliance, η0 is the long-time viscosity or the zero-shear viscosity. For the viscoelastic solids, η0 → ∞ [43]. Ji and τi are the retardation strengths and the retardation times, respectively. The retardation times τi are fixed to the constants, τi = 2 × 10(i−3) (i = 1, 2, ⋯, 12).
The 1stopt software is used to fit the creep compliances of the three asphalt mixtures shown in Figure 3 based on the Burgers model and the generalized Kelvin model. The fitting results of the parameters are shown in Table 7 and Figure 3. It can be seen from the correlation coefficient R2 of the parameters that both the Burgers model and the generalized Kelvin model can better reflect the creep deformation tendency of the asphalt mixtures under constant load. It can also be found that the generalized Kelvin model is superior to the Burgers model in characterizing the creep compliance variation of three asphalt mixtures at different temperatures. The parameters obtained by fitting the generalized Kelvin model can perfectly reflect the development trend of creep compliance of the asphalt mixtures with the loading time, which can provide more reliable material performance parameters for the finite element simulation calculation of asphalt mixtures. But, due to its excessive parameters, the generalized Kelvin model is difficult in reflecting the variation of asphalt mixture performance with the test temperature. However, the parameters obtained by the Burgers model can better reflect the changes of viscoelastic properties of three asphalt mixtures with temperature, which are characteristics not reflected in the generalized Kelvin model.

3.2.2. Elastic Parts and Viscous Parts of the Three Asphalt Mixtures

E1 and η1 of the Burgers model characterizes the elastic part and the viscous part of the asphalt mixture, respectively [25]. According to the parameters of the Burgers model in Table 7, it can be seen that compared to AM, as the test temperature from 50 °C to −20 °C at 10 °C decrements, the E1 values of DBFAM increase by 14.9%, 40.3%, 51.28%, 81.62%, 102.0%, 103.1%, and 202.0%, and the E1 values of SBSAM increase by −19.1%, 11.32%, 5.37%, −1.49%, 11.16%, 10.3%, 9.2%, and 13.6%, respectively. This means that the addition of diatomite and basalt fibers can significantly improve the resistance of asphalt mixtures to instantaneous elastic deformation, while using SBS can significantly improve the resistance of asphalt mixtures to irreversible deformation. Figure 4 shows the variations of the creep parameters of the three asphalt mixtures with the test temperature. It can be found from Figure 4 that DBFAM has a higher elastic modulus E1 than SBSAM, but the viscosity coefficient η1 of SBSAM is higher than that of DBFAM. And it can be also found that with the decrease of temperature, the elastic modulus E1 and viscosity coefficient η1 of the three asphalt mixtures increase with the decrease of the test temperature, which means that with the decrease of temperature, the instantaneous elastic deformation (σ0/E1) of the three asphalt mixtures becomes smaller, and the permanent deformation development trend (σ0/η1) under the long-term load slows down.

3.2.3. Viscoelasticity of the Three Asphalt Mixtures

E2 and η2 characterize the viscoelasticity of the asphalt mixture. it can be seen from Figure 3 that, with the decrease of the test temperature, the elastic modulus E2 of the three asphalt mixtures decreases, and the viscosity coefficient η2 increases. Figure 5 shows the proportion of viscoelastic deformation to total deformation of the three asphalt mixtures at different temperatures and loading time. From the Figure 5, it also can be found that, at higher temperatures, the proportion of viscoelastic deformation ((1-exp(-E2t/η2)σ0/E2) to total deformation (σ0J(t)) of the three asphalt mixtures increases first and then decreases with the loading time; at lower temperatures, the proportion increases with the loading time increases. This is because when the temperature is high, the asphalt mixtures tend to be viscous. As the loading time increases, the viscous deformation gradually grows beyond the viscoelastic deformation. When the temperature is low, the asphalt tends to be elastic, and the viscous deformation grows slowly, which has little effect on the proportion of viscoelastic deformation to the total deformation.
It can also be seen from Figure 5 that, at the initial stage of loading and a lower temperature, the proportion of viscoelastic deformation to total deformation of the three asphalt mixtures is very small; and at the late stage of the loading time (3600 s) at 10 °C to 20 °C, the proportion reaches a peak value. This is because the main deformation of the asphalt mixtures is instantaneous elastic deformation in the initial stage of the loading time. When the temperature is between 10 °C to 20 °C, the viscoelastic deformation and viscous deformation growth of the asphalt mixtures in the late stage of loading (3600 s) are very close, which makes the proportion reach a peak. It can be inferred that when the loading time is long enough, the viscoelastic deformation of asphalt mixtures tends to be stable, while the viscous deformation will continue to increase, which will make the proportion of viscoelastic deformation of asphalt mixture to total deformation increase first and then decrease with the increase of the loading time.

3.3. Relaxation Characteristics of the Three Asphalt Mixtures

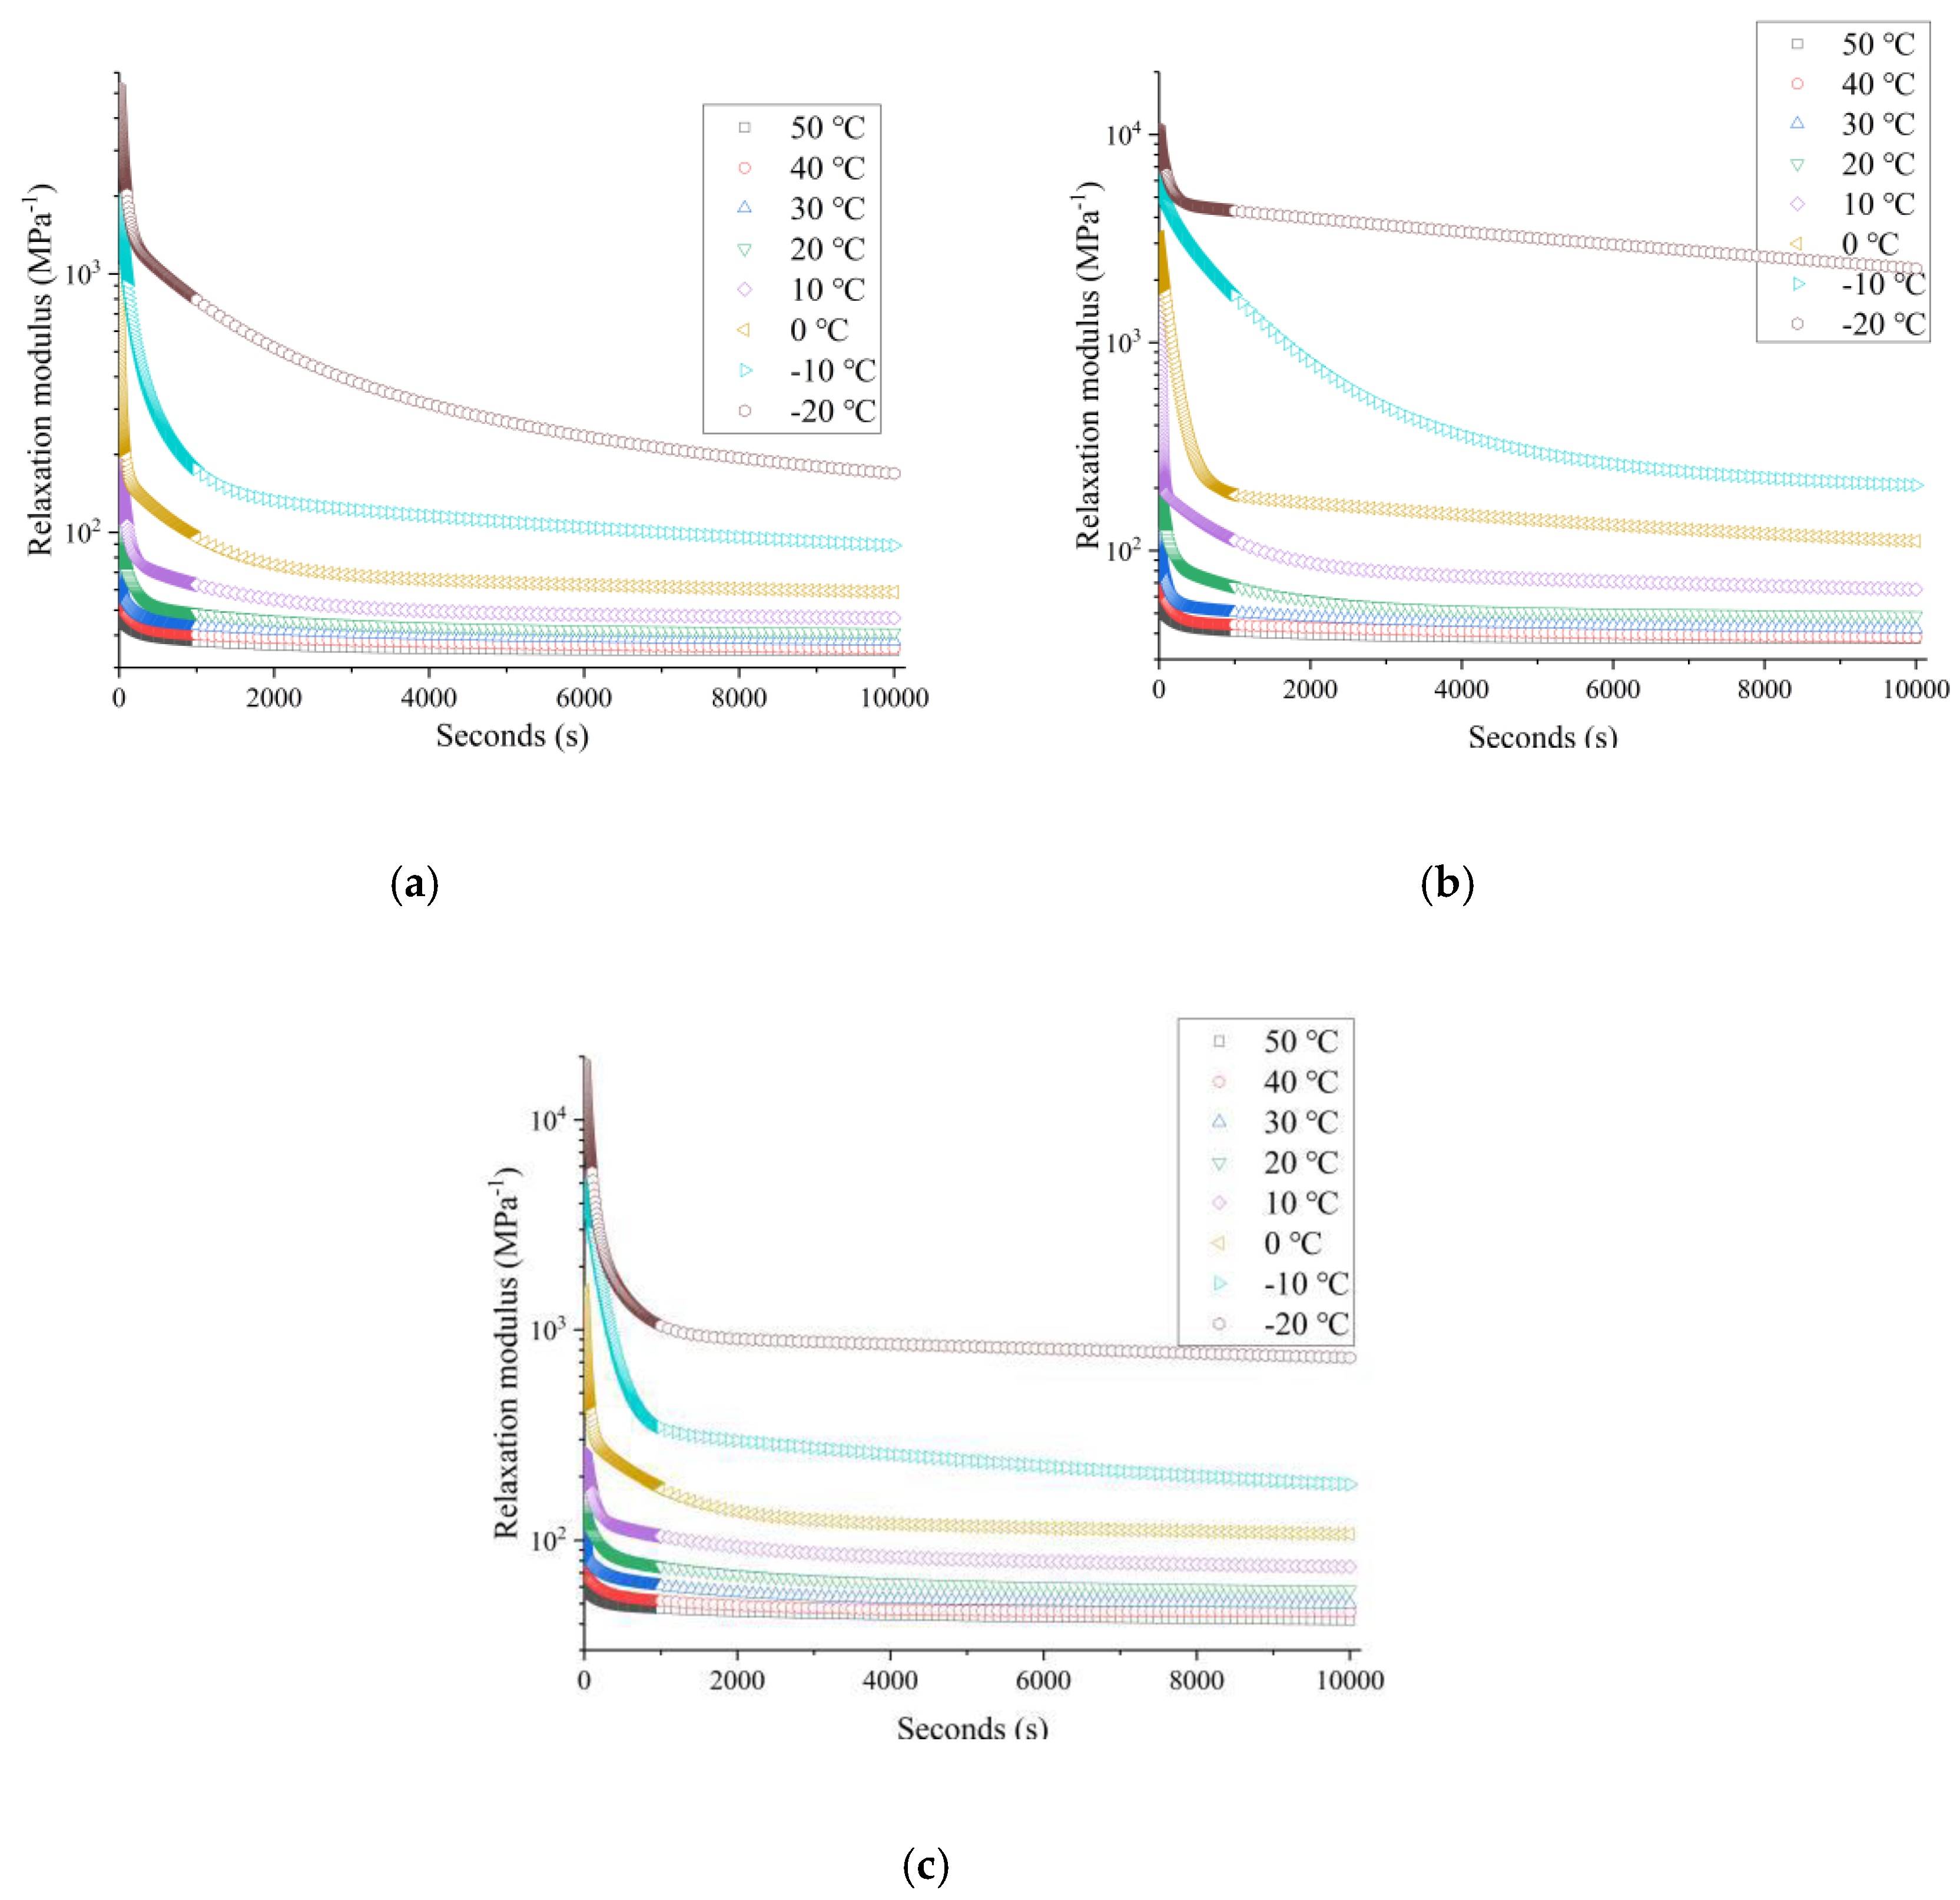
3.3.1. Calculation of Relaxation Modulus of the Three Asphalt Mixtures

The viscoelastic properties of the asphalt mixtures are composed of the creep compliance and the relaxation modulus. In order to comprehensively compare and evaluate the viscoelastic properties of the three asphalt mixtures at different temperatures, their relaxation moduli are derived based on the convolution integral between the relaxation modulus and the creep compliance, as shown in Equation (1). According to the fundamental principle and the Simpson Rule Summary shown in Equations (2)–(9), the relaxation moduli of the three asphalt mixtures are calculated by using the MATLAB software (R2014a, The MathWorks, Natick, MA, USA). The results of the calculation are shown in Figure 6. It can be seen from Figure 6 that in the initial stage, the relaxation modulus of the three asphalt mixtures declines rapidly with the increase of the loading time and the test temperature, respectively, and declines slowly in the late stage.

3.3.2. Fitting Analysis of Relaxation Modulus of the Three Asphalt Mixtures

The stress relaxation is an important property to evaluate the viscoelasticity and the resistance to temperature cracking of the asphalt mixtures. To better characterize the relaxation performance of the three asphalt mixtures, the Burgers model and the generalized Maxwell model are used to fit the curves of the relaxation moduli E(t) of the three types of asphalt mixtures with time, as shown in Figure 6. The expressions of the Burgers model used to fit the relaxation curves and the generalized Maxwell model are shown in Equation (14) and Equation (15), respectively [43,44,45,46].
E ( t ) = G 1 e t / p 1 + G 2 e t / p 2
where G1 and G2 are the relaxation strengths; p1 and p2 are the relaxation times used to characterize the time required for the asphalt mixture to release stress.
E ( t ) = E e + j = 1 n E j e t / ρ j
where Ee is the equilibrium modulus, Ej and ρ j are the relaxation strengths and the relaxation times, respectively. The relaxation times ρ j are fixed to the constants, ρ j = 2 × 10(j-3) (j = 1, 2, ⋯, 12).
The 1stopt software is used to fit the relaxation modulus of the three asphalt mixtures based on Equations (14) and (15). The fitting results of the model parameters are shown in Table 8, Table 9, Table 10 and Table 11. It can be observed from their correlation coefficients R2 that the fitting curves of the generalized Maxwell model and the Burgers model with four parameters show good agreement with the calculated data. This means that both the generalized Maxwell model and the Burgers model with four parameters can better characterize the relaxation properties of the three asphalt mixtures. However, it can also be seen from the correlation coefficient that the generalized Maxwell model is superior to the Burgers model with four parameters in describing the relaxation modulus trend of three asphalt mixtures with the loading time at different temperatures. The parameters obtained by fitting the generalized Maxwell model can reflect the relaxation properties of the asphalt mixtures, which can provide more reliable material performance parameters for the finite element simulation calculation of asphalt mixtures. Just as the parameters of the generalized Kelvin model, the fitting parameters of the generalized Maxwell model are also difficult to characterize the variation of the relaxation properties of the three asphalt mixtures with the test temperatures. However, the parameters obtained by the Burgers model with four parameters can better reflect the changes in the relaxation properties of three asphalt mixtures with the test temperatures.

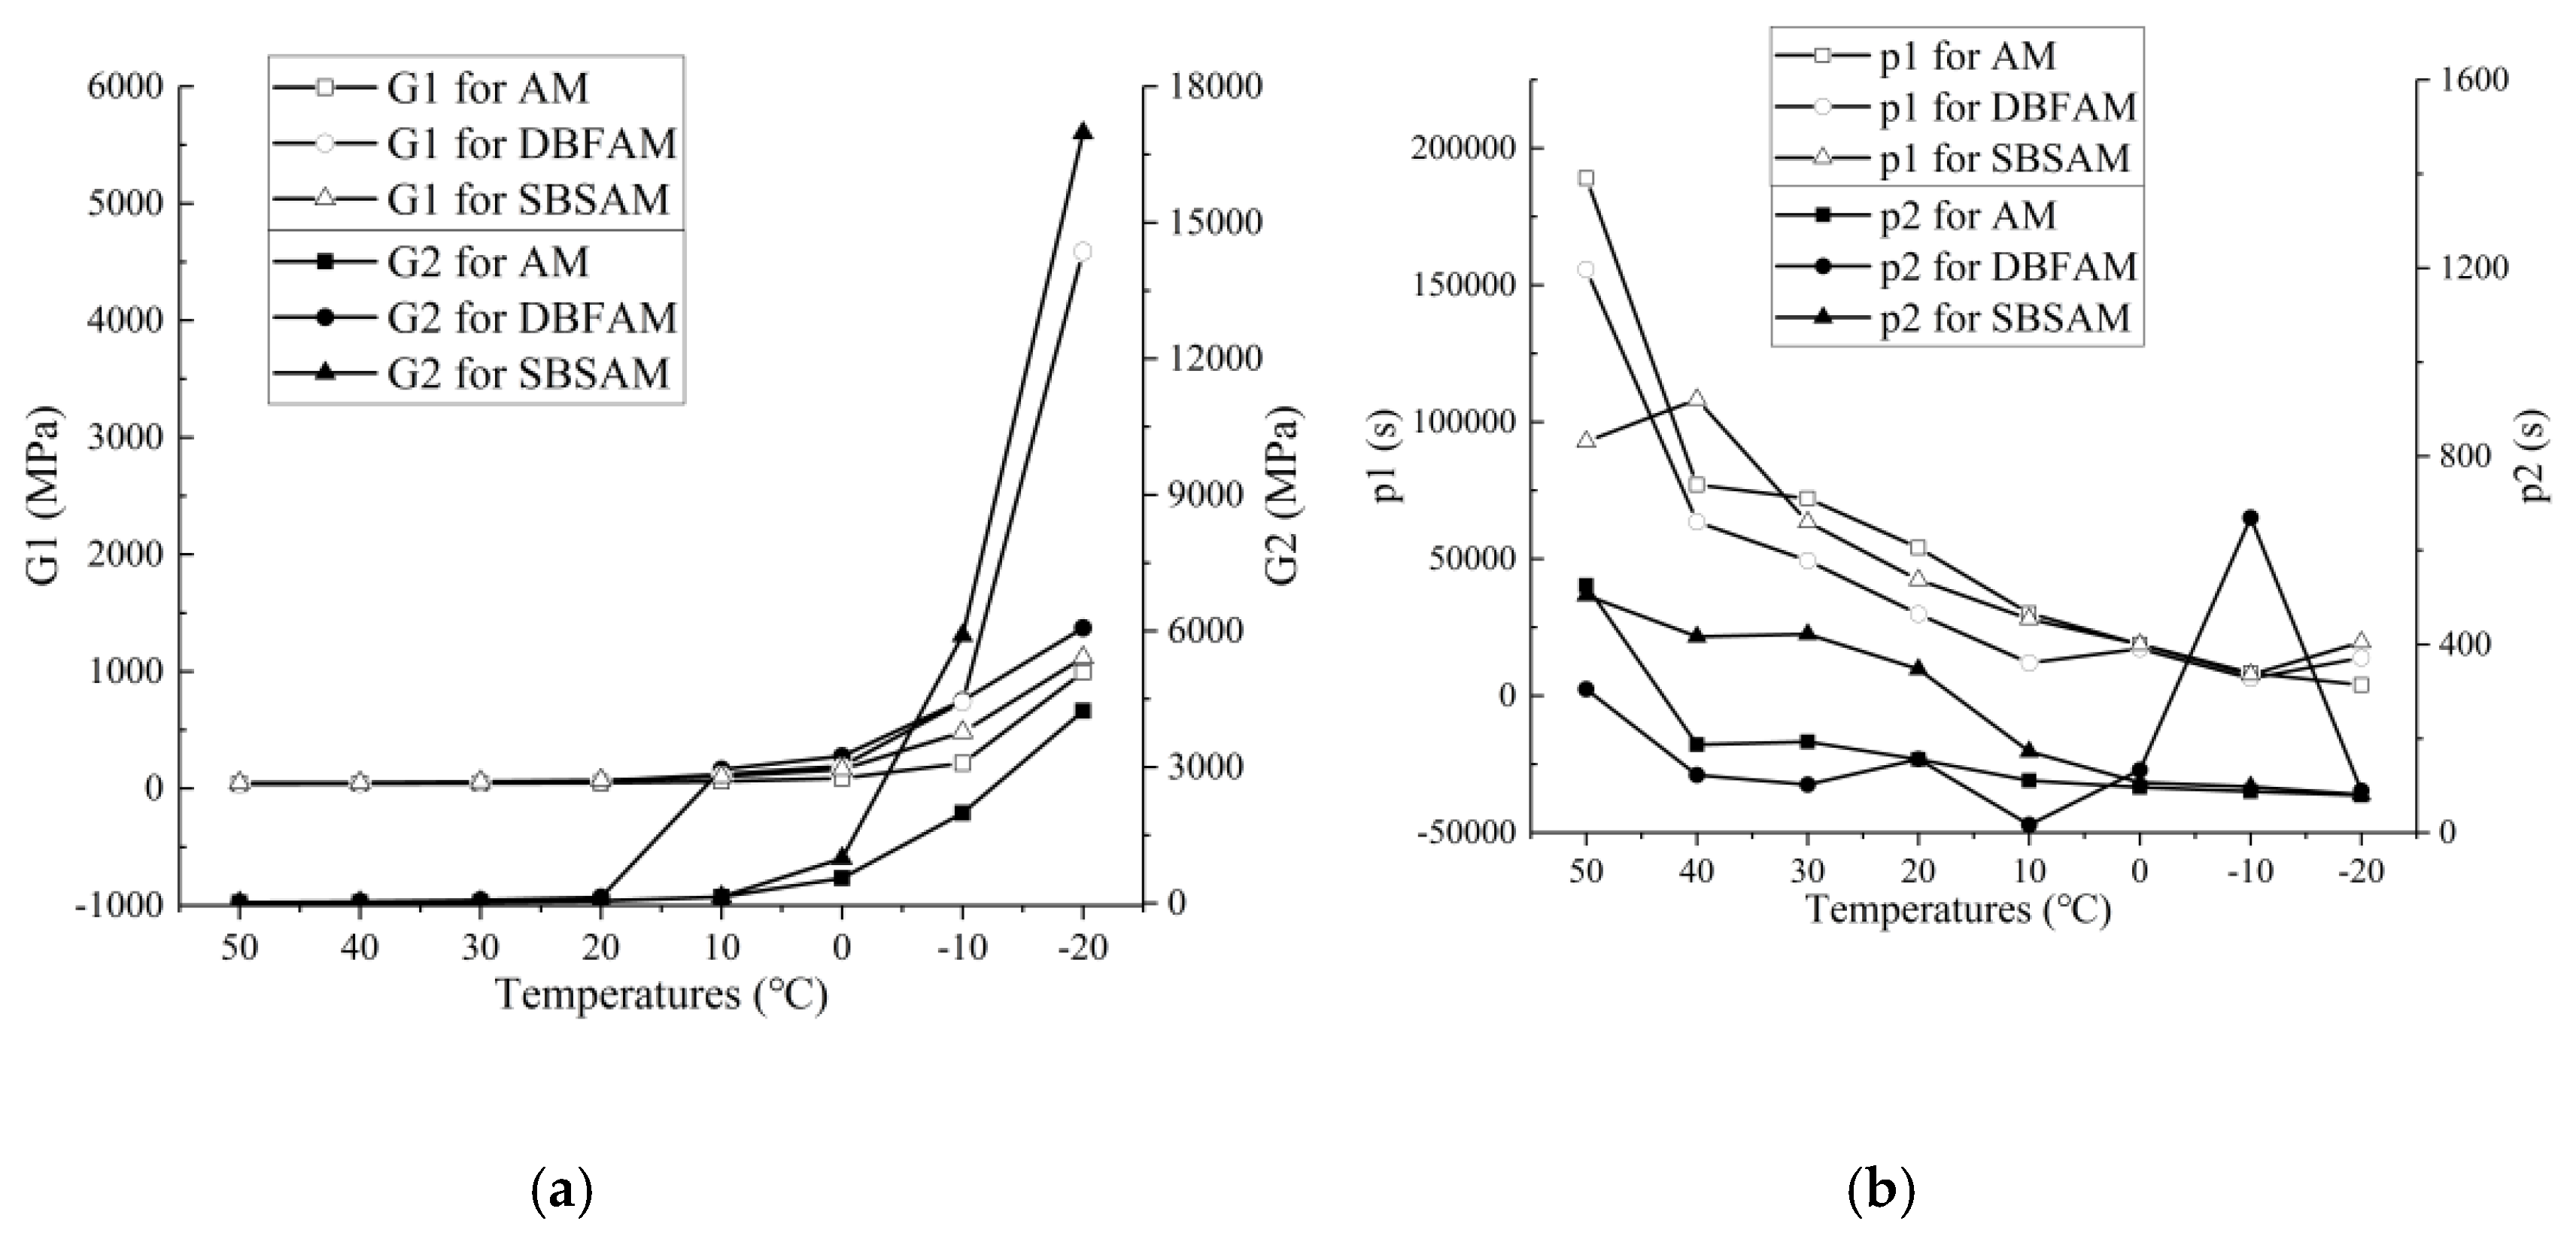
3.3.3. Analysis of Relaxation Characteristics of Three Asphalt Mixtures

Figure 7 shows the trend of the relaxation parameters of the three asphalt mixtures obtained by the Burgers model with the test temperatures. It can be seen from Figure 7 that the relaxation strength of the three asphalt mixtures increases with the decrease of the test temperature. From 50 °C to 0 °C, the relaxation strength of the asphalt mixtures increases slowly. However, from 0 °C to −20 °C, the relaxation strength of the asphalt mixtures increases rapidly. This indicates that from 50 °C to 0 °C, the properties of the asphalt mixtures change from viscosity to viscoelasticity, which has a little effect on the relaxation strength of the asphalt mixtures. However, after the temperature drops to a certain extent, the properties of the asphalt mixtures change from viscoelasticity to elasticity, which causes the relaxation strength of the asphalt mixtures to increase rapidly. Further, it can be seen from the trend of the relaxation time with the test temperature that, as the temperature decreases, the relaxation time of the asphalt mixtures is shortened. This is due to the fact that the properties of the asphalt mixtures change from viscoelasticity to elasticity, and the elasticity is continuously increased, so that the time for releasing the internal stress of the asphalt mixture is shortened.
It can also be seen from Figure 7 that the relaxation strength G1 of DBFAM is the largest, that of SBSAM is the smaller, and that of AM is the smallest. The relaxation strength G2 of SBSAM is the largest, that of DBFAM is the smaller, and that of AM is the smallest. And it can be concluded from the calculation that, as the test temperature from 50 °C to −20 °C at 10 °C decrements; compared with AM, the relaxation strength G1 of DBFAM increases by 8.95%, 10.42%, 16.79%, 32.40%, 99.00%, 94.03%, 71.14%, and 526.88%, respectively, and the relaxation strength G2 of DBFAM increases by 55.07%, 100.26%, 187.18%, 172.07%, 2072.51%, 195.27%, 143.64%, and −32.82%, respectively; compared with AM, the relaxation strength G1 of SBSAM increases by 28.42%, 23.10%, 33.06%, 48.59%, 66.96%, 79.07%, 101.92%, 142.88%, respectively, and the relaxation strength G2 of SBSAM increases by 49.83%, 22.72%, 29.48%, 8.93%, 1.55%, 34.57%, 207.23%, and 135.79%, respectively. It can be concluded that the addition of SBS and the combination of diatomite and basalt fibers can increase the relaxation strength of asphalt mixtures. however, it can be seen from the value of p1 that SBS and the combination of diatomite and basalt fibers can reduce the time of relaxation stress, which means that they can improve the performance of asphalt mixtures to release internal stress and resist temperature cracking.

4. Conclusions

In this paper, the creep performance at the low temperature of AM, DBFAM, and SBSAM was obtained by the TTEP and the Arrhenius equation in accordance with corresponding moderate temperature creep tests. The relaxation moduli of the three asphalt mixtures at the temperature between −20 °C and 50 °C (at 10 °C increments) were calculated by the convolution integral and Simpson method according to the corresponding creep compliance data. Subsequently, the effect of modifiers and temperatures on the viscoelastic properties of asphalt mixtures was analyzed by the Burgers model. Moreover, the viscoelastic parameters of the three asphalt mixtures were obtained by the generalized Kelvin model and the generalized Maxwell model. Based on the above results, the following conclusions can be achieved:
(1) The low-temperature or long-term viscoelastic index of asphalt mixture can be calculated by the high-temperature and short-term viscoelastic index using the TTEP and the Arrhenius equation. The generalized Kelvin model and the generalized Maxwell model are superior to the Burgers model in describing the variation of viscoelastic properties of asphalt mixture with time, but the conclusion is opposite in analyzing the variation with temperature.
(2) At high temperatures, the asphalt mixture tends to be viscous, its deformation under load is mainly composed of viscous deformation and instantaneous elastic deformation, its relaxation ability to stress is weak, and the relaxation time is longer. At low temperatures, the asphalt mixture tends to be elastic, and its deformation under load is mainly instantaneous elastic deformation, with strong stress relaxation ability and short stress relaxation time.
(3) The addition of diatomite and basalt fibers can significantly increase the elastic model E1 of the asphalt mixture, which greatly reduces the instantaneous elastic deformation of the asphalt mixture; the addition of the SBS modifier increases the viscosity η1 of the asphalt mixture, which is significantly improved the ability of the asphalt mixture to resist permanent deformation. In addition, SBS and compound diatomite and basalt fibers can significantly reduce the time of relaxation stress, and enhance the ability of asphalt mixtures to release internal stress, thereby significantly improve the ability of asphalt mixtures to resist temperature cracking.
(4) This research could provide some references for the engineering application of DBFAM and SBSAM in a variety of climatic conditions, and the viscoelastic parameters obtained by generalized Kelvin and generalized Maxwell can also supply the mechanical performance parameters for simulation calculation of three asphalt mixture under variable temperature conditions using finite element software.

Author Contributions

Conceptualization, Y.C. and L.L.; methodology, L.L., H.L. and Y.Z.; validation, Y.C., Y.B. and H.W.; formal analysis, H.L.; investigation, L.L.; supervision, Y.C.; writing—original draft preparation, L.L.; writing—review and editing, Y.Z., H.W., Y.B. and H.L.; project administration, Y.C.; funding acquisition, Y.C.

Funding

This research was funded by the National Natural Science Foundation of China, grant number (51678271) and the Science Technology Development Program of the Jilin Province, grant number (20160204008SF); and was supported by Graduate Innovation Fund of the Jilin University grant number (101832018C005).

Acknowledgments

We gratefully acknowledge the financial support of the above funds and the researchers of all reports cited in our paper.

Conflicts of Interest

The authors declare no conflict of interest.

References

  1. Ameri, M.; Reza Seif, M.; Abbasi, M.; Khavandi Khiavi, A. Viscoelastic fatigue resistance of asphalt binders modified with crumb rubber and styrene butadiene polymer. Pet. Sci. Technol. 2016, 35, 30–36. [Google Scholar] [CrossRef]
  2. Zhang, Y.B.; Zhu, H.Z.; Wang, G.A.; Chen, T.J. Evaluation of Low Temperature Performance for Diatomite Modified Asphalt Mixture. Adv. Mater. Res. 2011, 413, 246–251. [Google Scholar] [CrossRef]
  3. Tan, Y.Q.; Zhang, L.; Zhang, X.Y. Investigation of low-temperature properties of diatomite-modified asphalt mixtures. Constr. Build. Mater. 2012, 36, 787–795. [Google Scholar]
  4. Celauro, C.; Pratico, F.G. Asphalt mixtures modified with basalt fibres for surface courses. Constr. Build. Mater. 2018, 170, 245–253. [Google Scholar] [CrossRef]
  5. Yang, C.; Xie, J.; Zhou, X.; Liu, Q.; Pang, L. Performance Evaluation and Improving Mechanisms of Diatomite-Modified Asphalt Mixture. Materials 2018, 11, 686. [Google Scholar] [CrossRef] [PubMed]
  6. Chen, J.-S.; Liao, M.-C.; Shiah, M.-S. Asphalt Modified by Styrene-Butadiene-Styrene Triblock Copolymer: Morphology and Model. J. Mater. Civ. Eng. 2002, 14, 224–229. [Google Scholar] [CrossRef] [Green Version]
  7. Ho, S. The low temperature properties of conventional and modified asphalt binders evaluated by the failure energy and secant modulus from direct tension tests. Mater. Struct. 2004, 38, 137–143. [Google Scholar] [CrossRef]
  8. Vlachovicova, Z.; Wekumbura, C.; Stastna, J.; Zanzotto, L. Creep characteristics of asphalt modified by radial styrene–butadiene–styrene copolymer. Constr. Build. Mater. 2007, 21, 567–577. [Google Scholar] [CrossRef]
  9. Sengoz, B.; Isikyakar, G. Evaluation of the properties and microstructure of SBS and EVA polymer modified bitumen. Constr. Build. Mater. 2008, 22, 1897–1905. [Google Scholar] [CrossRef]
  10. Huang, W.; Tang, N. Characterizing SBS modified asphalt with sulfur using multiple stress creep recovery test. Constr. Build. Mater. 2015, 93, 514–521. [Google Scholar] [CrossRef]
  11. Huang, Y.; Wang, X.; Liu, Z.; Li, S. Dynamic modulus test and master curve analysis of asphalt mix with trapezoid beam method. Road Mater. Pavement Des. 2017, 18, 281–291. [Google Scholar] [CrossRef]
  12. Liu, X.; Zhang, M.; Shao, L.; Chen, Z. Effect of volcanic ash filler on thermal viscoelastic property of SBS modified asphalt mastic. Constr. Build. Mater. 2018, 190, 495–507. [Google Scholar] [CrossRef]
  13. Qin, X.; Shen, A.; Guo, Y.; Li, Z.; Lv, Z. Characterization of asphalt mastics reinforced with basalt fiber. Constr. Build. Mater. 2018, 159, 508–516. [Google Scholar] [CrossRef]
  14. Zhang, X.; Gu, X.; Lv, J.; Zhu, Z.; Zou, X. Numerical analysis of the rheological behaviors of basalt fiber reinforced asphalt mortar using ABAQUS. Constr. Build. Mater. 2017, 157, 392–401. [Google Scholar] [CrossRef]
  15. Zhang, X.; Gu, X.; Lv, J.; Zou, X. 3D numerical model to investigate the rheological properties of basalt fiber reinforced asphalt-like materials. Constr. Build. Mater. 2017, 138, 185–194. [Google Scholar] [CrossRef]
  16. Zheng, Y.; Cai, Y.; Zhang, G.; Fang, H. Fatigue property of basalt fiber-modified asphalt mixture under complicated environment. J. Wuhan Univ. Technol. 2014, 29, 996–1004. [Google Scholar] [CrossRef]
  17. Cheng, Y.; Yu, D.; Gong, Y.; Zhu, C.; Tao, J.; Wang, W. Laboratory Evaluation on Performance of Eco-Friendly Basalt Fiber and Diatomite Compound Modified Asphalt Mixture. Materials 2018, 11, 2400. [Google Scholar] [CrossRef] [PubMed]
  18. Cheng, Y.; Zhu, C.; Tan, G.; Lv, Z.; Yang, J.; Ma, J. Laboratory Study on Properties of Diatomite and Basalt Fiber Compound Modified Asphalt Mastic. Adv. Mater. Sci. Eng. 2017, 2017, 1–10. [Google Scholar] [CrossRef] [Green Version]
  19. Cheng, Y.; Li, L.; Zhou, P.; Zhang, Y.; Liu, H. Multi-objective optimization design and test of compound diatomite and basalt fiber asphalt mixture. Materials 2019, 12, 1461. [Google Scholar] [CrossRef]
  20. Davar, A.; Tanzadeh, J.; Fadaee, O. Experimental evaluation of the basalt fibers and diatomite powder compound on enhanced fatigue life and tensile strength of hot mix asphalt at low temperatures. Constr. Build. Mater. 2017, 153, 238–246. [Google Scholar] [CrossRef]
  21. Airey, G.D. Styrene butadiene styrene polymer modification of road bitumens. J. Mater. Sci. 2004, 39, 951–959. [Google Scholar] [CrossRef]
  22. Swamy, A.K.; Rongali, U.D.; Jain, P.K. Effect of HDPEH polymer on viscoelastic properties of SBS modified asphalt. Constr. Build. Mater. 2017, 136, 230–236. [Google Scholar] [CrossRef]
  23. Bai, F.; Yang, X.H.; Zeng, G.W. Stochastic Viscoelastic-Viscoplastic Response of Asphalt Mixture under Uniaxial Compression. J. Eng. Mech. 2017, 143. [Google Scholar] [CrossRef]
  24. Chen, S.Q.; Wang, D.S.; Yi, J.Y.; Feng, D.C. Implement the Laplace transform to convert viscoelastic functions of asphalt mixtures. Constr. Build. Mater. 2019, 203, 633–641. [Google Scholar] [CrossRef]
  25. Li, P.L.; Jiang, X.M.; Guo, K.; Xue, Y.; Dong, H. Analysis of viscoelastic response and creep deformation mechanism of asphalt mixture. Constr. Build. Mater. 2018, 171, 22–32. [Google Scholar] [CrossRef]
  26. Darabi, M.K.; Huang, C.-W.; Bazzaz, M.; Masad, E.A.; Little, D.N. Characterization and validation of the nonlinear viscoelastic-viscoplastic with hardening-relaxation constitutive relationship for asphalt mixtures. Constr. Build. Mater. 2019, 216, 648–660. [Google Scholar] [CrossRef]
  27. Bazzaz, M.; Darabi, M.K.; Little, D.N.; Garg, N. A Straightforward Procedure to Characterize Nonlinear Viscoelastic Response of Asphalt Concrete at High Temperatures. Transp. Res. Rec. 2018, 2672, 481–492. [Google Scholar] [CrossRef]
  28. Bazzaz, M. Experimental and Analytical Procedures to Characterize Mechanical Properties of Asphalt Concrete Materials for Airfield Pavement Applications. Ph.D. Thesis, University of Kansas, Lawrence, KS, USA, 2018. [Google Scholar]
  29. Standard Test Methods of Bitumen and Bituminous Mixtures for Highway Engineering; Research Institute of Highway Ministry of Transport: Beijing, China, 2011. (In Chinese)
  30. Baghaee Moghaddam, T.; Soltani, M.; Karim, M.R. Experimental characterization of rutting performance of Polyethylene Terephthalate modified asphalt mixtures under static and dynamic loads. Constr. Build. Mater. 2014, 65, 487–494. [Google Scholar] [CrossRef]
  31. Singh, M.; Kumar, P.; Anupam, A.K. Effect of type of aggregate on permanent deformation of bituminous concrete mixes. Road Mater. Pavement Des. 2015, 17, 417–433. [Google Scholar] [CrossRef]
  32. Pattanaik, M.L.; Choudhary, R.; Kumar, B.; Kumar, A. Mechanical properties of open graded friction course mixtures with different contents of electric arc furnace steel slag as an alternative aggregate from steel industries. Road Mater. Pavement Des. 2019, 1–25. [Google Scholar] [CrossRef]
  33. Tapkin, S.; Cevik, A.; Ozcan, S. Utilising Neural Networks and Closed Form Solutions to Determine Static Creep Behaviour and Optimal Polypropylene Amount in Bituminous Mixtures. Mater. Res. 2012, 15, 865–883. [Google Scholar] [CrossRef]
  34. Park, S.W.; Kim, Y.R. Interconversion between relaxation modulus and creep compliance for viscoelastic solids. J. Mater. Civ. Eng. 1999, 11, 76–82. [Google Scholar] [CrossRef]
  35. Schapery, R.A.; Park, S.W. Methods of interconversion between linear viscoelastic material functions. Part II—an approximate analytical method. Int. J. Solids Struct. 1999, 36, 1677–1699. [Google Scholar] [CrossRef]
  36. Sorvari, J.; Malinen, M. Numerical interconversion between linear viscoelastic material functions with regularization. Int. J. Solids Struct. 2007, 44, 1291–1303. [Google Scholar] [CrossRef] [Green Version]
  37. Lachance-Tremblay, E.; Vaillancourt, M.; Perraton, D.; Di Benedetto, H. Linear viscoelastic (LVE) properties of asphalt mixtures with different glass aggregates and hydrated lime content. Int. J. Pavement Eng. 2018, 1–10. [Google Scholar] [CrossRef]
  38. Graziani, A.; Cardone, F.; Virgili, A. Characterization of the three-dimensional linear viscoelastic behavior of asphalt concrete mixtures. Constr. Build. Mater. 2016, 105, 356–364. [Google Scholar] [CrossRef]
  39. Gergesova, M.; Zupancic, B.; Saprunov, I.; Emri, I. The closed form t-T-P shifting (CFS) algorithm. J. Rheol. 2011, 55, 1–16. [Google Scholar] [CrossRef]
  40. Luo, R.; Lv, H.J.; Liu, H.Q. Development of Prony series models based on continuous relaxation spectrums for relaxation moduli determined using creep tests. Constr. Build. Mater. 2018, 168, 758–770. [Google Scholar] [CrossRef]
  41. Ho, C.H.; Martin Linares, C.P. Representation Functions to Predict Relaxation Modulus of Asphalt Mixtures Subject to the Action of Freeze-Thaw Cycles. J. Transp. Eng. Part B Pavements 2018, 144, 04018013. [Google Scholar] [CrossRef]
  42. Hajikarimi, P.; Nejad, F.M.; Aghdam, M.M. Implementing General Power Law to Interconvert Linear Viscoelastic Functions of Modified Asphalt Binders. J. Transp. Eng. Part B Pavements 2018, 144. [Google Scholar] [CrossRef]
  43. Park, S.W.; Schapery, R. Methods of interconversion between linear viscoelastic material functions. Part I—A numerical method based on Prony series. Int. J. Solids Struct. 1998, 36, 1653–1675. [Google Scholar] [CrossRef]
  44. Mainardi, F.; Spada, G. Creep, relaxation and viscosity properties for basic fractional models in rheology. Eur. Phys. J. Spec. Top. 2011, 193, 133–160. [Google Scholar] [CrossRef] [Green Version]
  45. Zhang, X.; Gu, X.; Lv, J.; Zhu, Z.; Ni, F. Mechanism and behavior of fiber-reinforced asphalt mastic at high temperature. Int. J. Pavement Eng. 2018, 19, 407–415. [Google Scholar] [CrossRef]
  46. Sun, Y.; Gu, B.; Gao, L.; Li, L.; Guo, R.; Yue, Q.; Wang, J. Viscoelastic Mechanical Responses of HMAP under Moving Load. Materials 2018, 11, 2490. [Google Scholar] [CrossRef] [PubMed]
Figure 1. Basalt fibers: (a) Macroscopic; (b) microcosmic.
Applsci 09 04246 g001
Figure 2. Creep compliances at different temperatures: (a) asphalt mixture (AM); (b) diatomite and basalt fibers reinforced asphalt mixture (DBFAM); (c) styrene-butadiene-styrene modified asphalt mixture (SBSAM).
Applsci 09 04246 g002
Figure 3. Creep compliances at different temperatures and the fitting results of generalized Kelvin model: (a) AM; (b) DBFAM; (c) SBSAM.
Applsci 09 04246 g003
Figure 4. The variation of Burgers model parameters with temperature for the three asphalt mixtures: (a) E1 and E2; (b) η1 and η2.
Applsci 09 04246 g004
Figure 5. Proportion of viscoelastic deformation to total deformation of three asphalt mixtures: (a) AM; (b) DBFAM; (c) SBSAM.
Applsci 09 04246 g005
Figure 6. Relaxation moduli at different temperatures: (a) AM; (b) DBFAM; (c) SBSAM.
Applsci 09 04246 g006
Figure 7. The trend of the relaxation parameters of the three asphalt mixtures with the test temperatures: (a) G1 and G2; (b) p1 and p2.
Applsci 09 04246 g007
Table 1. Physical properties of asphalt.
PropertiesA-90# AsphaltSBS Modified Asphalt
StandardValueStandardValue
Density (15 °C, g/cm3)1.0161.013
Penetration (25 °C, 0.1 mm)80–10091.660-8065.1
Softening point TR&B (°C)≥4546.9≥5561.0
Ductility (cm)≥100 (25 °C)>150≥30 (5 °C)68.5 (5 °C)
Elastic recovery≥6588
After TFOT
Mass loss (%)≤±0.80.38≤±1.00.22
Residual penetration ratio (25 °C, %)≥5773.3≥6066.9
Ductility (cm)≥20 (15 °C)>120 (15 °C)≥20 (5 °C)33.2 (5 °C)
Table 2. Properties of basalt fibers.
PropertiesDiameter (μm)Length (mm)Water Content (%)Combustible Content (%)Tensile Strength (MPa)Tensile Modulus of Elasticity (GPa)Elongation at Break (%)
Value10–1360.0300.56232086.32.84
Table 3. Diatomite chemical composition.
Chemical CompositionSiO2Al2O3Fe2O3CaOMgOTiO2K2O
Proportion (%)85.604.501.500.520.450.300.67
Table 4. Aggregate gradation of AC-13.
Sieve Size (mm)0.0750.150.30.61.182.364.759.513.216
Percent passing (%)61013.51926.5375376.595100
Table 5. The shift factors at 50 °C reference temperature.
Comparison Temperature log αT Based on Tests log αT Based on Arrhenius Equation
40 °C30 °C20 °C10°C0 °C−10 °C−20 °C
AM0.48160.99811.58652.36743.19274.08095.0393
DBFAM0.50761.04511.89722.81683.76834.82945.9744
SBSAM0.72081.50782.33633.32184.33935.47416.6984
Table 6. The fitting results of the shift factors.
TypesAE (kJ)R2Equation
AM0.3768122.220.99963αT = 0.3768 × exp[14701 × (1/T-1/323.15)]
DBFAM0.2804146.010.99999αT = 0.2804 × exp[17562 × (1/T-1/323.15)]
SBSAM0.5238156.140.99998αT = 0.5238 × exp[18781 × (1/T-1/323.15)]
Table 7. The fitting parameters of the creep compliance based on the Burgers model.
MixturesParametersTemperatures (°C)
50403020100−10−20
AME1 (MPa)94.0687.51100.74130.1190.4199.6206.9208.03
η1 (MPa∙s)4.86 × 1051.57 × 1064.13 × 1061.36 × 1071.25 × 1084.84 × 1083.65 × 1093.39 × 1010
E2 (MPa)85.5486.6780.0071.4461.0162.3862.3461.74
η2 (MPa∙s)10574817913120599782244677053.36 × 1063.15 × 107
R20.92580.93680.93730.94780.94610.95250.95230.9525
DBFAME1 (MPa)108.05122.78152.40236.29397.67403.2420.3628.2
η1 (MPa∙s)5.45 × 1051.72 × 1064.74 × 1062.86 × 1072.06 × 1081.97 × 1092.42 × 10103.26 × 1011
E2 (MPa)86.2877.7874.3466.8062.9862.7562.162.2
η2 (MPa∙s)2390669615909698883.59 × 1053.52 × 1063.85 × 1075.56 × 108
R20.94910.96110.96310.95840.95590.95580.95560.9556
SBSAME1 (MPa)76.0797.42106.15128.16211.65220.1226.03236.4
η1 (MPa∙s)1.10 × 1063.53 × 1061.88 × 1071.10 × 1088.03 × 1088.92 × 1091.28 × 10111.95 × 1012
E2 (MPa)153.38121.73116.50103.2687.0985.9583.8582.34
η2 (MPa∙s)89201.16 × 1044.78 × 1041.68 × 1053.70 × 1053.86 × 1065.57 × 1077.63 × 108
R20.96600.92300.92830.92600.90920.90900.90900.9082
Table 8. The fitting parameters of the relaxation properties based on the Burgers model.
MixturesParametersTemperatures (°C)
50403020100−10−20
AMG1 (MPa)36.4239.9242.7747.7160.2088.64213.49992.58
G2 (MPa)8.7715.6722.9347.04135.74548.711983.54237.65
p1 (s)189,00777,01772,06854,02130,07618,81583413944.85
p2 (s)525.18186.99193.19155.59110.6396.4087.2779.24
R20.95680.96540.95200.94750.92400.84490.94190.9674
DBFAMG1 (MPa)39.6844.0849.9563.17119.80190.40740.974587.87
G2 (MPa)13.6031.3865.85127.982949.03241.654464.56063.54
p1 (s)155,70963,49149,40429,79211,95917,147626113,846.4
p2 (s)304.60122.31101.92156.1916.55132.99669.1688.95
R20.93610.97230.96210.93020.93190.99980.99230.9984
SBSAMG1 (MPa)46.1649.1456.9170.89100.51162.02481.071117.40
G2 (MPa)10.1919.2329.6951.24137.85986.015900.216,974.5
p1 (s)92,778108,25463,39242,33228,05118,742768719,530
p2 (s)504.40416.27421.64347.35172.40106.4397.5180.74
R20.96050.94960.94630.94820.95250.90230.94720.9815
Table 9. The fitting parameters of AM based on the generalized Maxwell model.
ParametersTemperatures (°C)
50403020100−10−20
Ee (MPa)34.72911.16325.57515.16840.86856.2663.089182.22
E1 (MPa)5137.16943.51,010,5003563.967,882.55193.334489.88157116
E2 (MPa)2176.25963.7855.843560.91527.01438.71530.72809.2
E3 (MPa)33.01453.61328.533560.71487.11423.61354.82807.9
E4 (MPa)11.2523.6133.3358.69206.011397.31345.52807.9
E5 (MPa)6.138.4513.6926.5054.71126.31121.41493.1
E6 (MPa)4.964.435.328.5322.7154.6582.31919.85
E7 (MPa)0.0204.435.315.411.080.54453.460.0533
E8 (MPa)0.0134.434.1674.9741.0440.54451.520.0469
E9 (MPa)0.0134.422.2354.7631.0370.5442.910.0447
E10 (MPa)0.0104.421.0004.7291.0280.3342.4370.0436
E11 (MPa)0.0104.420.9994.6561.0140.2980.5370.0419
E12 (MPa)0.0104.420.9533.5640.9890.2790.2470.0397
R20.99920.99660.99550.99520.99010.99580.99710.9854
Table 10. The fitting parameters of DBFAM based on the generalized Maxwell model.
ParametersTemperatures (°C)
50403020100−10−20
Ee (MPa)23.2717.7618.770.876.4526.7289.200.0973
E1 (MPa)712,35732,995.257,986.4175.713,056.414,422.03977.7938,069.22
E2 (MPa)531,62532,995.2138,731.11175.6510,995.882304.553977.793977.78
E3 (MPa)509.5155.1995.80175.6410,898.082304.552766.723977.69
E4 (MPa)17.5446.0995.80174.822118.322304.552766.603977.69
E5 (MPa)10.9314.1327.0873.0866.702304.552766.601822.42
E6 (MPa)3.085.317.4520.8866.3328.682591.781822.42
E7 (MPa)3.085.317.4411.2814.7828.680.01521822.42
E8 (MPa)3.065.317.1211.2714.6828.680.01511510.65
E9 (MPa)2.894.844.7611.0414.6028.250.01000.0120
E10 (MPa)2.832.623.598.4014.549.200.01000.0108
E11 (MPa)2.622.602.868.372.919.140.01000.0103
E12 (MPa)0.992.590.961.212.578.090.01000.0101
R20.98720.98570.98960.98640.97330.98230.97120.9525
Table 11. The fitting parameters of SBSAM based on the generalized Maxwell model.
ParametersTemperatures (°C)
50403020100−10−20
Ee (MPa)12.7629.2735.3222.501.4084.9915.740.0123
E1 (MPa)950.057617.25588.954469.536536.746702.773729.311,273.09
E2 (MPa)22.69215.31457.14421.284720.36584.83729.11,253.15
E3 (MPa)19.0555.51366.38308.55172.352383.23689.2511,252.86
E4 (MPa)18.3626.4253.2886.34152.632088.363689.2511,252.86
E5 (MPa)7.9514.9918.9433.2882.24337.613689.256374.06
E6 (MPa)5.267.6015.5423.2434.0093.05139.58422.99
E7 (MPa)5.263.542.857.0216.074.11139.54422.99
E8 (MPa)5.263.542.706.6214.843.9731.43422.83
E9 (MPa)5.263.542.596.4013.033.9631.340.0118
E10 (MPa)5.263.512.546.2312.413.9323.340.0105
E11 (MPa)5.262.672.536.2112.253.935.770.0100
E12 (MPa)4.920.672.536.2112.133.924.630.0100
R20.99750.99610.99830.99780.99070.98530.99120.9640

