Article

Stressing State Analysis of CFST Arch Supports in Deep Roadway Based on NSF Method

1
City College, Wuhan University of Science and Technology, Wuhan 430081, China
2
Key Lab of Structures Dynamic Behavior and Control of the Ministry of Education, Harbin Institute of Technology, Harbin 150090, China
3
Key Lab of Smart Prevention and Mitigation of Civil Engineering Disasters of the Ministry of Industry and Information Technology, Harbin Institute of Technology, Harbin 150090, China
4
School of Transportation Science and Engineering, Harbin Institute of Technology, Harbin 150090, China
*
Author to whom correspondence should be addressed.
These authors equally contributed to this manuscript as co-first author.
Appl. Sci. 2019, 9(20), 4238; https://doi.org/10.3390/app9204238
Submission received: 17 September 2019 / Revised: 3 October 2019 / Accepted: 4 October 2019 / Published: 10 October 2019

Abstract

:
This paper experimentally analyzes the working behavior characteristics of five concrete-filled steel tube (CFST) arch supports in deep roadway based on the numerical shape function (NSF) method and structural stressing state theory. First, the measured strain data are expanded by the NSF method and modeled as generalized strain energy density (GSED) to characterize the stressing state of the supports. Then, one of the supports is taken as an example and the Mann-Kendall (M-K) criterion is adopted to detect the mutation characteristics of the support, which derives the new definition of structural failure load. Correspondingly, the stressing state modes as well as strain and stress fields for the support are proposed to verify their mutation characteristics. Finally, the common and different characteristics of stressing state, damage development and internal forces for different supports are also summarized. The analytical results of the supports explore a new analysis method for underground structures and the unseen knowledge provides a reference to more rational future design.

1. Introduction

With the depletion of shallow coal resources, the mining of coal resources gradually turns to the deep, and the depth of many mines even reaches more than 1000 m, which brings about serious influence of high ground stress, nonlinear rock mechanics behavior, complex geological conditions, etc. [1,2,3]. However, due to deficient control capability of rock mass stability, low ultimate bearing capability, etc., conventional support methods, such as rock bolting, U-steel support, reinforced concrete arc and so on, would not be suitable for withstanding the complicated high stress field environment [4,5,6].
Nowadays, the concrete-filled steel tube (CFST) are gaining more and more popularity in industrial factory building and bridge construction because of its high bearing capacity, light self-weight and convenient construction [7,8]. As for CFST structures, the steel tube can provide the confinement of internal concrete resulting in the significant increase of compressive performance and ductility, meanwhile the internal concrete can improve the local buckling of the steel tube as well [9,10,11]. Hence, these advantages prompt CFST supports as a new support technology to apply in deep mine roadways. However, the load mode and stressing state of CSFT supports are different from those of the common CFST structures in ground, so it is necessary for researchers to further study the structural working behavior characteristics of CFST supports under the radical uniformly distributed load, in order to provide a theoretical basis for engineering practice [12,13,14].
As early as around 2000, the CFST supports were industrial tested and researched to verify the feasibility of the technology, and then the supports were successfully applied to the China’s Qianjiaying coal mine in 2009 [15,16]. Since then, the practical engineering cases and researches based on the CFST supports became more and more, which confirmed the control ability of the to the supports surrounding rocks [17,18]. For example, Qu et al. tested axial compressive strength, lateral flexural performance and hardening rate of core concrete of the CFST supports in soft rock roadway and then built the compressive strength-maturity relationship through limit equilibrium method, fixed-end arch theory and the results of laboratory tests [19]. Chang et al. presented the numerical study on the mechanical performance of CFST supports and proposed an interface based model with friction coefficient of 0.4. The results showed that higher concrete strength and steel ratio could bring about higher mechanical performances [20]. Zhang et al. carried out full-size mechanical tests of CFST arch supports by using a number of hydraulic cylinders along the arch profile to simulate the surrounding rock pressure. The finding determined the failure mode as elastic-plastic instability with an extreme point and the reliable and an accurate theoretical calculation method was also proposed [21]. Huang et al. developed an innovative CFST support for a 1000 m-deep roadway in a high situ stress field verified the outstanding advantages of CFST supports in terms of a higher bearing capacity and structural stability through laboratory tests and long-term deformation observation [22]. Zhang et al. compared the mechanical performances of U-steel support and CFST support through theoretical calculation and numerical simulation and discovered that the CFST support could provide greater supporting force to the roof-floor and two sides of roadway [23,24]. In general, the existing researches can greatly promote the application of CFST supports indeed, while three problems in the working behavior of them have been puzzling researchers and limiting their development to some extent:
  • As a new support in deep mine roadway, many an experiment of CFST supports is still required to investigate its working behavior and failure mechanism, while the high experimental cost results in insufficient experimental data. Hence, it is significant for researchers to apply an innovative and effective method to a limited experimental data, so that the hidden knowledge in working behavior of the supports could be revealed;
  • The division of stressing state stages for CFST supports, which mainly determined by load-displacement curves in experiments or simulations, is not clear enough and has some randomness to an extent, enhancing the difficulty of further analysis and even leading to incorrect analysis results. Besides, the semi-empirical and semi-theoretical methods are usually adopted to predict the ultimate bearing capacity of supports, which result in considerable material cost and even irrational structural design;
  • The finite element simulation of CFST supports inevitable adopts experiential simplification, assumption, etc., so the simulation results of structural responses usually deviate from the test ones in different degrees in particular for the local simulation results. It is difficult to reveal the true changing characteristics of damage, internal forces and others for overall or local supports through simulation.
In consideration of the three problems above, this paper introduces the numerical shape function (NSF) method to interpolate the limited experimental data, so that the more information about structural responses could be achieved. Then, applying the structural stressing state theory to the expanded strain data, the generalized strain energy density (GSED) is adopted as a characteristic parameter to investigate the stressing state characteristics of CFST arch supports. Stress analysis is a primary task for civil, mechanical and aerospace engineers involved in the design of structures [25,26]. Hence, authors adopt the Mann-Kendall (M-K) criteria for Ej-Fj curve, and the four stressing state stages of the supports are distinguished by three characteristic loads (including updated failure load), which is verified through stressing state mode, etc. Besides, the common and different changing characteristics of stressing state for different supports are also revealed. The unseen knowledge achieved in this study could provide a new angle of view to conduct structural analysis of CFST supports and a reference to the design improvement.

2. Method and Theories of Structural Stressing State

2.1. Method of Numerical Shape Function

In the structure analysis, the experimental data could reflect the working behavior characteristics of the global/local structure to some extent indeed, while due to the limitation of measuring instruments, etc., it is not enough to fully demonstrate the structural response mechanism and characteristics. Hence, a numerical shape function (NSF) interpolation method, which has exact physical significance, is proposed to interpolate/expand the limited experimental data in order to obtain more information of the structure. The NSF method applies generalized numerical simulation of a specific ideal physical model to construct discrete weighting function based on the concept of shape function in the finite element method (FEM), so it could not only overcome the shortcoming of conventional shape functions but also meet the accuracy requirements for in-depth experimental analysis [27,28].
In order to vividly introduce this method, the deflection field of a circle section with four measuring points is used as an example. As shown in Figure 1a, the section is constructed and properly meshed with element Shell 181 by ANSYS, and 4 measuring points are adopted as the basic nodes of the numerical shape functions. Then, a unit displacement at measuring point i along the z-axis are applied to the section, while the other ones are fixed and restricted without rigid z-directional displacements. Hence, the numerical shape function Ni of the ith measuring point can be obtained, such as N1 and N2 shown in Figure 1b,c. Without considering large deformation or elastoplasticity, the displacement field constructed by Castigliano’s theorem is independent of loading paths, and the simulative results with explicit physical meanings can be superimposed linearly. Therefore, according to the deflection of the measured points, the deflection field is obtained by Equation (2),
D = i = 1 m u i N i ,   N i = N i ( x 1 ) ,   N i ( x 2 ) N i ( x j ) N i ( x n )
where D is the deflection field of the section, Ni is the numerical shape functions of ith measuring point, Ni(xj) is the function value at element node xj, n is the total number of element nodes, and m is the total number of measured points, here m = 4.
Correspondingly, the limited measuring strain on the cross section could be expanded by the shape function interpolation to obtain the strain filed, and the stress filed could be gained through the constitutive relation of the material. Hence, the contour maps of various fields for structure responses could be depicted through the expanded experimental data above, as well as the internal forces distribution of the arches.

2.2. Structural Stressing State Concept

The structural stressing state is the modes how the components/units or their combinations (including the whole structure) in a structure internally and externally behave under a certain loading case defined by Zhou et al. [29,30,31]. Structural stressing state is generally for the whole structure and component stressing state for individual structural components, local parts, and internal forces. Structural stressing state mode can be expressed by the matrix or the vector consisting of structural response data such as strain, stress, strain energy, displacement, internal force, strain and stress fields and so on.
Structural stressing state will change/evolve with the load increase and exhibit different characteristics at some special load levels in accordance with the natural law from quantitative change to qualitative change of a system [32]. The mutation characteristics of structural stressing state reveal the inherent and essential property of structures, so when the load reaches a certain value, the structural stressing state certainly will present a qualitative mutation (shape change or magnitude change of stressing state mode). The authors define the load corresponding to the qualitative mutation of structural stressing state as updated failure load, namely the starting point of structural failure, leading to the update of the existing analytical theories and analytical methods as well as the more rational design codes.

2.3. Numerical Description of Structural Stressing State

In order to construct the numerical mode (vector or matrix) of structural stressing state and the parameter characterizing it, generalize strain energy density (GSED) as a scalar is adopted to describe the stressing state of a point (node) [33]. Due to the differences of response data, which have the elastic and plastic ones, the formula for calculating the GSED of the ith element at the jth load step can be expressed by
E i j = 0 ε i j σ i j d ε
where Eij is the GSED value of the ith element at the jth load step; σii is the normal stress of the ith element at the jth load step; εij is the normal strain of ith element at the jth load step. The strain and stress of every node on every section have be obtained through the NSF method, hence the GSED values of a section can be accumulated by
E j = i = 1 N E i j A i
where Ej is the GSED value of the measured section at the jth load step; N is the number of elements; Ai is the area of the ith element. As a scalar, the GSED value of a component/unit is easy to be integrated to characterize the component/unit behavior of the structure. Therefore, the sum of the GSED values of all measuring sections of a structure is adopted to appropriately characterize the structural stressing state of the whole structure. In order to exclude the influence of units and other factors, the GSED sum value is normalized through
E j , norm = i = 1 N E i j E M
where Ej,norm is the sum of the normalized GSED values of all the measured points to the jth load. EM is the maximum strain energy value over the loading process. Then, the Ej,norm-Fj curve of the whole structure can be plotted to investigate its stressing state characteristics vividly.

2.4. Mann-Kendall Criterion

The Mann-Kendall (M-K) method is a generally used trend analysis tool customarily without necessity for samples to conform with certain distributions or interference of a few outliners, and the stressing state mutation of the structure can be distinguished through the Ej,norm-Fj curve [34,35,36]. It is assumed that the sequence of {Ej,norm (i)} (the ith load step, i is 1, 2, …, n) is statistically independent, and a new stochastic variable bk at the kth load step is defined as
b k = i k h i 2 k n
h i = + 1 , 0 E j , norm i > E j , norm j otherwise 1 j i
where hi is the cumulative number of the samples; “+1” means adding one more to the existing value if the inequality on the right side is satisfied for the jth comparison. The mean value E(bk) and variance HK(bk) of bk are calculated by
E b k = k k 1 / 4   2 k n
H K d k = k k 1 2 k + 5 / 72 2 k n
Then, a new statistic BPk is defined by
B P k = 0 k = 1 b k E b k H K b k 2 k n
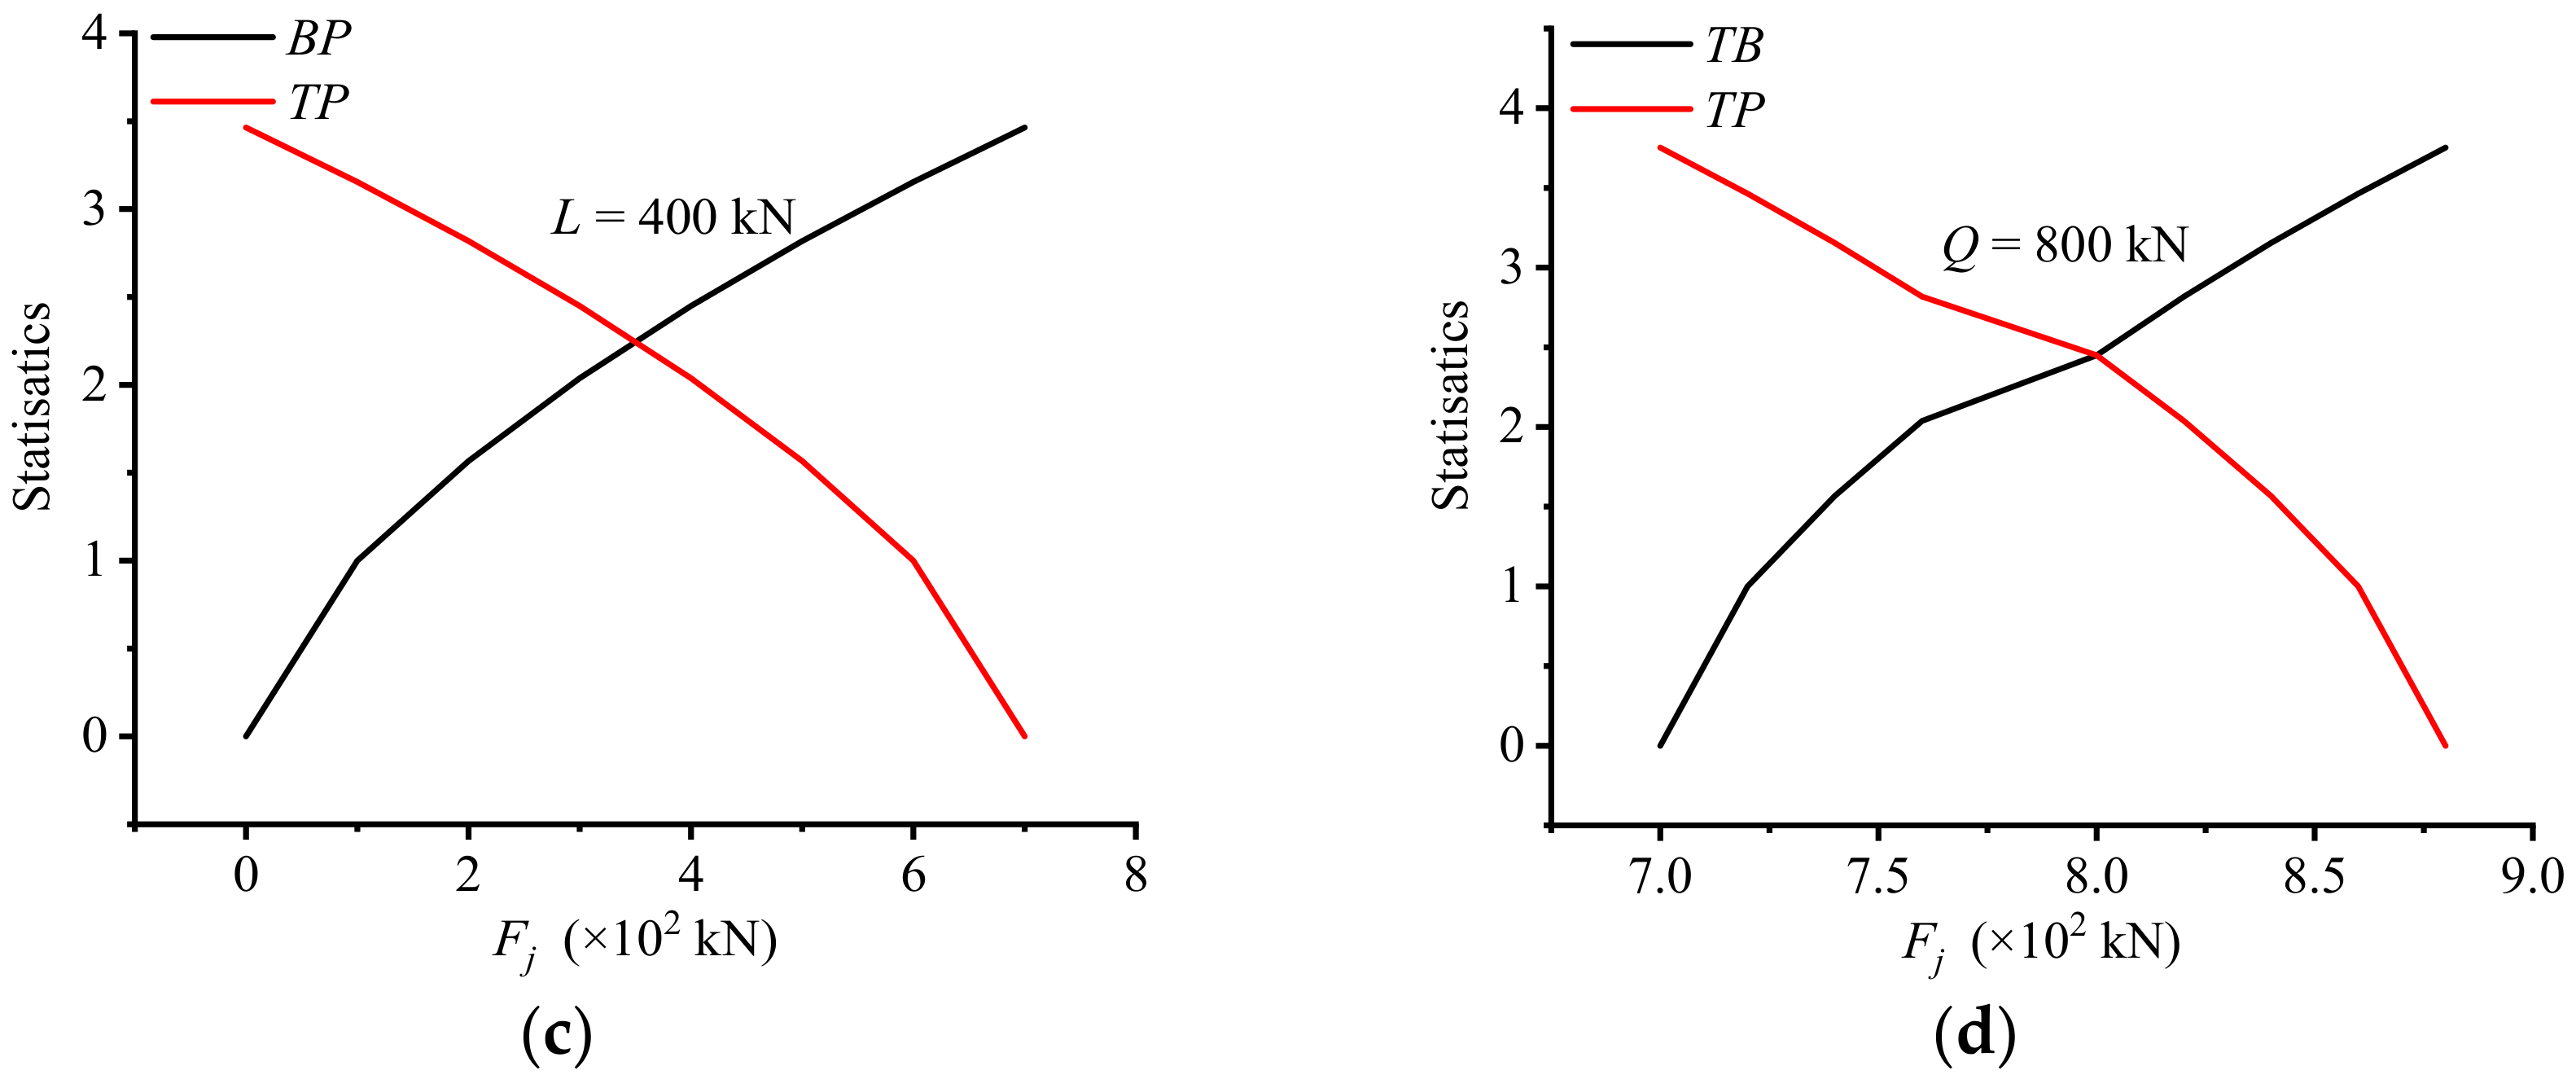
Accordingly, the BPk-Fj curve can be plotted. The proceeding of the inverse {Ej,norm (i)} sequence is consistent with before, which can form the TPk-Fj curve. Hence, the mutation point of the Ej,norm-Fj curve will be determined by the intersection of BPk and TPk curves, so that M–K criterion is taken for distinguishing the structural stressing state mutation.

3. Experiment of CFST Arch Supports

3.1. Configuration of the CFST Arch Supports

Five CFST arch supports were designed and tested by He in China University of Mining & Technology (Beijing) [37]. Corresponding to the centerline of the supports, the curvature radius, span arches central angle and rise-span ratio keep the same, respectively 2000 mm, 2828 mm, 90° (π/2 rad) and 0.207. According to the difference of steel tube diameter and wall thickness, the sections of the five supports are respectively made into 140 mm × 5 mm, 140 mm × 6 mm, 140 mm × 10 mm, 127 mm × 6 mm and 152 mm × 6 mm and named support-A to support-E. The yield strength and elastic modulus of steel tube are 245 MPa and 206 GPa, and the cubic compressive strength of concrete is 48.58 MPa.

3.2. Measuring Point Arrangement

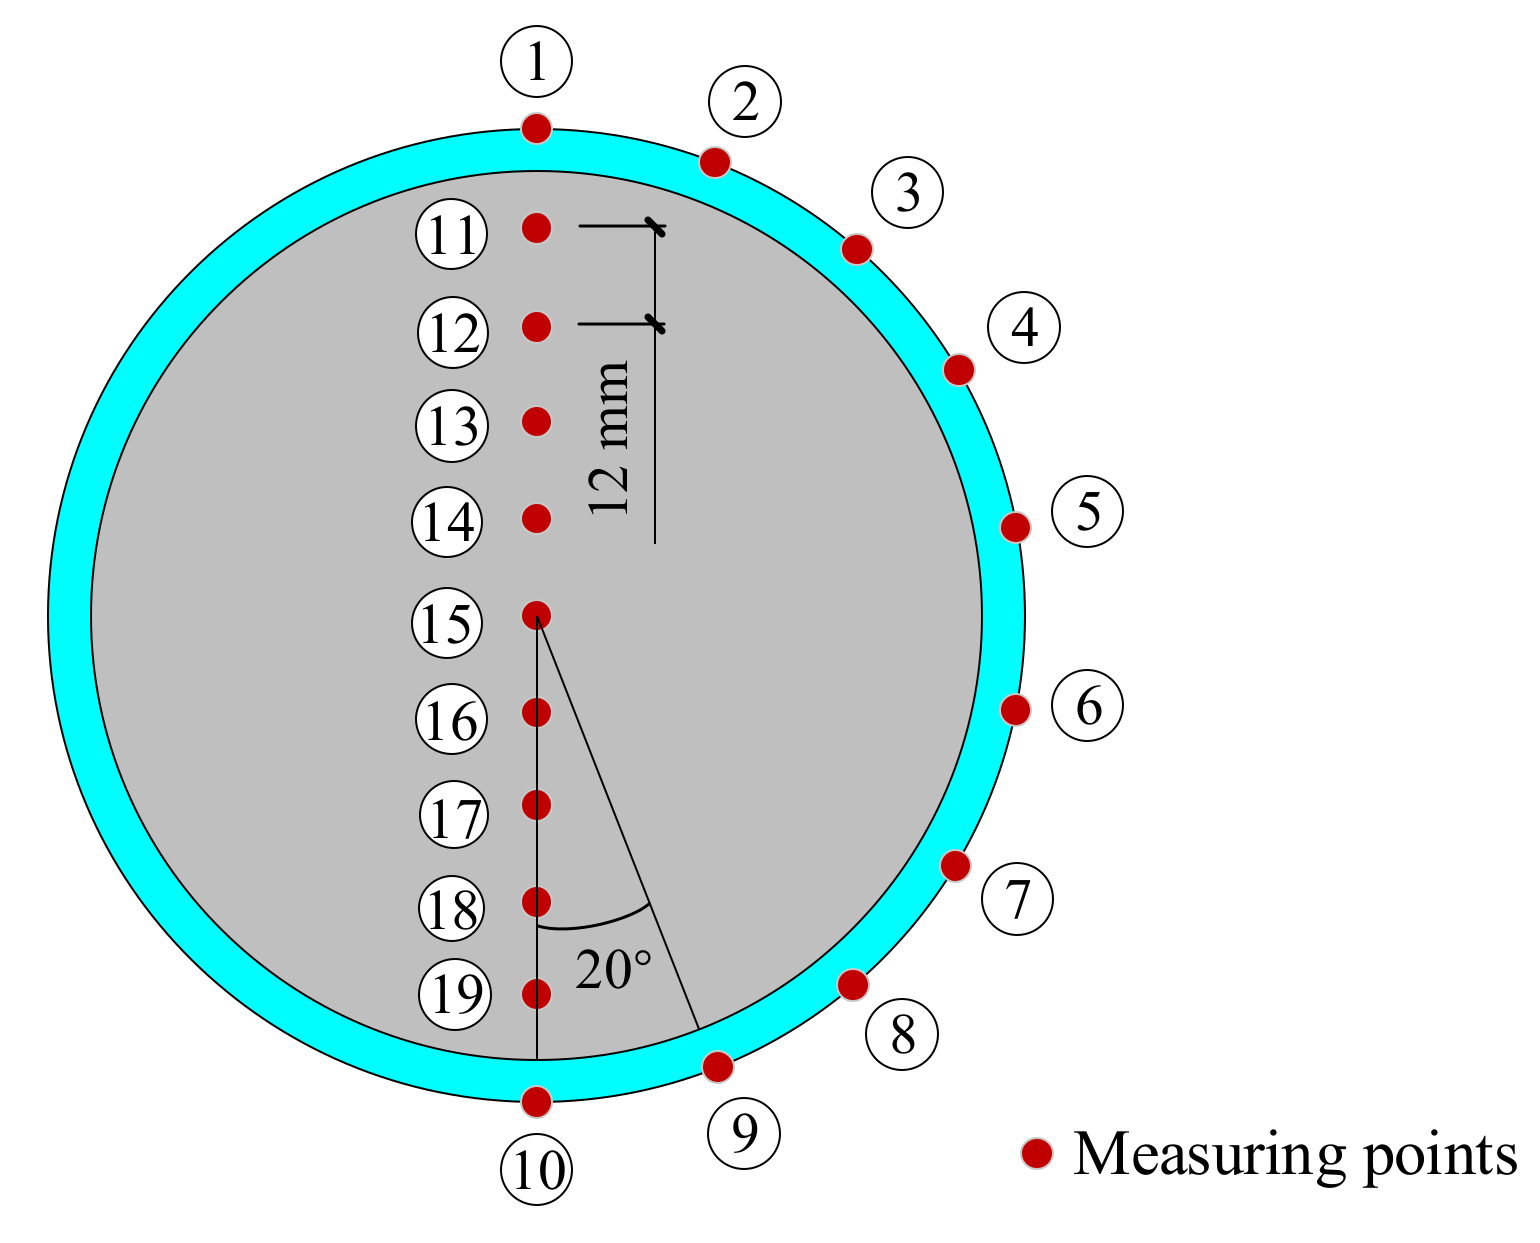
On the mid-span cross sections (arch vault sections) of the five CFST arch supports, ten strain gauges are arranged on the surface of steel tube at equal central angle and nine ones embedded in core concrete at 12 mm interval along the height of the cross section shown in Figure 2.

3.3. Loading Scheme

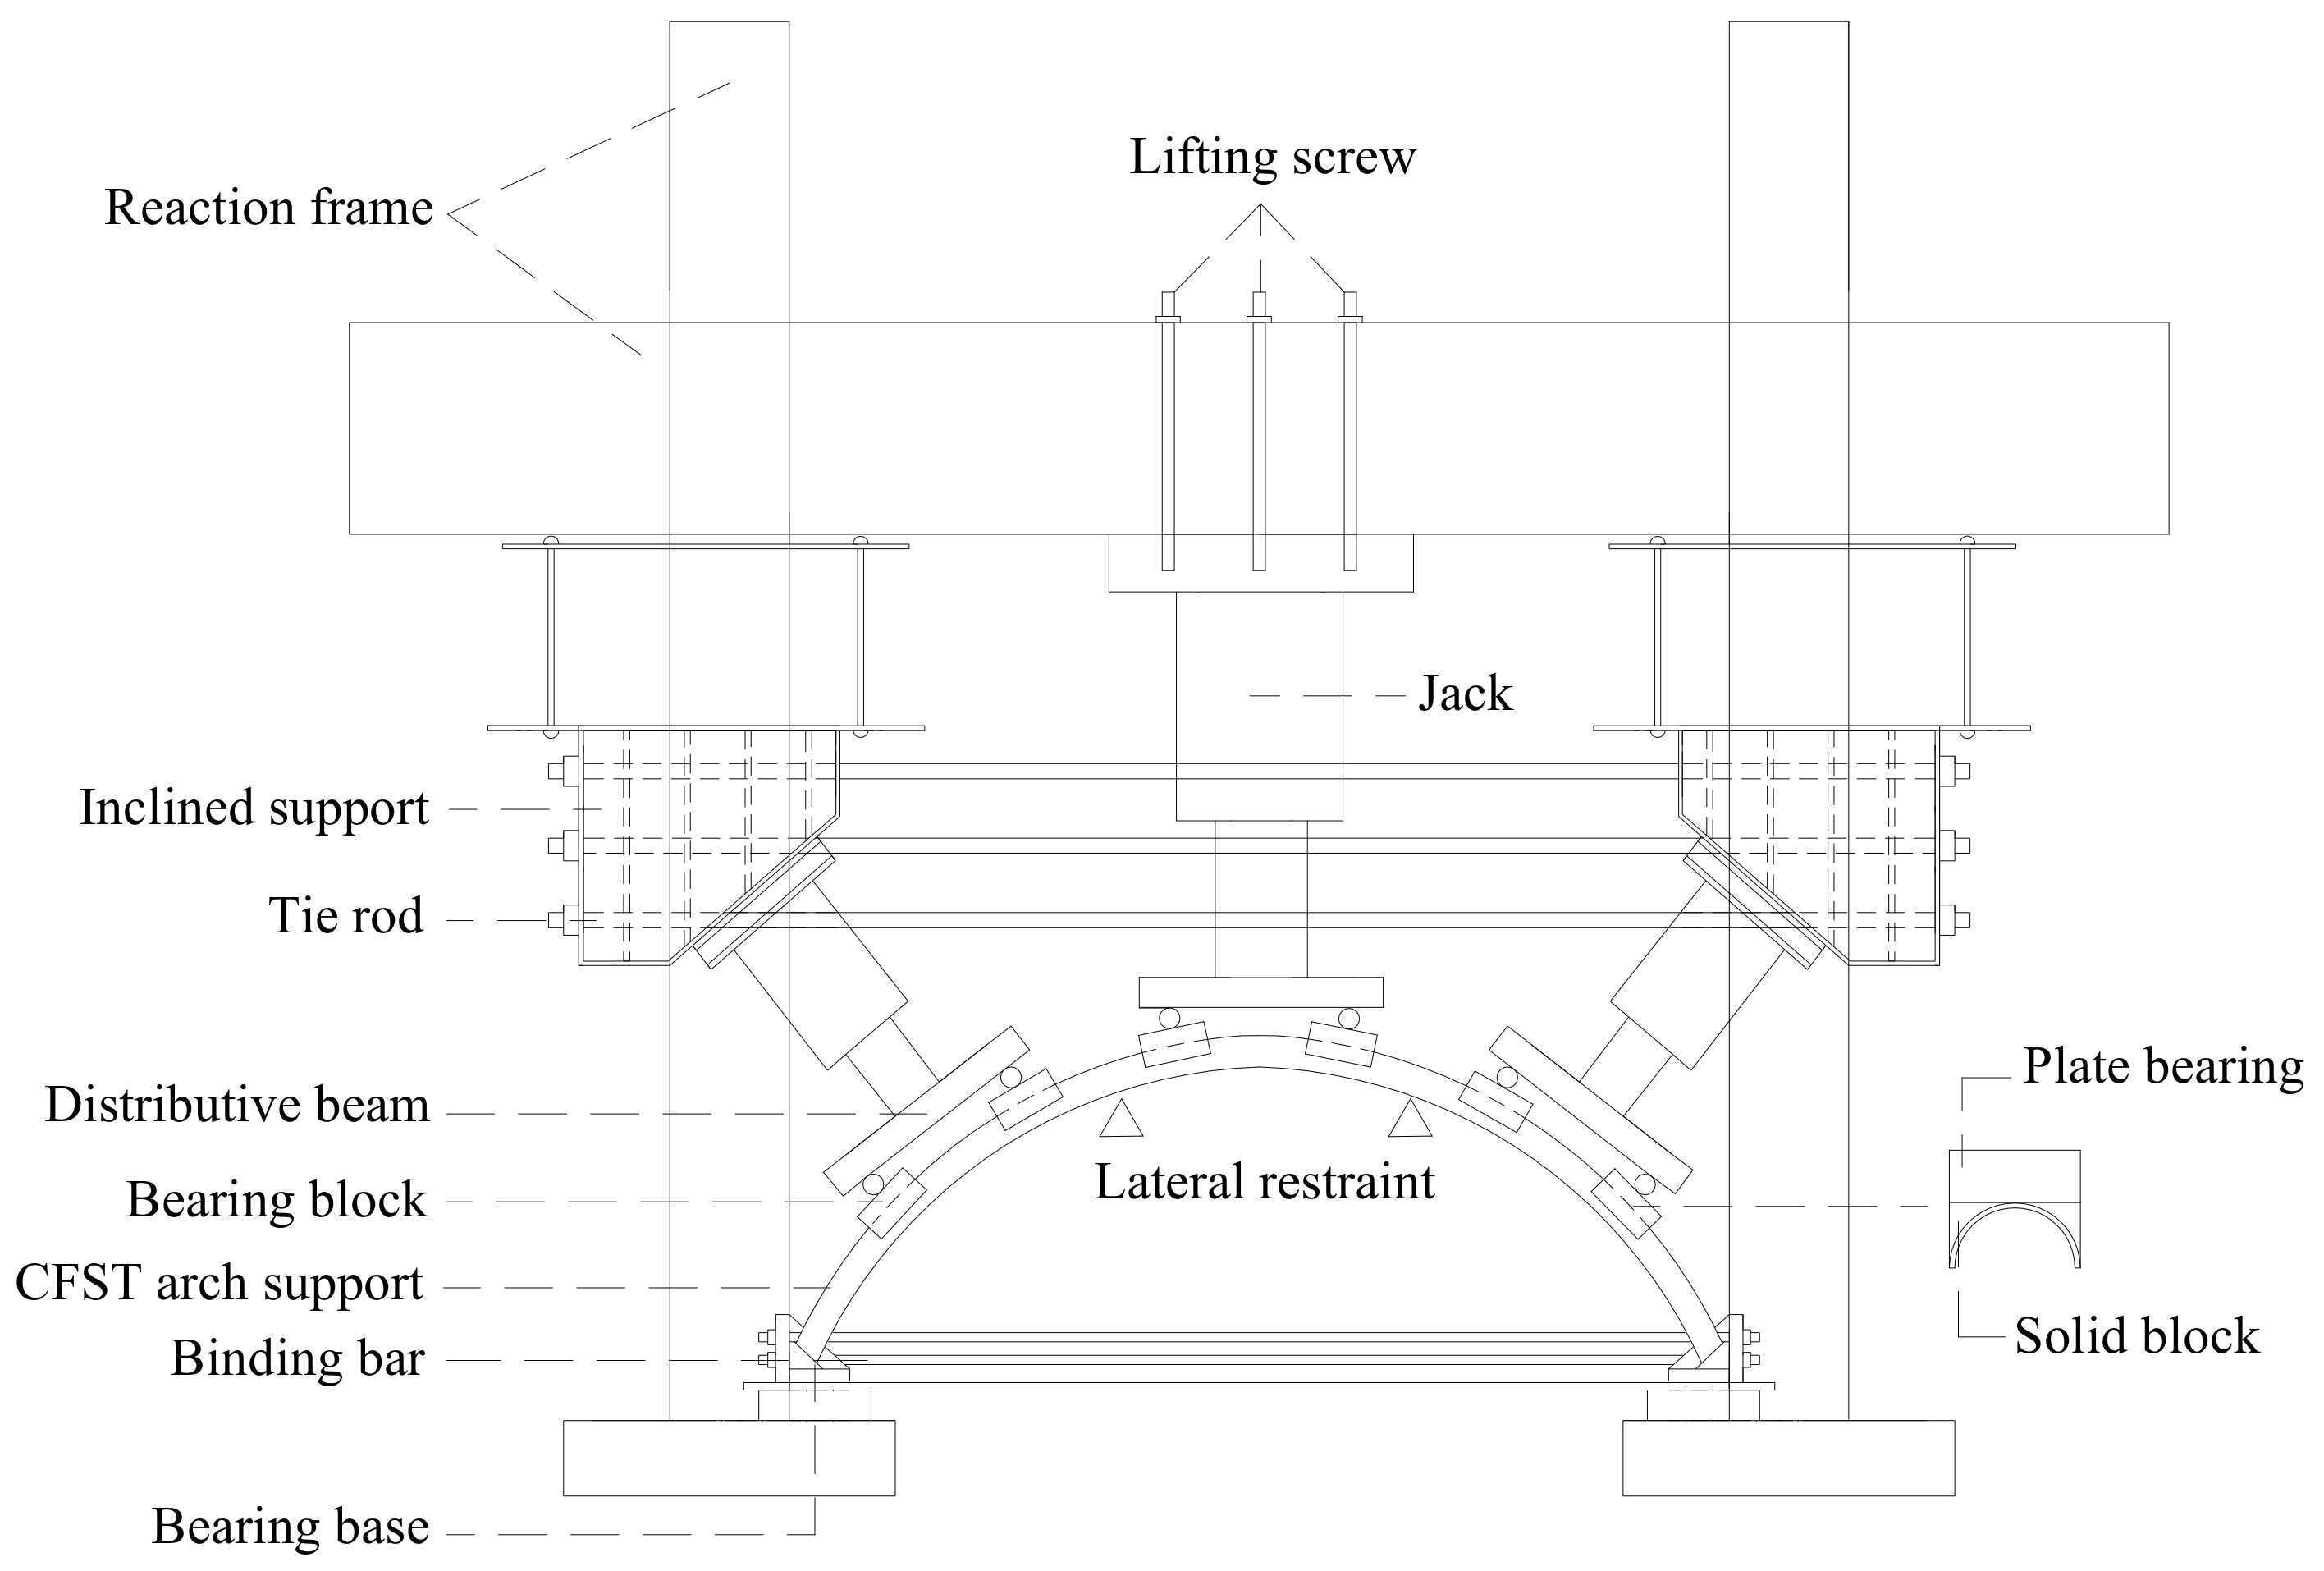
In order to simulate the load cases deep-buried roadways, six-point radial uniformly distributed loads were applied to the CFST arch supports by three electro-hydraulic servo actuators (EHSA) fitted with load distributive girders shown in Figure 3. As well, the ends of the supports were fixed on the oblique fixing plates, which provided normal constraint to the ends of the arch supports, so as to simulate the actual plane contact of the arch supports’ ends in the joint of CFST supports shown in Figure 4a. Two lateral restraint devices shown in Figure 4b,c are set among three load distributive girders, so that the supports would not occur out-plane instability. During the loading process, the loads of each EHSA first increased 100 kN at each load step until the plastic stage which was determined according to load-displacement curves, then 20 kN until the end of experiments. In the loading process, the macroscopic deformation first appeared at the feet of the arch supports and enlarged with the increase of load. In the final loading stage, the mid span of the supports also produced occurred certain macroscopic deformation and the inside of the feet bulge obviously. Besides, some positions of the steel tubes cracked along the axial and then the bearing capacity of the supports decreased.

4. Expanded Experimental Data Through the NSF Method

4.1. Accuracy Verification of Expanded Experimental Data

In order to verify the precision of the NSF method, the 17 out of 19 measured strain points on the mid span section of CFST arch support-D are adopted to construct the strain filed, and then the interpolation results at the other two points of the cross section could be obtained. Hence, these values are used to compare with the real measured ones, and the error of the ith point at the jth load step between them can be calculated by
δ i j = ε i j s ε i j e ε i j e × 100 %
where δij is the error of the ith point at the jth load step between interpolation and experiment, ε i j s and ε i j e are respectively the interpolating and experimental strains of the ith point at the jth load step.
The average error of the ith point in the whole loading process can be estimated by
δ ¯ i = 1 N j N δ i j
where δ ¯ i is the average error of the ith point, N is the total number of load steps. Therefore, the accuracy of the NSF method could be demonstrated through the error values and the comparison curves between interpolating and experimental data.
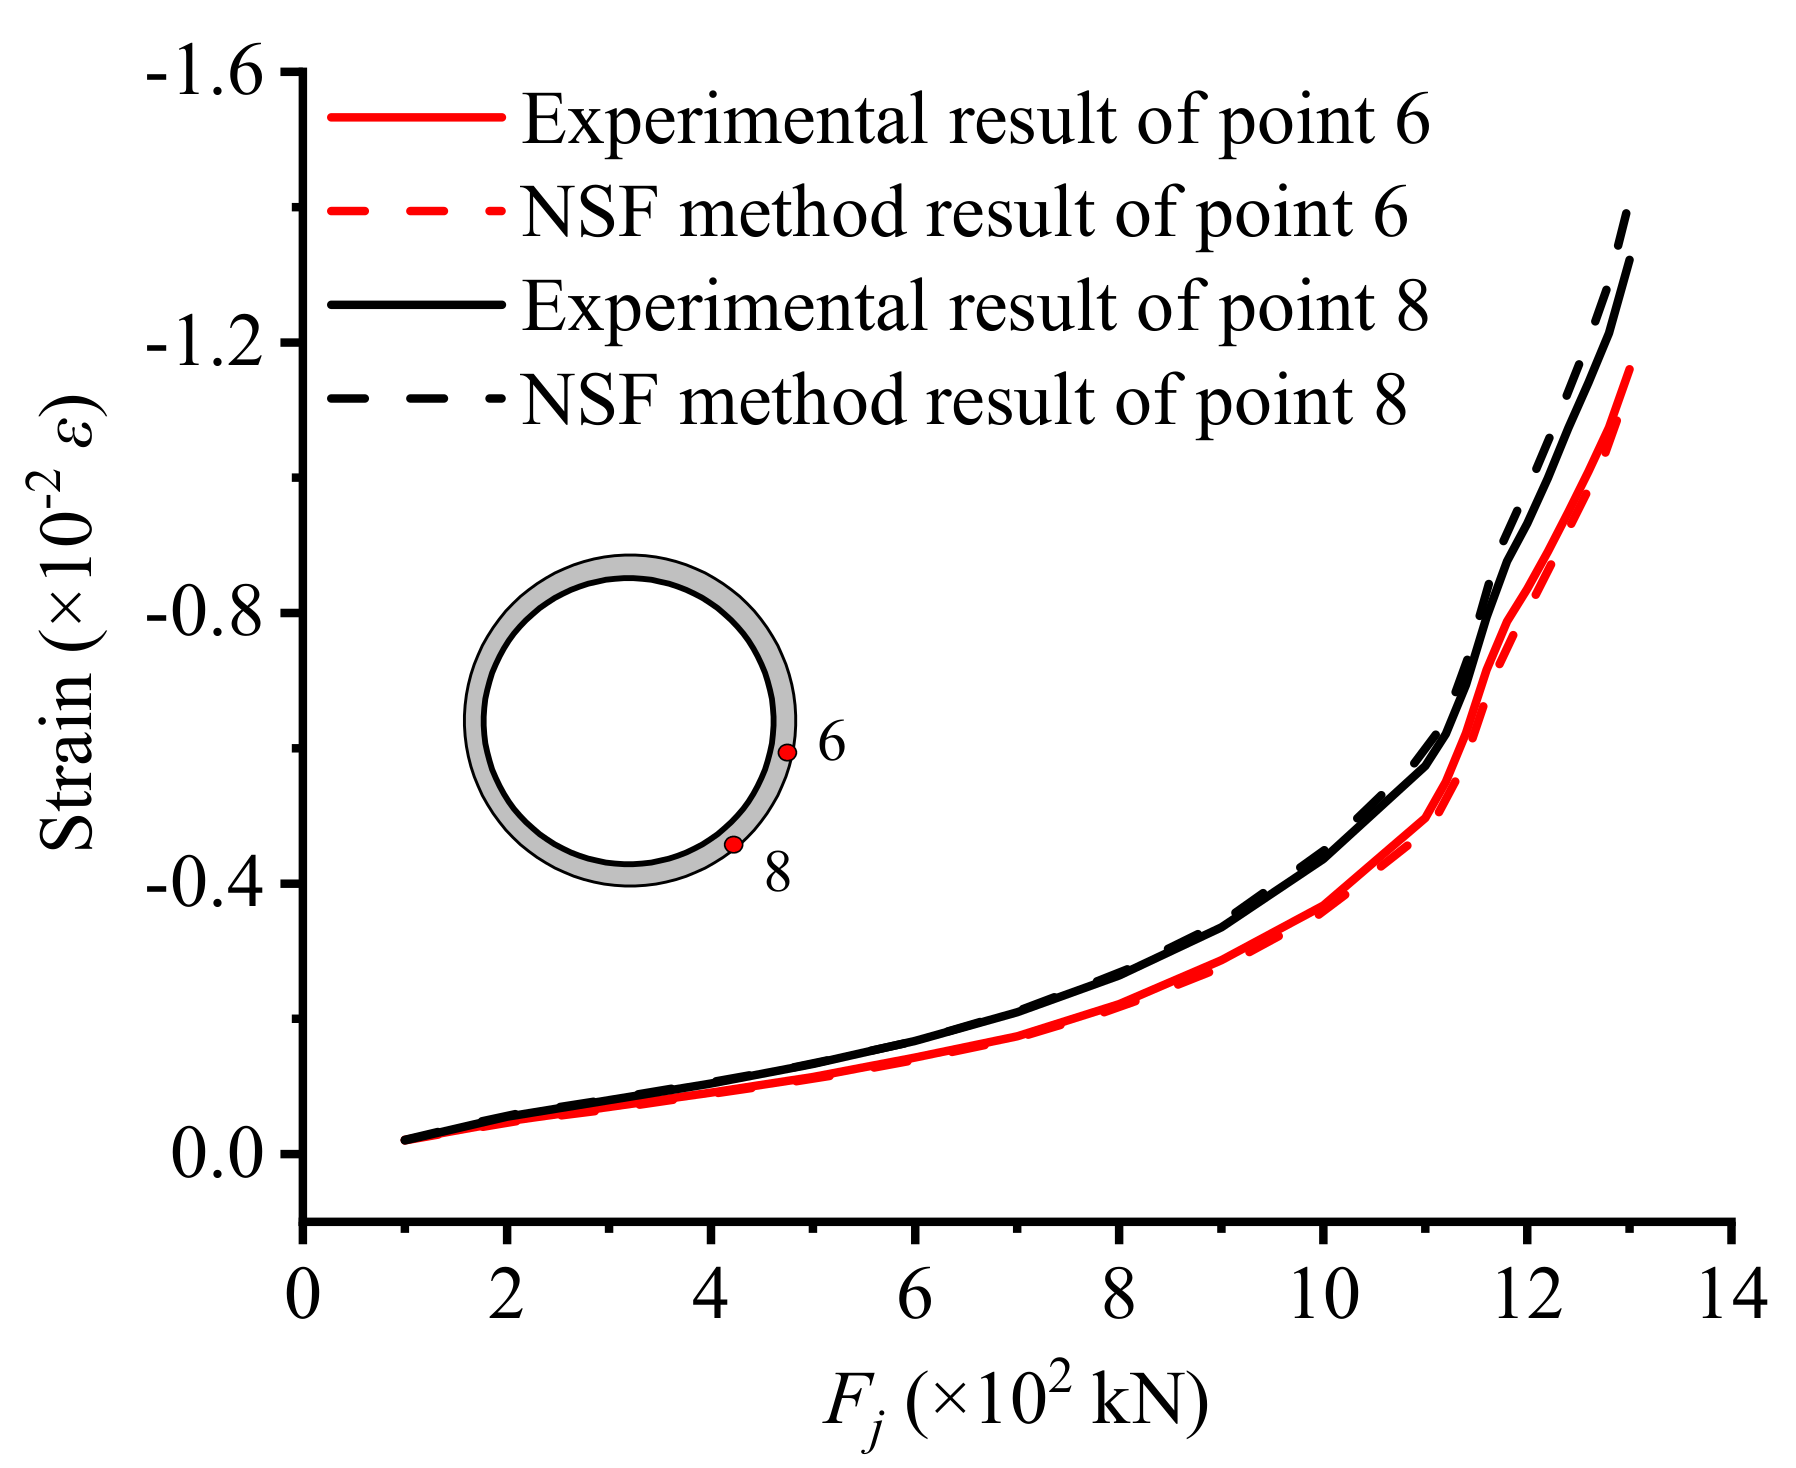
The measured points 6 and 8 are used as an example and the experiments and interpolation curves of them are plotted in Figure 5 to observe fitting degrees of the data clearly. The two curves for the same point have very high fitting degrees even overlapping with each other in the whole loading process. The maximum and average errors of the points 6 and 8 are respectively 5.77% and 3.42%, 6.57% and 3.56%. As for strain data of other four supports not listed here, the results also present high fitting degree and relatively small errors, which can meet the requirement of application. As a consequence, the NSF method with sufficient accuracy could be utilized to expand experimental data so as to further investigate the structural working behavior of CFST arch supports.

4.2. Strain and Stress Fields Expanded by the NSF Method

For purpose of further studying the working behavior of the CFST arch supports, the measured strains should be expanded to obtain strain and stress fields of each cross section through applying the NSF method. At first, Using the finite element software ANSYS, the cross section models of the supports are constructed and Shell 181 and Beam 188 are respectively chosen as the element types of the core concrete and steel tube. After dividing mesh, the strain of each element node on each cross section can be calculated by numerical shape function based on the 19 measured strains, correspondingly, the expanded stress data could be achieved through the constitutive relation of the materials. When the CFST arch supports enters the elastic-plastic deformation stage, the mechanical properties are very complex and nonlinear, which must be considered in the calculation of stress data. So, the five-stage stress-strain model for steel tube and the plastic damage model for core concrete are adopted to calculate the stress fields [38,39,40]. Hence the expanded strain and stress fields are obtained, which is established for structural stressing state analysis in depth.
The experimental data itself contain the influence of elastic-plastic deformations, so the elastic-plastic behavior of the supports could be well embodied in the interpolated strain field based on the experimental data. The expanded stressing fields are also calculated by the appropriate constitutive relation which has considered the nonlinear of materials. Therefore, the NSF method could be utilized to deeply analyze the working behavior of the supports under linear and nonlinear state. Besides, the more experimental data are measured, the more accurate interpolation results would be obtained.

4.3. Internal Forces Based on the NSF Method

In the investigation of CFST arch supports, the changing characteristics of internal forces could help researchers understand the working behavior and failure mechanism of the supports more comprehensively, so the internal forces are tried to be constructed through expanded stress data based on the NSF method. Due to the application of the lateral restraints, the cross sections of the supports mainly undertake axial force and in-plane bending moment, and these internal forces could be obtained through the integral of the sectional stresses. Here, the axial force is calculated by summing the product of longitudinal stress and area for each element, and the in-plane bending moment is achieved through summing the product of longitudinal stress, vertical distances and area for each element, just as Equations (12) and (13)
N j = A σ d A = A σ i j A i
M j = A σ y d A = A σ i j y i A i
where Nj is the axial force at jth load step, σij is the longitudinal stress of the ith element at jth load step, Ai is the area of the ith element, Mj is the in-plane bending moment at jth load step, yi is vertical distances of the ith element from the neutral axis.
The internal forces calculated by the stress fields would have certain changes with the variations of mesh sizes, however, when the mesh is small enough, the error of results could be ignored, which would not affect the analysis of stressing state of the supports. Hence, adopting the appropriate mesh sizes, the internal forces could be calculated based on the NSF method, so as to study the working behavior of the supports.

5. Stressing State Analysis of the CFST Arch Support-A

5.1. GSED-Based Stressing State Mode and Characteristic Parameter

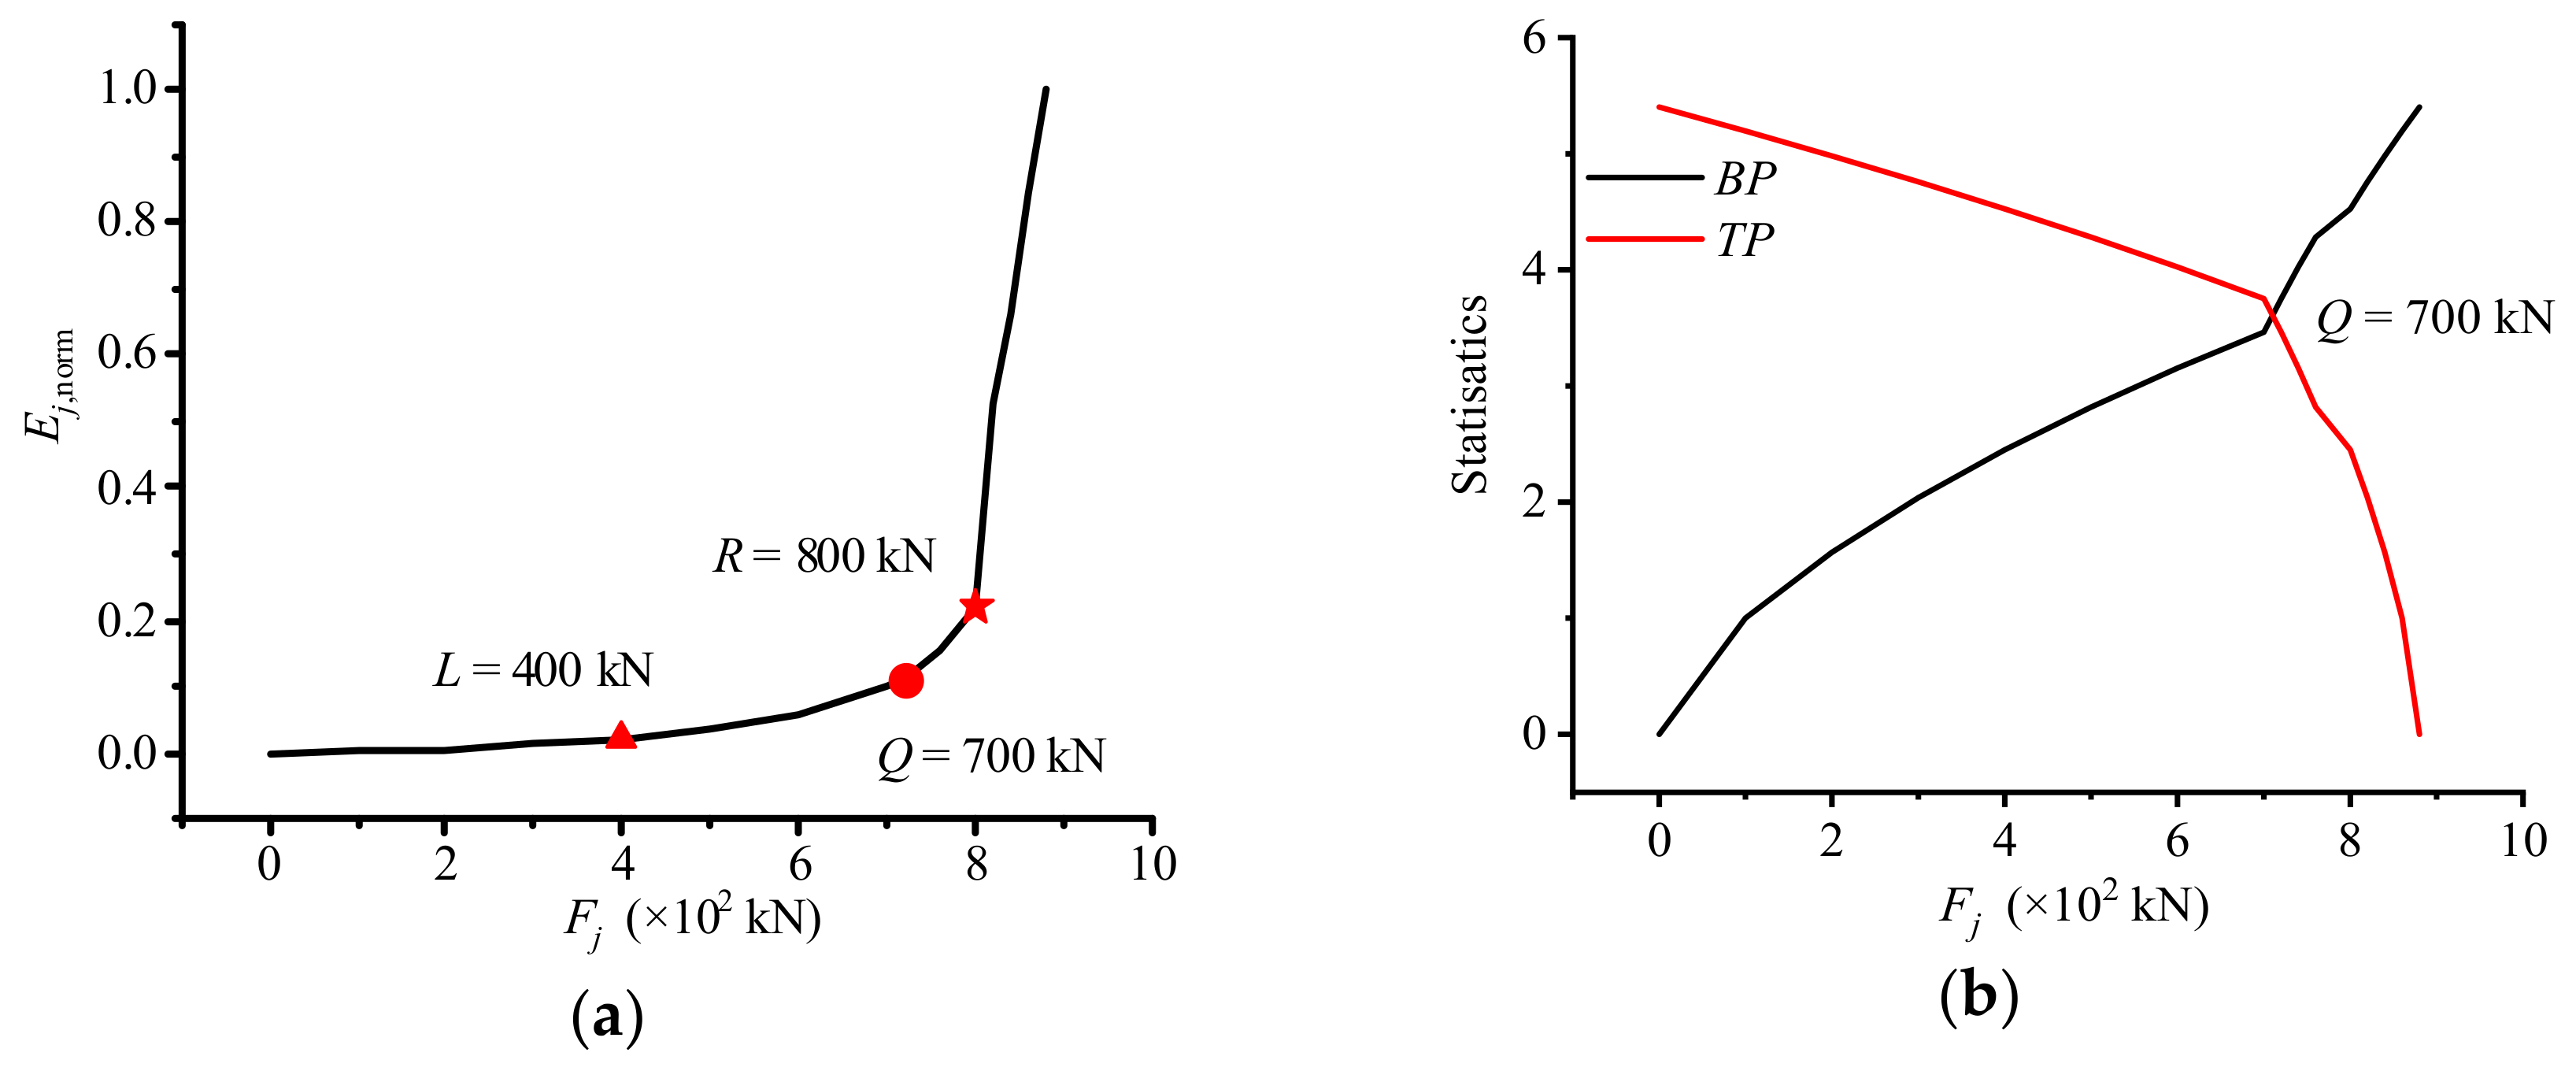
Here, GSED values calculated by Equations (2) and (3) are chosen as the characteristic parameter to study the structural working behavior of the support-A, and in order to avoid the influence of unit and better investigate the developing tendency, the GSED values are normalized by the Equation (4). Correspondingly, the characteristic parameter Ej,norm is plotted under load Fj curve to reflect the changing characteristics of structural stressing state. Then the M-K criterion are applied to the Ej,norm-Fj curve, hence the three mutation points of the stressing state are detected, respectively Q = 700 kN (from 0 kN to ultimate load U), L = 400 kN (from 0 kN to Q) and R = 800 kN (from load Q to U), shown in Figure 6. Evidently, before load L the Ej,norm-Fj curve manifests almost linear growth, signifying that the whole support-A is in quite stable elastic stressing state. Thereafter, the curve increases still slowly and steadily, but in a curvilinear shape, which could be indicated that the support generates a certain plastic deformation and enters stable elastic-plastic stressing state. When it comes to load Q, the curve increases within a narrow range probably due to the further plastic development of the support, implying that the support basically goes into plastic stressing state. Then, as the load exceeds load R, the curve develops sharply and rapidly, which embodies a trend completely different from the previous one. At this stage, the support enters a quite unstable stressing state until the ultimate load U, reflecting the qualitative change of the support. Therefore, load R is defined as the failure load of the support, which is updated the existing failure load (ultimate load). The updated failure load is revealed according to the natural law from quantitative change to qualitative change of a system, which represents the starting point of the support’s failure process. The determination of the load is not based on any assumption, which reflects inherent mutation characteristic of the structural stressing state. That is to say, the mutation load of the structural stressing state is determinate and could be taken as the reference to the determination of structural design load.
Hence, the structural stressing state of CFST arch support-A could be divided into four stages by characteristic loads L, Q and R: (1) Before load L, the support is in a very stable elastic stressing state stage and load L is defined as the demarcation point between structural elastic and elastic-plastic stressing state stages; (2) between loads L and Q, the support begin to enter the nonlinear stressing state, namely elastic-plastic stressing state stage, correspondingly load Q is defined as the demarcation point between structural elastic-plastic and plastic stressing state stages; (3) from load Q to R, the support is in the plastic stressing state stage, but Ej,norm still keeps a relative stable growth, revealing quantitative change instead of qualitative change; (4) after load R, the stressing state of the support changes suddenly and qualitatively until the ultimate load U and this stage could be defined as failure stressing state stage.

5.2. Analysis of Stressing State Modes Based on the Measured Strain

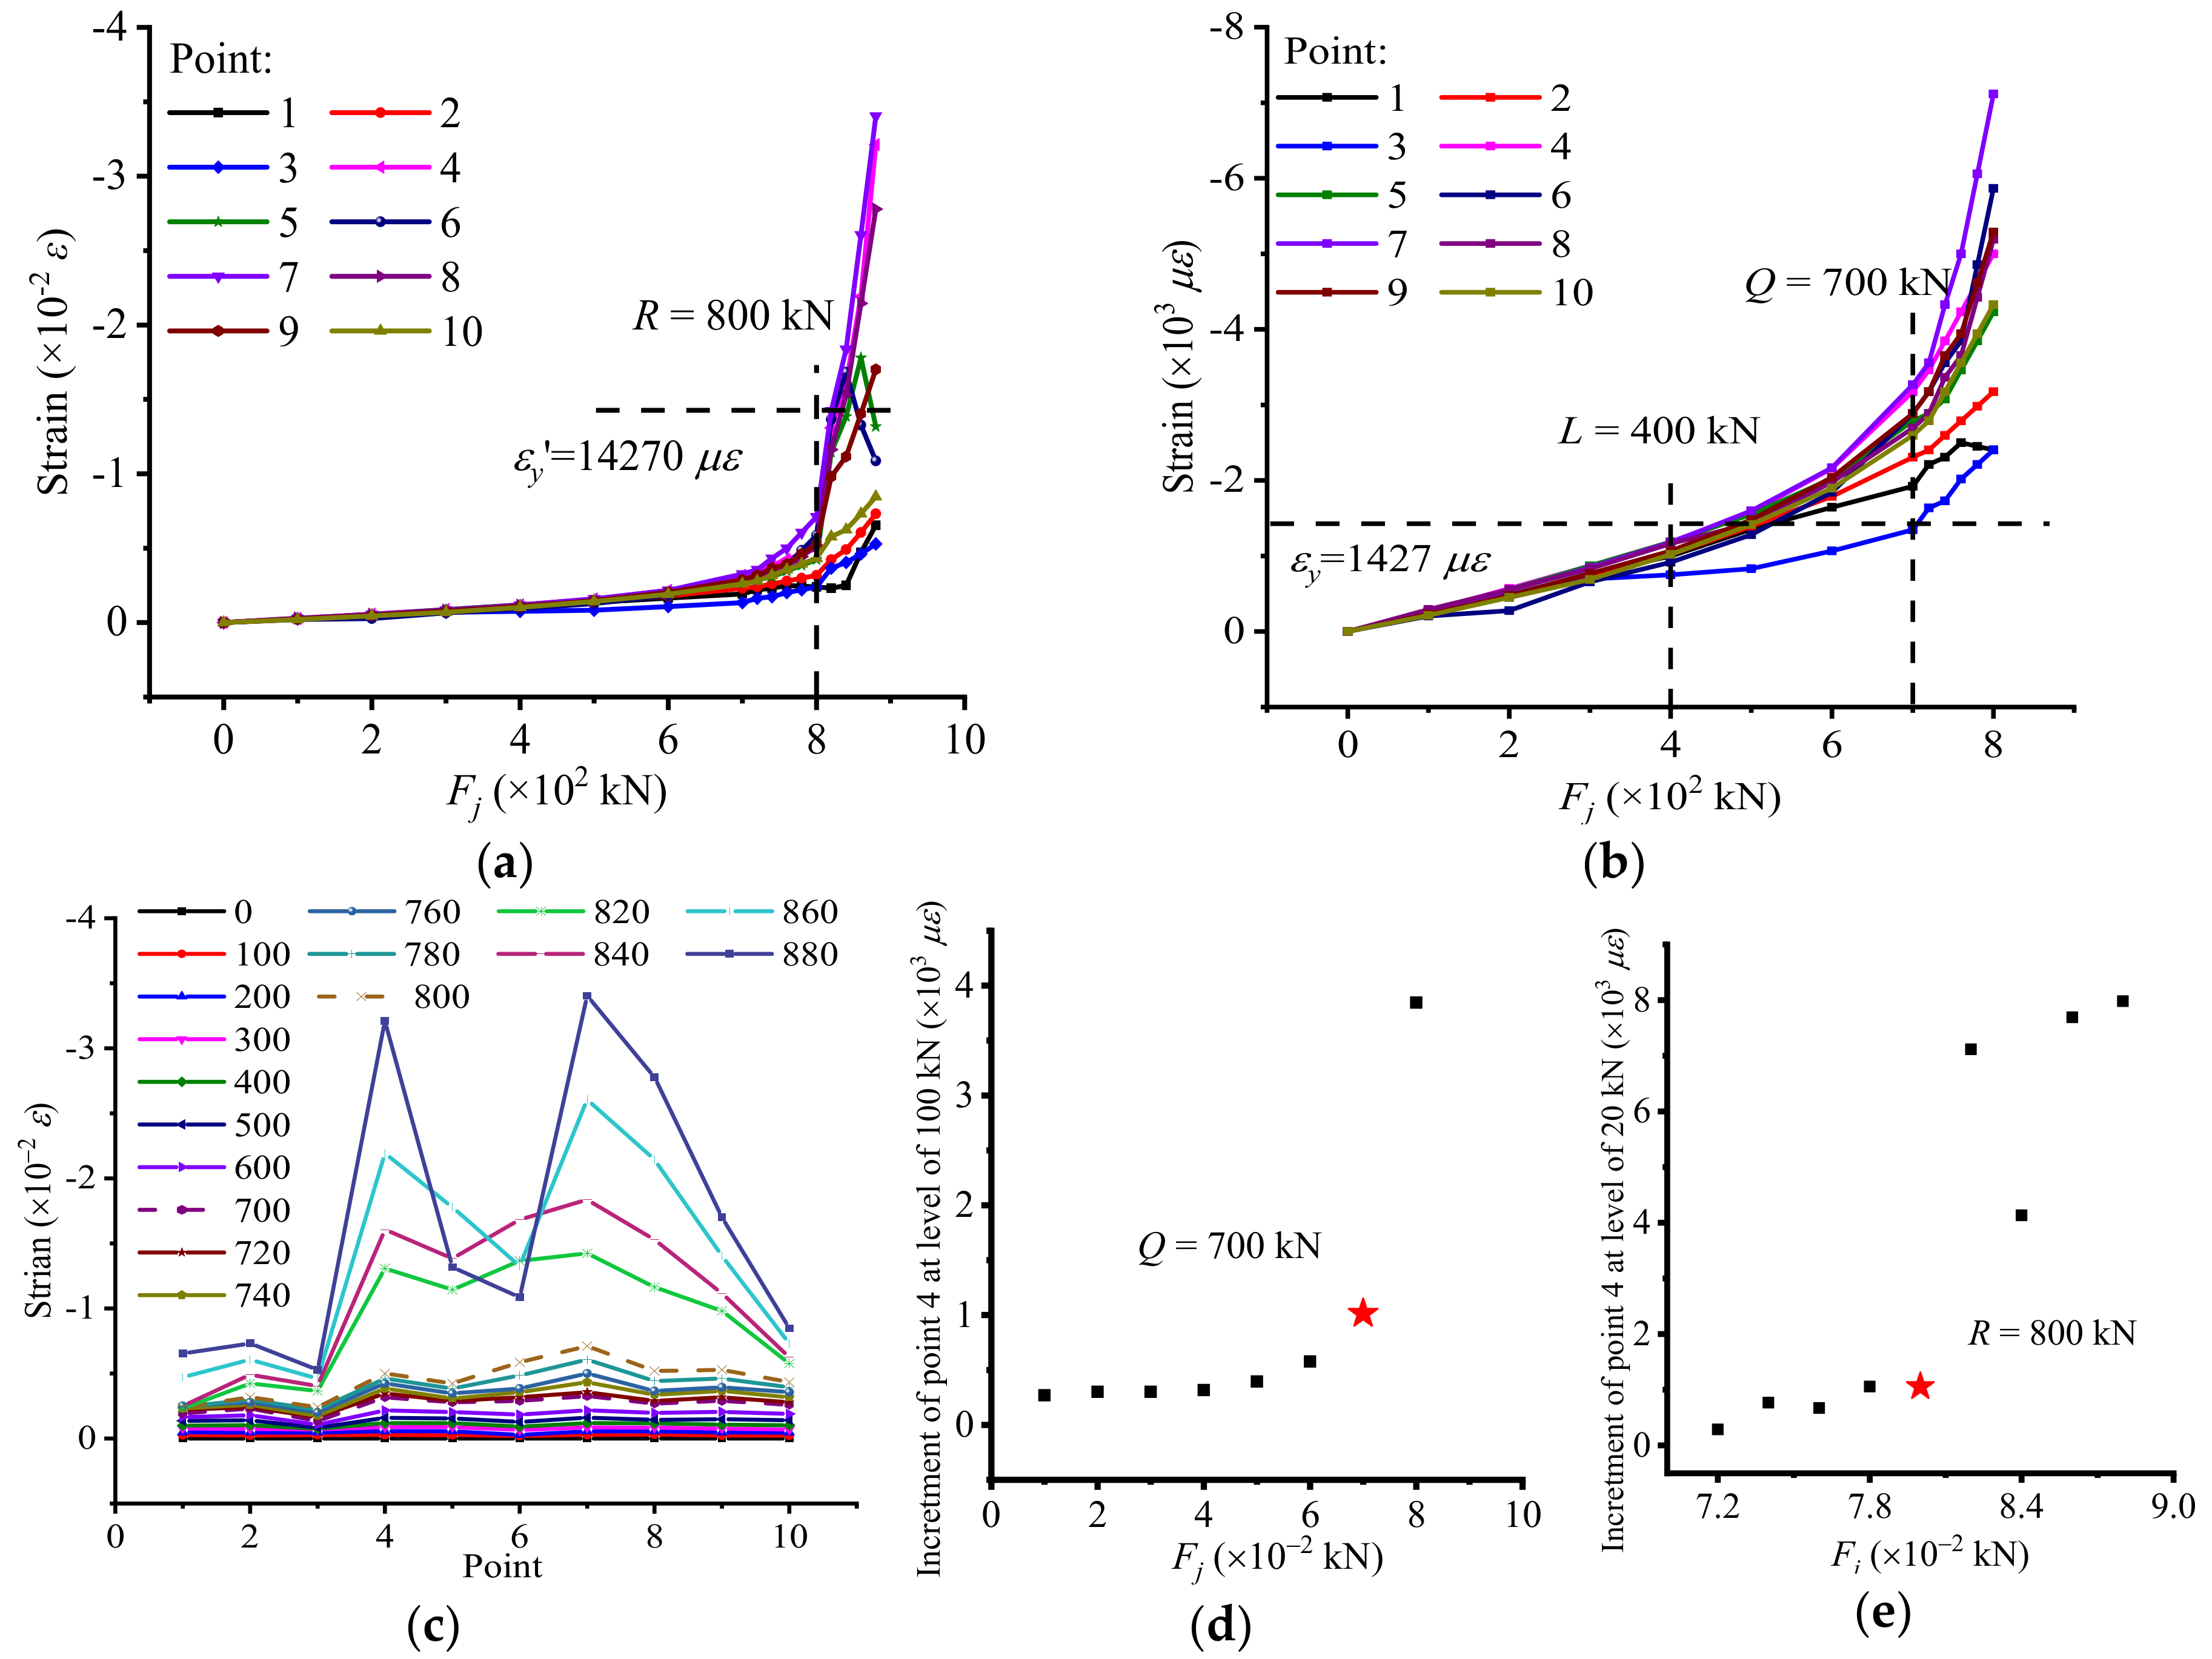
The trend changing curves of strain-based stressing state modes are plotted in Figure 7a,b, and it could be observed that before the load L the Strain-Fj curve almost keep linear growth. The strain values of each measured point are basically the same and all of them do not reach the εy = 1427 με (the yield strain of steel tube), indicating that the support stays in a stable elastic stressing state. After that, the curve increases gently and the curve of point 3 separates from those of the other measured points which begin to yield. Hence, it could be speculated that the support really enters elastic-plastic stressing state. When it arrives at load Q, all the curves of the measured points begin to bifurcate and exceed the yield point of steel tube, embodying inconsistent plastic development at various positions on the cross section in plastic stressing state. After load R, the curves except the one of point 1 all mutate and form two different growth range. The curves corresponding to points 4–9 present rapid increases to ε y = 14,270 με (hardening strain), manifesting that they begin to enter the hardening stage of steel, while the other curves are still in continuous plastic developing. Therefore, the stressing state modes also have the mutation characteristics at characteristic loads L and Q and R, consistent with that revealed from the characteristic parameter Ej,norm.
Easily, the strain-based stressing state modes can be plotted in the other form as well. As shown in Figure 7c, the two dash lines respectively represent the characteristic loads Q and R, and the mutations of the structural stressing state mode could also embody at the two loads, in particular for shapes variation and incremental amplitude. Besides, after load R, the shape of the curves at points 4 and 7 form two peaks, indicating that these two points play decisive roles in the failure stressing state stage. The increment of strain values between adjacent loads for the critical point are also taken as a characteristic parameter to characterize the stressing state mode shown in Figure 7d,e, so that the mutation characteristics could be observed more obviously.

5.3. Change Characteristics Reflected by Strain and Stress Fields

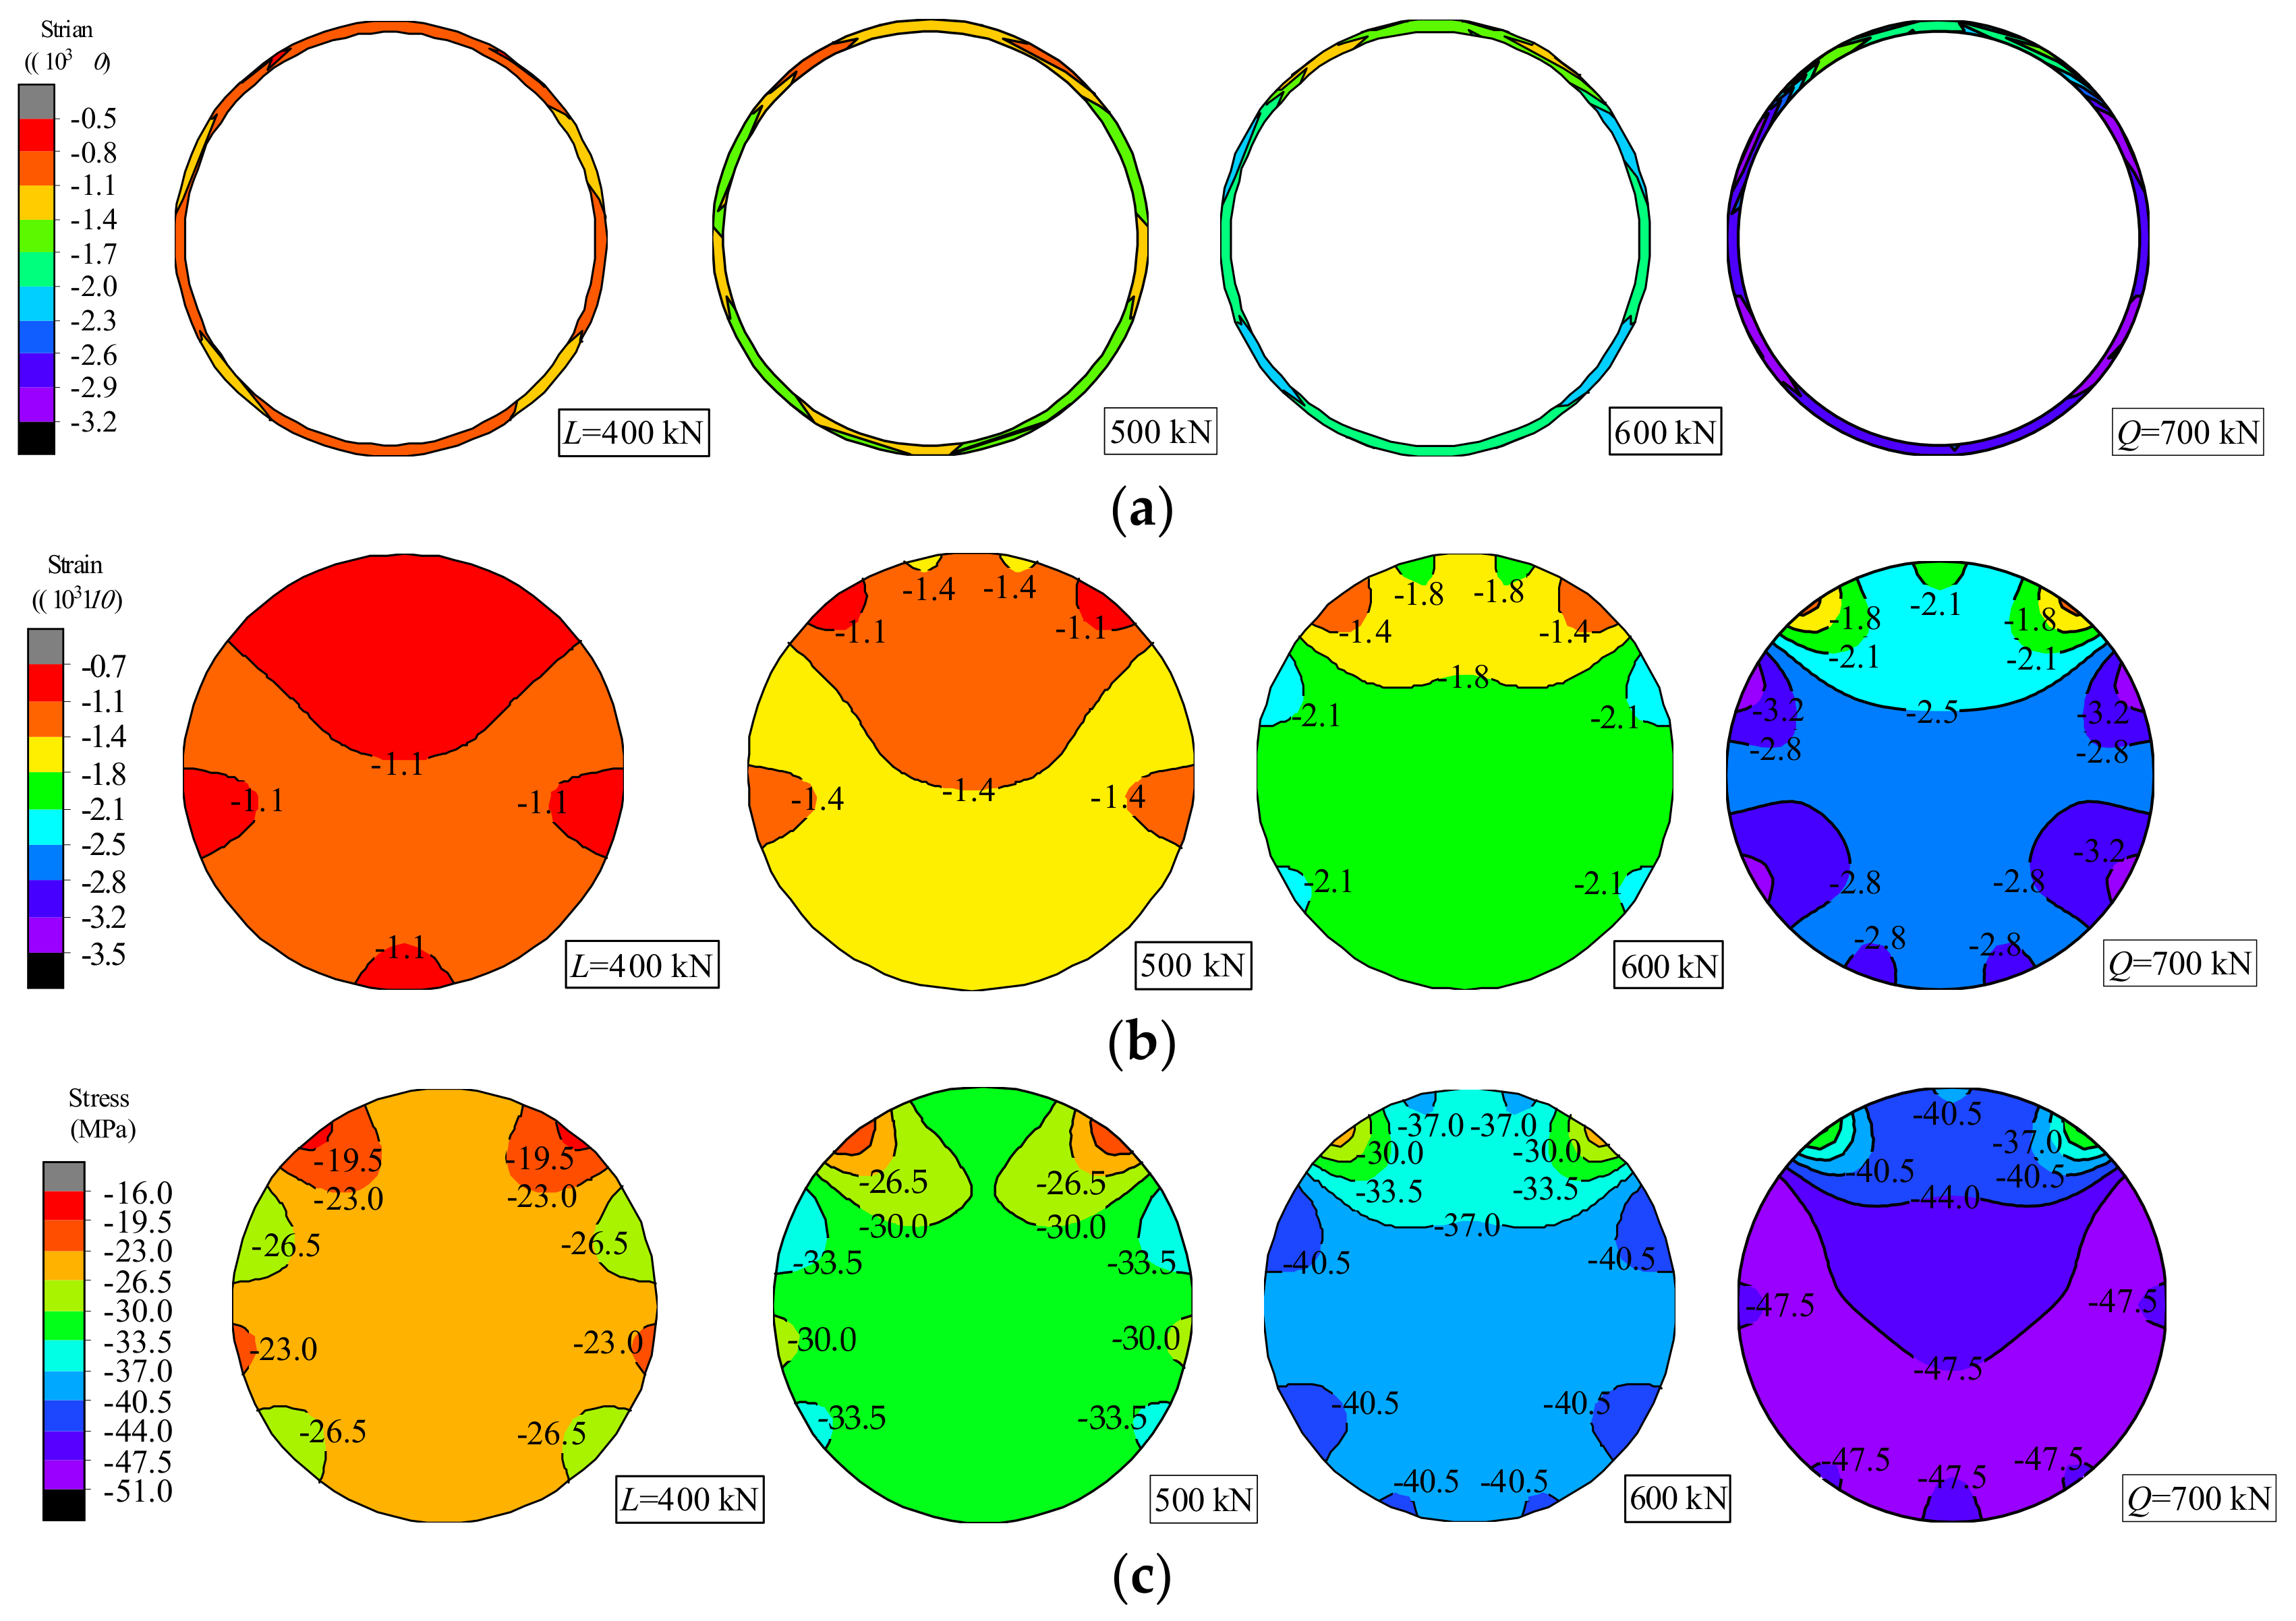
Certainly, the analysis based on the measured strain data could really embody the performance features of support-A around the characteristic loads to some extent. However, these limited data could only reflect the distribution and the development of strains at each measured points, that is, the local structural working features. Hence, the NSF method is applied to the mid-span section of support-A, so as to acquire the strains and stress data at unmeasured points on the steel tube and core concrete. Through constructing the strain and stress fields of the cross section, the change characteristics of structural stressing state for the support could be described more intuitively, so that more detailed performance and mechanism could be researched. According to the Figure 6 and Figure 7 above, four stressing state stages of the supports are divided by the three characteristic loads, respectively, the elastic, elastic-plastic, plastic and failure one, hence the strain or stress fields of steel tube and core concrete around the characteristic loads are plotted to investigate the changing characteristics of the cross section.
As illustrated in Figure 8a, the strains of the whole cross section of steel tube are compressive, indicating that under the given load case the mid-span section is subjected to compression all the time. At 400 kN (load L), the whole cross section is unyielded, hence support-A is really in elastic stage. While thereafter the part of the cross section exceeds yield strain at once, and the top is still in unyielded condition until load Q. Besides, from 400 kN to 600 kN, the middle and bottom of steel tube increase one or two color gradations, then more than three color gradations at load Q. At the moment, the total cross section reaches yield, indicating that the stressing state of the steel tube really mutates to plastic stage completely. Similarly, the mutation characteristics of the core concrete could also be observed in increments of color gradations shown in Figure 8b,c. Besides, in the elastic, elastic- plastic and plastic stressing state stages, the stains or stress on the center and top of the core concrete always keep smaller than the edge of middle and lower parts, which could be implied that the development of strains and stress for the support both present the trend from the areas around points 4 and 7 to the center, then to the top and bottom.
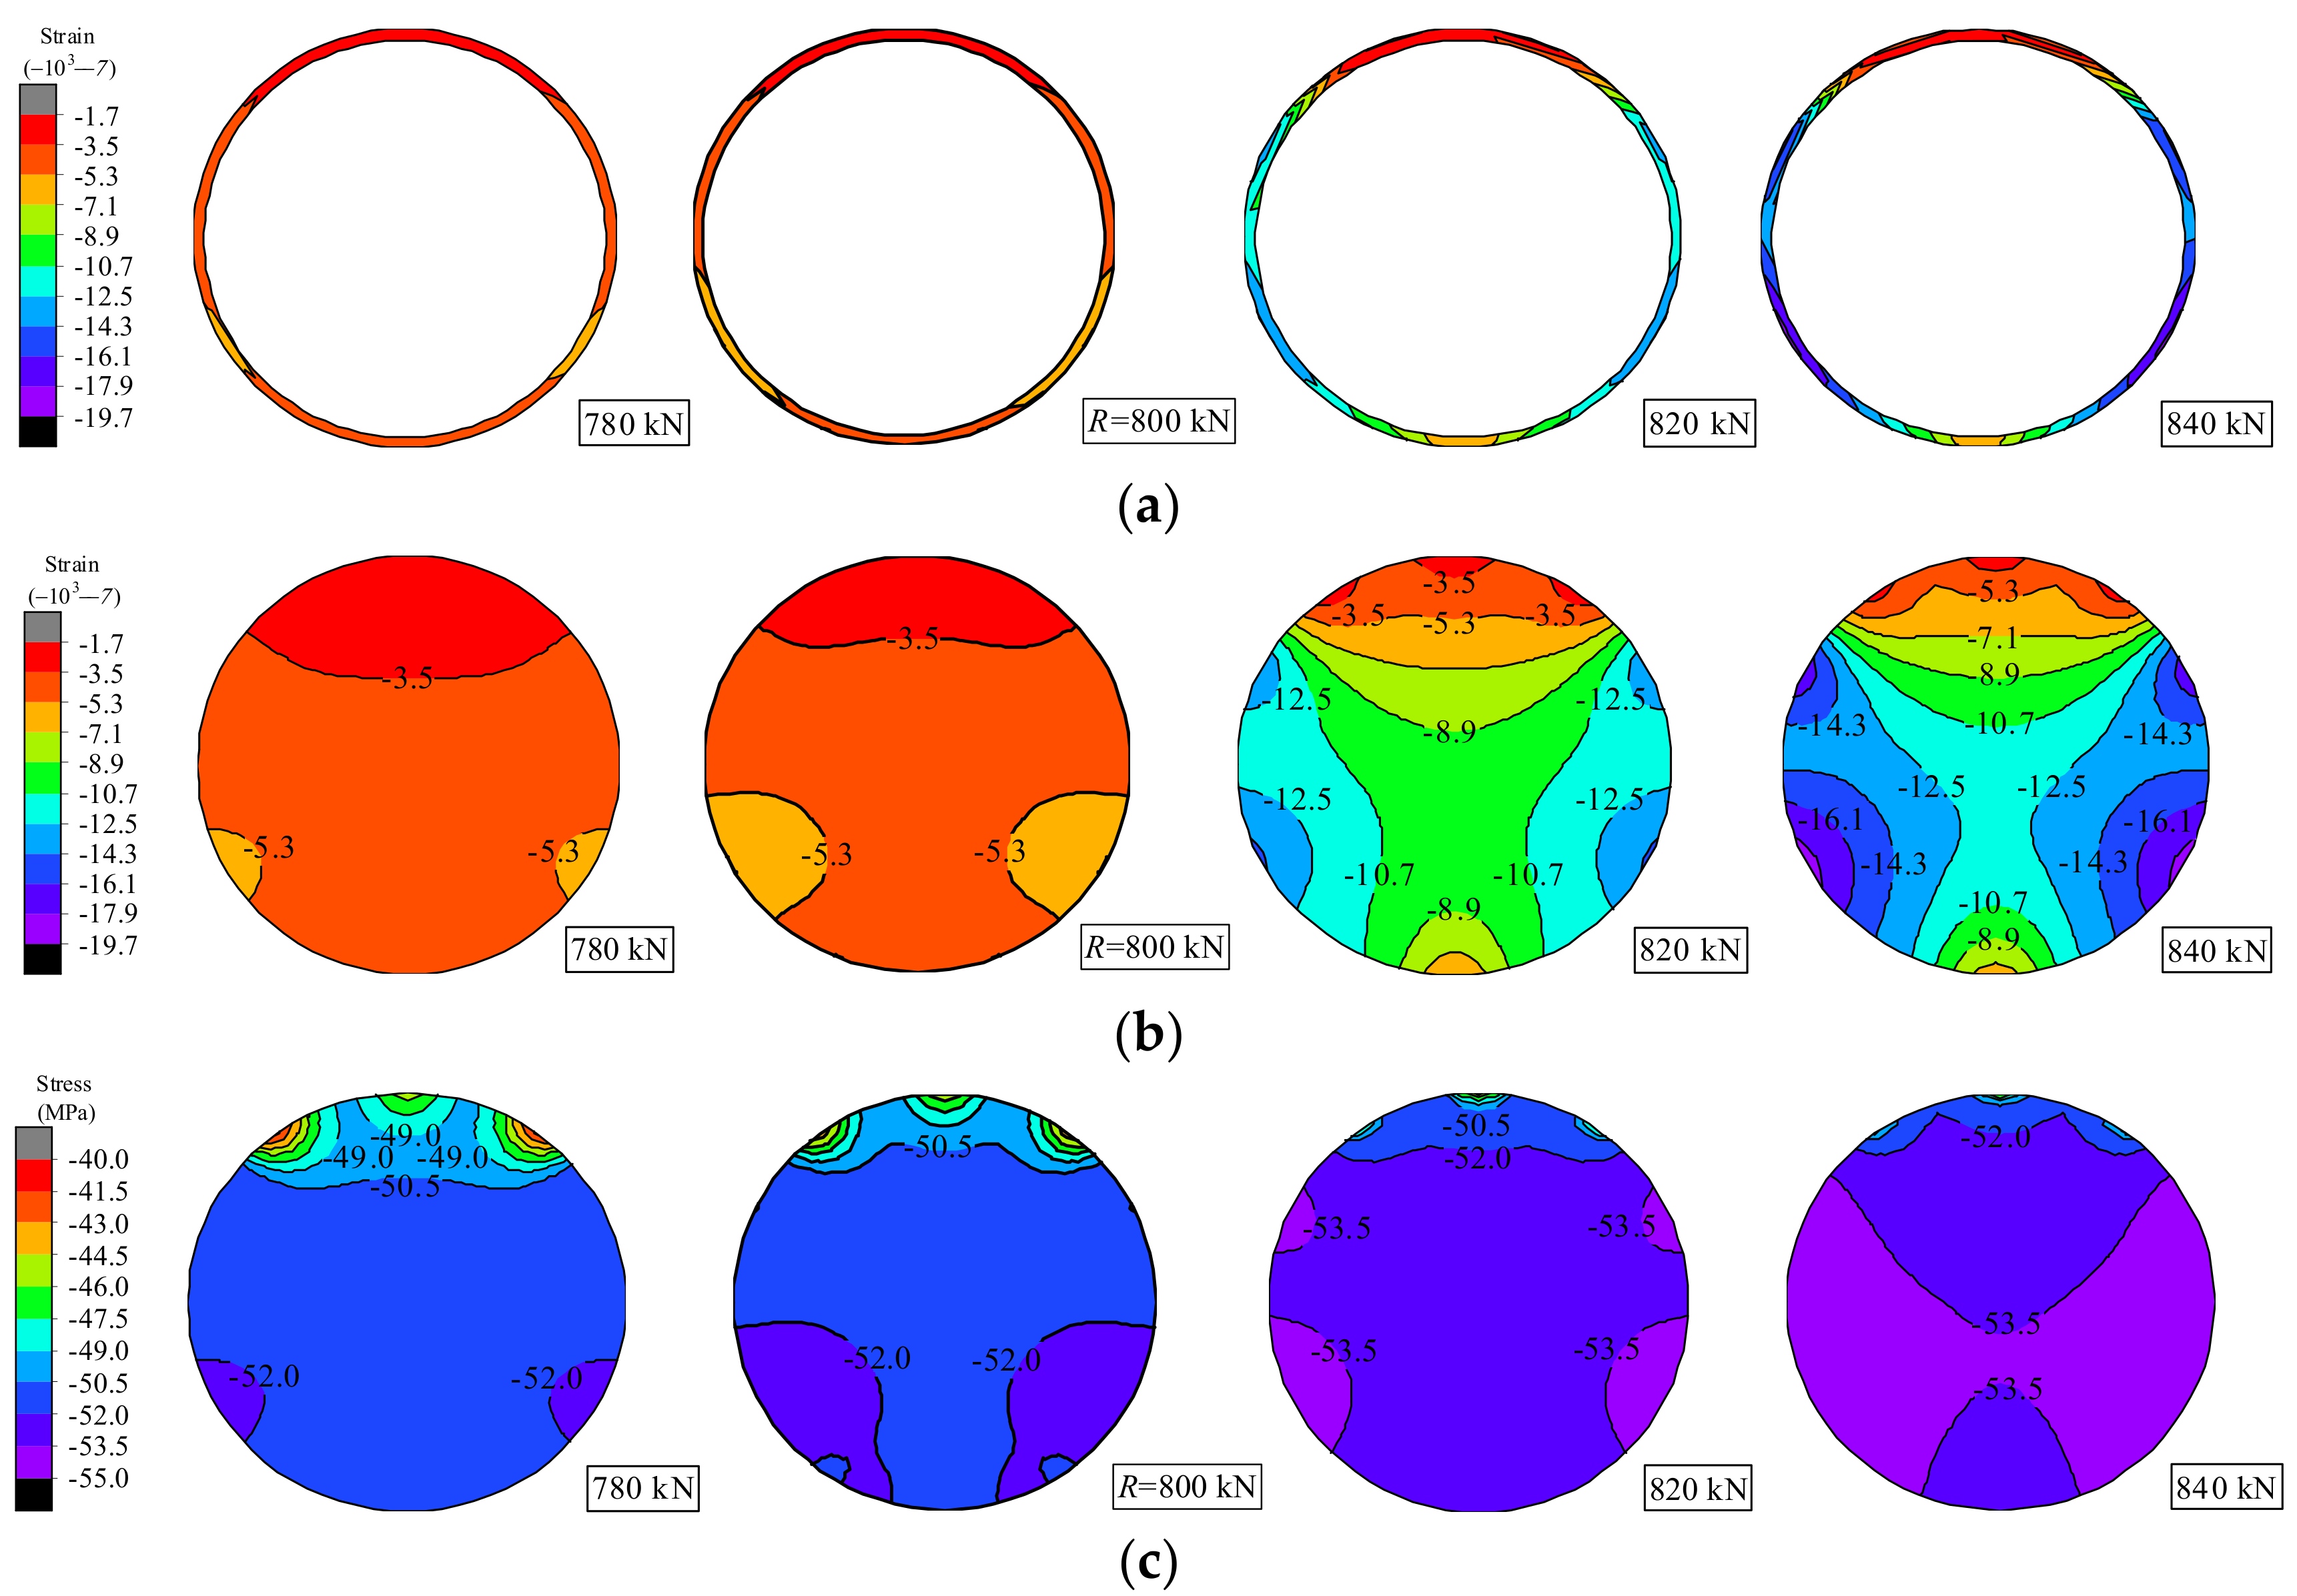
In order to observe the changing characteristics around the characteristic load R, the strain and stress fields at 780 kN, 800 kN (characteristic load R), 820 kN and 840 kN are plotted in Figure 9. It could be seen from Figure 9a,b that before load R, the strains of steel tube and core concrete only consist three color gradations, and with the growth of load, the strain fields display the enlargement of soft orange gradation (−5.4~−7.1) the and the reduction of red one (−2.0~3.7), indicating that the sectional plastic development maintain relative stable. Therefore, the changing characteristics of strain fields at this stage obviously reflects the accumulation of quantity instead of qualitative mutations. Once it surpasses load R, the strains of the whole cross section occurred different degrees of growth and the number of sectional color gradations increases to eight, in particular for the outstanding increase of sectional middle and lower part. Both the oversized strain values and excessive sectional strain change could reveal that the support is in a quite unstable stressing state stage with potential risk and not suitable for continued loading. Yet, the sectional distribution pattern of the color gradations keeps similar with the elastic-plastic and plastic stage. Hence, it could be speculated that under the given load cases, the sectional strains for the support present the same development trend all the time, that is, from the areas near points 7 and 4 to the center then to the top and bottom. Besides, from 820 kN to 840 kN, the strains fields only emerge the rapid increase of strains, namely the variation in the number and range of color gradations, which could also confirm that under the two loads, the support really maintains in the same failure stressing state stage. According to the materials constitutive relations of the support, when strains are up to some extent, the stress would just increase a little in spite of a huge increase of strains. Therefore, before and after the updated failure load R, the mutation characteristics only embody in the leap of one color gradation shown in Figure 9c. As well, the stress development trend could be observed clearly as well.
Through analyzing the strain and stress fields of the steel tube and core concrete for CFST arch support-A, it could be discovered easily and clearly that changing characteristics around the three characteristic loads and the development trend of strains and stress during the whole loading process. Hence, the strain and stress fields expanded by the NSF method could reveal the sectional changing characteristics under loading, such as the detection of location stress concentration, etc., which could help researchers deeply understand the working behavior of supports.

6. Investigation into CFST Arch Supports with Different Section Parameters

6.1. GSED-Based Stressing State Modes of the Different Supports

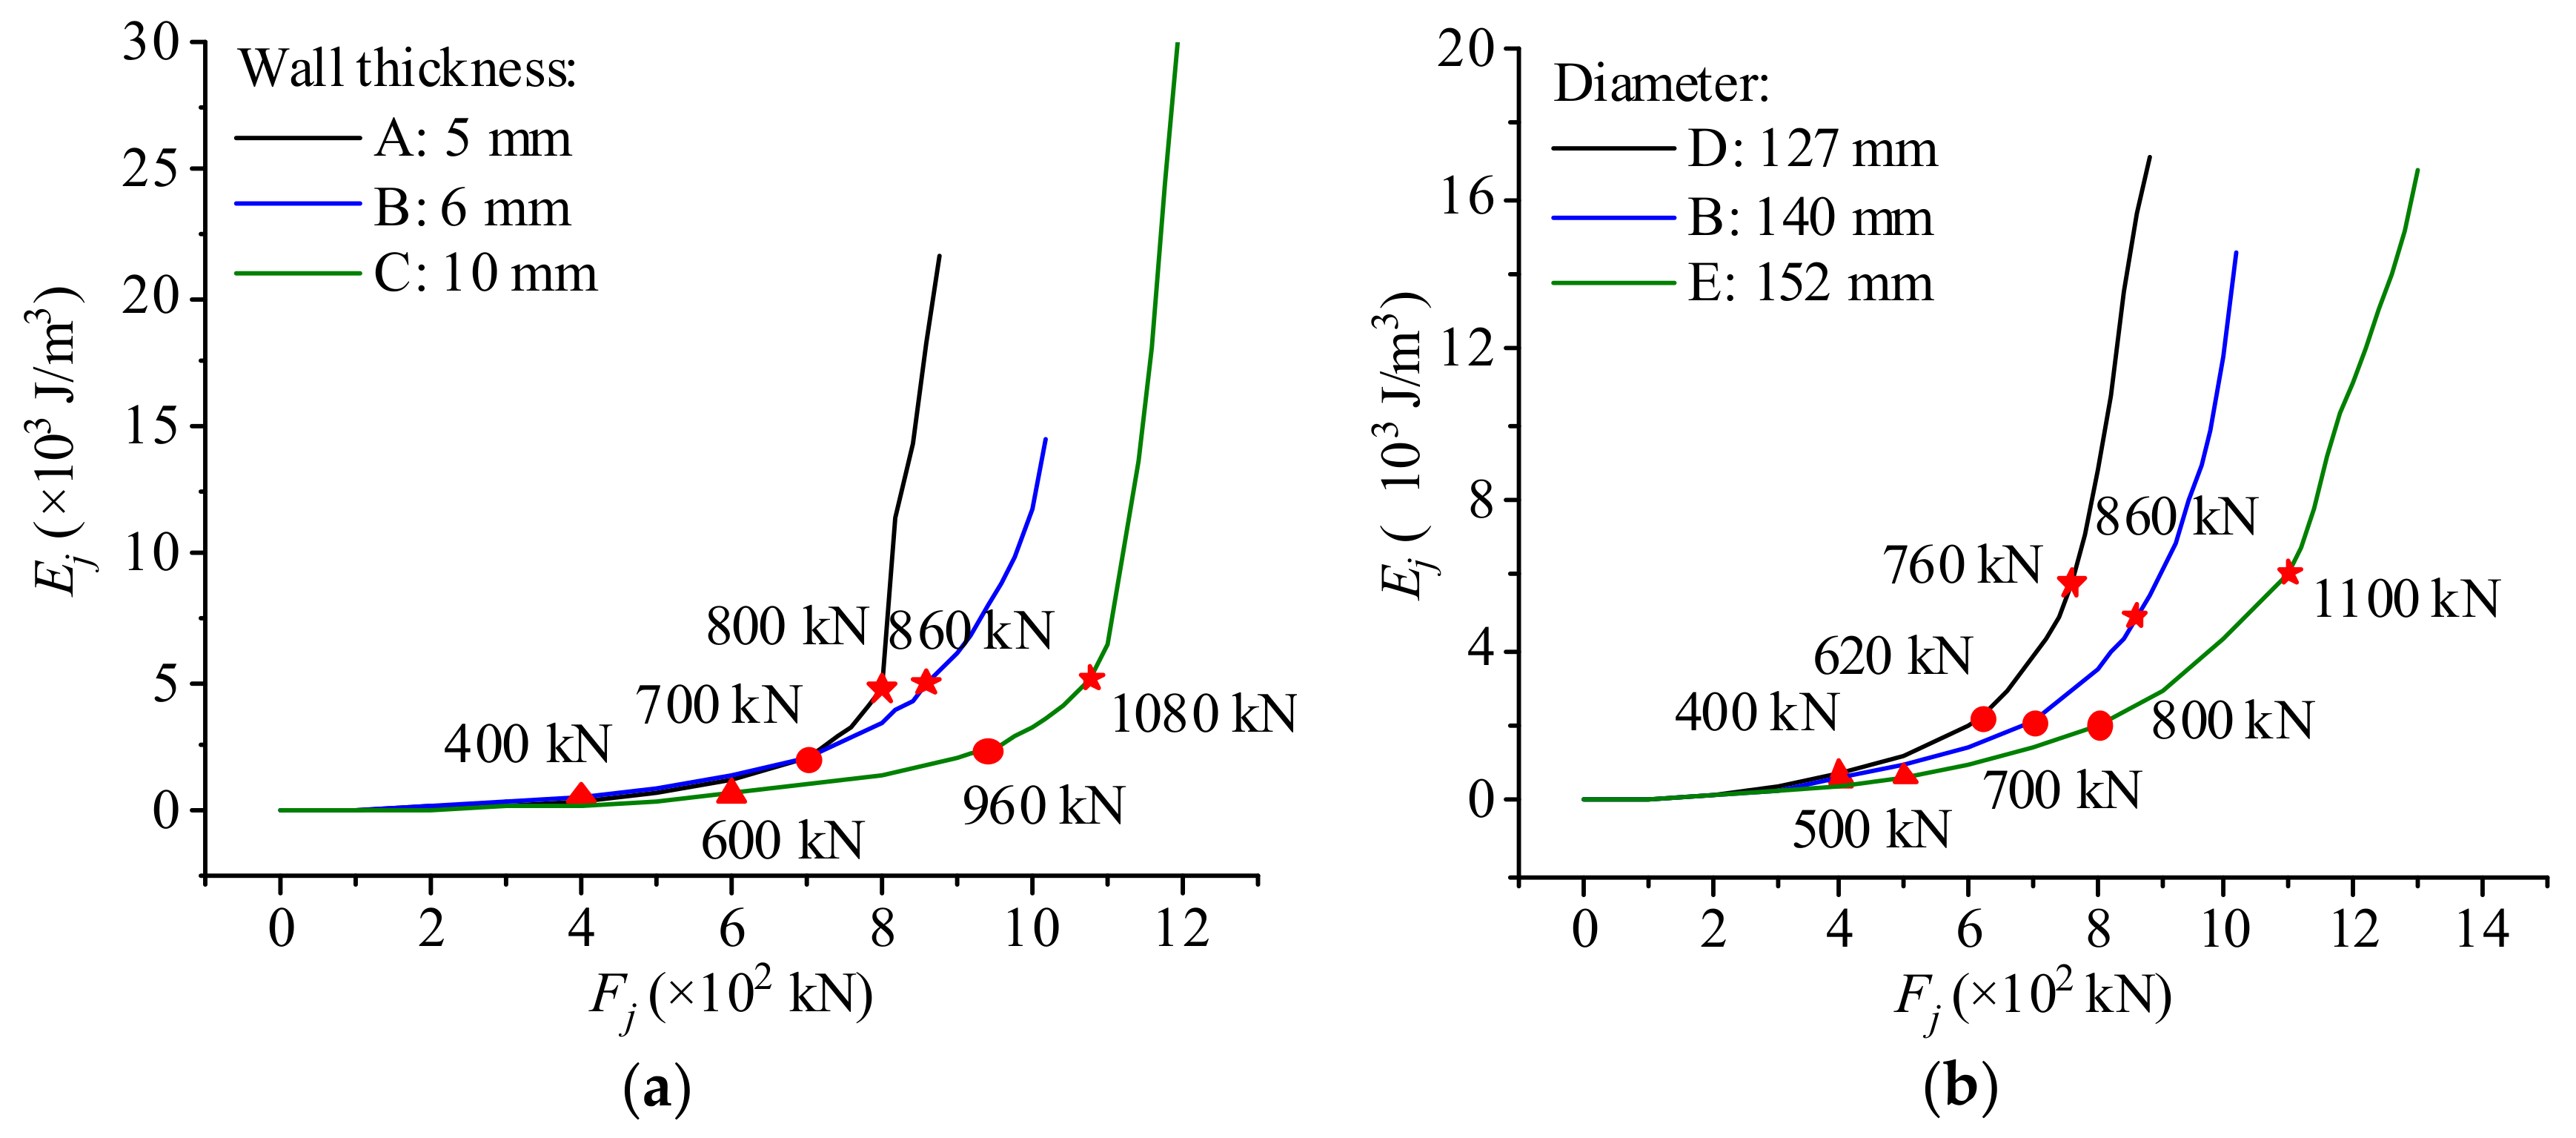
The GSED values with the increase of load for the different CFST arch supports are plotted in Figure 10, so that the common and different working characteristics under section parameters could be further investigated. It can be seen in Figure 10 that the stressing state of each support are divided into four stages by three characteristic loads through applying M-K criteria, respectively elastic, elastic-plastic, plastic and failure stages, and the mutation characteristics around these characteristic loads are similar to the narrative in Section 5.1, which would not be repeated here. In addition, under the same load, the larger the wall thickness or diameter is, the lower the GSED values keep, indicating that the increase of the section size or wall thickness could improve the bearing capacity of the supports to some extent. As well, the supports have small difference of section parameters, they have similar GSED values at the same type of characteristic load, namely 0.65 × 10³ J/m3 at load L, 2.1 × 10³ J/m3 at load Q and 5.5 × 10³ J/m3 at load R (updated failure load), which reflects the stability of determination for characteristic loads. However, GSED values of each support vary a lot at the ultimate load, revealing a certain uncertainty of the ultimate load determined by the existing method. The common mutation characteristics and GSED values could also prove the efficiency of adopting characteristic parameter GSED to analyze these supports and the rationality of M-K criteria.

6.2. Stress Fields of the Different Supports

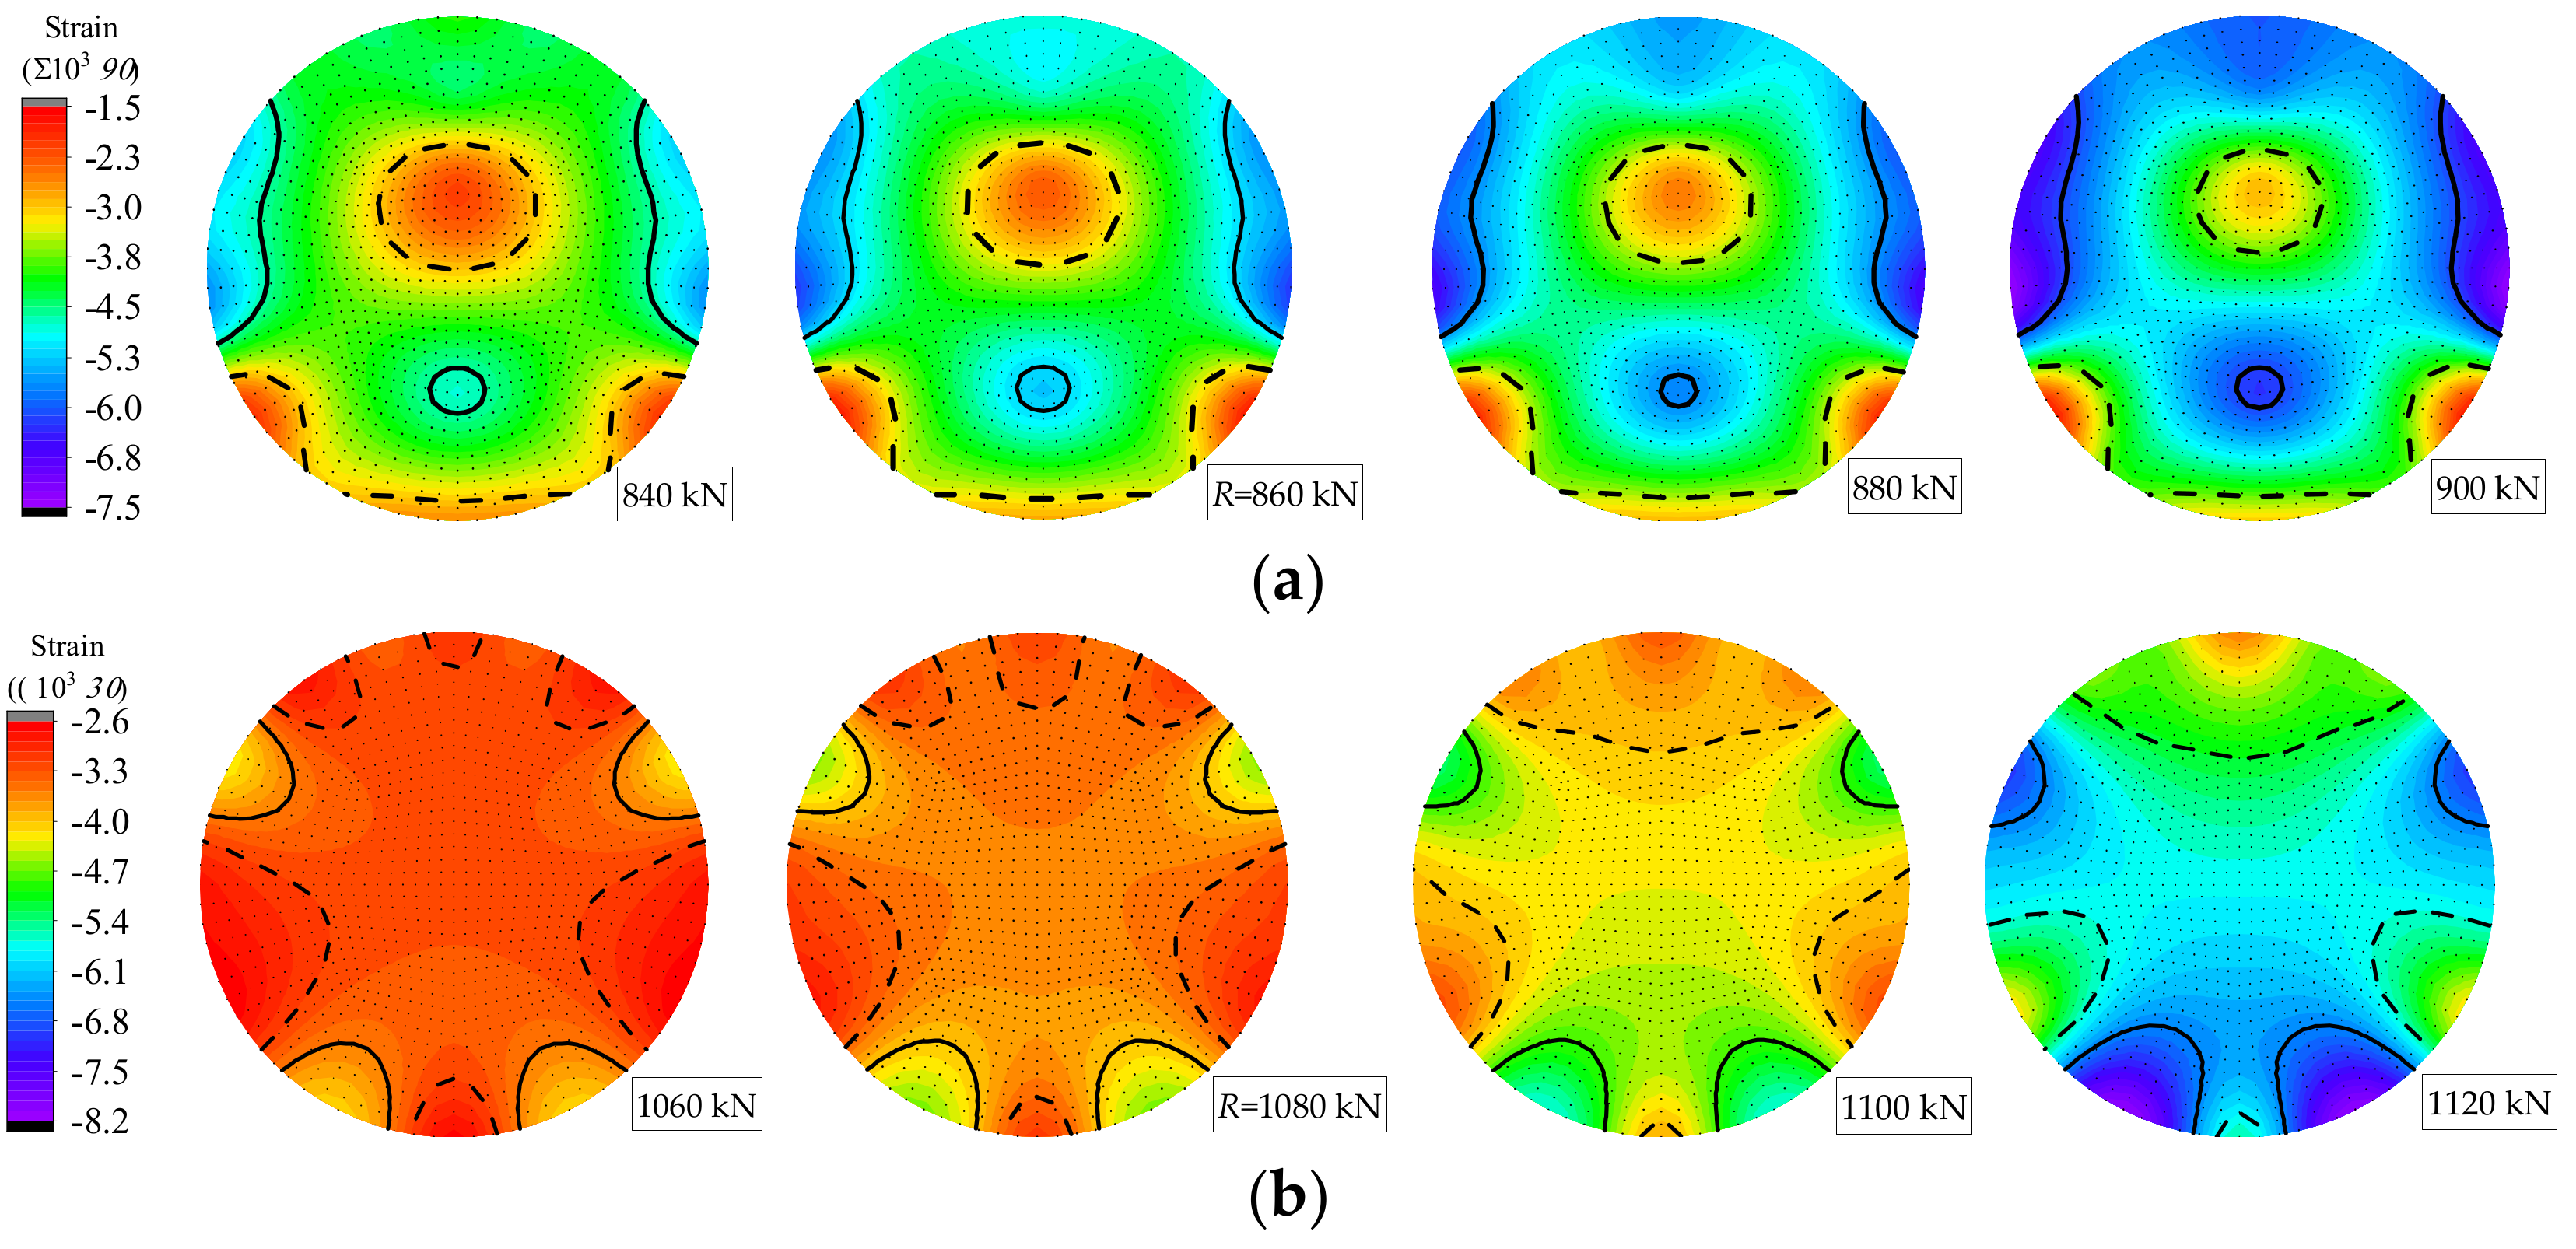
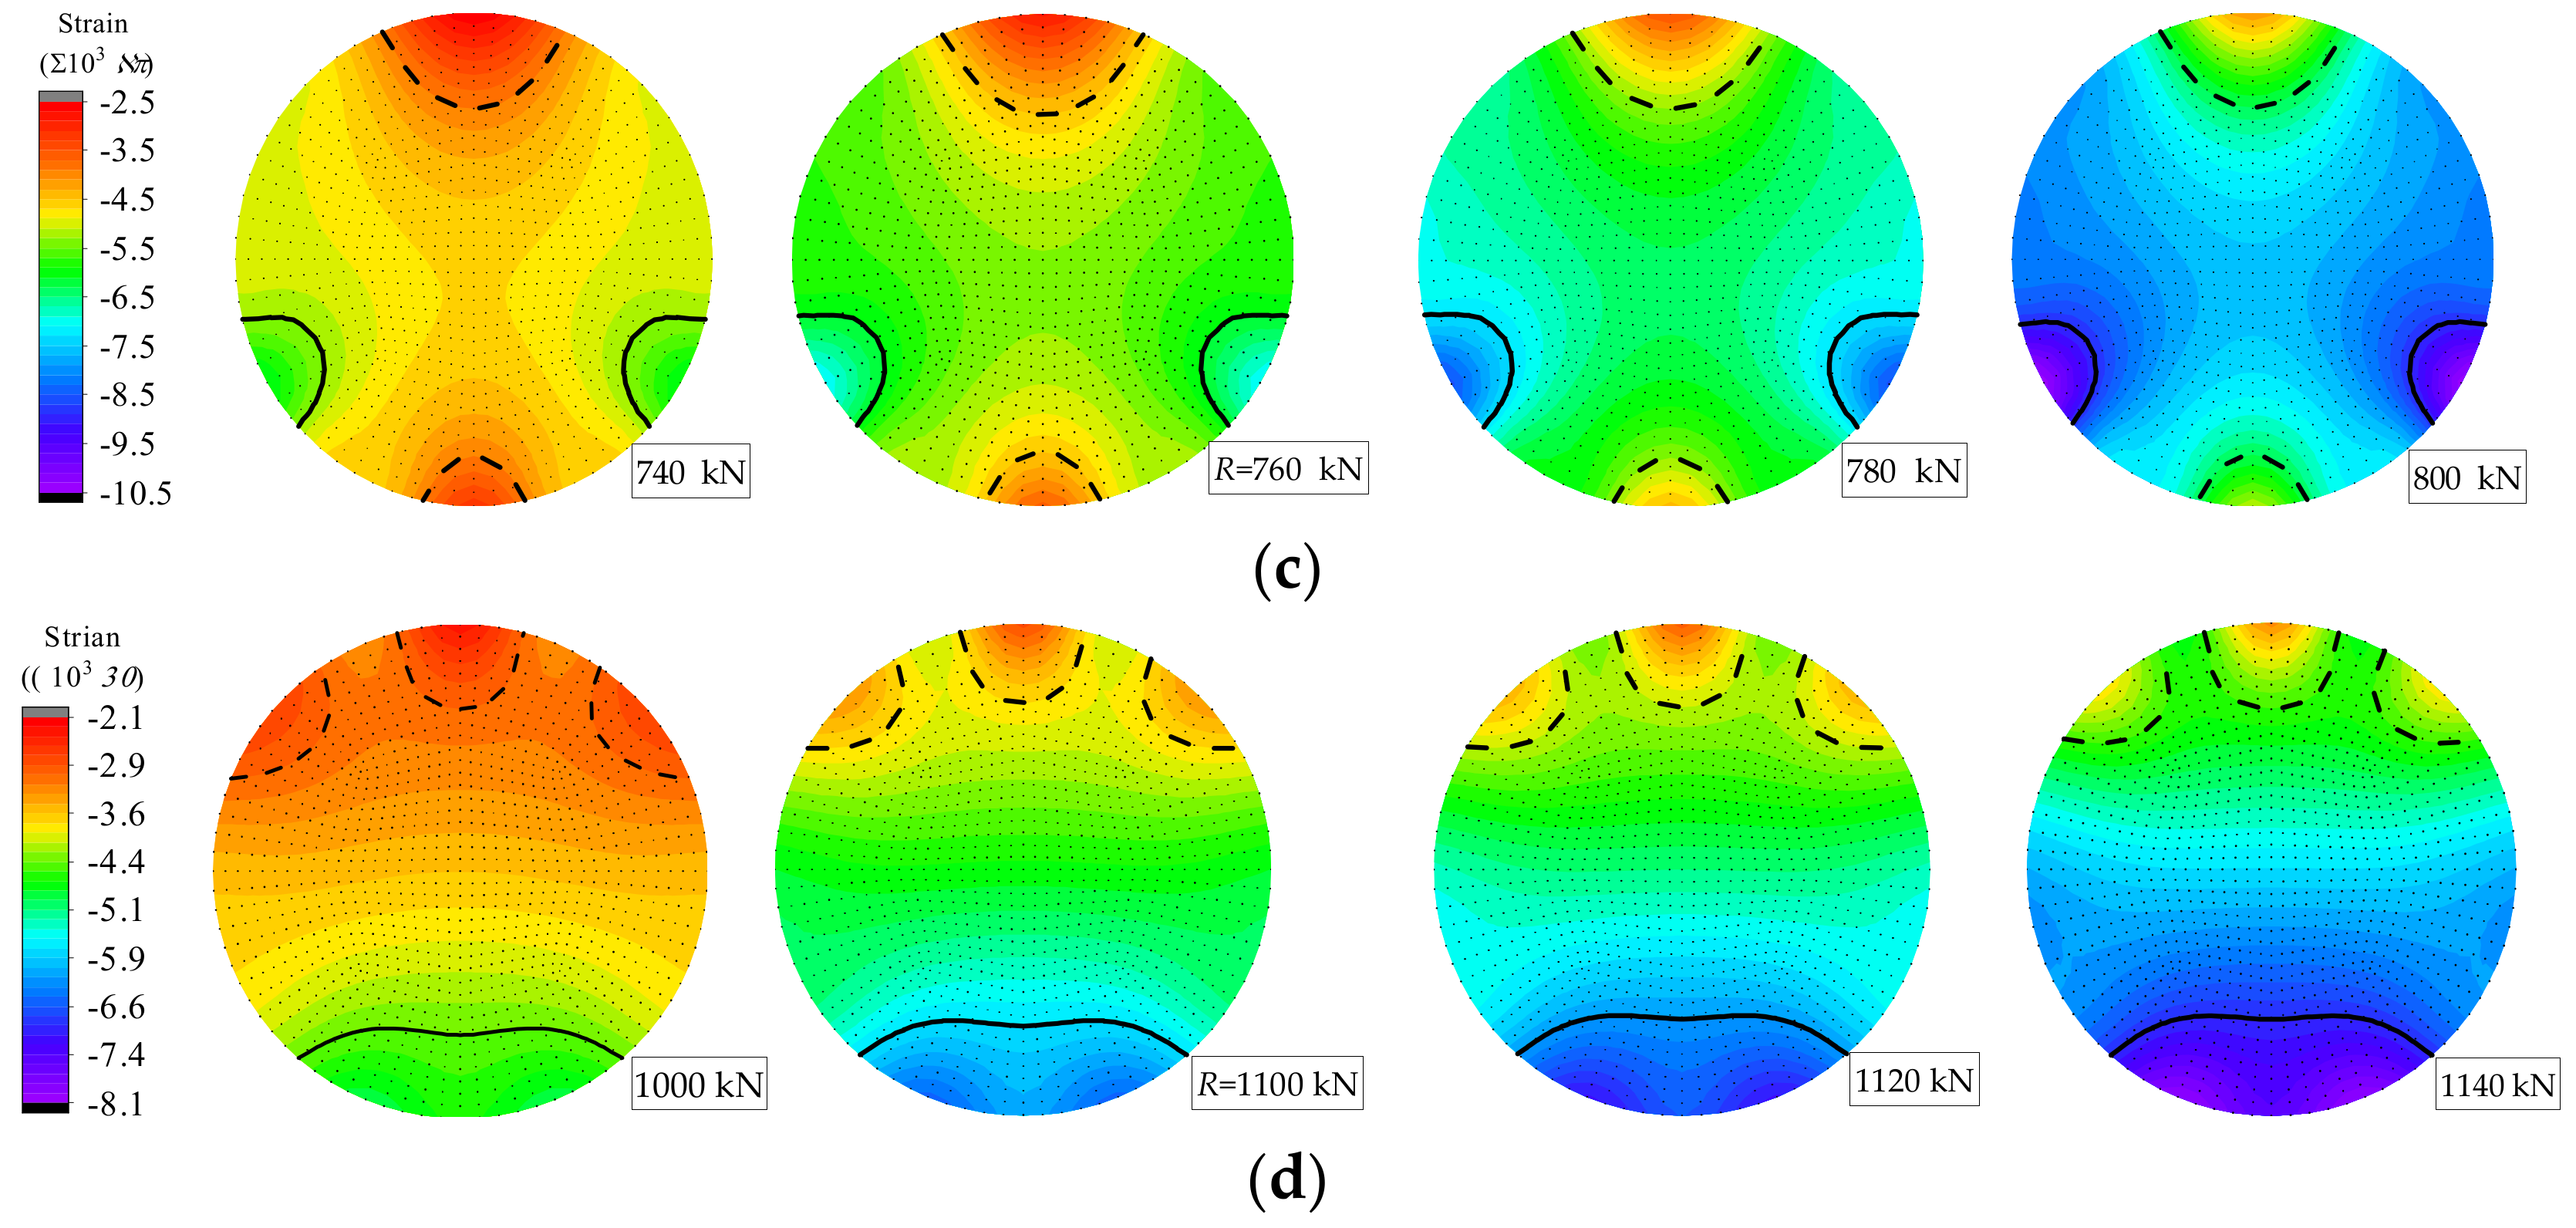
In order to investigate the common sectional damage characteristics of the different CFST arch supports, their strain fields of core concrete around their respective characteristic load R are plotted in Figure 11 and the areas surround by continuous and dash lines are respectively on behalf of the maximum and minimum damage parts on the sections. It could be observed that each support emerges completely different damage forms, manifesting the different degrees of damage at different parts, which may be caused by manufacturing and testing errors or initial defects in materials and structures. However, with the increase of load, the maximum and minimum damage parts (the maximum and minimum strain locations) and its quantity would not change for all the support, and the phenomena exists in the whole loading process, indicating that the errors or initial defects would play a decisive role in the distribution of damage parts for the supports to some extent. Besides, the degree of the maximum damage parts would develop quickly, presenting the rapid change of color, but on the contrary that of the minimum ones maintain increasing slowly even invariably. Hence, compared with other parts the maximum damage parts should be paid more attention in the damage monitoring. As for strain fields of steel tube and the stress fields of core concrete for the supports, the sectional changing characteristics are similar, which would not be repeated here.

6.3. Internal Forces of the Different Supports

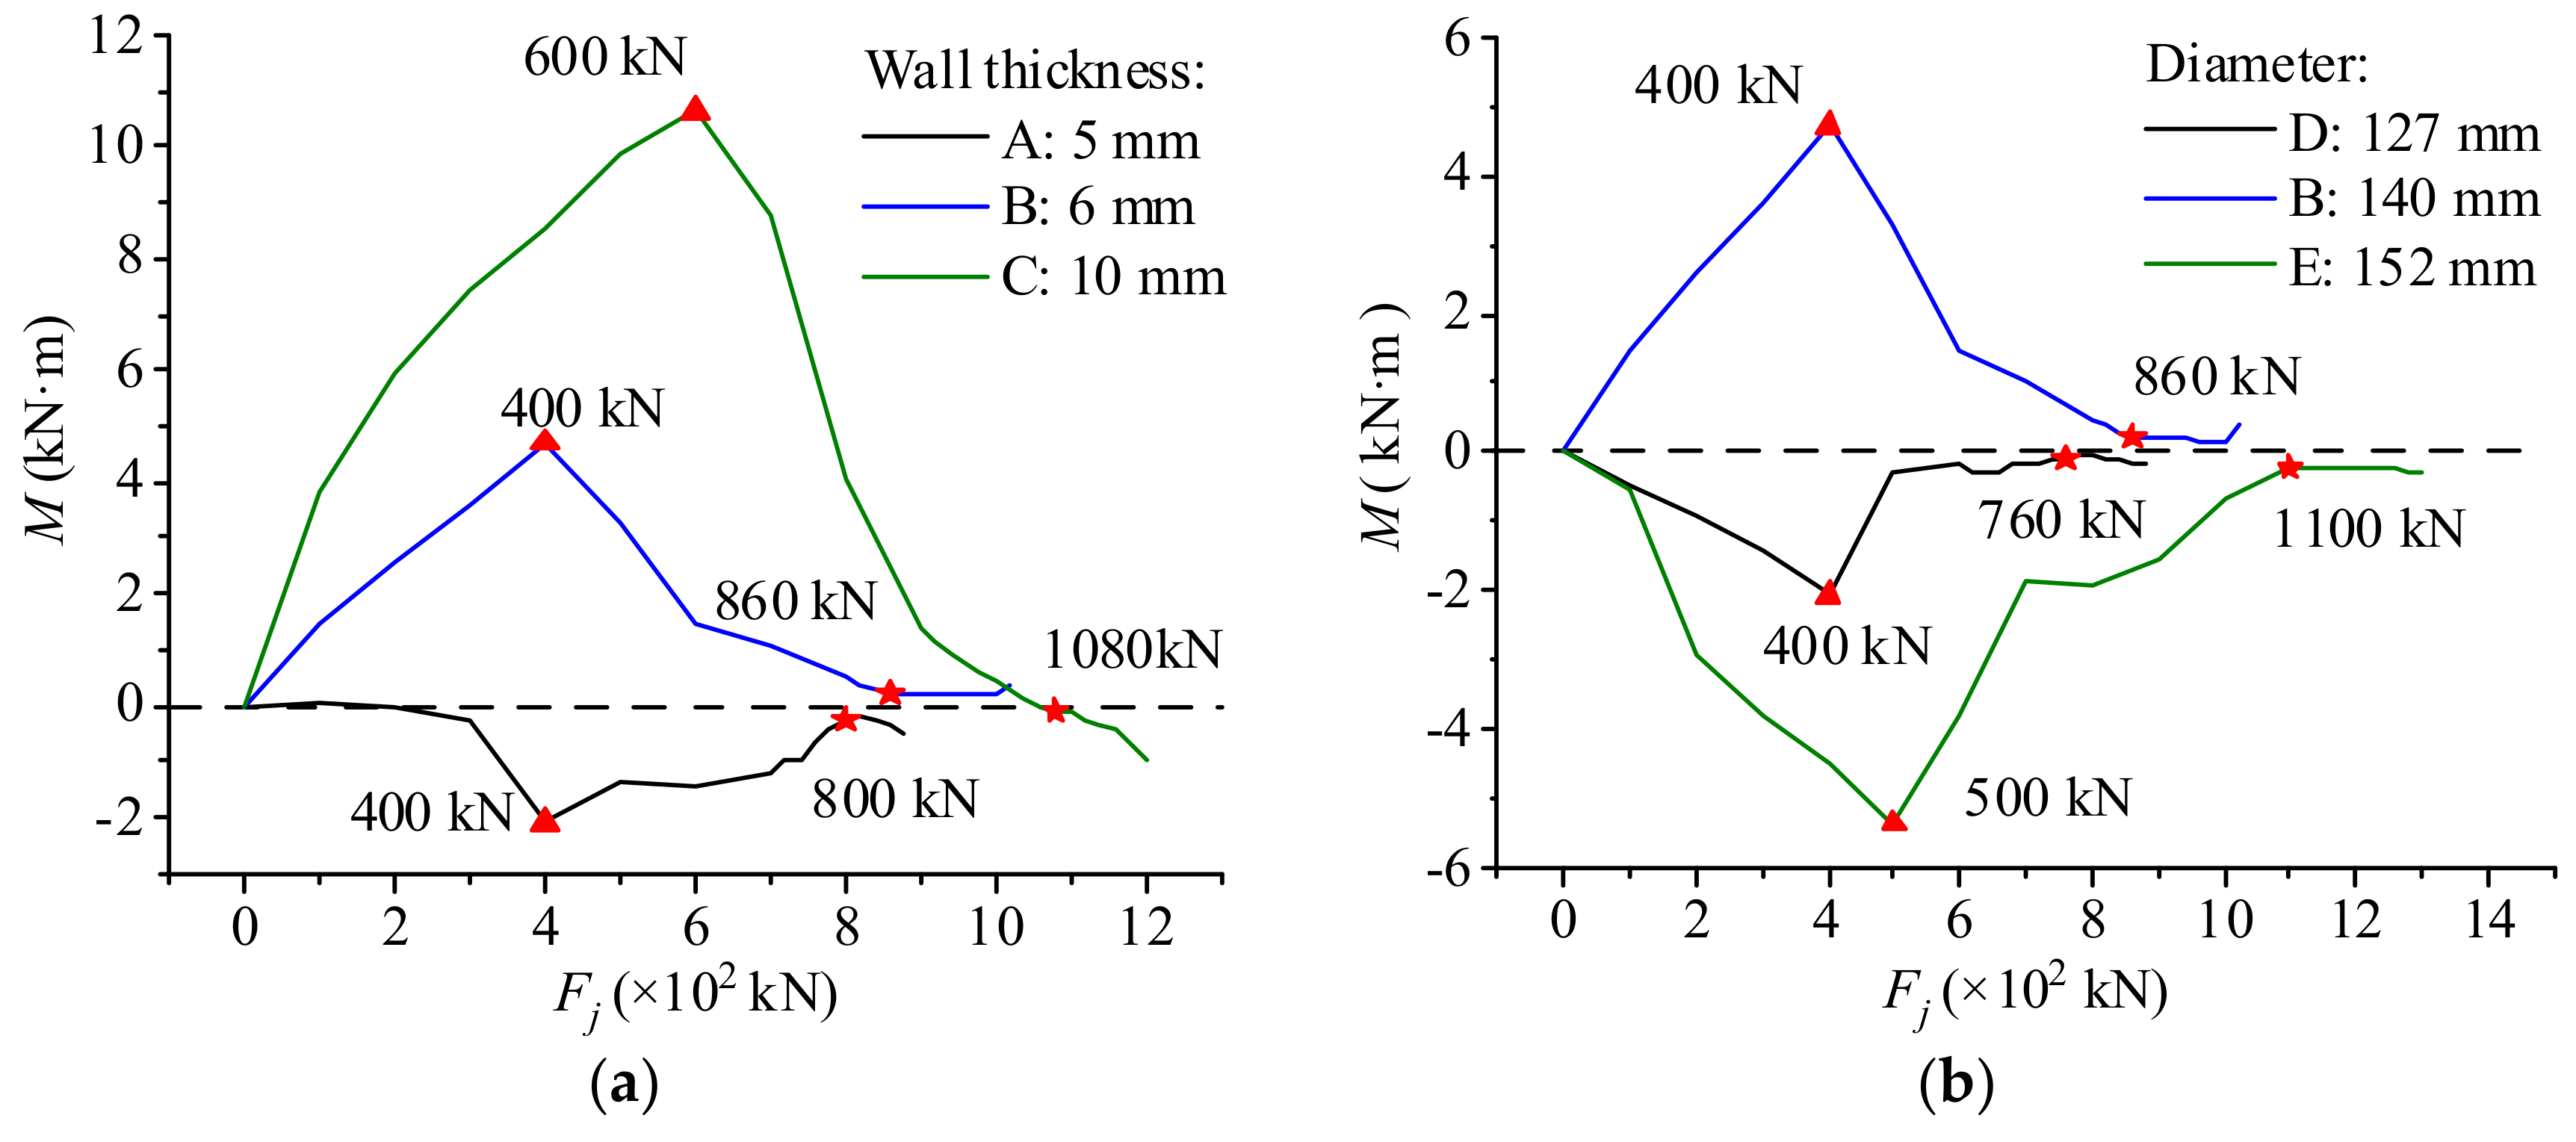
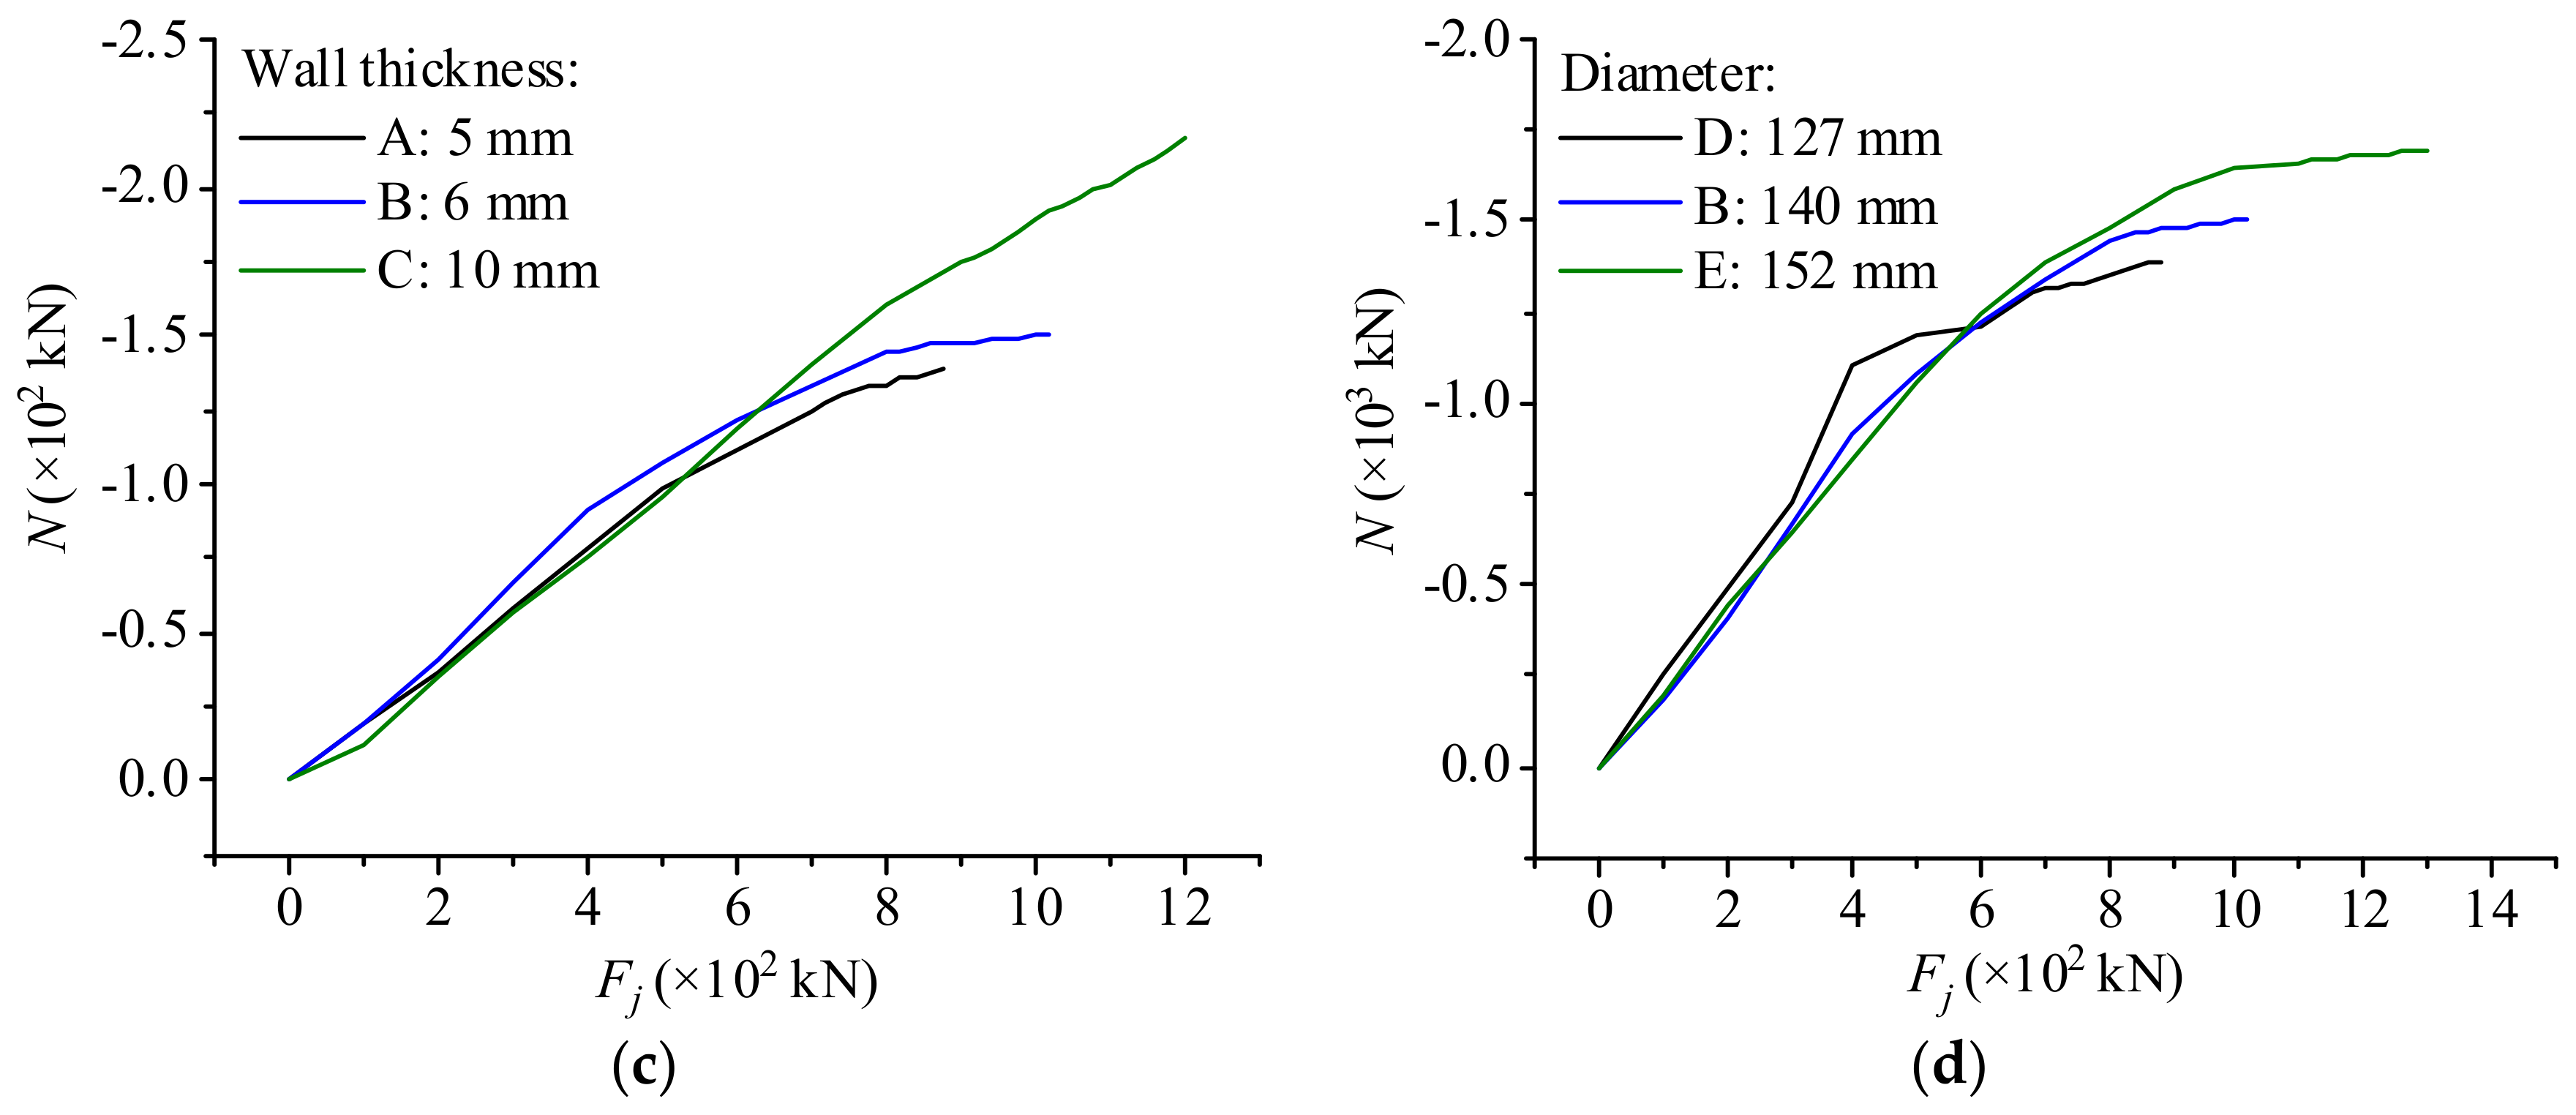
Based on the NSF method, the internal forces, including in-plan bending moment and axial force, could be obtained by Equations (12) and (13). It can be seen in Figure 12a,b that under the given load, different supports emerge in-plane bending moment with different signs, namely positive or negative bending moment, which probably caused by manufacturing or loading errors, etc. While there still exist common mechanical characteristics for different supports. The largest in-plane bending moments of the supports occur at their characteristic load L and then the bending moments begin to decrease. After their characteristic load R, the trends of all the curves change into other ones, hence the stressing state of the supports varies before and after the characteristic loads indeed. The axial forces of the supports are shown in Figure 12c,d. The values of all the axial forces are similar under the same load and increase more and more slowly with the growth of load.

7. Conclusions

The investigation into the working behavior of five CFST arch supports with different section parameter are carried out based on the NSF method and structural stressing state theory, revealing the changing characteristics and unseen knowledge under the six-point radical uniformly distributed loads.
With the application of the NSF method, the experimental data can be rationally expanded to estimate the physical quantities of the unsampled locations. Based on the expanded strain data, the GSED values are constructed to model structural stressing state and reveal the changing characteristics of supports during the whole loading process. Then the M-K criterion are used in the Ej,norm-Fj curve of supports-A to detect three characteristic loads and the stressing state of the support are divided into four stages, respectively elastic, elastic-plastic, plastic and failure stage. The characteristic load R (qualitative mutation load) is defined as the updated failure load, signifying the starting points in the process of the support’s failure. Besides, the effectivity and rationality of the M-K criterion are verified through the analyses of strain-based stressing state modes as well as strain and stress fields.
By comparison of the supports with different section parameters, the supports have similar GSED values at the same type of characteristic load, reflecting the stability for the determination of the characteristic loads, unlike the ultimate loads. Due to manufacturing and testing errors or initial defects in materials and structures, they have much difference in the distribution of strain and stress fields and the signs of internal forces, while the characteristics of the sectional damage development and changing trends of internal forces are nearly the same.
In a word, the analysis of the supports’ stressing state explores a new way to the working behavior of underground structure, and the unseen knowledge could promote engineering practice and the improvement of structural design.

Author Contributions

Formal analysis, J.S. (Jiyang Shen), and W.H.; investigation J.S. (Jiyang Shen), W.H. and X.Y.; methodology: J.S. (Jun Shi) and K.Z.; writing—original draft: J.S. (Jiyang Shen) and W.H.; writing—review and editing: J.S. (Jun Shi).

Funding

This research was funded by Natural Science Foundation of Hubei Province, grant number 2018CFB203.

Acknowledgments

This work was financially supported by the Natural Science Foundation of Hubei Province (Grant No. 2018CFB203) The authors would like to express their gratitude to Xiaosheng He for carrying out the excellent CFST arch supports experiment and giving the experimental data in detail in his dissertation theory. The authors would also like to thank the members of the HIT 504 office for their selfless help and useful suggestions.

Conflicts of Interest

The authors declare no conflict of interest.

References

  1. Li, G.F.; Tao, Z.G.; Guo, H.Y.; Qi, P.; Guo, Z.B. Stability control of a deep shaft insert. Int. J. Min. Sci. Technol. 2010, 20, 491–498. [Google Scholar] [CrossRef]
  2. Yin, L.J.; Gong, Q.M.; Zhao, J. Study on rock mass boreability by TBM penetration test under different in situ stress conditions. Tunn. Undergr. Space Technol. 2014, 43, 413–425. [Google Scholar] [CrossRef]
  3. Lim, A.; Ou, C.Y. Stress paths in deep excavations under undrained conditions and its influence on deformation analysis. Tunn. Undergr. Space Technol. 2017, 63, 118–132. [Google Scholar] [CrossRef]
  4. Cai, Y.; Esaki, T.; Jiang, Y. An analytical model to predict axial load in grouted rock bolt for soft rock tunnelling. Tunn. Undergr. Space Technol. 2004, 19, 607–618. [Google Scholar] [CrossRef]
  5. Gang, L.; Long, J.K.; Cai, H.D.; Li, Y. Design method of synergetic support for coal roadway. Procedia Earth Planet. Sci. 2009, 1, 524–529. [Google Scholar] [CrossRef] [Green Version]
  6. Jiao, Y.Y.; Song, L.; Wang, X.Z.; Adoko, C.A. Improvement of the U-shaped steel sets for supporting the roadways in loose thick coal seam. Int. J. Rock Mech. Min. 2013, 60, 19–25. [Google Scholar] [CrossRef]
  7. Ding, F.X.; Liu, J.; Liu, X.M.; Yu, Z.W.; Li, D.W. Mechanical behavior of circular and square concrete filled steel tube stub columns under local compression. Thin Walled Struct. 2015, 94, 155–166. [Google Scholar] [CrossRef] [Green Version]
  8. Wu, X.; Liu, C.; Wang, W.; Wang, Y. In-plane strength and design of fixed concrete-filled steel tubular parabolic arches. J. Bridge Eng. 2015, 20, 04015016. [Google Scholar] [CrossRef]
  9. Liu, Y.; Wang, D.; Zhu, Y.Z. Analysis of ultimate load-bearing capacity of long-span cfst arch bridges. Appl. Mech. Mater. 2011, 90–93, 1149–1156. [Google Scholar] [CrossRef]
  10. Pi, Y.L.; Liu, C.; Bradford, M.A.; Zhang, S. In-plane strength of concrete-filled steel tubular circular arches. J. Constr. Steel Res. 2012, 69, 77–94. [Google Scholar] [CrossRef]
  11. Lan, T.; Qin, G.; Zhuang, J.; Wang, Y.; Zheng, Q.; Ding, M. Axial Impact Load of a Concrete-Filled Steel Tubular Member with Axial Compression Considering the Creep Effect. Materials 2019, 12, 3134. [Google Scholar] [CrossRef] [PubMed]
  12. Lin, P.; Liu, H.; Zhou, W. Experimental study on failure behaviour of deep tunnels under high in-situ stresses. Tunn. Undergr. Space Technol. 2015, 46, 28–45. [Google Scholar] [CrossRef]
  13. Wang, Q.; Pan, R.; Jiang, B.; Li, S.C.; He, M.C.; Sun, H.B.; Wang, L.; Qin, Q.; Yu, H.C.; Luan, Y.C. Study on failure mechanism of roadway with soft rock in deep coal mine and confined concrete support system. Eng. Fail. Anal. 2017, 81, 155–177. [Google Scholar] [CrossRef]
  14. Yang, R.S.; Li, Y.L.; Guo, D.M.; Yao, L.; Yang, T.M.; Li, T.T. Failure mechanism and control technology of water-immersed roadway in high-stress and soft rock in a deep mine. Int. J. Min. Sci. Technol. 2017, 27, 245–252. [Google Scholar] [CrossRef]
  15. Zang, D.S.; Li, A.Q. Study on concrete-filled steel tube supports. Chin. J. Geotech. Eng. 2001, 23, 342–344. (In Chinese) [Google Scholar] [CrossRef]
  16. Gao, Y.F.; Wang, B.; Wang, J.; Li, B.; Xing, F.; Wang, Z.G.; Jin, T.L. Test on structural property and application of concretefilled steel tube support of deep mine and soft rock roadway. Chin. J. Rock Mech. Eng. 2019, 29, 2604–2609. (In Chinese) [Google Scholar]
  17. Wei, J.J.; Jiang, B.S. Experimental study on structural property of contractible concrete-filled steel tube support. J. Min. Saf. Eng. 2013, 30, 805–811. (In Chinese) [Google Scholar]
  18. Li, X.B.; Yang, R.S.; Gao, Y.F.; Xue, H.J. Study on combined support technology of bolt-mesh-shotcrete and concrete filled steel tubular supports for soft rock roadway in Yangzhuang mine. J. Min. Saf. Eng. 2015, 32, 285–290. (In Chinese) [Google Scholar] [CrossRef]
  19. Qu, G.L.; Gao, Y.F.; Yang, L.; Xu, B.J.; Liu, G.L.; Meng, D.J. Strength assessments of concrete-filled steel tubular support of soft rock roadway. Adv. Mater. Res. 2013, 838–841, 1884–1890. [Google Scholar] [CrossRef]
  20. Chang, X.; Luo, X.L.; Zhu, C.X.; Tang, C.A. Analysis of circular concrete-filled steel tube (CFT) support in high ground stress conditions. Tunn. Undergr. Space Technol. 2014, 43, 41–48. [Google Scholar] [CrossRef]
  21. Zhang, W.; Li, W.; Yang, N.; Wang, Q.; Li, T.; Wang, G. Determination of the bearing capacity of a concrete-filled steel tubular arch support for tunnel engineering: Experimental and theoretical studies. KSCE J. Civ. Eng. 2017, 21, 2932–2945. [Google Scholar] [CrossRef]
  22. Huang, W.P.; Yuan, Q.; Tan, Y.L.; Wang, J.; Liu, G.L.; Qu, G.L.; Li, C. An innovative support technology employing a concrete-filled steel tubular structure for a 1000-m-deep roadway in a high in situ stress field. Tunn. Undergr. Space Technol. 2018, 73, 26–36. [Google Scholar] [CrossRef]
  23. Zhang, J.P.; Liu, L.M. R&d and application of curved d-shape concrete-filled steel tube support in roadway support. Geotech. Geol. Eng. 2017, 36, 551–566. [Google Scholar] [CrossRef]
  24. Zhang, J.P.; Liu, L.M.; Cao, J.Z.; Xu, Y.; Zhang, F.T. Mechanism and application of concrete-filled steel tubular support in deep and high stress roadway. Constr. Build. Mater. 2018, 186, 233–246. [Google Scholar] [CrossRef]
  25. Errandonea, D. Landau theory applied to phase transitions in calcium orthotungstate and isostructural compounds. Europhys. Lett. 2007, 77, 56001. [Google Scholar] [CrossRef]
  26. Liu, Y.; Cai, S. Gradients of Strain to Increase Strength and Ductility of Magnesium Alloys. Metals 2019, 9, 1028. [Google Scholar] [CrossRef]
  27. Ayers, P.W. Information theory, the shape function, and the hirshfeld atom. Theor. Chem. Acc. 2006, 115, 370–378. [Google Scholar] [CrossRef]
  28. Padhi, G.S.; Shenoi, R.A.; Moyb, S.S.J.; Mccarthya, M.A. Analytic integration of kernel shape function product integrals in the boundary element method. Comput. Struct. 2001, 79, 1325–1333. [Google Scholar] [CrossRef]
  29. Zhou, G.C.; Rafiq, M.Y.; Bugmann, G.; Easterbrook, D. A cellular automata model for predicting the failure pattern of laterally loaded masonry wall panels. J. Comput. Civ. Eng. 2009, 20, 400–409. [Google Scholar] [CrossRef]
  30. Zhou, G.C.; Pan, D.; Xu, X.; Rafiq, Y.M. An innovative ANN technique for predicting failure/cracking load of masonry wall panel under lateral load. J. Comput. Civ. Eng. 2010, 24, 377–387. [Google Scholar] [CrossRef]
  31. Zhang, Y.; Zhou, G.C.; Xiong, Y.; Rafiq, M.Y. Techniques for predicting cracking pattern of masonry wallet using artificial neural networks and cellular automata. J. Comput. Civ. Eng. 2010, 24, 161–172. [Google Scholar] [CrossRef]
  32. Marx, K.; Engels, F.; Lenin, I.V. Selections from Marx, Engles and Lenin’s Dialectics of Nature; Chinese People’s Publishing House: Beijing, China, 1980. (In Chinese) [Google Scholar]
  33. Huang, Y.; Yu, Z.; Liu, C.; Zhou, G.C. Method for predicting failure load of masonry wall panel based on generalized strain energy density. J. Eng. Mech. 2014, 140, 04014061. [Google Scholar] [CrossRef]
  34. Mann, H.B. Nonparametric tests against trend. Econometrica 1945, 13, 245–259. [Google Scholar] [CrossRef]
  35. Kendall, M.G.; Jean, D.G. Rank Correlation Methods; Oxford University Press: New York, NY, USA, 1990. [Google Scholar]
  36. Hirsch, R.M.; Slack, J.R.; Smith, R.A. Techniques of trend analysis for monthly water quality data. J. Water Resour. Res. 1982, 18, 107–121. [Google Scholar] [CrossRef] [Green Version]
  37. Fabio, R.; Luca, C.; Sergio, M. Predicting the flutter speed of a pedestrian suspension bridge through examination of laboratory experimental errors. Eng. Struct. 2018, 172, 589–613. [Google Scholar] [CrossRef]
  38. Zhong, S.T. The Concrete-Filled Steel Tubular Structures, 3rd ed.; Tsinghua University Press: Beijing, China, 2003; ISBN 7-302-07027-X. (In Chinese) [Google Scholar]
  39. Liu, W. Research on Mechanism of Concrete-Filled Steel Tubes Subjected to Local Compression. Ph.D. Thesis, Fuzhou University, Fuzhou, China, 2005. (In Chinese). [Google Scholar]
  40. Han, L.H. The Concrete-Filled Steel Tubular Structures—Theory and Practice, 2nd ed.; Science Press: Beijing, China, 2007; ISBN 978-7-03-018557-0. (In Chinese) [Google Scholar]
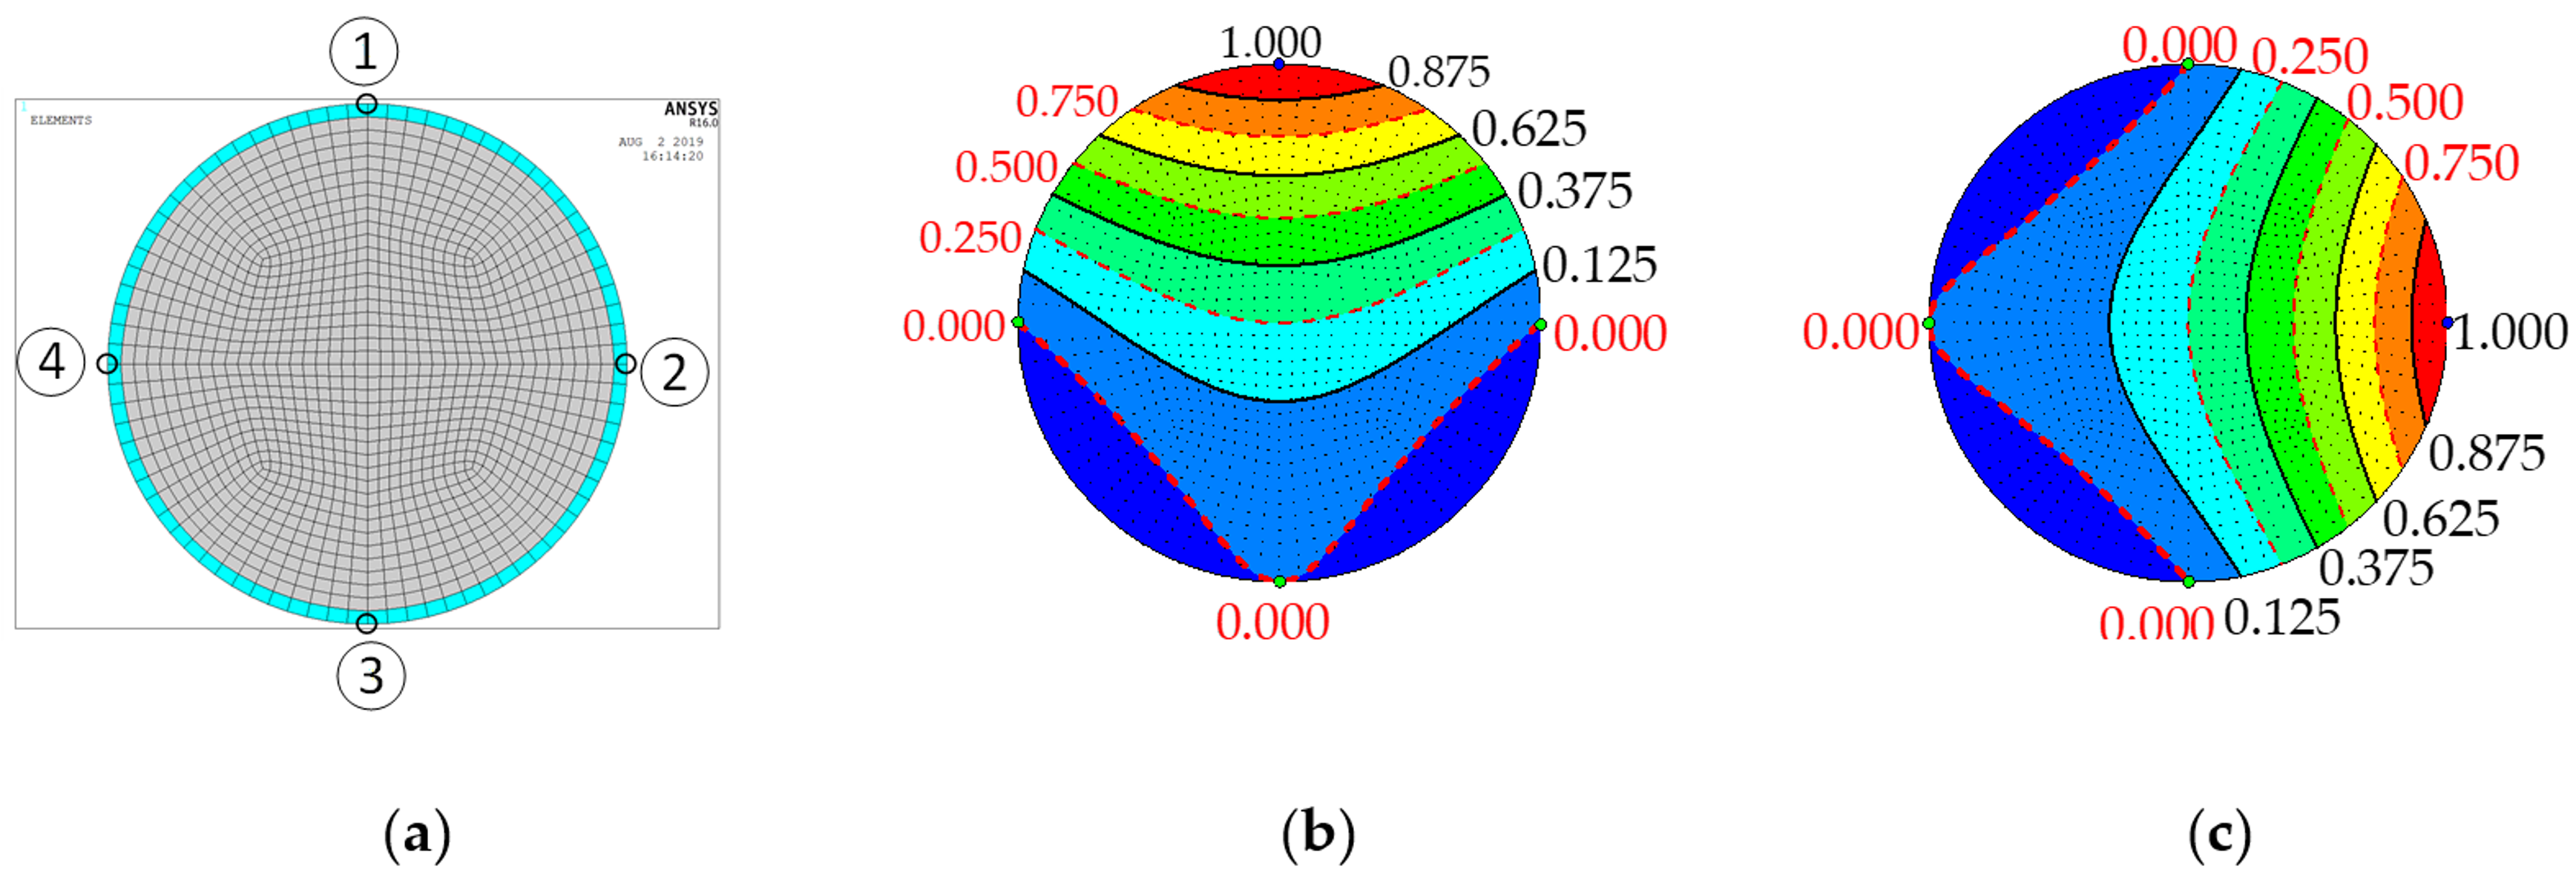
Figure 1. Finite element model and contour maps of numerical shape functions: (a) The square plate model; (b) shape function N1; (c) shape function N2.
Applsci 09 04238 g001
Figure 2. The arrangement of measured points on the mid-span sections.
Applsci 09 04238 g002
Figure 3. Loading apparatus.
Applsci 09 04238 g003
Figure 4. Restraint devices: (a) the restraint devices of the end; (b) the actual lateral devices; (c) the structure of the lateral devices.
Applsci 09 04238 g004
Figure 5. The comparison between experimental and interpolated strain of CFST arch support-D.
Applsci 09 04238 g005
Figure 6. The Ej,norm-Fj and M-K statistic curves of CFST arch support-A: (a) the Ej,norm-Fj curve of CFST arch support-A; (b) the M-K statistic curves of CFST arch support-A between 0 kN and 880 kN; (c) the M-K statistic curves of CFST arch support-A between 0 kN and 700 kN; (d) the M-K statistic curves of CFST arch support-A between 800 kN and 880 kN.
Applsci 09 04238 g006aApplsci 09 04238 g006b
Figure 7. The changing characteristics of strain-based stressing state modes: (a) The trend changing characteristics of strain-based stressing state modes during the whole loading process; (b) the trend changing characteristics of strain-based stressing state modes between 0 kN and 800 kN; (c) the distribution pattern changing characteristics of strain-based stressing state modes; (d) the increment changing characteristics of point 4 at level of 100 kN; (e) the increment changing characteristics of point 4 at level of 20 kN.
Applsci 09 04238 g007
Figure 8. The strain and stress fields around characteristic loads L and Q: (a) The strain fields of steel tube around loads L and Q; (b) the strain fields of core concrete around loads L and Q; (c) the stress fields of steel tube around loads L and Q.
Applsci 09 04238 g008
Figure 9. The strain and stress fields of around characteristic load R: (a) The strain fields of steel tube around load R; (b) the strain fields of core concrete around load R; (c) the stress fields of steel tube around load R.
Applsci 09 04238 g009
Figure 10. The Ej-Fj curves of the different supports: (a) The Ej-Fj curves of the supports with different wall thickness; (b) The Ej-Fj curves of the supports with different diameter.
Applsci 09 04238 g010
Figure 11. The strain fields of core concrete for different supports around their respective characteristic load R: (a) The strain fields of support-B around 860 kN; (b) the strain fields of support-C around 1080 kN; (c) the strain fields of support-D around 740 kN; (d) the strain fields of support-E around 1100 kN.
Applsci 09 04238 g011aApplsci 09 04238 g011b
Figure 12. The internal forces of the different supports: (a) The in-plane bending moments of the supports with different wall thickness; (b) the in-plane bending moments of the supports with different diameter; (c) the axial forces of the supports with different wall thickness; (d) the axial forces of the supports with different diameter.
Applsci 09 04238 g012aApplsci 09 04238 g012b