Sustainability Evaluation of Product Packaging System with a Three-Stage Network Data Envelopment Analysis Methodology

Abstract
1. Introduction
2. Terminology
2.1. Packaging Sustainability Indicator (PSI)
2.2. Environmental Efficiency
2.3. Impact Weight
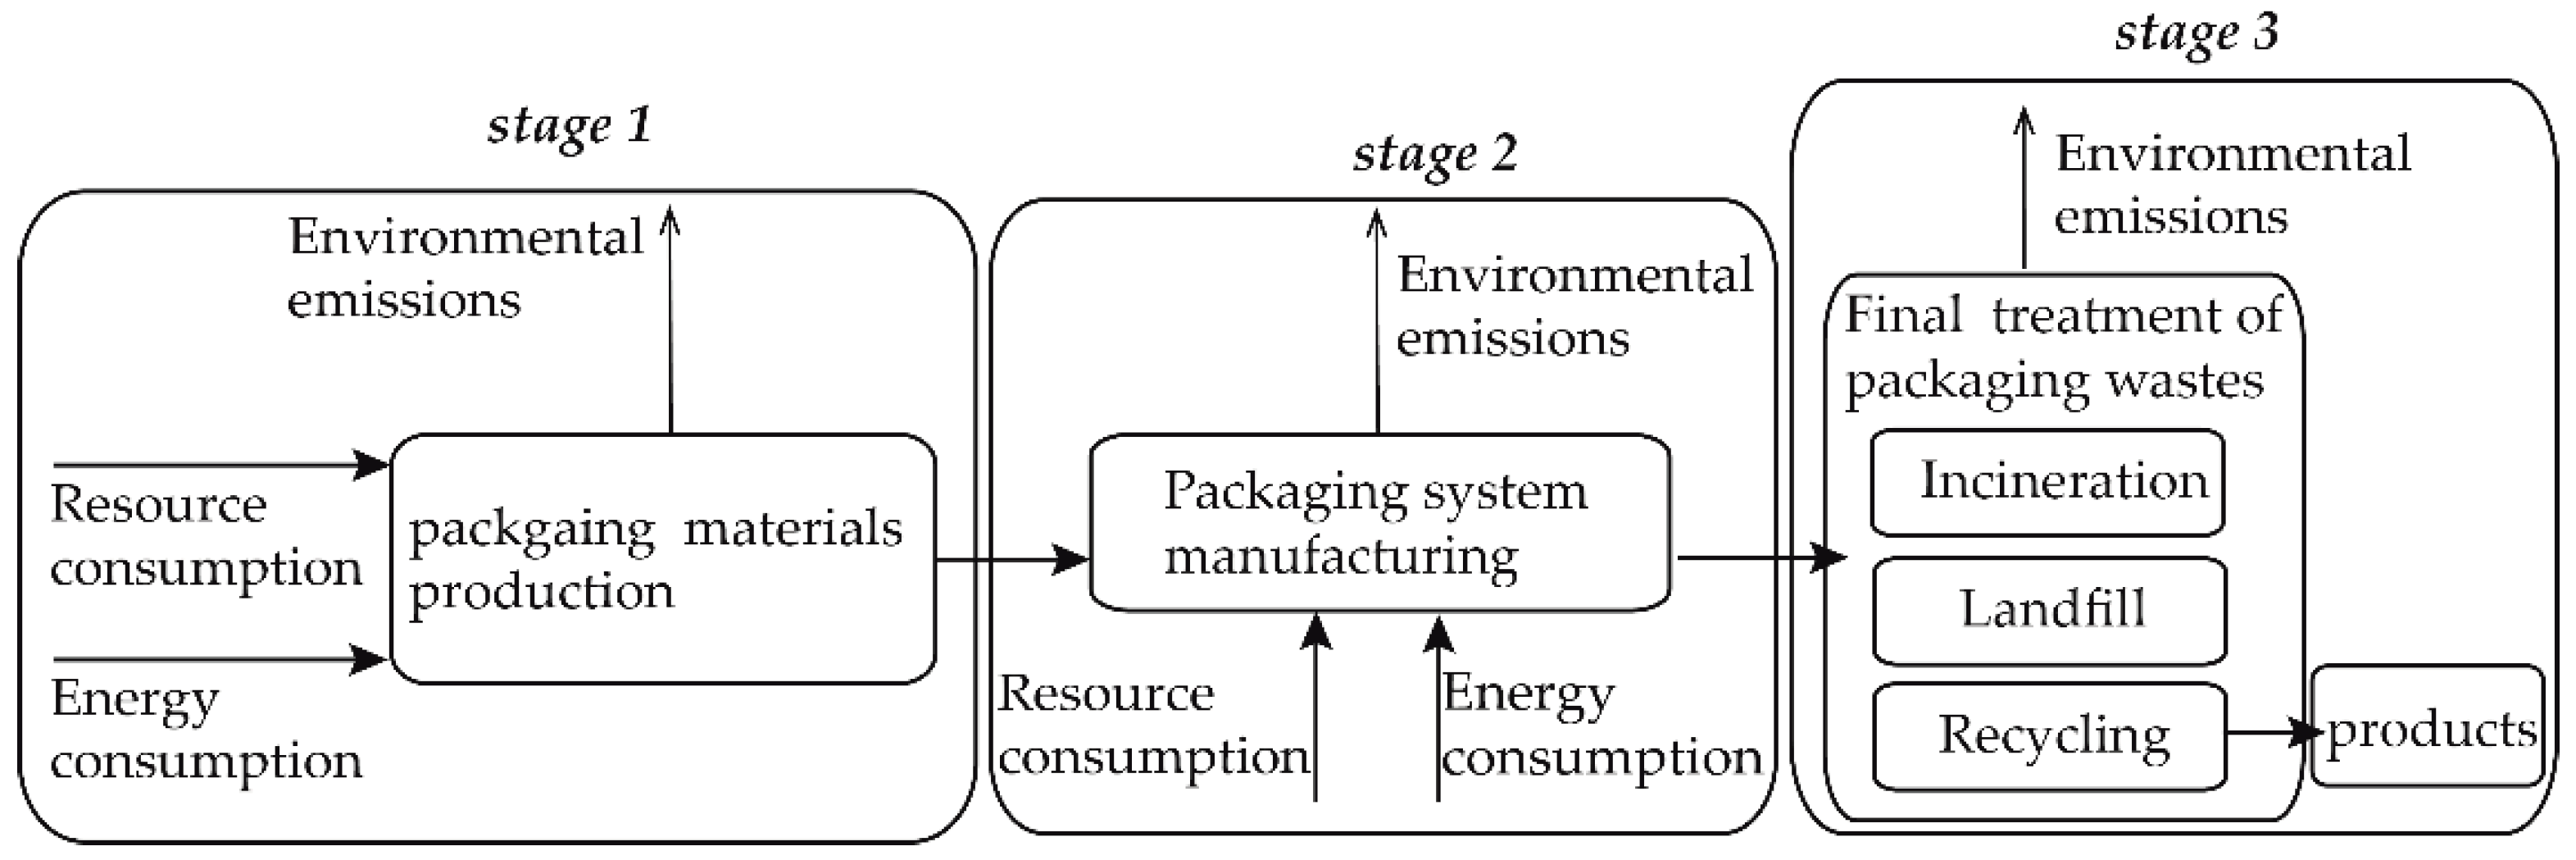
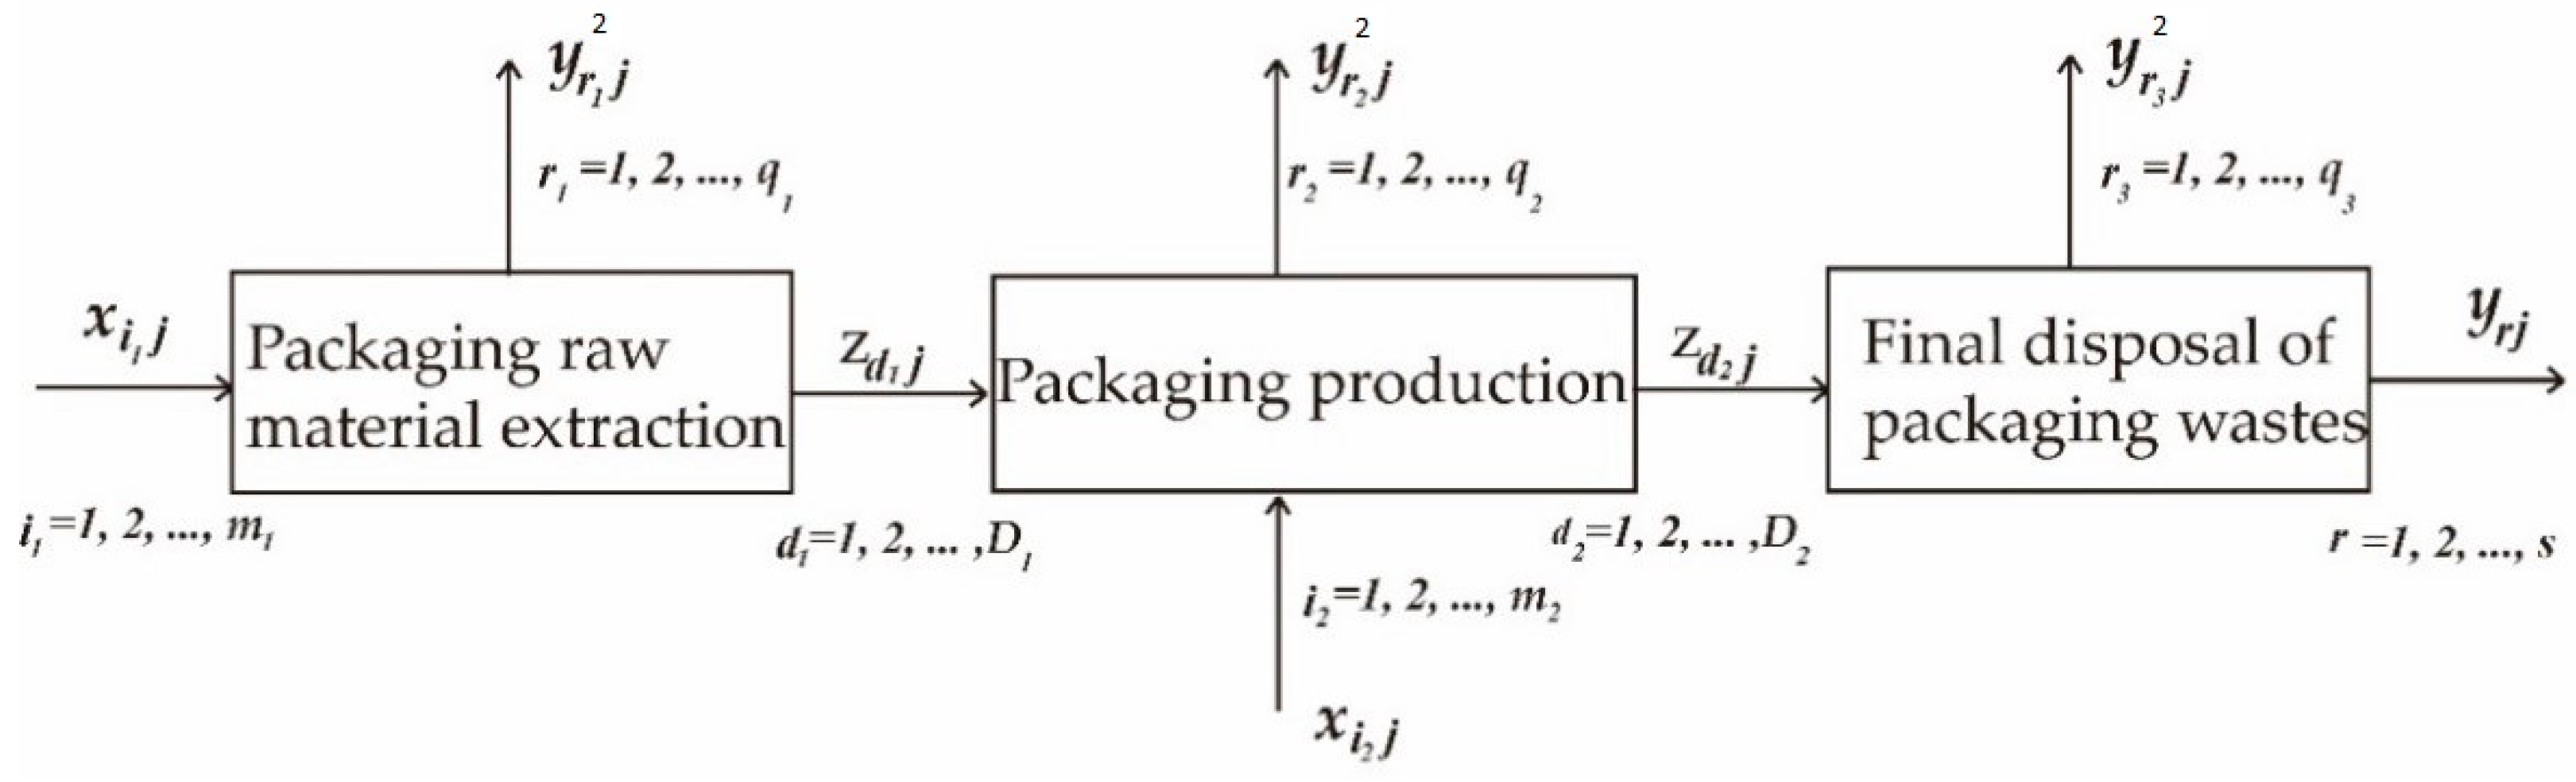
3. Modeling
3.1. Nomenclatures
3.2. Three-Stage Network DEA Model
3.3. Additive Three-Stage Network DEA Model
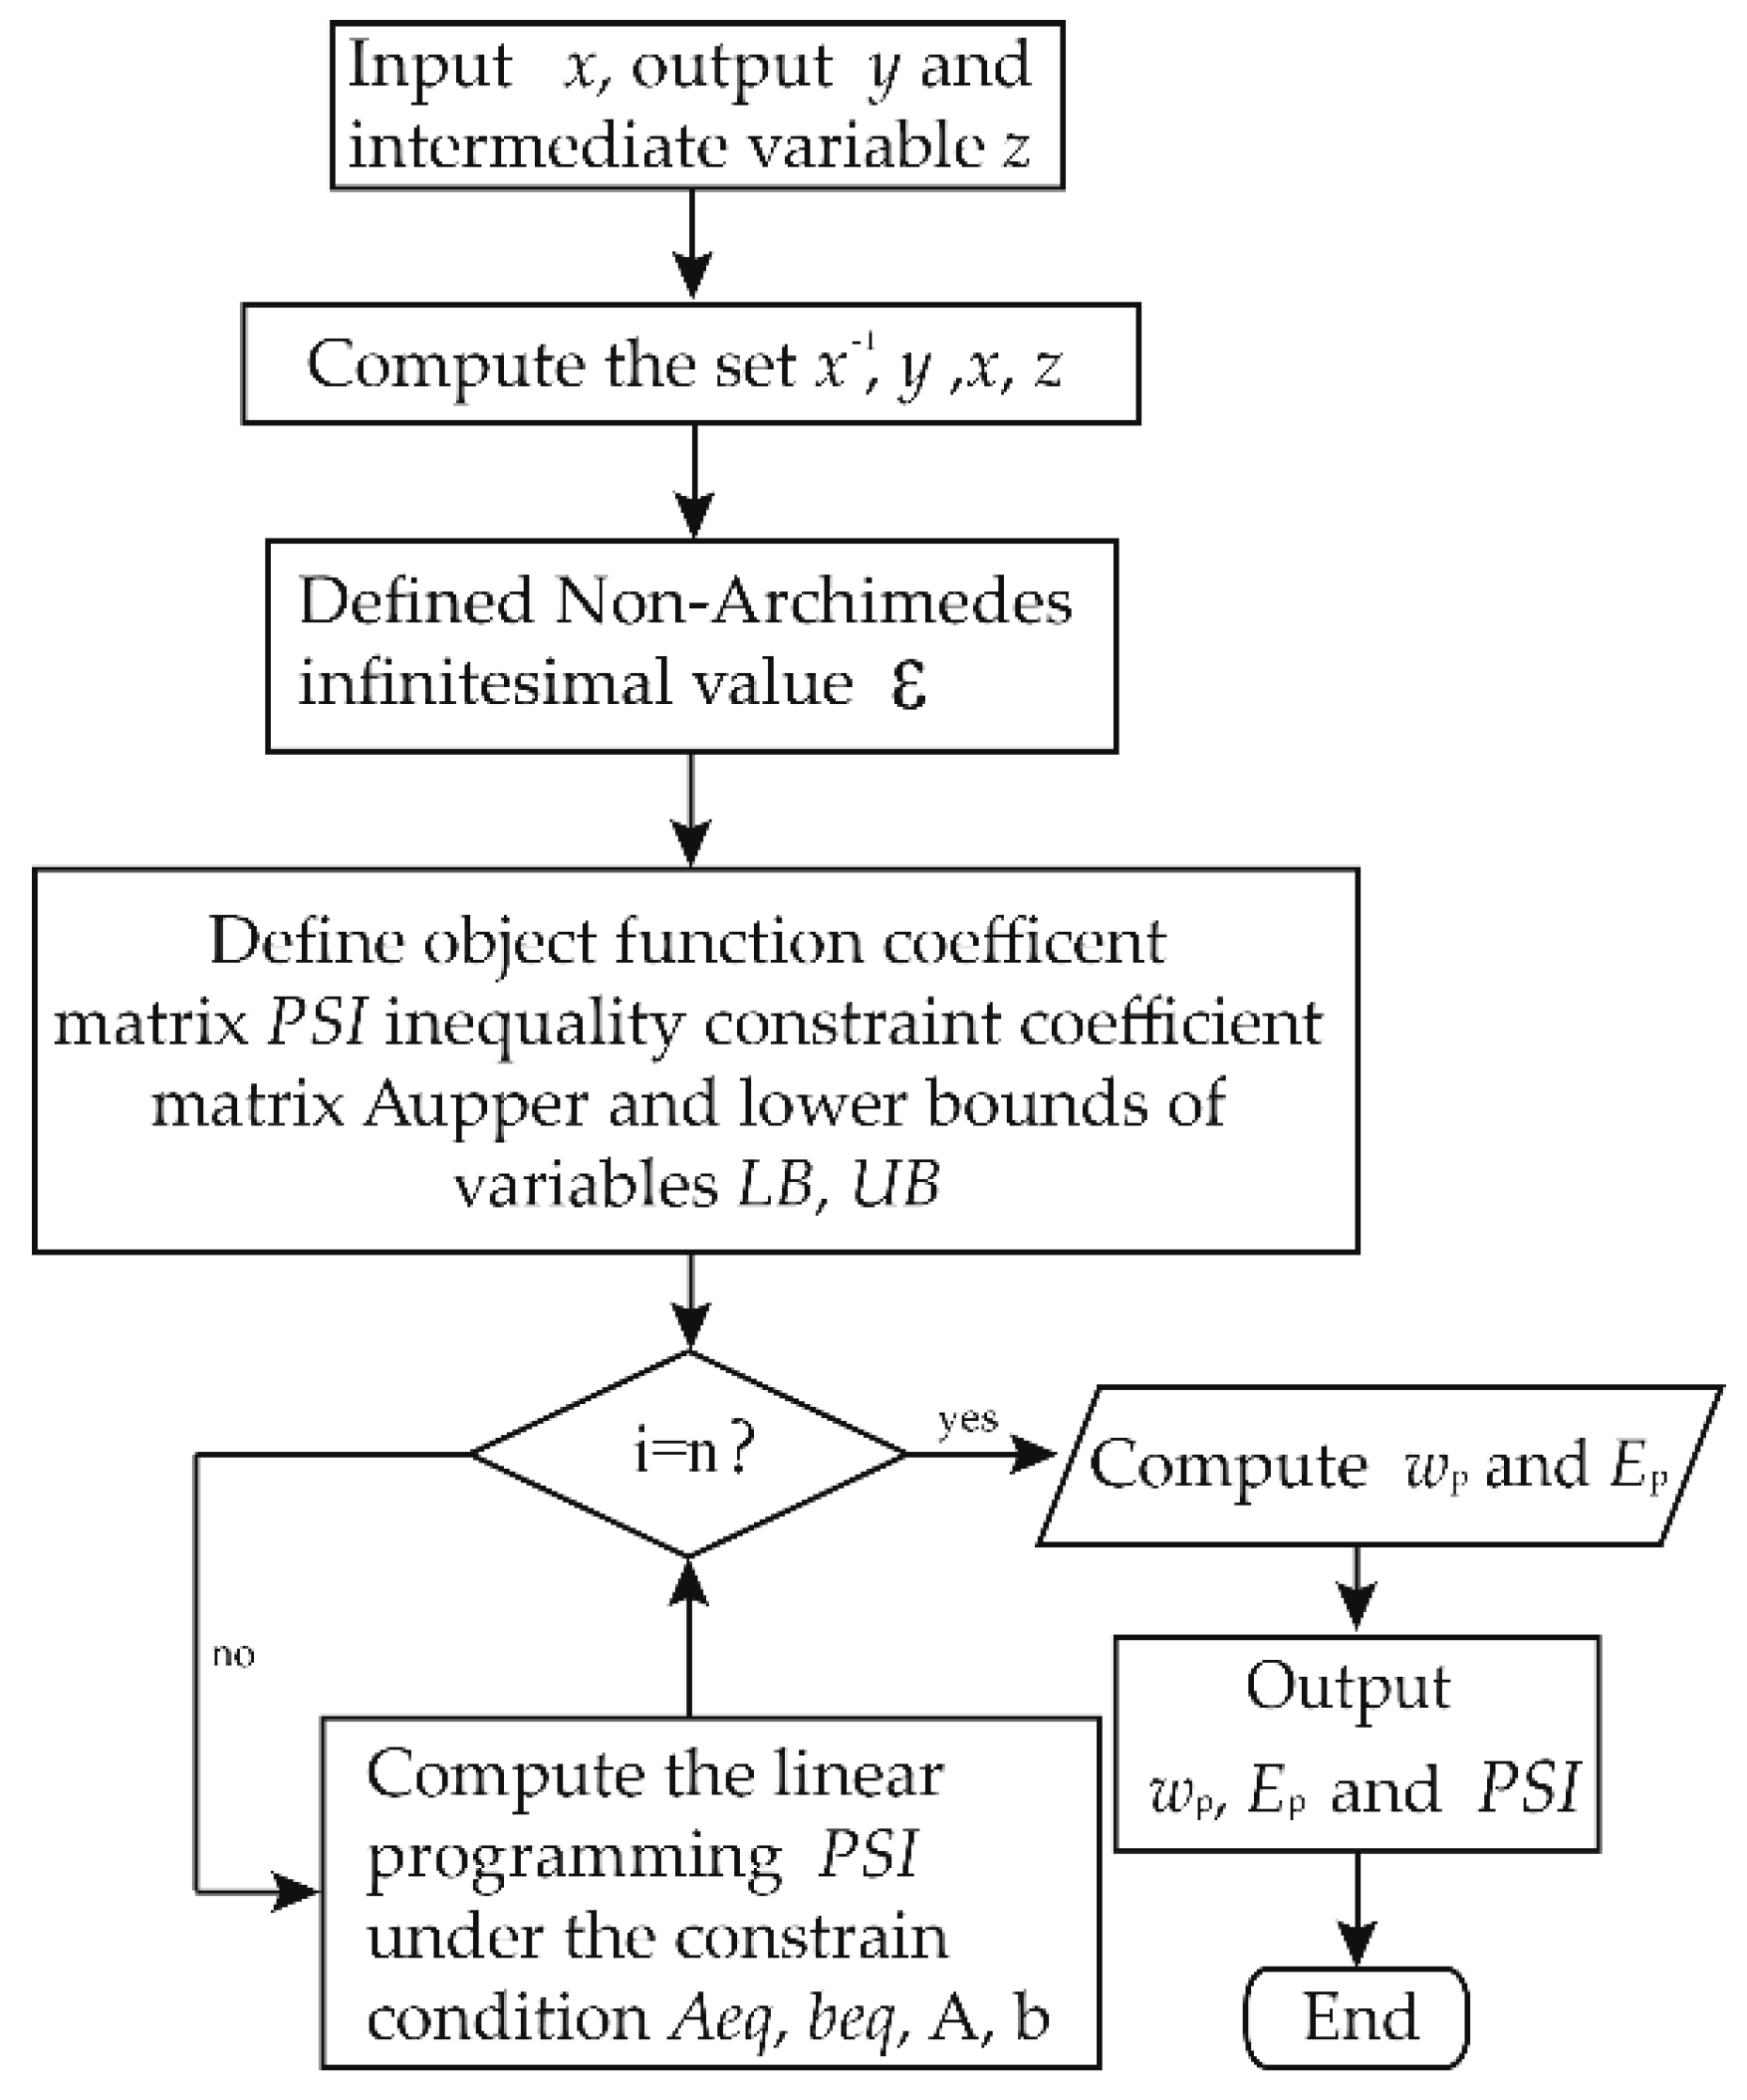
3.4. Solving the Model
4. Empirical Tests
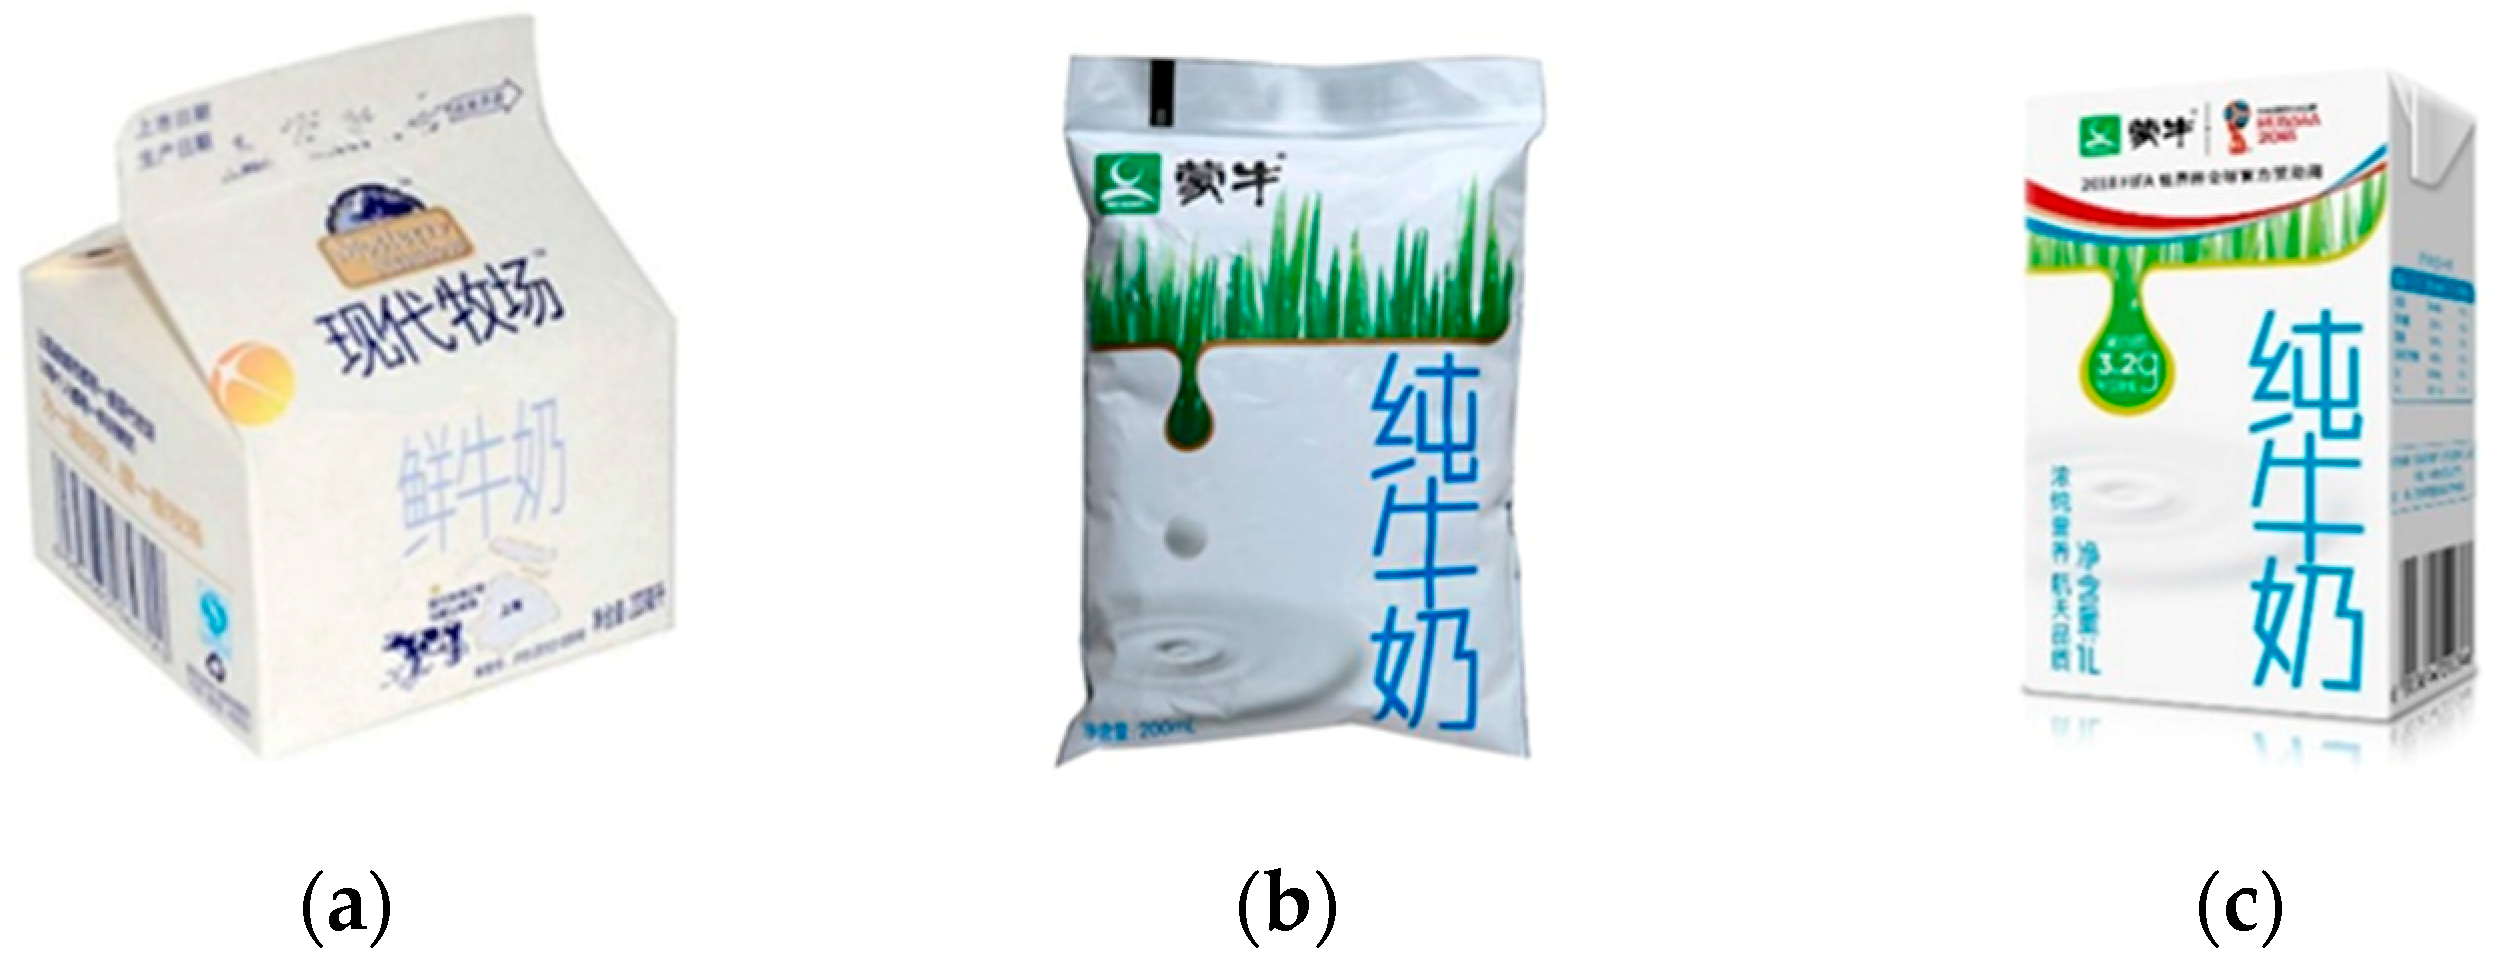
4.1. Materials
4.2. Input Data
4.3. Output Data
- In first phase, CO2 emissions is denoted as (j = 1, 2, 3, 4, 5);
- In second phase, CO2 emissions is denoted as (j = 1, 2, 3, 4, 5);
- In third phase, CO2 emissions is denoted as (j = 1, 2, 3, 4, 5);
4.4. Intermediate Variable
4.5. Data Collection and Computation
5. Result and Discussion
6. Conclusions
7. Patents
Supplementary Materials
Author Contributions
Funding
Acknowledgments
Conflicts of Interest
Abbreviations
| DEA | Data Envelopment Analysis; |
| PSI | Packaging Sustainability Indicator; |
| LCA | Life Cycle Assessment; |
| AHP | Analytic Hierarchy Process; |
| Al | aluminum laminate; |
| PET | polyethylene terephthalate; |
| DMUs | decision-making units; |
| CCR | Charnes, Cooper and Rhoades; |
| NDEA | Network DEA; |
| Ep | environmental efficiency (stage p = 1, 2, 3); |
| wp | impact weight (stage p = 1, 2, 3); |
| CRS | constant return to the scale; |
| TI | the total amounts of input resources consumed by the whole packaging systems; |
| LDPE | low density polyethylene; |
| PE | polyethylene; |
| the nomenclature of three-stage Network DEA model are listed in Section 3 in detail. | |
References
- Orzan, G.; Cruceru, A.F.; Bălăceanu, C.T. Consumers’ Behavior Concerning Sustainable Packaging: An Exploratory Study on Romanian Consumers. Sustainability 2018, 10, 1787. [Google Scholar] [CrossRef]
- Hao, Y.; Liu, H.; Chen, H.J.; Sha, Y.H. What affect consumers’ willingness to pay for green packaging? Evidence from China. Resour. Conserv. Recycl. 2019, 141, 21–29. [Google Scholar] [CrossRef]
- Yang, J.; Li, H.L.; School, B. Evaluation of Green Degree for Packaging Industry in China Based on Fuzzy Analytic Hierarchy Process. Ecol. Econ. 2018, 34, 78–82. [Google Scholar]
- Accorsi, R.; Versari, L.; Manzini, R. Glass vs. Plastic: Life Cycle Assessment of Extra-Virgin Olive Oil Bottles across Global Supply Chains. Sustainability 2015, 7, 2818–2840. [Google Scholar] [CrossRef]
- Saleh, Y. Comparative life cycle assessment of beverages packages in Palestine. J. Clean. Prod. 2016, 131, 28–42. [Google Scholar] [CrossRef]
- Zhang, H.; Hortal, M.; School, B. Selection of nanomaterial-based active agents for packaging application: Using life cycle assessment (LCA) as a tool. Packag. Technol. Sci. 2016, 30, 575–586. [Google Scholar] [CrossRef]
- Zhang, H.; Hortal, M.; Dobon, A. The effect of active packaging on minimizing food losses: Life cycle assessment (LCA) of essential oil component-enabled packaging for fresh beef. Packag. Technol. Sci. 2015, 28, 761–774. [Google Scholar] [CrossRef]
- Singh, J.; Krasowski, A.; Singh, S.P. Life cycle inventory of HDPE bottle-based liquid milk packaging systems. Packag. Technol. Sci. 2011, 24, 49–60. [Google Scholar] [CrossRef]
- Wever, R.; Vogtländer, J. Eco-efficient value creation: An alternative perspective on packaging and sustainability. Packag. Technol. Sci. 2013, 26, 229–248. [Google Scholar] [CrossRef]
- Charnes, A.; Cooper, W.W.; Rhodes, E. Measuring the efficiency of decision-making units. Eur. J. Oper. Res. 1978, 2, 429–444. [Google Scholar] [CrossRef]
- Ma, F.; Wang, W.L.; Sun, Q.P.; Liu, F. Integrated Transport Efficiency and Its Spatial Convergence in China’s Provinces: A Super-SBM DEA Model Considering Undesirable Outputs. Appl. Sci. 2018, 8, 1698. [Google Scholar] [CrossRef]
- Fu, H.L.; Qu, Y.; Pan, Y. Efficiency of Cassava Production in China: Empirical Analysis of Field Surveys from Six Provinces. Appl. Sci. 2018, 8, 1356. [Google Scholar] [CrossRef]
- Färe, R.; Grosskopf, S. Network DEA. Socio-Econ. Plan. Sci. 2000, 34, 35–49. [Google Scholar] [CrossRef]
- Saen, R.F. Developing a new data envelopment analysis methodology for supplier selection in the presence of both undesirable outputs and imprecise data. Int. J. Adv. Manuf. Technol. 2010, 51, 1243–1250. [Google Scholar] [CrossRef]
- Tone, K.; Tsutsui, M. Network DEA: A slacks-based measure approach. Eur. J. Oper. Res. 2009, 197, 243–252. [Google Scholar] [CrossRef]
- Lewis, H.F.; Sexton, T.R. Network DEA: Efficiency analysis of organizations with complex internal structure. Comput. Oper. Res. 2004, 31, 1365–1410. [Google Scholar] [CrossRef]
- Wang, S.J.; Li, Y.; Tuo, M.Y. The Evaluation of Rural Credit Cooperatives’ Agricultural Efficiency Under the Background of Reform for 40 Years—Based on the Calculation and Analysis of the Network DEA Method. J. Financ. Dev. Res. 2018, 12, 69–76. (In Chinese) [Google Scholar] [CrossRef]
- Ding, M.; Ma, C.Q.; Zhou, Z.B.; Liu, D.B. Research on the Efficiency of China’s Listed Commercial Banks Based on a Three-stage Additive DEA Model. Syst. Eng. 2013, 31, 19–26. (In Chinese) [Google Scholar]
- Yang, G.L.; Fukuyama, H.; Song, Y.Y. Measuring the inefficiency of Chinese research universities based on a two-stage network DEA model. J. Informetr. 2018, 12, 10–30. [Google Scholar] [CrossRef]
- An, Q.X.; Wen, Y.; Ding, T.; Li, Y.L. Resource sharing and payoff allocation in a three-stage system: Integrating network DEA with the Shapley value method. Omega 2018. [Google Scholar] [CrossRef]
- Li, F.; Zhu, Q.Y.; Chen, Z. Allocating a fixed cost across the decision-making units with two-stage network structures. Omega 2018, 83, 139–154. [Google Scholar] [CrossRef]
- Mavi, K.M.; Saen, R.F.; Goh, M. Joint analysis of eco-efficiency and eco-innovation with common weights in two-stage network DEA: A big data approach. Technol. Forecast. Soc. 2018. [Google Scholar] [CrossRef]
- Chen, L.; Lai, F.J.; Wang, Y.M.; Huang, Y. A two-stage network data envelopment analysis approach for measuring and decomposing environmental efficiency. Comput. Ind. Eng. 2018, 119, 388–403. [Google Scholar] [CrossRef]
- Alireza, T.; Elkafi, H. Evaluating sustainability performance in fossil-fuel power plants using a two-stage data envelopment analysis. Energy Econ. 2018, 74, 154–178. [Google Scholar] [CrossRef]
- Zhou, H.B.; Yang, Y.; Chen, Y.; Zhu, J. Data envelopment analysis application in sustainability: The origins, development and future directions. Eur. J. Oper. Res. 2017, 264, 1–16. [Google Scholar] [CrossRef]
- Premachandra, I.M.; Zhu, J.; Watson, J. Chapter 7 “Mutual Fund Industry Performance: A Network Data Envelopment Analysis Approach”. In Data Envelopment Analysis (International Series in Operations Research & Management Science); Price, C., Zhu, J., Eds.; Springer Science + Business Media: New York, NY, USA, 2016; Volume 2016, pp. 165–228. ISBN 978-1-4899-7684-0. [Google Scholar]
- Wu, J.; Zhu, Q.Y.; Ji, X.; Chu, J.F. Two-stage network processes with shared resources and resources recovered from undesirable outputs. Eur. J. Oper. Res. 2016, 251, 182–197. [Google Scholar] [CrossRef]
- Qin, F.X. Research of LCA in milk production. Dairy Sci. Technol. 2006, 29, 224–226. (In Chinese) [Google Scholar] [CrossRef]
- Xie, M.H.; Li, L.; Qiao, Q.; Sun, Q.H. A comparative study on milk packaging using life cycle assessment: From PA-PE-Al laminate and polyethylene in China. J. Clean. Prod. 2011, 19, 2100–2106. [Google Scholar] [CrossRef]
- Xie, Y.; Wang, K.L.; Tan, H.H. LCA of Canned Potato Chip Packaging. Packag. J. 2015, 7, 1–6. (In Chinese) [Google Scholar] [CrossRef]
- Chand, A.K.B.; Viswanathan, P. A constructive approach to cubic Hermite Fractal Interpolation Function and its constrained aspects. Bit 2013, 53, 841–865. [Google Scholar] [CrossRef]
- Singh, S.; Kumar, J.; Rao, P.V.M. Environmental Impact Assessment Framework for Product Packaging. Manag. Environ. Qual. 2017, 29, 499–515. [Google Scholar] [CrossRef]
- Rabnawaz, M.; Wyman, I. A roadmap towards green packaging: The current status and future outlook for polyesters in the packaging industry. Green Chem. 2017, 19, 4737–4753. [Google Scholar] [CrossRef]


| DMU | Material | Origin | Layers of Composite | Structure of Composite | Capacity | Number of Pieces |
|---|---|---|---|---|---|---|
| PrePack | LDPE (low density polyethylene) | China | 3 | PE/PE/PE | 200 mL | 5000 pouches |
| Composite box | cardboard, LDPE and auxiliary | China | 3 | PA/cardboard/PE | 250 mL | 4000 stand-ups |
| Tetra Pak | cardboard LDPE (low density polyethylene) Al (aluminum laminate) | Sweden | 6 | PE/cardboard-PE-Al-PE/PE | 1000 mL | 1000 stand-ups |
| Japan | ||||||
| China |
| DMU | Stage 1 | Stage 2 | Note (Data Sources) | ||
|---|---|---|---|---|---|
| Crude Oil | Natural Gas | Coal | Electricity | References | |
| PrePack (DMU1) | 15.071 | 1.09 | 6.87 | 17.7 | [29,30] |
| Composite box (DMU3) | 3.74 | 5.98 | 1.53 | 10.12 * | [28] |
| Tetra Pak (DMU5) | 6.7 | 4.87 | 2.24 | 6.175 | [29,30] |
| DMU | Stage 1 | Stage 2 | Stage 3 | Desired Output | Note (Data Sources) |
|---|---|---|---|---|---|
| CO2 | CO2 | CO2 | Recycled Materials | References | |
| PrePack (DMU1) | 30.142 | 18.1 | 7.37 | 6.2125 ** | [29,30] |
| Composite box (DMU3) | 43.6 | 12.3 * | 39.6 * | 4.38 ** | [28] |
| Tetra Pak (DMU5) | 47.13 | 8.75 * | 39.8 * | 13.423 ** | [29,30] |
| DMU | Stage 1 | Stage 2 | Note (Data Sources) |
|---|---|---|---|
| Packaging Materials | Package Quantity | References | |
| PrePack (DMU1) | 17.75 | 5000 | [29] |
| Composite box (DMU3) | 21.9 | 4000 | [28] |
| Tetra Pak (DMU5) | 28.56 | 1000 | [29] |
| DMU | PrePack DMU1 | Interpolation DMU2 | Composite Box DMU3 | Interpolation DMU4 | Tetra Pak DMU5 | |||
|---|---|---|---|---|---|---|---|---|
| Stage 1 | crude oil | 15.071 | 7.096 | 3.74 | 4.11 | 6.7 | ||
| natural gas | 1.09 | 4.52 | 5.98 | 5.84 | 4.87 | |||
| CO2 | 30.142 | 38.47 | 43.6 | 46.06 | 47.13 | |||
| Intermediate variable | 17.75 | 19.548 | 21.9 | 24.88 | 28.56 | |||
| Stage 2 | coal | 6.87 | 3.154 | 1.53 | 1.62 | 2.24 | ||
| electricity | 17.7 | 13.384 | 10.12 * | 7.765 | 6.175 | |||
| CO2 | 18.1 | 14.89 | 12.3 * | 10.28 | 8.75 * | |||
| Intermediate variable | 5000 | 4687.5 | 4000 | 2812.5 | 1000 | |||
| Stage 3 | CO2 | 7.37 | 29.47 | 39.6 * | 39.75 | 39.8 * | ||
| recycled materials | 6.2125 ** | 4.609 | 4.38 ** | 7.091 | 13.423 ** | |||
| Note (data Sources) | References | [29,30] | cubic-Hermite interpolation | [28] | cubic-Hermite interpolation | [29,30] | ||
| Stage | w1 | w2 | w3 |
|---|---|---|---|
| PrePack (DMU1) | 0.2224 | 0.2985 | 0.4791 |
| Interpolation (DMU2) | 0.3429 | 0.3285 | 0.3286 |
| Composite box (DMU3) | 0.2823 | 0.3588 | 0.3589 |
| Interpolation (DMU4) | 0.3220 | 0.4162 | 0.2618 |
| Tetra Pak (DMU5) | 0.0001 | 0.1233 | 0.8766 |
| Stage | PSI | E1 | E2 | E3 |
|---|---|---|---|---|
| PrePack (DMU1) | 1 | 1 | 1 | 1 |
| Interpolation (DMU2) | 0.64 | 0.8385 | 1 | 0.0733 |
| Composite box (DMU3) | 0.66 | 0.9673 | 1 | 0.0816 |
| Interpolation (DMU4) | 0.63 | 1 | 0.6291 | 0.1878 |
| Tetra Pak (DMU5) | 0.93 | 1 | 0.4097 | 1 |
© 2019 by the authors. Licensee MDPI, Basel, Switzerland. This article is an open access article distributed under the terms and conditions of the Creative Commons Attribution (CC BY) license (http://creativecommons.org/licenses/by/4.0/).
Share and Cite
Xie, Y.; Gao, Y.; Zhang, S.; Bai, H.; Liu, Z. Sustainability Evaluation of Product Packaging System with a Three-Stage Network Data Envelopment Analysis Methodology. Appl. Sci. 2019, 9, 246. https://doi.org/10.3390/app9020246
Xie Y, Gao Y, Zhang S, Bai H, Liu Z. Sustainability Evaluation of Product Packaging System with a Three-Stage Network Data Envelopment Analysis Methodology. Applied Sciences. 2019; 9(2):246. https://doi.org/10.3390/app9020246
Chicago/Turabian StyleXie, Yong, Yafang Gao, Shihao Zhang, Hailong Bai, and Zhenghao Liu. 2019. "Sustainability Evaluation of Product Packaging System with a Three-Stage Network Data Envelopment Analysis Methodology" Applied Sciences 9, no. 2: 246. https://doi.org/10.3390/app9020246
APA StyleXie, Y., Gao, Y., Zhang, S., Bai, H., & Liu, Z. (2019). Sustainability Evaluation of Product Packaging System with a Three-Stage Network Data Envelopment Analysis Methodology. Applied Sciences, 9(2), 246. https://doi.org/10.3390/app9020246