Cross-Method-Based Analysis and Classification of Malicious Behavior by API Calls Extraction

 ,
, 
Abstract
1. Introduction
2. Related Work
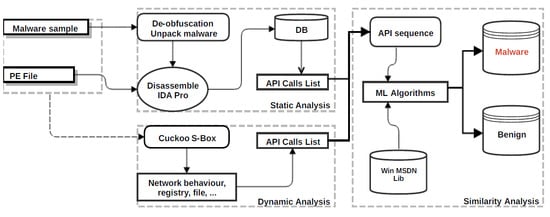
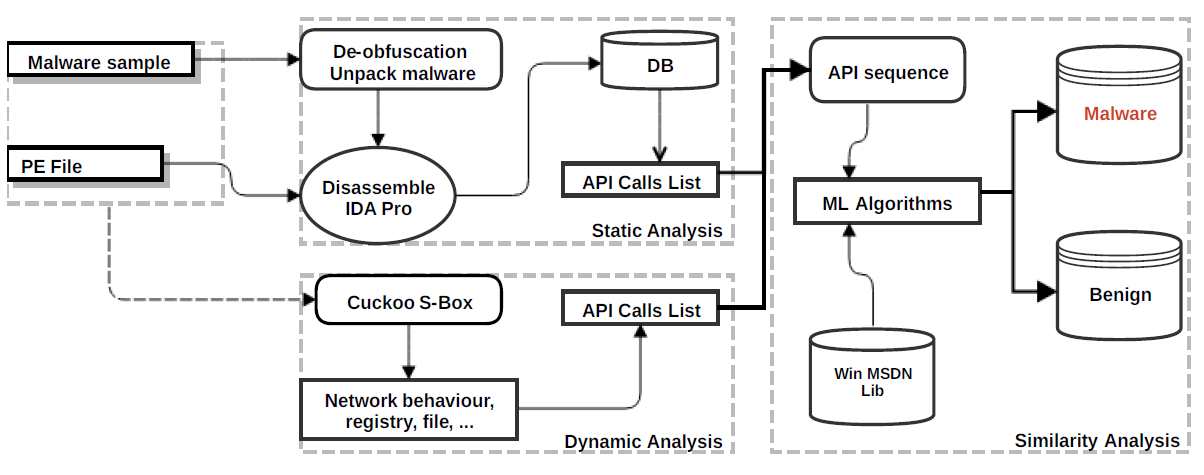
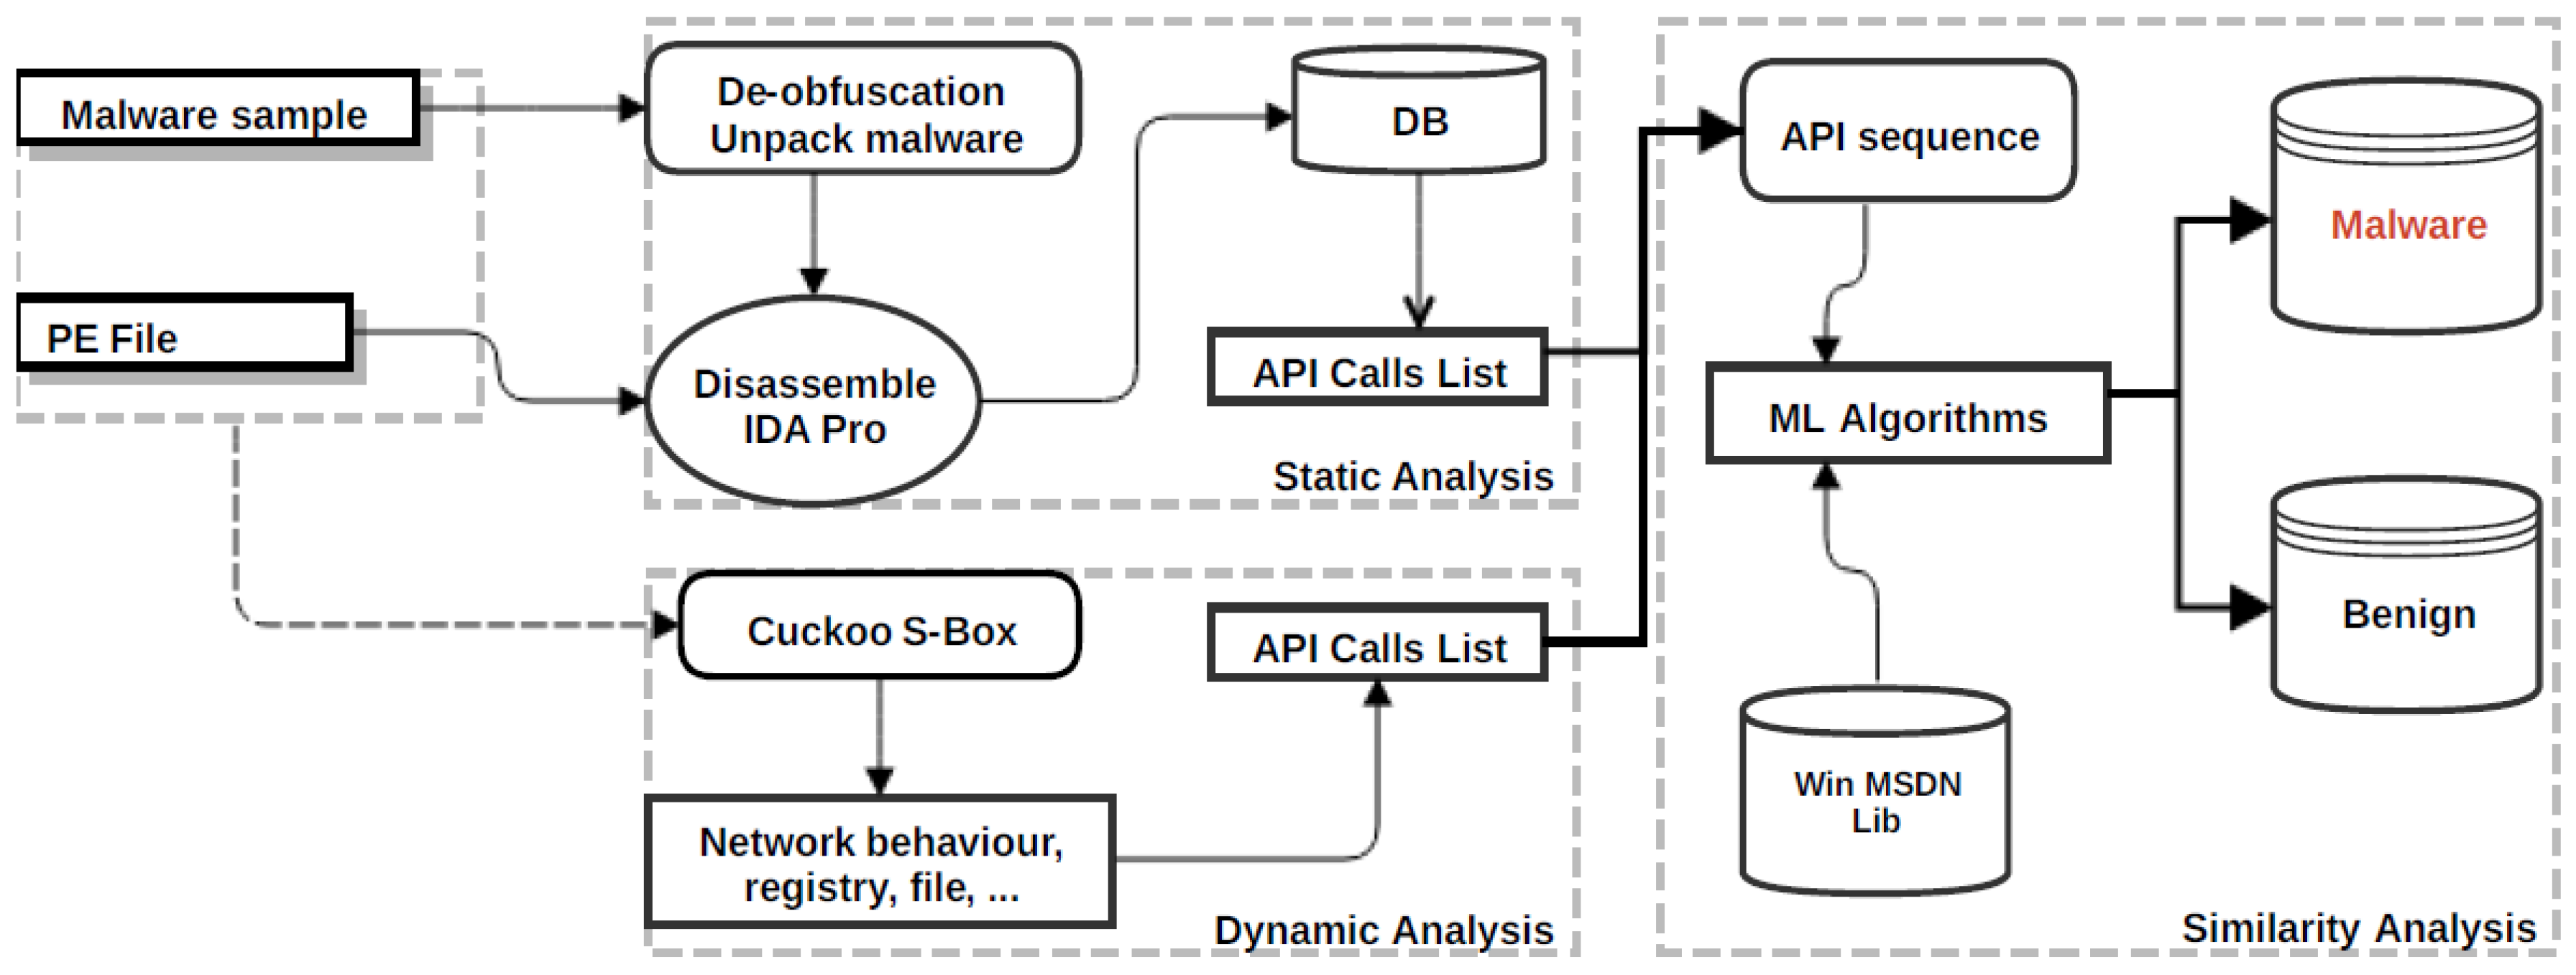
3. Proposed Method and Implementation
3.1. Dataset and Preprocess
3.2. Static Analysis Process
3.3. Dynamic Analysis Process
3.4. Similarity Analysis Process
4. Experiments and Results
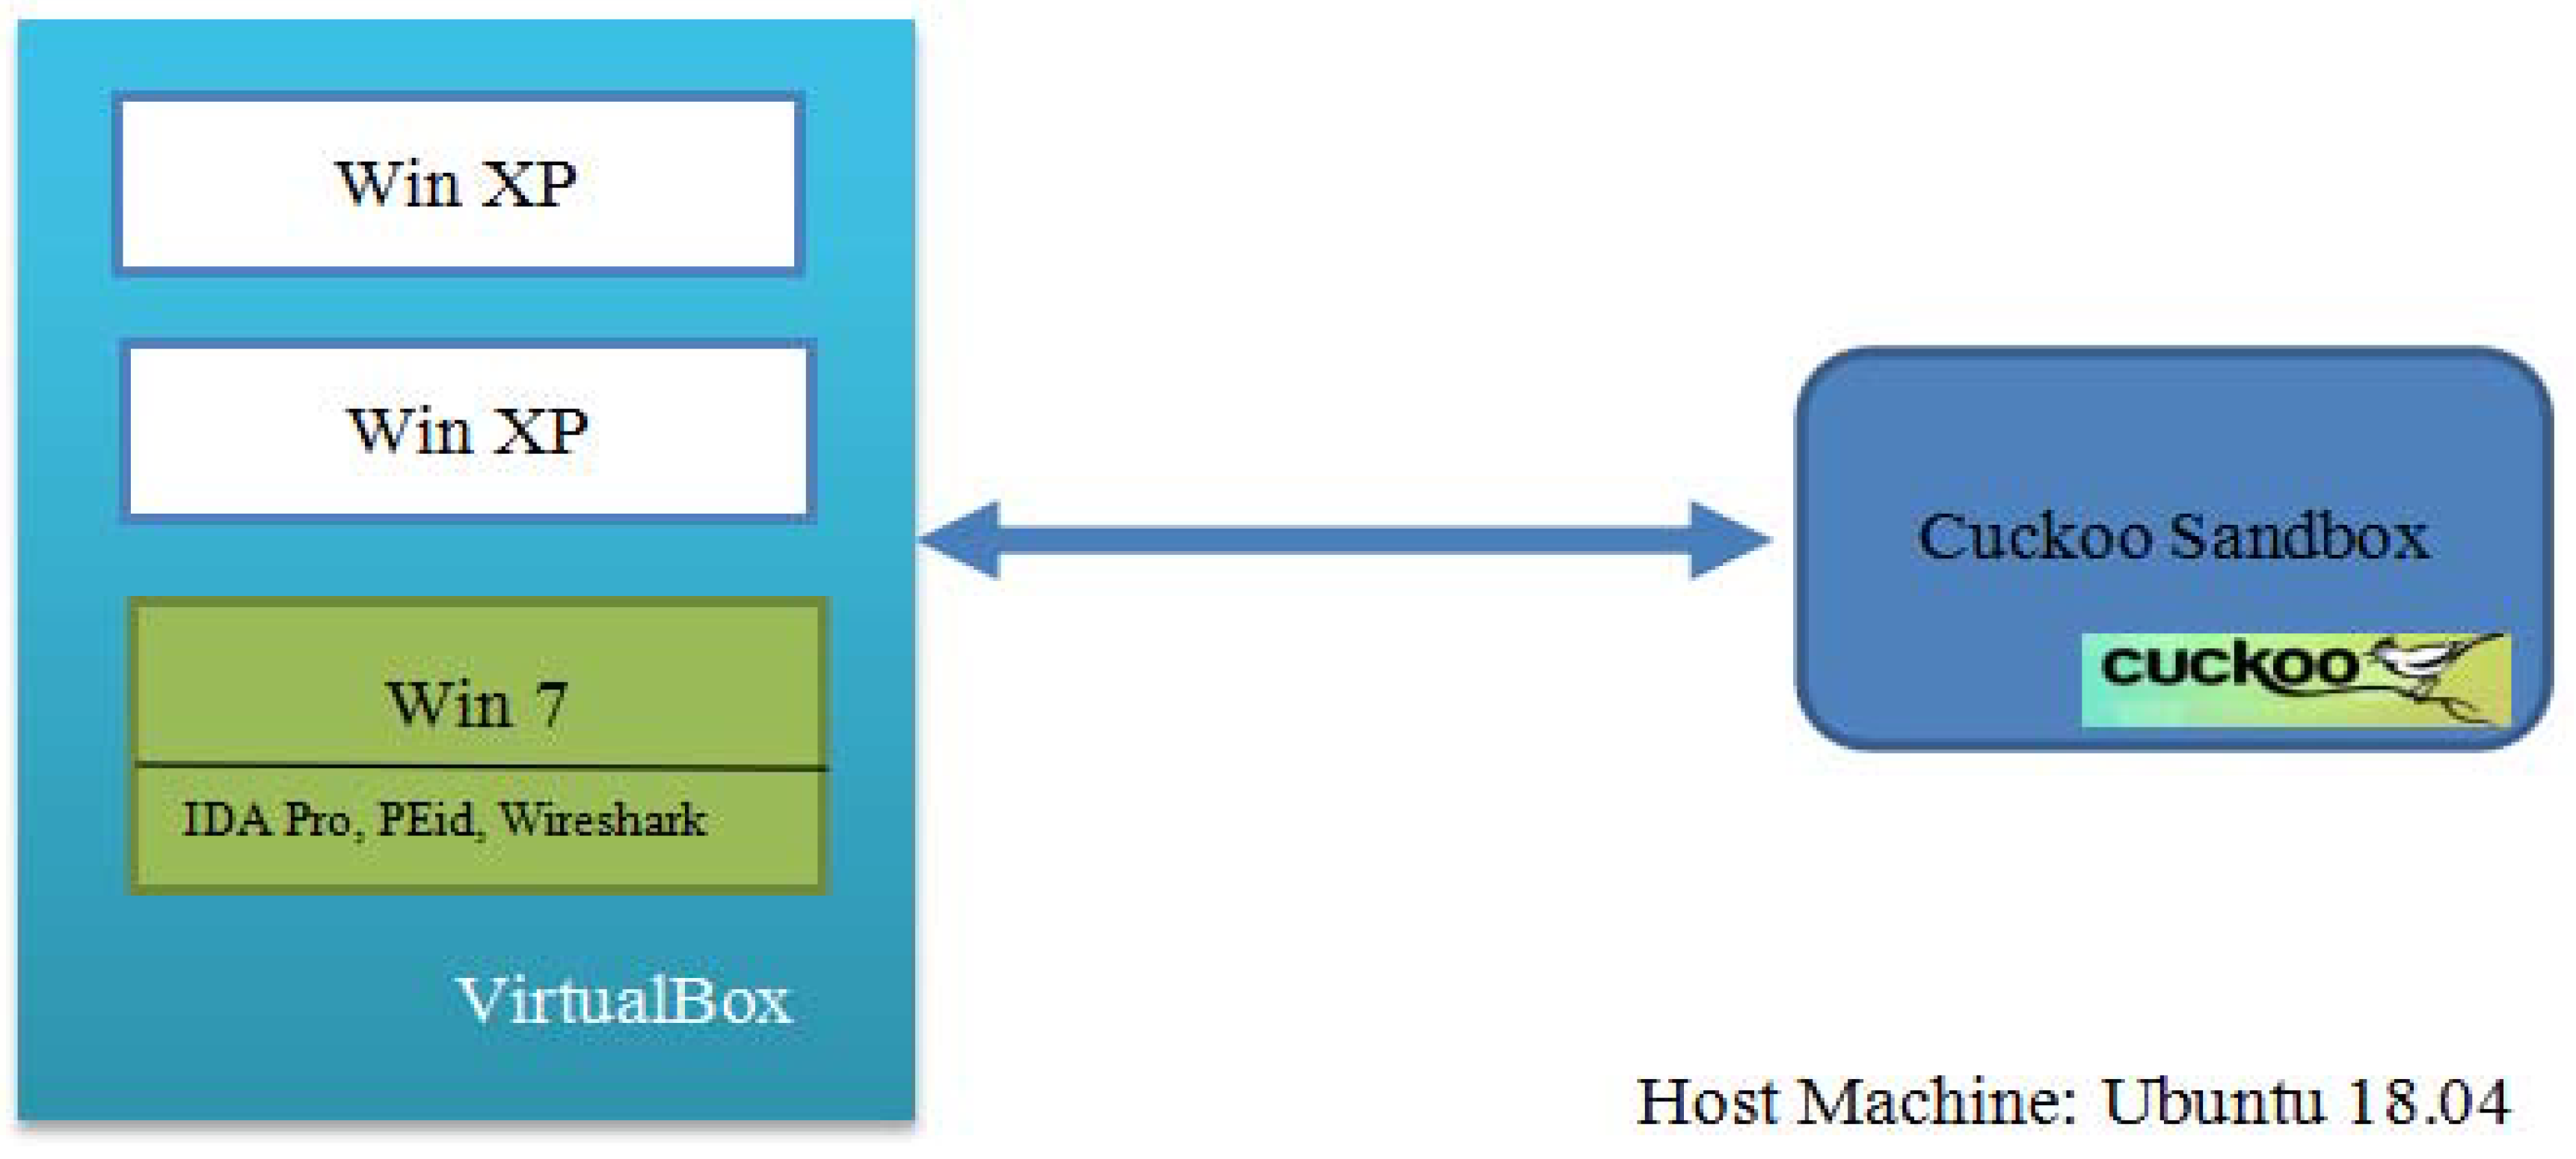
4.1. Environment Set Up
4.2. API Call Frequency and Sequence of Occurrence
| Algorithm 1: API Call List Frequency and Sequence—Computation Process |
| Input: Output: // Set of frequencies representing all A occurrence in V |
| 1. Run V in Win 7 // Static Analysis by IDA Pro and PEid |
| 2. Create report from IDA Pro and PEid // Preliminary database about API Function List |
| 3. Query on the preliminary DB |
| 4. Verity if the database = Ø // Empty database |
| 5. If yes, abort |
| 6. Otherwise, |
| 7. For each A in the database, |
| 8. Compute |
| 9. Insert () to API Sequence |
| 10. End for |
| 11. Run V in Windows XP // Cuckoo Sandbox for dynamic analysis |
| 12. Repeat 2 to 10 |
| 13. Duplicates removal: API_Sequence, Max_Length_Repeat |
| 14. Database = API Sequence |
| 15. Init: SeqIndex ← 0; |
| 16. While true do: |
| 17. If SeqIndex = Length_Sequence then |
| 18. break; |
| 19. Else |
| 20. for i ← 1 to Max_Length_Repeat do |
| 21. if found_repeat = true, then |
| 22. break; |
| 23. End |
| 24. Found_repeat ← remove (API_Sequence, SeqIndex, i); |
| 25. SeqIndex +=i; // Update the API Sequence Database |
| 26. End |
| 27. End |
| 28. End |
4.3. Similarity Analysis and Classification
- Minkowski Distance: The Minkowski distance between two n-dimension vectorsand is given by:
- Cosine Similarity: Cosine similarity is a measure of similarity between two vectors based on the cosine of the angle between them. The vectors A and B are usually the term frequency vectors. The Cosine similarity between vectors A and B is given by:
- Containment Broder: Containment border defines the containment for comparing two documents. The function f () computes sets of features from two documents, h and i, such as fingerprints of “shingles”. The containment(h, i) of h within i is defined as:
- Canberra Distance: The Canberra distance is a weighted version of the Manhattan distance, introduced and refined in 1967 by Lance, Williams, and Adkins [48]. It is often used for data scattered around an origin, as it is biased for measures around the origin and very sensitive for values close to zero.
- Longest Common Subsequence (LCS): The LCS is used to find the longest subsequence common to all sequences in any two given strings P. To extract the common API call sequence pattern among malware, the longest common subsequences (LCSs) is used. The formula is shown in (8). In the formula, P𝑖 and Q𝑖 represent the 𝑖th character of sequences P and Q, respectively. For example, the LCSs of TKMN and TMK are TK and TM:
4.4. Experiments Results
5. Conclusions
Author Contributions
Funding
Acknowledgments
Conflicts of Interest
Appendix A. Description of Feature Selection from Table 4, Table 5 and Table 6
| Opcode Name | Description | Opcode Name | Description |
| Txt | Set of Instruction for text file | .rdas | Library |
| Ms | Set of Instruction for Microsoft Word | .rscf | Library |
| Msgr | Set of Instruction on Messenger Application | .releo | Return Load Execution |
| Skype | Set of Instruction on Skype application | .kkng | Library |
| Ffing | Set of Instruction on this application | .ipfi | Library |
| xlxs | Set of Instruction on Excel | .usere | Driver |
| msppt | Set of Instruction on Power Point | icon | Driver |
| dialer | Set of Instruction on Dialer | jalr | Jump Instruction |
| .textdt | Library | bgtz | Branch Instruction |
| Syscall | Fast System Call | fprem | Partial Reminder |
| Mrob | Move Result Object | ivtl | Invoke Virtual |
| Usere | Driver | srvbw | Store Value Bytes |
Appendix B. Source Code in Python to Computer Similarly between Malware
  import sys,os
  import pefile
  import hashlib
  import xlsxwriter
     if __name__ == "__main__":
    #Identify specified folder with suspect files
     dir_path = sys.argv[1]
    #Create a list of files with full path
    file_list = []
    for folder, subfolder, files in os.walk (dir_path):
      for f in files:
        full_path = os.path.join (folder, f)
        file_list.append (full_path)
    #Open XLSX file for writing
    #CSV can be also use to output
    #file_name = "pefilename-csv" // Uncomment this line if you don't want
    #to use XLSX and edit the other lines
    file_name = "filename_output.xlsx"
    workbook = xlsxwriter.Workbook (file_name)
    bold = workbook.add_format ({'bold':True})
    worksheet = workbook.add_worksheet ()
    #Write column headings
    row = 0
    worksheet.write ('A1', 'SHA256', bold)
    worksheet.write ('B1', 'Imphash', bold)
    row += 1
    #Iterate through file_list to compute imphash and sha256 file hash
     for item in file_list:
        #Get sha256
       fh = open (item, "rb")
       data = fh.read ()
       fh.close ()
       sha256 = hashlib.sha256 (data).hexdigest ()
        #Get import table hash
       pe = pefile.PE (item)
       ihash = pe.get_imphash ()
        #Write hashes to doc
       worksheet.write (row, 0, sha256)
       worksheet.write (row, 1, ihash)
       row + = 1
   #Autofilter the xlsx file for easy viewing/sorting
    worksheet.autofilter (0, 0, row, 2)
    workbook.close ()
References
- Jia, P.; Liu, J.; Fang, Y.; Liu, L.; Liu, L. Modeling and analyzing malware propagation in social networks with heterogeneous infection rates. Phys. A Stat. Mech. Appl. 2018, 507, 240–254. [Google Scholar] [CrossRef]
- All about Malware. Available online: https://www.malwarebytes.com/malware/ (accessed on 30 November 2018).
- Liu, J.; Su, P.; Yang, M.; He, L.; Zhang, Y.; Zhu, X.; Lin, H. Software and Cyber Security-A Survey. Chin. J. Softw. 2018, 29, 42–68. [Google Scholar] [CrossRef]
- Russell, G.S.; Cheung, R.; Laurie, L.Y.-C. Cybercrime Risks and Responses Eastern and Western Perspectives; Palgrave Studies in Cybercrime and Cybersecurity Series; Palgrave Macmillan: London, UK, 2015. [Google Scholar]
- Saeed, A.; Paul, S. Optimized Malware Detection in Digital Forensics. Int. J. Netw. Secur. Appl. 2014, 6, 1–15. [Google Scholar] [CrossRef]
- Kevin, C.; Ibrahim, B.; Frank, B. Anti-forensics: Furthering digital forensic science through a new extended, granular taxonomy. Digit. Investig. 2016, 18, S66–S75. [Google Scholar] [CrossRef]
- Vacius, J.; Darius, B.; Elvar, G. Methods and Tools of Digital Triage in Forensic Context: Survey and Future Directions. Symmetry 2017, 9, 49. [Google Scholar] [CrossRef]
- Conway, A.; James, J.I.; Gladyshev, P. Development and Initial User Evaluation of a Virtual Crime Scene Simulator Including Digital Evidence. In Lecture Notes of the Institute for Computer Sciences Social Informatics and Telecommunications Engineering, Proceedings of the 7th International ICST Conference on Digital Forensics and Cyber Crime (ICDF2C), Seoul, Korea, 6–8 October 2015; Springer: Cham, Switzerland, 2015; Volume 157, pp. 16–26. [Google Scholar]
- Alazab, M.; Venkatraman, S.; Watters, P. Effective digital forensic analysis of the NTFS disk image. Ubiquitous Comput. Commun. J. 2009, 4, 551–558. [Google Scholar]
- Zhang, M.; Raghunathan, A.; Jha, N.K. A defense framework against malware and vulnerability exploits. Int. J. Inf. Secur. 2014, 13, 439–452. [Google Scholar] [CrossRef]
- Nor, B.A.; Hasimi, S.; Abdullah, G.; Omar, Z. Identifying False Alarm for Network Intrusion Detection System Using Hybrid Data Mining and Decision Tree. Malays. J. Comput. Sci. 2008, 21, 101–115. [Google Scholar] [CrossRef]
- Thomas, P. A False Positive Prevention Framework for Non-Heuristic Anti-Virus Signatures: Symantec, a Case Study. Master’s Dissertation, Management of Information Systems, University of Dublin, Dublin, Germany, 2009. Submitted. [Google Scholar]
- Przemysław, B.; Bartosz, J.; Marcin, S. An Entropy-Based Network Anomaly Detection Method. Entropy 2015, 17, 2367–2408. [Google Scholar] [CrossRef]
- Jungsuk, S.; Younsu, L.; JangWon, C.; JoonMin, G.; Jaekyung, H.; SangSoo, C. Practical In-Depth Analysis of IDS Alerts for Tracing and Identifying Potential Attackers on Darknet. Sustainability 2017, 9, 262. [Google Scholar] [CrossRef]
- Luo, X.; Zhou, M.; Leung, H.; Xia, Y.; Zhu, Q.; You, Z.; Li, S. An Incremental-and-static-combined schemefor matrix-factorization-based collaborative filtering. IEEE Trans. Autom. Sci. Eng. 2016, 13, 333–343. [Google Scholar] [CrossRef]
- Zeng, N.; Wang, Z.; Zineddin, B.; Li, Y.; Du, M.; Xiao, L.; Liu, X.; Young, T. Image-based quantitative analysis of gold immunochromatographic strip via cellular neural network approach. IEEE Trans. Med. Imaging 2014, 33, 1129–1136. [Google Scholar] [CrossRef] [PubMed]
- More, S.; Gaikwad, P. Trust-based voting method for efficient malware detection. Procedia Comput. Sci. 2016, 79, 657–667. [Google Scholar] [CrossRef]
- Ni, S.; Qian, Q.; Zhang, R. Malware identification using visualization images and deep learning. Comput. Secur. 2018, 77, 871–885. [Google Scholar] [CrossRef]
- Idrees, F.; Rajarajan, M. Investigating the android intents and permissions for malware detection. In Proceedings of the 2014 IEEE 10th International Conference on Wireless and Mobile Computing, Networking and Communications, Larnaca, Cyprus, 8–10 October 2014; pp. 354–358. [Google Scholar]
- Rosmansyah, Y.; Dabarsyah, B. Malware detection on android smartphones using API class and machine learning. In Proceedings of the 2015 International Conference on Electrical Engineering and Informatics, Denpasar, Indonesia, 10–11 August 2015; pp. 294–297. [Google Scholar]
- Zhu, L.; Zhao, H. Dynamical analysis and optimal control for a malware propagation model in an information network. Neurocomputing 2015, 149, 1370–1386. [Google Scholar] [CrossRef]
- Cesare, S.; Xiang, Y. Software Similarity and Classification; Springer Science & Business Media: Berlin, Germany, 2012. [Google Scholar]
- Rajagopalan, M.; Hiltunen, M.A.; Jim, T.; Schlichting, R.D. Systemcallmonitoring using authenticated systemcalls. IEEE Trans. Dependable Secur. Comput. 2006, 3, 216–229. [Google Scholar] [CrossRef]
- Abadi, M.; Budiu, M.; Erlingsson, U.; Ligatti, J. Controlflow integrity. In Proceedings of the 12th ACM Conference on Computer and Communications Security, Alexandria, VA, USA, 7–10 November 2005; pp. 340–353. [Google Scholar]
- Sami, A.; Yadegari, B.; Rahimi, H.; Peiravian, N.; Hashemi, S.; Hamze, A. Malware detection based on mining API calls. In Proceedings of the 25th Annual ACM Symposium on Applied Computing (SAC’10), Sierre, Switzerland, 22–26 March 2010; pp. 1020–1025. [Google Scholar]
- Sathyanarayan, V.S.; Kohli, P.; Bruhadeshwar, B. Signature Generation and Detection of Malware Families, in Information Security and Privacy; Springer: Berlin, Germany, 2008. [Google Scholar]
- Ye, D.Y.; Wang, T.L.; Ye, D. IMDS: Intelligent malware detection system. In Proceedings of the 13th ACM SIGKDD International Conference on Knowledge Discovery and Data Mining, San Jose, CA, USA, 12–15 August 2007; pp. 1043–1047. [Google Scholar]
- Alazab, M.; Venkatraman, S.; Watters, P. Zero-day malware detection based on supervised learning algorithms of API call signatures. In Proceedings of the 9th Australasian Data Mining Conference (AusDM’11), Ballarat, Australia, 1–2 December 2011; Australian Computer Society: Sydney, Australia, 2011; Volume 121, pp. 171–182. [Google Scholar]
- Qiao, Y.; Yang, Y.; He, J.; Tang, C.; Liu, Z. CBM: Free, automatic malware analysis framework using API call sequences. In Knowledge Engineering and Management; Springer: Berlin, Germany, 2014; pp. 225–236. [Google Scholar]
- Tian, R.; Islam, M.R.; Batten, L.; Versteeg, S. Differentiating malware from clean ware using behavioral analysis. In Proceedings of the 5th International Conference on Malicious and Unwanted Software (MALWARE’10), Nancy, France, 19–20 October 2010; pp. 23–30. [Google Scholar]
- Yang, M.; Wang, S.; Ling, Z.; Liu, Y.; Ni, Z. Detection of malicious behavior in android apps through API calls and permission uses analysis. Concurr. Comput. Pract. Exp. 2017, 29, e4172. [Google Scholar] [CrossRef]
- Asghar, T.; Saeed, J. HM3alD: Polymorphic Malware Detection Using Program Behavior-Aware Hidden Markov Model. Appl. Sci. 2018, 8, 1044. [Google Scholar] [CrossRef]
- Shibahara, T.; Yagi, T.; Akiyama, M.; Chiba, D.; Yada, T. Efficient Dynamic Malware Analysis Based on Network Behavior Using Deep Learning. In Proceedings of the 2016 IEEE Global Communications Conference, Washington, DC, USA, 4–8 December 2016; pp. 1–7. [Google Scholar]
- Because Sharing is Caring. Available online: https://virusshare.com/ (accessed on 30 November 2018).
- Jesse, C.R.; Roger, I.K.; Scott, M.L.; Robert, K.C. Detection of Injected, Dynamically Generated, and Obfuscated Malicious Code. In Proceedings of the 2003 ACM workshop on Rapid malcode (WORM’03), Washington, DC, USA, 27 October 2003. [Google Scholar] [CrossRef]
- Hex-Rays. Available online: https://www.hex-rays.com/products/ida/ (accessed on 30 November 2018).
- Pestudio. Available online: https://www.winitor.com/ (accessed on 30 November 2018).
- PEid. Available online: https://www.aldeid.com/wiki/PEiD (accessed on 30 November 2018).
- Michael, O.; Grant, A. The Definitive Guide to SQLite, 2nd ed.; Apress: New York, NY, USA, 2010; pp. 1–368. ISBN 978-1-4302-3226-1. [Google Scholar]
- Shabtai, A.; Kanonov, U.; Elovici, Y.; Glezer, C.; Weiss, Y. “Andromaly”: A behavioral malware detection framework for android devices. J. Intell. Inf. Syst. 2012, 38, 161–190. [Google Scholar] [CrossRef]
- Ibrahim, A.D.; Ömer, K. Web-Based Android Malicious Software Detection and Classification System. Appl. Sci. 2018, 8, 1622. [Google Scholar] [CrossRef]
- Barak, B.R.; Maslin, M. Metamorphic Virus Variants Classification Using Opcode Frequency Histogram. In Proceedings of the 14th WSEAS International Conference on COMPUTERS, Corfu Island, Greece, 23–25 July 2010; pp. 147–155. [Google Scholar]
- Cuckoo Foundation. Available online: https://www.cuckoosandbox.org (accessed on 28 December 2018).
- Cesare, S.; Xiang, Y. Classification of malware using structured control flow. In Proceedings of the 8th Australasian Symposium on Parallel and Distributed Computing, Brisbane, Australia, 18–22 January 2010; pp. 61–70. [Google Scholar]
- Cesare, S.; Xiang, Y.; Zhou, W. Control flow-based malware variant detection. IEEE Trans. Dependable Secur. Comput. 2014, 11, 307–317. [Google Scholar] [CrossRef]
- Jaewook, J.; Jaesung, Y.; Aziz, M.; Jiyoung, W.; HuyKang, K. Detecting and classifying method based on similarity matching of Android malware behavior with profile. SpringerPlus 2016, 5, 273. [Google Scholar] [CrossRef]
- Elita, N.; Gavrila, M.; Vertan, C. Experiments with string similarity measures in the ebmt framework. In Proceedings of the RANLP, Borovets, Bulgaria, 27–29 September 2007. [Google Scholar]
- Lance, G.; Williams, W. Mixed-Data Classificatory Programs I—Agglomerative Systems. Aust. Comput. J. 1967, 1, 15–20. [Google Scholar]


| Type | Source | Quantity | Percentage |
|---|---|---|---|
| Malware | VirusShare | 61,354 | 78% |
| Benign | Various locations and made from our lab | 17,214 | 12% |
| Type or Class | Quantity | Percentage | Maximum Size (KB) |
|---|---|---|---|
| Benign | 17,214 | 21.91 | 122,154 |
| Trojan | 16,146 | 20.55 | 18,547 |
| Virus | 19,821 | 25.23 | 784 |
| Worm | 13,541 | 17.23 | 16,000 |
| Rootkit | 357 | 0.45 | 789 |
| Backdoor | 8541 | 10.87 | 2054 |
| Flooder | 1424 | 1.81 | 39,785 |
| Exploit | 1524 | 1.94 | 29,431 |
| Method | Malware to Benign | Malware to Malware | Benign to Benign |
|---|---|---|---|
| Minkowski Distance | 168.32 | 101.14 | 198.04 |
| Cosine Similarity | 54.452 | 21.458 | 12.142 |
| Containment Broader | 86.652 | 45.256 | 10.254 |
| Canberra Distance | 10.845 | 9.154 | 7.501 |
| Longest Common Subsequence | 98.141 | 112.08 | 86.145 |
| Features | txt | ms | msgr | skype | ffing | xlxs | msppt | dialer |
|---|---|---|---|---|---|---|---|---|
| txt | 0.00 | 1.00 | 1.00 | 1.00 | 1.00 | 1.00 | 1.00 | 1.00 |
| ms | 1.00 | 0.00 | 1.00 | 1.00 | 1.00 | 1.00 | 1.00 | 1.00 |
| msgr | 1.00 | 1.00 | 0.00 | 1.00 | 1.00 | 1.00 | 1.00 | 1.00 |
| skype | 1.00 | 1.00 | 1.00 | 0.00 | 1.00 | 1.00 | 0.99 | 0.99 |
| ffing | 1.00 | 1.00 | 1.00 | 1.00 | 0.00 | 1.00 | 1.00 | 1.00 |
| xlxs | 1.00 | 0.98 | 1.00 | 1.00 | 1.00 | 0.00 | 1.00 | 1.00 |
| msppt | 1.00 | 1.00 | 1.00 | 1.00 | 1.00 | 1.00 | 0.00 | 1.00 |
| dialer | 1.00 | 1.00 | 1.00 | 0.98 | 1.00 | 1.00 | 1.00 | 0.00 |
| Features | .texdt | .rdas | .rscf | .reloe | .kkng | .ipfi | .usere | .icon |
|---|---|---|---|---|---|---|---|---|
| .texdt | 0.00 | 0.14 | 0.24 | 0.10 | 0.10 | 0.10 | 0.10 | 0.10 |
| .rdas | 0.10 | 0.00 | 0.12 | 0.00 | 0.12 | 0.12 | 0.11 | 0.23 |
| .rscf | 0.21 | 0.23 | 0.00 | 0.25 | 0.22 | 0.21 | 1.00 | 0.28 |
| .reloe | 0.13 | 0.00 | 0.22 | 0.00 | 0.23 | 0.00 | 0.25 | 0.23 |
| .kkng | 0.13 | 0.16 | 0.21 | 0.26 | 0.00 | 0.00 | 0.00 | 0.21 |
| .ipfi | 0.13 | 0.16 | 0.22 | 0.26 | 0.00 | 0.00 | 0.00 | 0.16 |
| .usere | 0.14 | 0.16 | 0.28 | 0.26 | 0.00 | 0.00 | 0.00 | 0.16 |
| .icon | 0.14 | 0.15 | 0.21 | 0.26 | 0.19 | 023 | 0.21 | 0.00 |
| Features | .jalr | .bgtz | .syscall | .fprem | .mrob | .ivtl | .usere | .srvbw |
|---|---|---|---|---|---|---|---|---|
| .jalr | 0.00 | 0.21 | 0.00 | 0.17 | 1.00 | 1.00 | 0.23 | 0.23 |
| .bgtz | 0.25 | 0.00 | 0.21 | 0.05 | 1.00 | 1.00 | 1.00 | 1.00 |
| .syscall | 0.21 | 0.15 | 0.00 | 1.00 | 1.00 | 1.00 | 1.00 | 0.09 |
| .fprem | 0.15 | 1.00 | 1.00 | 0.00 | 1.00 | 1.00 | 0.99 | 0.24 |
| .mrob | 0.21 | 1.00 | 1.00 | 1.00 | 0.00 | 1.00 | 1.00 | 0.07 |
| .ivtl | 1.00 | 0.98 | 0. | 1.00 | 1.00 | 0.00 | 1.00 | 1.00 |
| .usere | 1.00 | 0.28 | 0.11 | 0.18 | 1.00 | 1.00 | 0.00 | 0.05 |
| .srvbw | 1.00 | 0.18 | 0.11 | 0.18 | 0.05 | 0.00 |
© 2019 by the authors. Licensee MDPI, Basel, Switzerland. This article is an open access article distributed under the terms and conditions of the Creative Commons Attribution (CC BY) license (http://creativecommons.org/licenses/by/4.0/).
Share and Cite
Ndibanje, B.; Kim, K.H.; Kang, Y.J.; Kim, H.H.; Kim, T.Y.; Lee, H.J. Cross-Method-Based Analysis and Classification of Malicious Behavior by API Calls Extraction. Appl. Sci. 2019, 9, 239. https://doi.org/10.3390/app9020239
Ndibanje B, Kim KH, Kang YJ, Kim HH, Kim TY, Lee HJ. Cross-Method-Based Analysis and Classification of Malicious Behavior by API Calls Extraction. Applied Sciences. 2019; 9(2):239. https://doi.org/10.3390/app9020239
Chicago/Turabian StyleNdibanje, Bruce, Ki Hwan Kim, Young Jin Kang, Hyun Ho Kim, Tae Yong Kim, and Hoon Jae Lee. 2019. "Cross-Method-Based Analysis and Classification of Malicious Behavior by API Calls Extraction" Applied Sciences 9, no. 2: 239. https://doi.org/10.3390/app9020239
APA StyleNdibanje, B., Kim, K. H., Kang, Y. J., Kim, H. H., Kim, T. Y., & Lee, H. J. (2019). Cross-Method-Based Analysis and Classification of Malicious Behavior by API Calls Extraction. Applied Sciences, 9(2), 239. https://doi.org/10.3390/app9020239