Article

In Vivo Rat Brain Imaging through Full-Field Optical Coherence Microscopy Using an Ultrathin Short Multimode Fiber Probe

1
Graduate School of Science and Engineering, Yamagata University, Yonezawa, Yamagata 992-8510, Japan
2
Graduate School of Bio-Applications & Systems Engineering, Tokyo University of Agriculture and Technology, 2-24-16 Naka-cho, Koganei, Tokyo 184-8588, Japan
*
Author to whom correspondence should be addressed.
Appl. Sci. 2019, 9(2), 216; https://doi.org/10.3390/app9020216
Submission received: 17 November 2018 / Revised: 28 December 2018 / Accepted: 3 January 2019 / Published: 9 January 2019
(This article belongs to the Special Issue Optical Coherence Tomography and its Applications)

Abstract

:
We demonstrate full-field optical coherence microscopy (OCM) using an ultrathin forward-imaging short multimode fiber (SMMF) probe with a core diameter of 50 μm, outer diameter of 125 μm, and length of 7.4 mm, which is a typical graded-index multimode fiber used for optical communications. The axial and lateral resolutions were measured to be 2.14 μm and 2.3 μm, respectively. By inserting the SMMF 4 mm into the cortex of an in vivo rat brain, scanning was performed to a depth of 147 μm from the SMMF facet with a field of view of 47 μm. Three-dimensional (3D) OCM images were obtained at depths ranging from approximately 20 μm to 90 μm. Based on the morphological information of the resliced 3D images and the dependence of the integration of the OCM image signal on the insertion length, the obtained 3D information of nerve fibers has been presented.

1. Introduction

Optical coherence tomography (OCT) has become a mainstay in biomedical imaging technology owing to its noninvasive imaging and higher spatial resolution, and has been one of the most rapidly developed optical imaging modalities of the last few decades. At present, the most developed domain is ophthalmology, and its ability to differentiate between layers of the retina has made it a standard diagnostic tool [1,2,3].
Various probes have been developed for OCT to extend the range of its applications [4,5]. Compact, robust, and reliable endoscopic probes and imaging catheters have long been in demand in various fields of biomedical optics. The size of the imaging probe is important in achieving minimally invasive accessibility to deep regions. Most probe implementations can be divided into two groups based on their scan modes: Side-imaging or forward-imaging.
In side-imaging probes [6,7,8,9,10], a deep skeletal muscle structure was imaged using an ultrathin optical needle probe (outer diameter (OD) = 310 μm) consisting of a no-core fiber and a fiber gradient-index (GRIN) lens, with a lateral resolution of 20 μm [7]. The structure of an optical probe using fiber GRIN lenses was first proposed in 2002 [10]. Forward-imaging probes are generally more complicated in design and require that their actuators be located at or very near the probe tip. So far, several types of probes have been demonstrated [11,12,13,14,15,16]. Probes using a long GRIN lens (OD = 0.74 mm, length = 120 mm) have been reported to obtain OCT images of ex vivo human brains with lateral scanners [17]. Full-field OCT (FF-OCT), which utilizes spectrally modulated and spatially incoherent illumination, has also been demonstrated. The interference image obtained was transferred to a camera through a bundle fiber (OD = 1.93 mm, length = 1.76 m) [18]. These probes are useful in multiple fields of biology and in clinical applications.
OCT with a high-numerical-aperture objective lens is often referred to as optical coherence microscopy (OCM) [19]. OCM, a variant of OCT, acquires en face tomographic images, with 3D imaging achieved by acquiring a stack of en face images. One of the OCM approaches is full-field OCM (FF-OCM). FF-OCM uses a temporally and spatially low-coherence light source associated with an area camera to acquire en face images [20]. Many specific studies on FF-OCT and FF-OCM have been reported [21,22,23].
We have been studying the application of short multimode fibers (SMMFs) as an imaging fiber GRIN lens in a forward-imaging probe, because of its miniaturization, robustness, reliability, and low cost [24]. It is possible to miniaturize a forward-imaging probe without lateral scanning mechanisms using an area camera. The theoretical and experimental evaluations of imaging characteristics have been reported using an SMMF with a diameter of 125 μm and a length of 8.8 mm. The dependence of contrast on wavelength was measured using surface images of chicken tendons [25]. By means of an SMMF with a diameter of 140 μm and a length of 5 mm, we also obtained transmission images using ex vivo rat brains [26]. For designing an SMMF, the modulation transfer function was evaluated using a thin random phase screen model [27]. The mode patterns resulting from the propagation in SMMF and the distribution of depolarizations have been investigated [28]. Using an SMMF with a diameter of 125 μm and a length of 5.12 mm, FF-OCM has been demonstrated for the first time. 3D images of a dried fish fin were obtained by placing the SMMF in contact with the sample [29]. We have also reported the images obtained by FF-OCM with SMMF of a diameter of 125 μm and a length of 7.4 mm using ex vivo rat brains [30].
In the field of neurosciences, OCT has also been demonstrated as a promising imaging tool [31]. OCT enables non-invasive visualization of the structures and functionality of the brain, which is valuable for fundamental research and medical diagnosis. 3D Doppler OCT used for regional cerebral blood flow (CBF) measurements in rat cortexes has been reported to obtain the absolute CBF [32]. OCT angiography revealed microvascular hemodynamics in the rat somatosensory cortex during subject activity [33]. The refractive index in the somatosensory cortex of in vivo rats has also been measured using FF-OCT [34]. In vivo imaging of neuronal cell bodies and the cortical myelination of rats up to depths of 1.3 mm were demonstrated using sealed cranial windows and a 1.3 μm spectral domain OCM [35]. Single-myelin-fiber imaging of in vivo rat cortexes at a depth of 0.34 mm was also performed using OCM with high resolution and cranial windows [36]. The imaging of cytoarchitecture and myeloarchitecture in the rodent cortex in vivo was demonstrated using spectral domain OCM [37].
It is known that white matter is crucial for cognitive functions, and that age-related white matter alterations and the loss of myelinated fibers and oligodendrocytes may have important implications in age-related cognitive and mnemonic impairments [38,39]. Therefore, it is necessary to study the white matter at a cellular level [40]. Using the window on a skull, OCT images of in vivo rat brain have been obtained at depths of 1.3 mm with axial resolution of 4.7 μm. It is necessary to have in vivo and ex vivo imaging of deeper areas under the cortex with high spatial resolution. As the thickness of the cortex is approximately 1.5 mm [41], low-invasive thin probes with a spatial resolution of a few micrometers are necessary; however, using such a probe for in vivo imaging has not been reported yet.
In this study, we demonstrate the OCM imaging of in vivo rat brain by means of FF-OCM using an SMMF probe with an OD of 125 μm and a length of 7.4 mm. First, the imaging conditions as the basic characteristics of SMMF are shown; subsequently, the experimental setup, spatial resolution, and influences of linearly polarized (LP) modes on the images in SMMF are described. Finally, experimental procedures to insert the SMMF into the brain, and 3D OCM images in tissues are demonstrated.

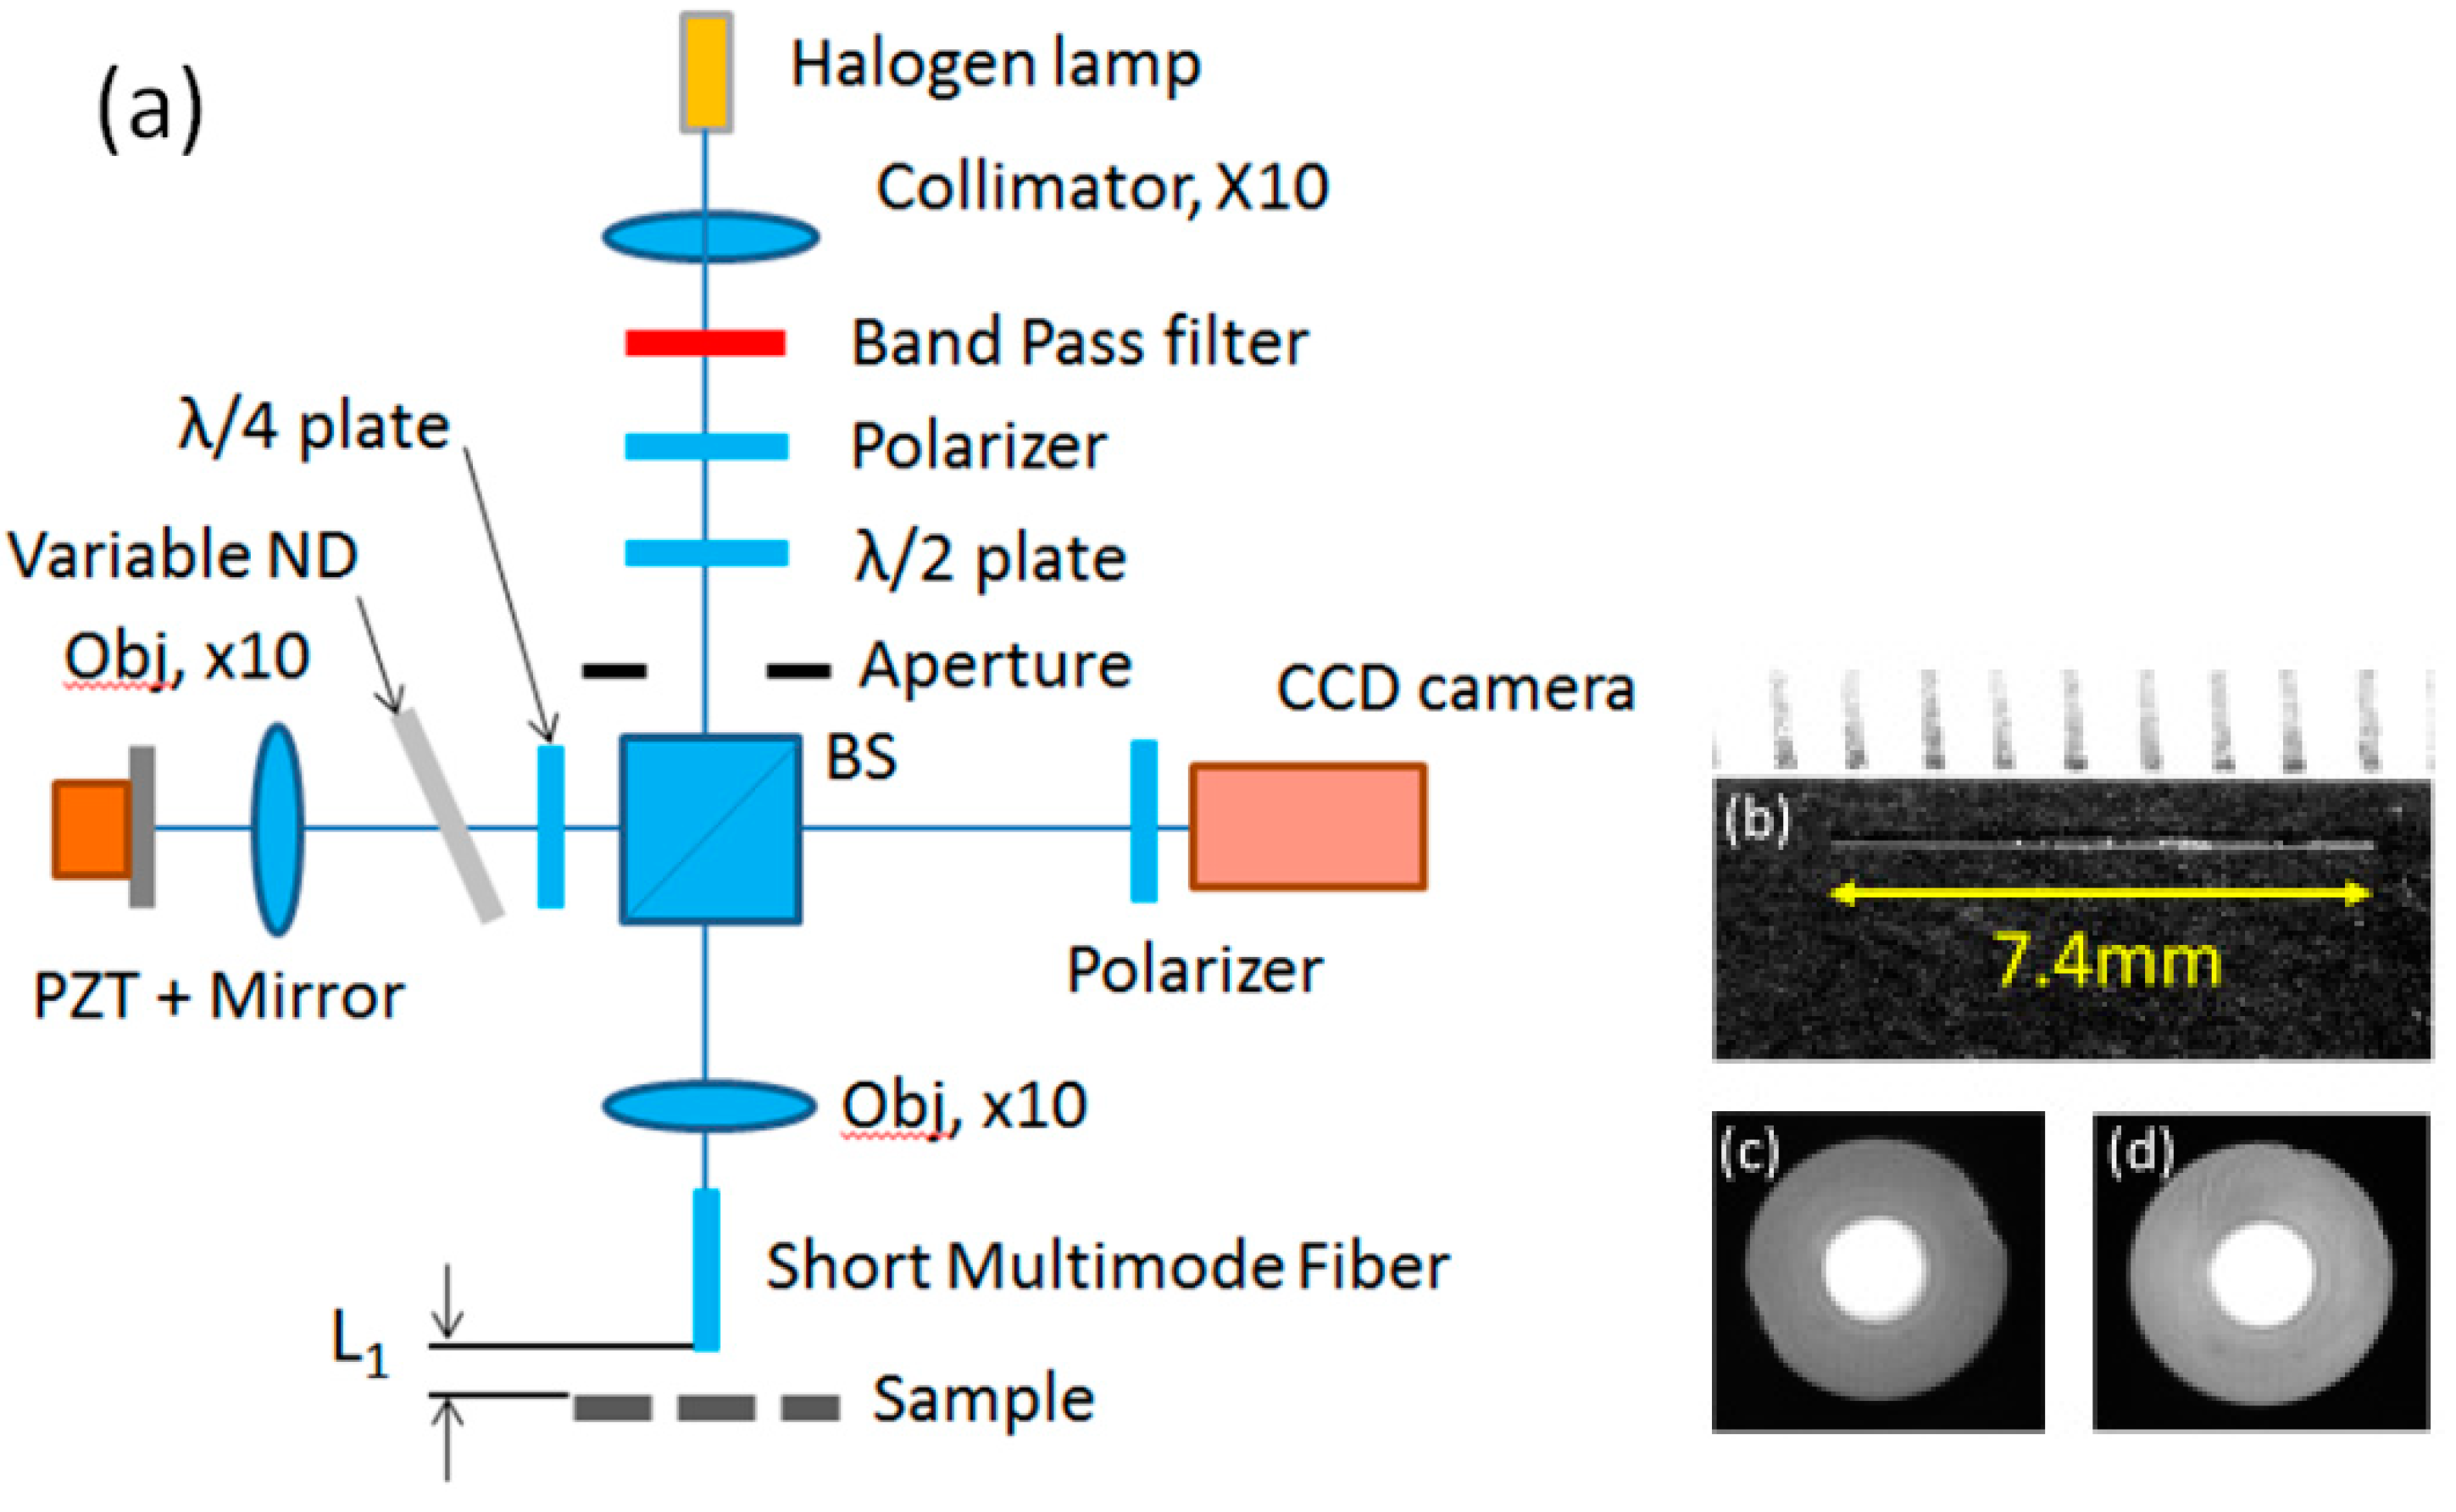
2. FF-OCM Using SMMF

The time-domain FF-OCM with four-phase shifting was utilized [29]. The OCM system (Figure 1a) was modified to reduce the light incident into the charge-coupled-device (CCD) camera by reflections at the SMMF facet. The light from a halogen lamp, collimated with a microscope objective lens (×10, NA 0.25, focal length 16.6 mm), was incident onto the band-pass filter, polarizer, half-wave plate to change the angle of polarization, and non-polarizing beam splitter (BS) through the aperture. The reference arm consisted of a quarter-wave plate, variable neutral-density (ND) filter, dispersion compensator, objective lens (Edmund, DIN, ×10, focal length 16.6 mm, working distance 6.3 mm, NA 0.25), and a reference mirror with a lead zirconate titanate (PZT). The quarter-wave plate converted linearly polarized light into circularly polarized light.
The signal arm consisted of the same objective lens (×10), the SMMF, and the sample. The illumination power was 13 μW at the exit of the SMMF. The polarizer was set in front of the CCD camera (AVT, Manta G–033, 656 × 492 pixels, cell size 9.9 μm × 9.9 μm, bit depth 8–12 bits, maximum speed 88 fps). To reduce the light reflected at the facet of SMMF into CCD using polarizations, the vertical polarization components perpendicular to the incident polarization into SMMF were imaged as OCM images.
OCM images were obtained at 17 fps without depth scanning. For the SMMF, the multimode fiber was cut using a fiber cleaver (Fujikura, CT–22). Photographs of both facets and the 7.4 mm long SMMF are shown in Figure 1b. The two facets are clean with no cracks around the cladding as shown in Figure 1c,d.

3. Results

3.1. Basic Characteristics

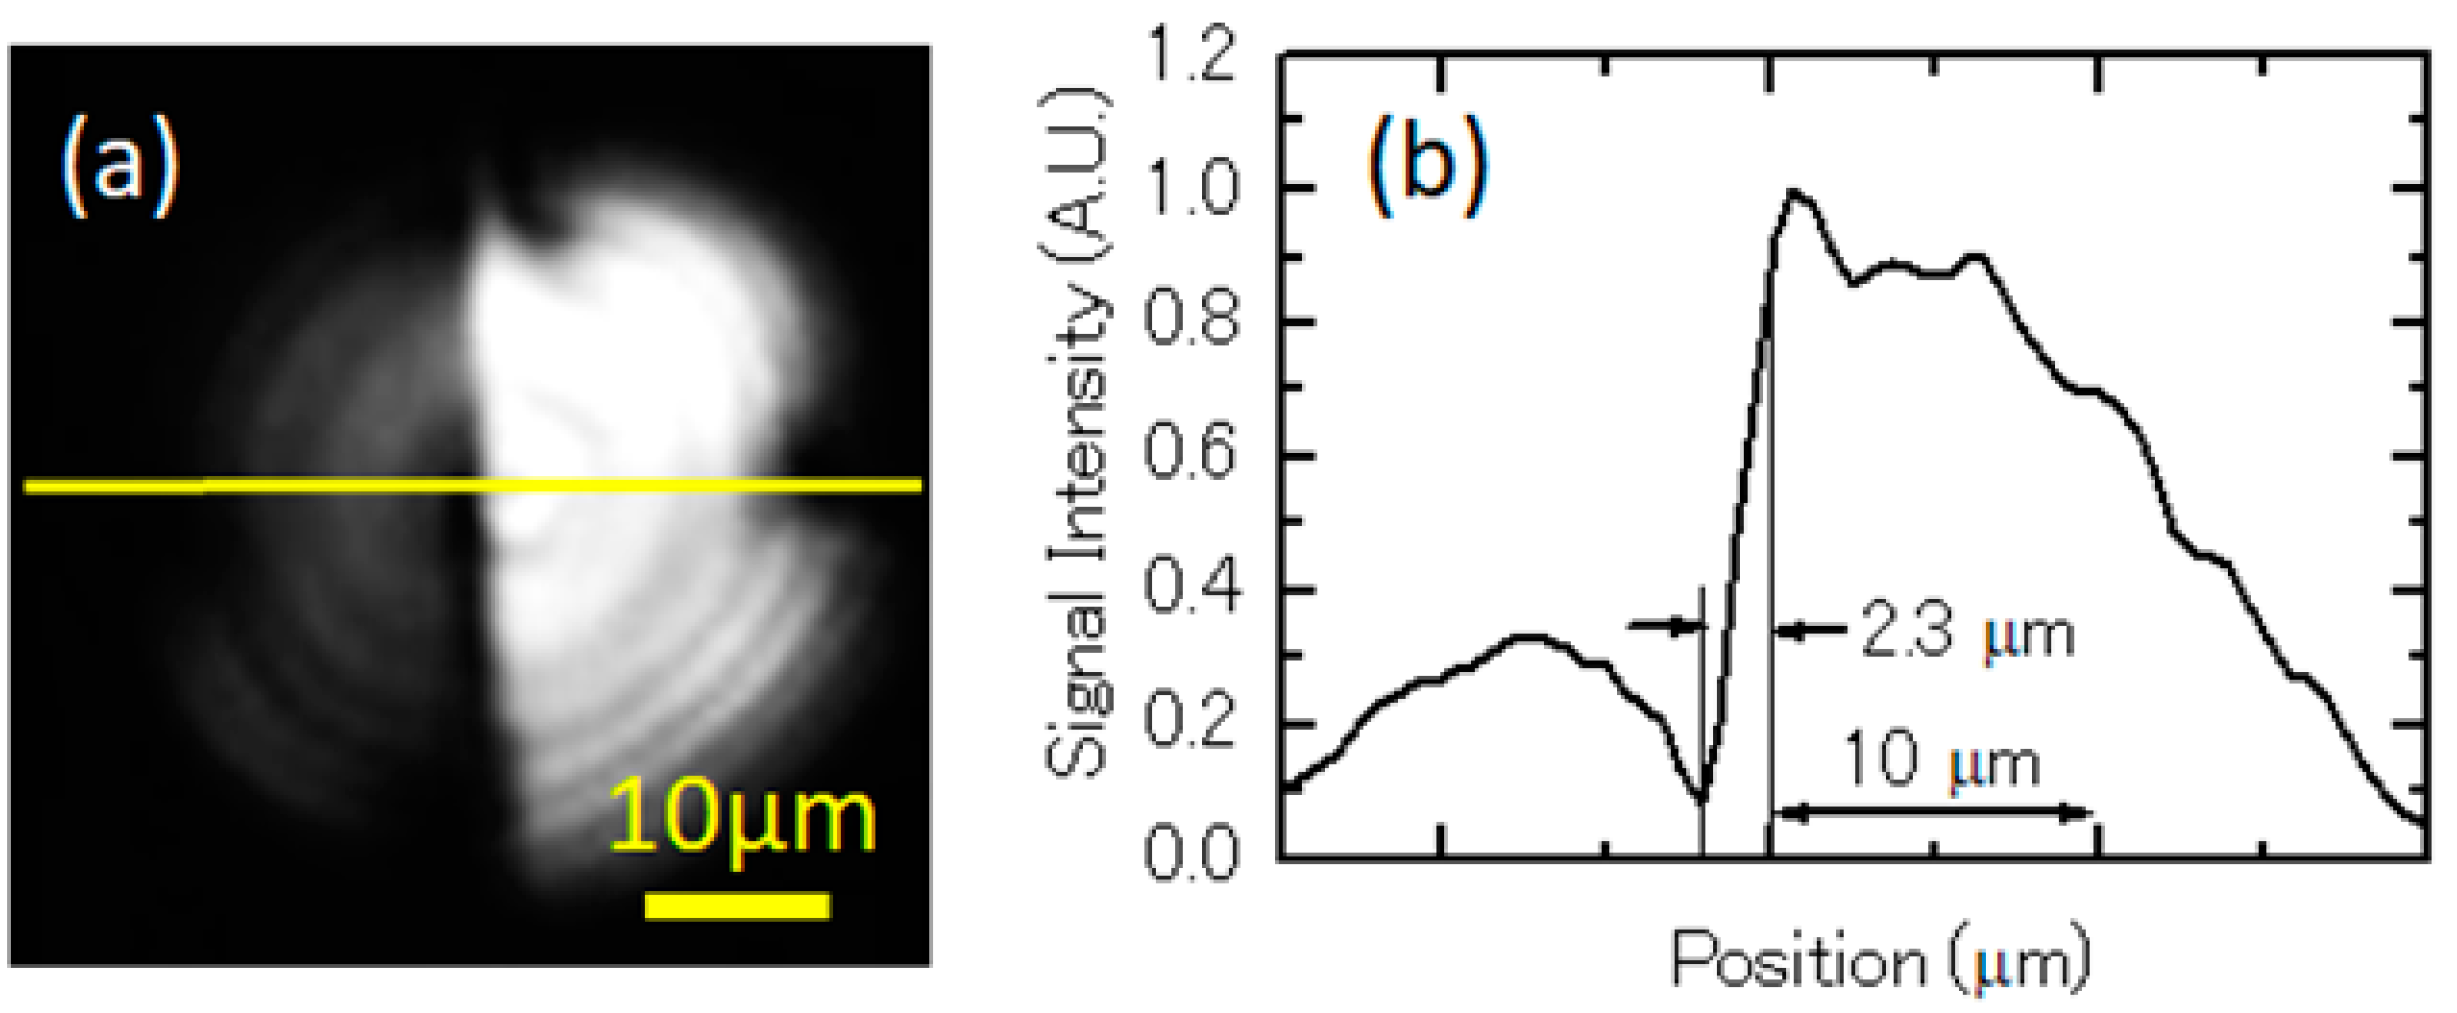
3.1.1. Spatial Resolution
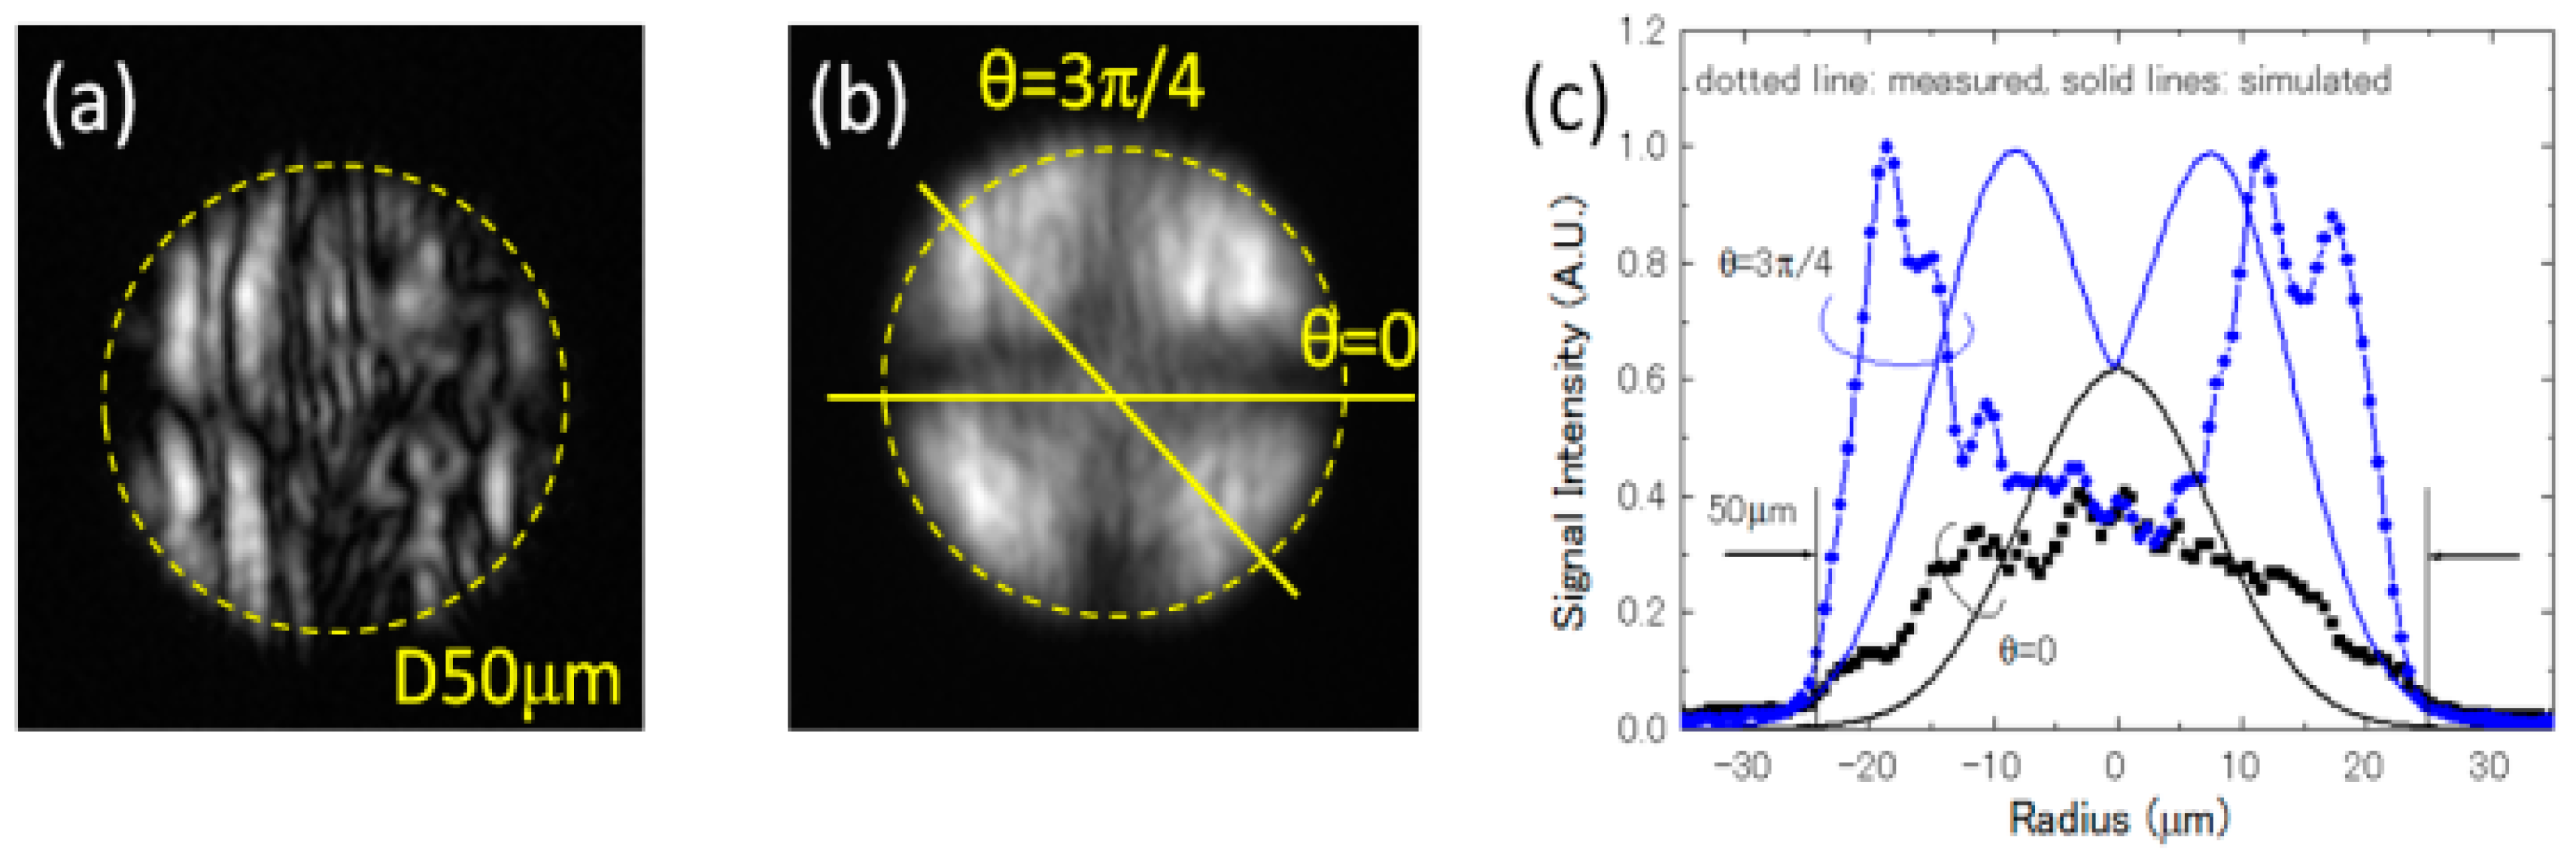
The measured imaging condition and magnifications approximately corresponded to those of calculations as described in Reference [29]. After the band-pass filter in Figure 1a, the peak wavelength of a light, central wavelength λ0, and bandwidth (full width at half maximum, FWHM) were 739 nm, 784 nm, and 132 nm, respectively. Assuming a Gaussian spectrum, the axial resolution was calculated to be 2.06 μm. The axial resolution was measured to be 2.14 μm with dispersion compensations.
The lateral resolution was evaluated using the edge of test pattern (TP) from the OCM images as shown in Figure 2a. The width of 10% to 90% of the edge response function corresponds to the FWHM of the line spread function [42]. The intensity profiles indicated by the solid line in Figure 2a are shown in Figure 2b to show the lateral resolution of 2.3 μm. The spot size of the OCM images was calculated by 0.52λ0/NA, using the wavelength, denoted by λ0, and the numerical aperture, denoted by NA. It was calculated to be 2.01 μm with the calculated NA of 0.203 and wavelength of 0.78 μm. This calculated spot size almost corresponds to the measured value of 2.3 μm.
The V parameter and the number of modes M were calculated to be 40.7 and 414 at the grade profile parameter p = 2 [43], respectively, indicating that many spatial modes could propagate in the SMMF. As many LP modes make the point spread function converge into the Airy disk [44], any image can be composed of LP modes. Therefore, an SMMF can transfer any image using LP modes.

3.1.2. Mode Pattern

We have previously studied the relations among LP modes, depolarizations, and imaging in SMMF [28]. The refractive index profile n 2 ( r ) of the SMMF is represented by:
n 2 ( r ) = n 20 { 1 2 ( r a n ) p Δ } 1 / 2 , r a n
where an is the core radius, p is the grade profile parameter, and Δ is the core-cladding index contrast. The value of p is ~2. The refractive index n20 is calculated using the Sellmeier equation [43]. In weakly guiding fibers, the LP(l, m) mode denoted as the LPl m mode is usually used [45,46]. By solving the basic wave propagation equations in a graded-index fiber using Equation (1), the electric field in the polar coordinate (r, θ) is:
E l m ( r , θ ) = C N R l m ( r ) sin ( l θ + θ 0 ) ,
R l m ( r ) = r l exp ( n 1 k 0 2 a n 2 Δ r 2 ) L m 1 ( l ) ( n 1 k 0 a n 2 Δ r 2 )
where l and m are integers, CN is the normalization constant, θ0 is the initial phase, Lm−1(l) represents Laguerre polynomials, and k0 is the wave number. When the linearly polarized light (horizontal) is incident into the SMMF and the propagated light is reflected at the facet of the SMMF through the exit polarizer pattern, images can be measured depending on the angles of the exit polarizer owing to propagation modes and depolarization characteristics of the SMMF. The exit image through the polarizer (vertical) is given by:
I y = [ A 01 y 2 R 01 ( r ) 2 + A 11 y 2 R 11 ( r ) 2 { 1 cos ( 2 θ ) } + A 21 y 2 R 21 ( r ) 2 { 1 cos ( 4 θ ) } ] δ ,
where A01, A11, and A21 are the coefficients for LP01, LP11, L21 modes, respectively, θ is the angle with respect to the vertical axis, and δ is the depolarization ratio in the core. Comparing the measured profiles with the simulated ones, the coefficients A01:A11:A21 are obtained as 1:0.447:0.837.
Using the sample mirror, the OCM image was obtained as shown in Figure 3a. The OCM image shows the “dark cross” owing to the combinations of three LP modes and residual concentric fringes. The profiles at θ = 0 and 3π/4 are shown in Figure 3c. The asymmetry in the intensity profiles is due to subtle misalignments of the sample mirror and there are dips around the center in the intensity profiles.
We simulated the OCM image using Equations (2) and (3). As the OCM image is the interference image with the signal wave and the reference wave, assuming that the reference wave is the plane wave, the OCM image is proportional to the absolute value of the signal wave. The absolute electric fields of the signal light were simulated with the coefficients of A01:A11:A21 of 1:0.447:0.837 as shown in Figure 3b. The profiles at θ = 0 and 3π/4 are also superimposed in Figure 3c. The measured signal intensity around the center is relatively lower than the simulated ones. As it is known that the distribution of refractive index tends to have local fluctuations in the core and small ripples in the central region of the fiber owing to the fabrication process [47], the signal lights were disturbed to decrease the interference signal and finally, the signal intensity of the OCM image decreased around the center. Consequently, the measured intensity profiles are relatively more deviated than the simulated ones owing to the decrease in the signal intensity around the center.
We also obtained the OCM images of the polished aluminum sample 30 times by changing the positions randomly. A typical OCM image is shown in Figure 4a in which vertical scratches can be observed. The OCM image in Figure 4b is an average of all the OCM images in which the “dark cross” can also be observed. This indicates that this dark cross does not depend on the samples, and that it influenced the averaged images. Similarly, the measured and calculated profiles with the same coefficients at θ = 0 and 3π/4 are shown in Figure 4c. Thus, the measured signal intensities around the center were lower than the simulated ones, possibly owing to the decrease in interference as mentioned above.

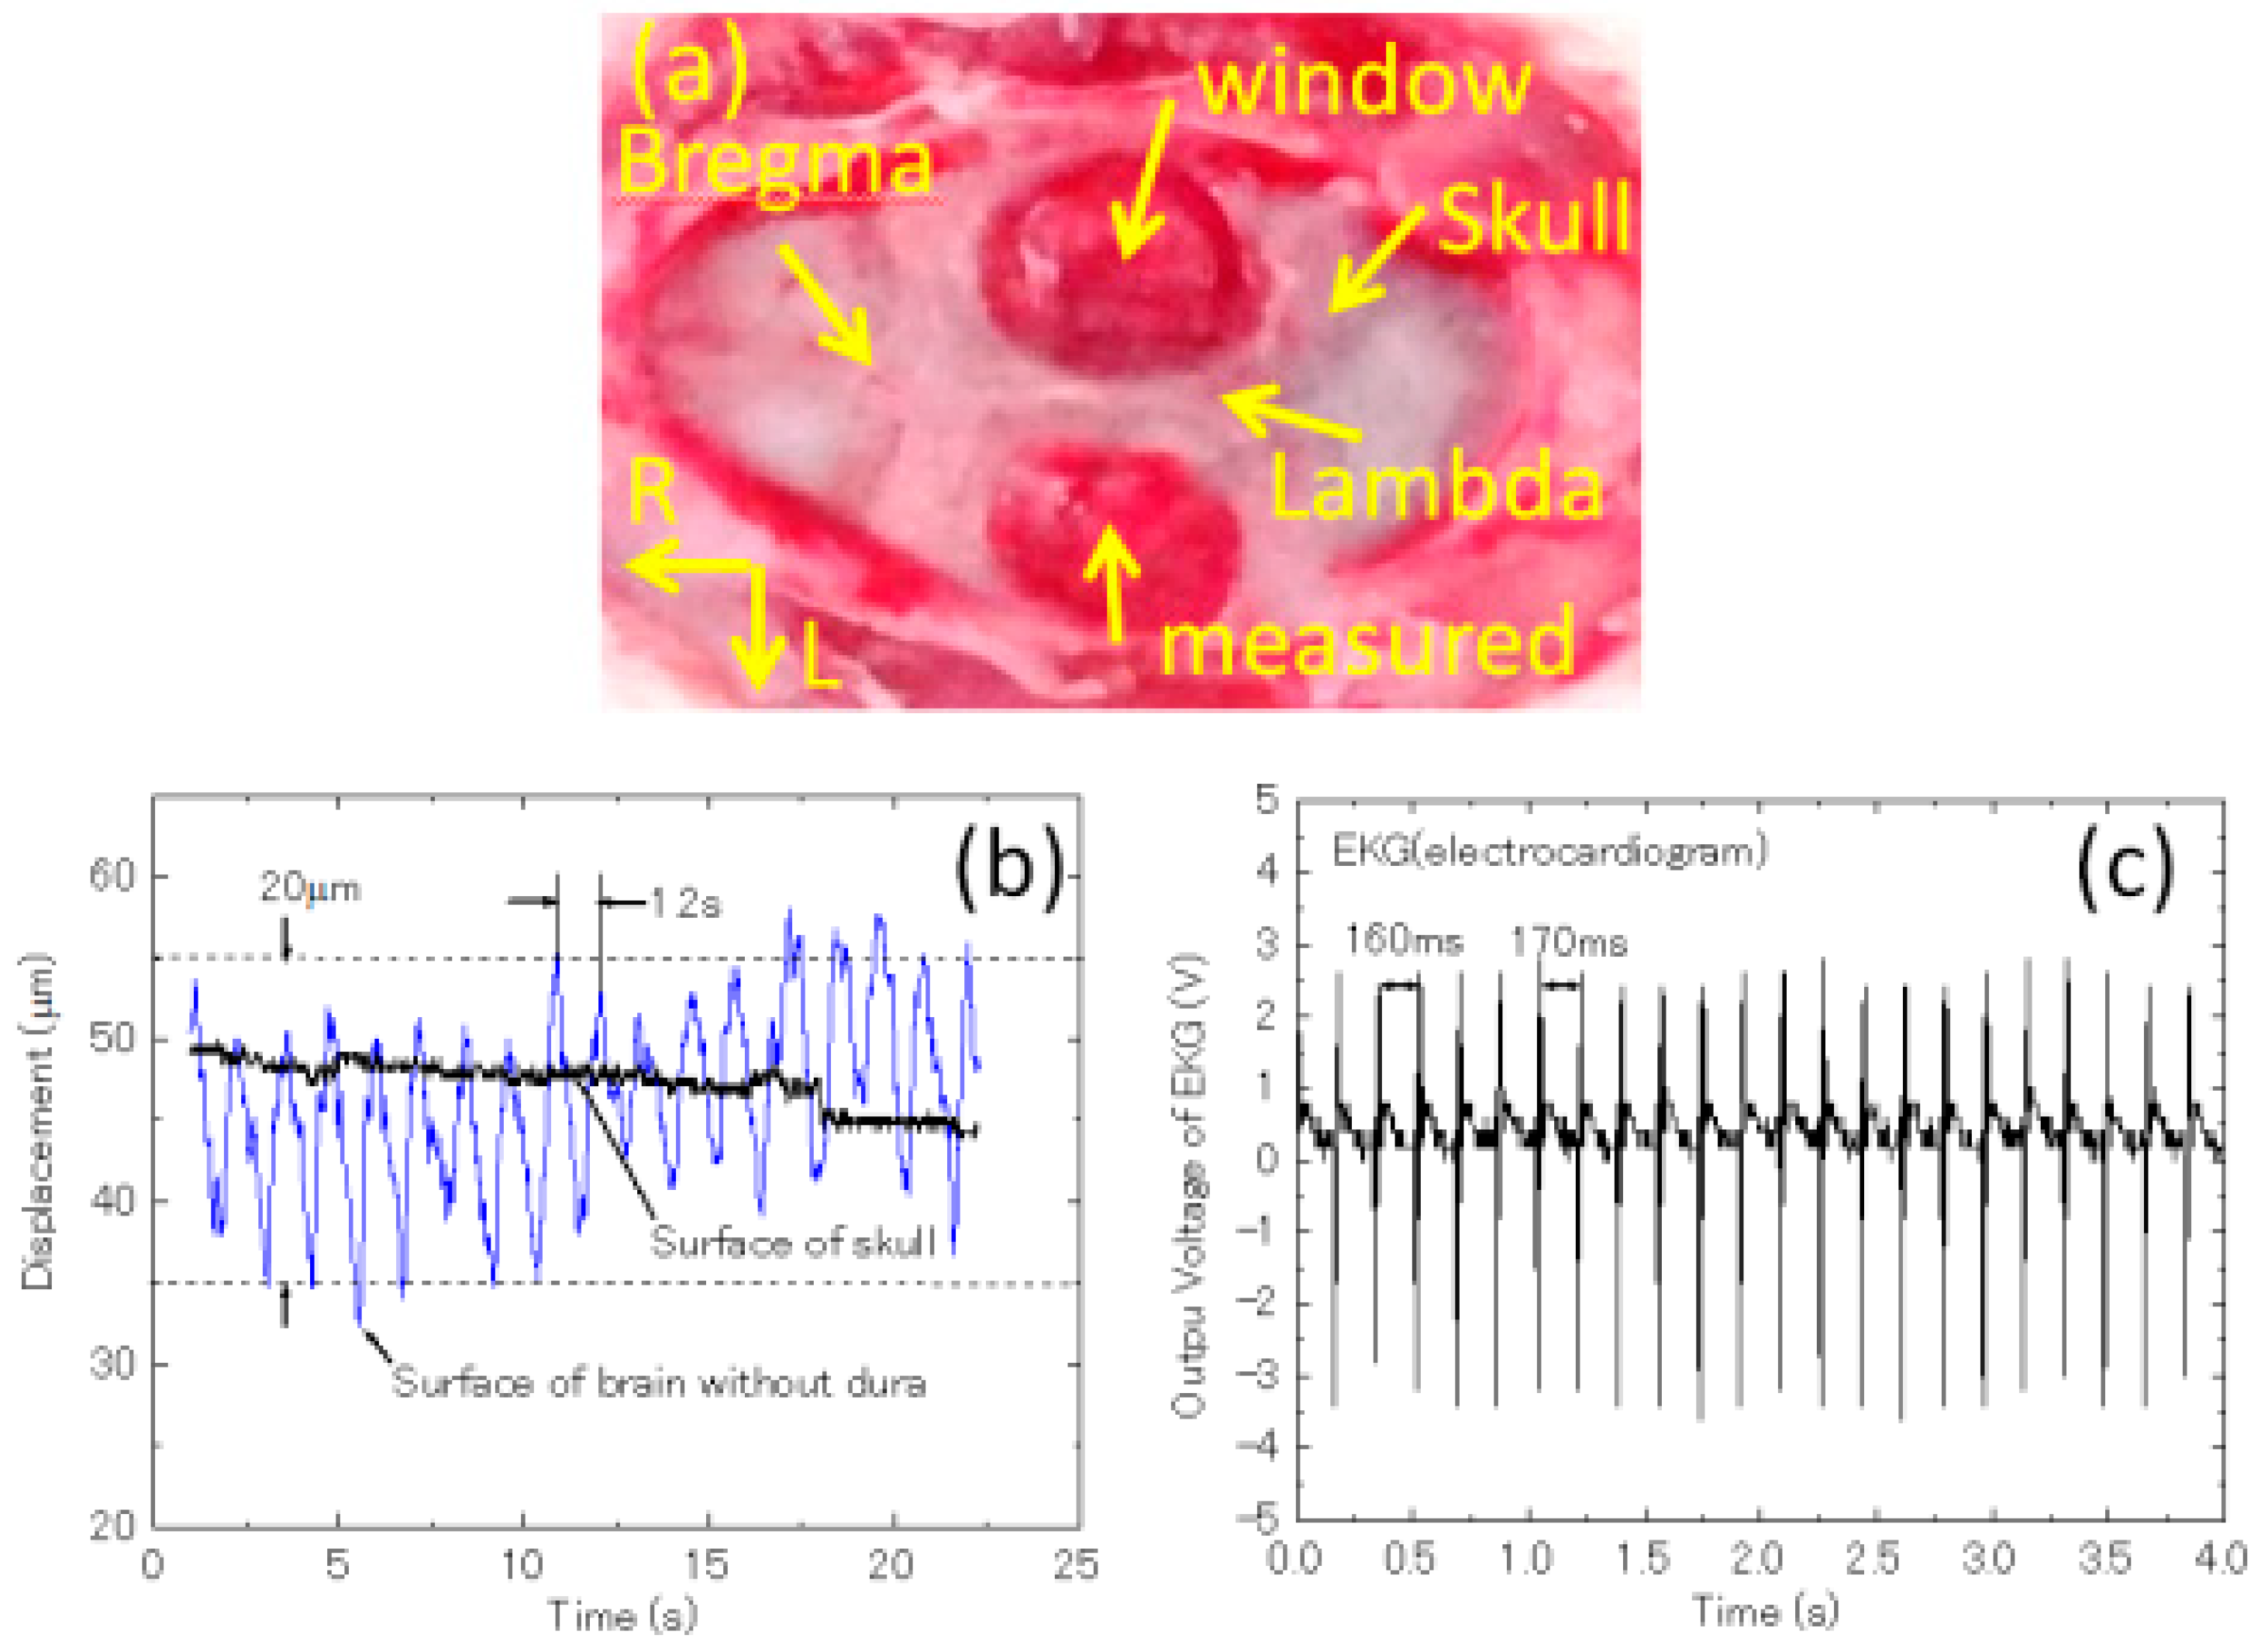
3.2. Imaging of Biological Samples

This study was performed under a research protocol approved by the Animal Research Committee of Yamagata University. Two male Wistar rats were anesthetized initially using diethylether and subsequently by intraperitoneal injections of pentobarbital sodium salt (30 mg/kg). The weights of Rat 1 and Rat 2 were 430 g and 480 g, respectively. After ~15 min, the head was secured in a stereotaxic apparatus. We cut windows with diameters of ~6 mm on the skull using a dental drill and removed the dura (Figure 5a).
We measured the displacement of skull surfaces and cortexes using a laser displacement sensor (Keyence, LC–2450, wavelength, 670 nm; precision, 0.5 μm; spot diameter, 45 μm × 20 μm; sampling frequency, 1 kHz). A typical result for Rat 1 is shown in Figure 5b. The displacements on the skull were slow and approximately a few micrometers, and those of the cortex were ~20 μm synchronizing with a breath rate of 50 min−1. During measurements, electrocardiograms (EKGs) were recorded using a bioelectric amplifier (Nihon Koden, MEG–1200) and a head amplifier (Nihon Koden, JH–110J). The typical result of Figure 5c for Rat 1 shows that the pulse of the EKG was 350–370 beats/min and stable through the measurements.
The stereotaxic apparatus containing the rat was placed perpendicularly on the 3D micrometer slide stage. The cortex was brought near the SMMF using a micrometer slide stage, which controlled the insertion length (IL) of the SMMF into the cortex. The SMMF was fixed in front of the objective lens using a stainless-steel jig (Figure 6a,b). The photographs of the SMMF and a cortex surface were recorded using another CCD camera from above (Figure 6c). During the measurements, a physiological saline solution was poured with a syringe to prevent the cortex from drying out.
After the SMMF was inserted into the cortex using the micrometer slide stage, 100 en face OCM images were obtained by scanning the reference mirror in steps of 2 μm. The size of the OCM image was 200 × 200 pixels. The total scan depth was 147 μm, considering the refractive index of tissues of 1.3526 [34]. 50 en face images were averaged at each scan depth. The measurement time was 5 min owing to the depth-scanning speed with a slow stepping motor. The ILs of the SMMF ranged from zero in contact, to a maximum depth of 4 mm with steps of 0.5 mm each. These ILs correspond to displacements of the micrometer slide stage and approximate depths of the tip of the SMMF below the tissue surface.
The measured position of Rat 1(Figure 6d) was at −2.3 mm rostral (R) and 3 mm lateral (L) to the Bregma in the left primary somatosensory cortex. We also cut an 11 mm × 9 mm window on the skull of Rat 2 and removed the dura. The measured positions were P1: 2.17 mm R, 1.0 mm L; P2: 1.98 mm R, 1.0 mm L; P3: 1.70 mm R, 1.0 mm L; P4: 1.98 mm R, 1.25 mm L relative to the Bregma in the left secondary motor cortex. The cortex thicknesses were 1.4–1.9 mm [41,48]. These measured positions were practically selected to avoid blood vessels.
The measurement points for Rat 1 were distributed in the depth direction across the somatosensory cortex to the hippocampus. After measurements, the brain of Rat 1 was excised and stained with the standard H&E stain process. The tissue was cut by the coronal plane and near the wound created by the SMMF. The inserted path in the atlas in Figure 6d and photograph in Figure 7a shows that the tip of the SMMF reached the dentate gyrus (DG) in the hippocampus. The wound at the cortex surface can be observed. According to Reference [49], the lined-up oligodendrocytes and the pyramidal cell layer can also be observed in Figure 7b,c. However, it was difficult to discuss the absolute depth, as the tissue shrank owing to the staining process.
En face (x–y) and resliced (x–z) images with an IL of 2.0 mm are shown in Figure 8a,b, respectively (see film of Figure 8a,b). These images include many shapes such as grains and short fibers, and are localized at depths from approximately 30 μm to 60 μm. Typical en face images at depths of 2.055 mm and 2.536 mm, showing the gray and white matters, respectively, are shown in Figure 8c,d. The dotted line circles denote a field of view (FOV) with a diameter of 47 μm. The influence of the mode pattern as shown in Figure 4b is not remarkable but is superimposed on the OCM images. The figure insets show the intensity profiles as indicated by yellow bars. The diameters of the short fibers and grains are ~2 μm, whereas some short fibers are longer, i.e., from 5 μm to 10 μm. In nerve tissues, myelinated axons manifest themselves as a high-backscattering region [35], with their diameters ranging from 0.5–4.0 μm [50].
The measurement points for Rat 2 were also distributed in the depth direction from the motor cortex to the forceps minor of the corpus callosum. At positions P1 to P3 of Rat 2, images were obtained by inserting the SMMF to a depth of 3.5 mm with steps of 0.5 mm each. At the position P4, images were measured to a depth of 4.0 mm, and en face (x–y) and resliced (x–z) images are shown in Figure 8e,f (see movies of Figure 8e,f), respectively. Typical en face images at depths of 2.038 mm and 2.547 mm are shown in Figure 8g,h, respectively. From the figure insets, the diameters of the short fibers and grains are similar to those in Figure 8c,d. In Figure 8f, en face images are more localized in a narrower depth region and will be discussed later.
As mentioned before, in vivo OCM images of rat and mouse cortexes have been previously obtained using a sealed cranial window with a glass coverslip to reduce the tissue movement. The imaging of single myelinated fibers has been demonstrated using scanning-type spectral domain OCM with an axial resolution of 4.7 μm and a lateral resolution of 0.9 μm [37], with which myelin fibers perpendicular to the optical axis were visualized [35]. The imaging of myelin fibers was also demonstrated using an OCM based on a Linnik interferometer with an axial resolution of 1.2 μm and a lateral resolution of 0.5 μm [36]. There are three reasons why nerve fibers appear discontinuous in the images obtained: (i) Structural disruptions of the fiber; (ii) speckling in the images; and (iii) interference fringes along the fiber’s length owing to interference [36].
In our study, displacements of a tissue surface owing to breaths were measured to be ~20 μm without a sealing window and these displacements would decrease with increasing depth. However, tissue movement, an axial resolution of 2.14 μm (1.58 μm in tissues), and a lateral resolution of 2.3 μm influenced discontinuities and showed shapes such as grains in the OCM images.
As the shape of the cortex is curved three-dimensionally and the nerve fibers are distributed in the cortex, the OCM images were evaluated using Volume Viewer v.1.31 in Image J (v.1.49d) with different scales as shown in Figure 9. These orthoslice images were obtained with the threshold of 0 and resampling factor of 2 in ImageJ. The positions of the orthoslice images in Figure 9a,b are shown in Figure 8a with two dotted rectangles. As the resampling factor is 2 to reduce the noise, the 3D size of the area is the same, but the number of pixels is halved. The 3D size and pixels of Figure 9a are X 51.5 μm 49 pixel, Y 51.5 μm 49 pixel, Z 104 μm 43 pixel and those in Figure 9b are X 14.9 μm 13 pixel, Y 12.4 μm 11 pixel, Z 8.1 μm 4 pixel. (see film of Figure 9a,b)
The short fibers and distributions in 3D space can be observed in Figure 9a and in the film files. Moreover, allowing for the differences of magnification, they are similar to the OCM images of an in vivo rodent cortex obtained with sealed windows as shown in Reference [36] (Figure 7c) and Reference [37] (Figure 6e). In the smaller 3D area, 3D shapes can also be observed in Figure 9b. The diameter of the imaged fibers is approximately determined as ~2 μm, comparable to the spatial resolutions. The practical diameters of the nerve fibers may be less than the spatial resolution; however, the rough 3D information such as connections and curves of imaged fibers can also be observed. However, owing to the reasons mentioned above, continuous and long 3D shapes of fibers have not been measured yet.
Myelinated axons in the en face plane were prominent in cortical layer I and IV–VI [35]. We investigated variations of the amounts of OCM image signals with changes in depth. At each IL, the dependence of sums of signal intensity in each en face image on the scan depth up to 147 μm for Rat 1 and Rat 2 at P4 are shown in Figure 10a,b, respectively. After subtracting the background, pixel values were added as the sum of signal intensities in the en face image. These dependencies on the scan depth mainly depend on the depth of focus (DOF) in the OCM system and the distribution of backscatterers such as nerve fibers. The DOF as the FWHM of contrast was obtained as 66 μm as shown in Reference [30] (Figure 5). The sum of signal intensities decreased at a depth greater than approximately 80 μm as shown in Figure 10a,b, owing to DOF. The dependence of these sums on depth is also due to local structures and distributions of scatterers in tissues. The sums of signal intensities are distributed in the depth direction from approximately 20 μm to 90 μm.
Assuming that neuron fibers dominate the en face images owing to myelinated axons that are highly backscattering, the signal intensity increases with the amount of neuron fibers. For each IL, all the signal intensities within the measured volume (the FOV of en face image by scanned depth) approximately indicate the amounts of nerve fibers. For Rat 1 and Rat 2 at positions P1 to P4, the dependences of the signal intensity integrations in the measured volume on the IL were obtained as shown in Figure 10c. For Rat 1, the maximum integration is at a depth of 2.0 mm. For Rat 2, the dependences of the integrations on the IL were averaged, and the average curve has a maximum at an IL of 2.5 mm. In conjunction with Figure 6d and Figure 7, these results show that the amount of fibers reaches a maximum around the bottom of the cortex. These results nearly correspond to Reference [37] (Figure 3i). Therefore, owing to the morphological information in Figure 8 and Figure 9 and the IL dependence shown in Figure 10c, the obtained en face images mainly show myelinated axons.

4. Discussion

The practical applications of an SMMF present some problems. First, the signal intensities in en face images are influenced by the LP mode. We reduced the reflection of the SMMF using polarization to avoid the saturations of CCD, but a better approach would be to use optical index-matching with non-polarization optics to avoid influences of mode patterns in the images. A second challenge is the contact between the SMMF facet and the tissue. Ideally, the SMMF should be smoothly inserted into the tissue and the facet should adhere to it completely. At present, as the facet is as cut, good contact with the tissue could not be confirmed. We are investigating a process to modify the tip of the SMMF to remedy this issue.
Rat cortexes consist primarily of neurons, glial cells, and nerve fibers. The densities of neurons and glial cells such as astrocytes, microglia, and oligodendrocytes have been reported. Assuming that these cells are uniformly distributed in tissues, the mean interval distances between cells can be estimated. Such densities, mean distances, and typical cell sizes are summarized in Table 1.
As the FOV in this measurement of an SMMF is 47 μm in diameter, and the measured depths span are approximately 20–90 μm, statistically, one or two cells would be observed in the measured volume considering the distances listed in Table 1. We occasionally measured low signal-intensity regions in these volumes. These regions might correspond to neurons, but this was not confirmed. Through in vivo and ex vivo imaging of rat brains, we irregularly obtained bright images with diameters ranging from 5–7 μm in en face images. The possibility that other glia—in addition to neurons—might possess backscattering properties has been reported [37]. This will be investigated in more detail.
For applications of OCT for the imaging of cytoarchitecture and myeloarchitecture in brains, connectivity, neuropathic progression, and developmental appearance have been discussed [30]. By inserting an SMMF up to approximately 6 mm, FF–OCM has the potential to image deeply to obtain useful information. Further, with the use of intrinsic optical signals, new insights into morphology and its functions might be obtained. However, for practical applications, the overall performance in terms of measurement speed, sensitivity, and system size must be improved.

5. Conclusions

We demonstrated FF–OCM using an ultrathin forward-imaging SMMF probe of core diameter 50 μm, OD 125 μm, and length 7.4 mm, which is a typical graded-index multimode fiber for optical communications. The axial and lateral resolutions were measured to be 2.14 μm and 2.3 μm, respectively.
By inserting the SMMF up to a maximum of 4 mm into the cortex of an in vivo rat brain, 3D OCM images with an FOV of 47 μm and depth of 147 μm from the SMMF facet were obtained. Images of tissues were obtained from scan depths of approximately 20–90 μm. En face images containing grain-like shapes of a few microns and short fibers of length 5–10 μm were obtained.
The 3D fiber structures were presented in the region of X 51.5 μm, Y 51.5 μm, and Z 104 μm using orthoslice imaging. Furthermore, the 3D fibrous structures such as connections and bending were recognized in the region of X 14.9 μm, Y 12.4 μm, and Z 8.1 μm. The diameters of these fibrous shapes were approximately 2 μm, similar to the spatial resolution of FF–OCM.
The dependence of signal intensity integration of the en face images on the insertion length of the SMMF reached a maximum near the bottom of the cortex, corresponding roughly to a reported depth-dependent myelination profile. The practical diameters of nerve fibers may be less than the spatial resolution; however, the 3D information such as connections and curves of nerve fibers can also be obtained. In the field of neurosciences, the feasibility of an SMMF as an ultrathin forward-imaging probe in FF–OCM has been demonstrated.

Supplementary Materials

The following are available online at https://www.mdpi.com/2076-3417/9/2/216/s1, Video S1: en face OCM image of Rat 1.avi, Video S2: resliced OCM image of Rat 1.avi, Video S3: en face OCM image of Rat 2.avi, Video S4: resliced OCM image of Rat 2.avi, Video S5: 3D orthoslice OCM image. avi, Video S6: expanded 3D orthoslice OCM image.avi.

Author Contributions

All the authors contributed to this work. M.S. and I.N. discussed the basis of this study. M.S. performed the simulations. M.S. and J.M. developed the software. M.S. and K.I. built the mechanical stage system. M.S. and K.E. performed the measurements and experiments. M.S., R.K., and H.A. performed the staining and discussed the measured positions. M.S. wrote the manuscript.

Funding

This work was partially supported by JSPS KAKENHI Grant Number 18K12051.

Acknowledgments

We thank Nobuo Kuwaki of Kyoei High Opt Co. Ltd. and Kazuhiko Aikawa of Fujikura Ltd. for supplying the fibers and technical support, and Norihide Ogata of Yonezawa Precision Co., Ltd. for technical support.

Conflicts of Interest

The authors declare no conflict of interest.

References

  1. Huang, D.; Swanson, E.A.; Lin, C.P.; Schuman, J.S.; Stinson, W.G.; Chang, W.; Hee, M.R.; Flotte, T.; Gregory, K.; Puliafito, C.A.; et al. Optical coherence tomography. Science 1991, 254, 1178–1181. [Google Scholar] [CrossRef] [Green Version]
  2. Bouma, B.; Tearney, J. (Eds.) Handbook of Optical Coherence Tomography; Marcel Dekker: New York, NY, USA, 2002; ISBN 0-8247-0558-0. [Google Scholar]
  3. Podoleanu, A.G. Optical coherence tomography. J. Microsc. 2012, 247, 209–219. [Google Scholar] [CrossRef] [PubMed] [Green Version]
  4. Yaqoob, Z.; Wu, J.; McDowell, E.J.; Heng, X.; Yang, C. Methods and application areas of endoscopic optical coherence tomography. J. Biomed. Opt. 2006, 11, 063001-1–063001-19. [Google Scholar] [CrossRef] [PubMed]
  5. Lee, B.H.; Min, E.J.; Kim, Y.H. Fiber-based optical coherence tomography for biomedical imaging sensing, and precision measurements. Opt. Fiber Technol. 2013, 19, 729–740. [Google Scholar] [CrossRef]
  6. Li, X.; Chudoba, C.; Ko, T.; Pitris, C.; Fujimoto, J.G. Imaging needle for optical coherence tomography. Opt. Lett. 2000, 25, 1520–1522. [Google Scholar] [CrossRef] [PubMed]
  7. Yang, X.; Lorenser, D.; McLaughlin, R.A.; Kirk, R.W.; Edmond, M.; Simpson, M.C.; Grounds, M.D.; Sampson, D.D. Imaging deep skeletal muscle structure using a high-sensitivity ultrathin side-viewing optical coherence tomography needle probe. Biomed. Opt. Express 2013, 5, 136–148. [Google Scholar] [CrossRef] [PubMed]
  8. Mao, Y.; Chang, S.; Sherif, S.; Flueraru, C. Graded-index fiber lens proposed for ultrasmall probes used in biomedical imaging. Appl. Opt. 2007, 46, 5887–5894. [Google Scholar] [CrossRef] [PubMed]
  9. Reed, W.A.; Yan, M.F.; Schnitzer, M.J. Gradient-index fiber-optic microprobes for minimally invasive in vivo low-coherence interferometry. Opt. Lett. 2002, 27, 1794–1796. [Google Scholar] [CrossRef] [PubMed]
  10. Swanson, E.; Petersen, C.L.; McNamara, E.; Lamport, R.B.; Kelly, D.L. Ultrasmall Optical Probes, Imaging Optics, and Methods for Using Same. U.S. Patent 6,445,939, 3 September 2002. [Google Scholar]
  11. Liu, X.; Cobb, M.J.; Chen, Y.; Kimmey, M.B.; Li, X. Rapid-scanning forward-imaging miniature endoscope for real-time optical coherence tomography. Opt. Lett. 2004, 29, 1763–1765. [Google Scholar] [CrossRef]
  12. Park, H.-C.; Song, C.; Kang, M.; Jeong, Y.; Jeong, K.-H. Forward imaging OCT endoscopic catheter based on MEMS lens scanning. Opt. Lett. 2012, 37, 2673–2675. [Google Scholar] [CrossRef]
  13. Wu, J.; Conry, M.; Gu, C.; Wang, F.; Yaqoob, Z.; Yang, C. Paired-angle-rotation scanning optical coherence tomography forward-imaging probe. Opt. Lett. 2006, 31, 1265–1267. [Google Scholar] [CrossRef] [PubMed] [Green Version]
  14. Joos, K.M.; Shen, J.-H. Miniature real-time intraoperative forward-imaging optical coherence tomography probe. Biomed. Opt. Express 2013, 4, 1342–1350. [Google Scholar] [CrossRef]
  15. Fu, X.; Wang, Z.; Wang, H.; Wang, Y.T.; Jenkins, M.W.; Rollins, A.M. Fiber-optic catheter-based polarization-sensitive OCT for radio-frequency ablation monitoring. Opt. Lett. 2014, 39, 5066–5069. [Google Scholar] [CrossRef]
  16. Fu, X.; Patel, D.; Zhu, H.; MacLennan, G.; Wang, Y.T.; Jenkins, M.W.; Rollins, A.M. Miniature forward-viewing common-path OCT probe for imaging the renal pelvis. Biomed. Opt. Express 2015, 6, 1164–1171. [Google Scholar] [CrossRef]
  17. Liang, C.-P.; Wierwille, J.; Moreira, T.; Schwartzbauer, G.; Jafri, M.S.; Tang, C.-M.; Chen, Y. A forward-imaging needle-type OCT probe for image guided stereotactic procedures. Opt. Express 2011, 19, 26283–26293. [Google Scholar] [CrossRef] [PubMed]
  18. Oh, W.Y.; Bouma, B.E.; Iftimia, N.; Yelin, R.; Tearney, G.J. Spectrally-modulated full-field optical coherence microscopy for ultrahigh-resolution endoscopic imaging. Opt. Express 2006, 14, 8675–8684. [Google Scholar] [CrossRef] [PubMed]
  19. Izatt, J.A.; Swanson, E.A.; Fujimoto, J.G.; Hee, M.R.; Owen, G.M. Optical coherence microscopy in scattering media. Opt. Lett. 1994, 19, 590–592. [Google Scholar] [CrossRef]
  20. Federici, A.; Gutierrez da Costa, H.S.; Ogien, J.; Ellerbee, A.K.; Dubois, A. Wide-field, full-field optical coherence microscopy for high-axial-resolution phase and amplitude imaging. Appl. Opt. 2015, 54, 8212–8220. [Google Scholar] [CrossRef] [PubMed]
  21. Federici, A.; Dubois, A. Full-field optical coherence microscopy with optimized ultrahigh spatial resolution. Opt. Lett. 2015, 40, 5347–5350. [Google Scholar] [CrossRef]
  22. Tamborski, S.; Lyu, H.C.; Dolezyczek, H.; Malinowska, M.; Wilczynski, G.; Szlag, D.; Lasser, T.; Wojtkowski, M.; Szkulmowski, M. Extended-focus optical coherence microscopy for high-resolution imaging of the murine brain. Biomed. Opt. Express 2016, 7, 4400–4414. [Google Scholar] [CrossRef]
  23. Apelian, C.; Harms, F.; Thouvenin, O.; Boccara, A.C. Dynamic full field optical coherence tomography: Subcellular metabolic contrast revealed in tissues by interferometric signals temporal analysis. Biomed. Opt. Express 2016, 7, 1511–1522. [Google Scholar] [CrossRef]
  24. Sato, M.; Kanno, T.; Ishihara, S.; Suto, H.; Takahashi, T.; Nishidate, I. Reflectance Imaging by Graded-Index Short Multimode Fiber. Appl. Phys. Express 2013, 6, 052503-1–052503-3. [Google Scholar] [CrossRef]
  25. Sato, M.; Shouji, K.; Saito, D.; Nishidate, I. Imaging characteristics of a 8.8 mm long and 125μm thick graded-index short multimode fiber probe. Appl. Opt. 2016, 55, 3297–3305. [Google Scholar] [CrossRef]
  26. Sato, M.; Kanno, T.; Ishihara, S.; Suto, H.; Takahashi, T.; Kurotani, R.; Abe, H.; Nishidate, I. Imaging of rat brain using short graded-index multimode fiber. In Proceedings of the SPIE BiOS, San Francisco, CA, USA, 1–6 February 2014; Volume 8928, pp. 89281D-1–89281D-8. [Google Scholar]
  27. Sato, M.; Shouji, K.; Nishidate, I. Modulation transfer function of the imaging probe using an 8.8 mm-long and 125 μm-thick graded- index short multimode fiber. Opt. Commun. 2017, 385, 25–35. [Google Scholar] [CrossRef]
  28. Sato, M.; Eto, K.; Masuta, J.; Nishidate, I. Depolarization characteristics of spatial modes in imaging probe using short multimode fiber. Appl. Opt. 2018, 57, 10083–10091. [Google Scholar] [CrossRef]
  29. Sato, M.; Saito, D.; Shouji, K.; Kurotani, R.; Abe, H.; Nishidate, I. Ultrathin forward-imaging short multimode fiber probe for full-field optical coherence microscopy. Opt. Commun. 2016, 381, 296–308. [Google Scholar] [CrossRef]
  30. Sato, M.; Saito, D.; Kurotani, R.; Abe, H.; Kawauchi, S.; Sato, S.; Nishidate, I. Rat brain imaging using full field optical coherence microscopy with short multimode fiber probe. In Proceedings of the SPIE BiOS, San Francisco, CA, USA, 17 February 2017; Volume 10053, pp. 1005338-1–1005338-10. [Google Scholar]
  31. Mem, J.; Huang, Y.; Solanki, J.; Zeng, X.; Alex, A.; Jerwick, J.; Zhang, Z.; Tanzi, R.E.; Li, A.; Zhou, C. Optical coherence tomography for brain imaging and developmental biology. IEEE J. Quantum. Electron. 2016, QE-22, 6803213. [Google Scholar]
  32. Srinivasan, V.J.; Sakadzic, S.; Gorczynska, I.; Ruvinskaya, S.; Wu, W.; Fujimoto, J.G.; Boas, D.A. Quantitative cerebral blood flow with optical coherence tomography. Opt. Express 2010, 18, 2477–2494. [Google Scholar] [CrossRef]
  33. Srinivasan, V.J.; Radhakrishnan, H. Optical coherence tomography angiography reveals laminar microvascular hemodynamics in the rat somatosensory cortex during activation. Neuroimage 2014, 102, 393–406. [Google Scholar] [CrossRef]
  34. Binding, J.; Arous, J.B.; Leger, J.F.; Gigan, S.; Boccara, C.; Brourdieu, L. Brain refractive index measured in vivo with high-NA defocus-corrected full-field OCT and consequences for two-photon microscopy. Opt. Express 2011, 19, 4833–4847. [Google Scholar] [CrossRef]
  35. Srinivasan, V.J.; Radhakrishnan, H.; Jiang, J.Y.; Barry, S.; Cable, A.E. Optical coherence microscopy for deep tissue imaging of the cerebral cortex with intrinsic contrast. Opt. Express 2012, 20, 2220–2239. [Google Scholar] [CrossRef] [PubMed]
  36. Arous, J.B.; Binding, J.; Leger, J.F.; Casado, M.; Topilko, P.; Gigan, S.; Boccara, A.C.; Brourdieu, L. Single myelin fiber imaging in living rodents without labeling by deep optical coherence microscopy. J. Biomed. Opt. 2011, 16, 11116012-1–11116012-9. [Google Scholar] [CrossRef]
  37. Leahy, C.; Radhakrishnan, H.; Srinivasan, V.J. Volumetric imaging and quantification of cytoarchitecture and myeloarchitecture with intrinsic scattering contrast. Biomed. Opt. Express 2013, 4, 1978–1990. [Google Scholar] [CrossRef] [PubMed]
  38. De Groot, J.C.; de Leeuw, F.E.; Oudkerk, M.; van Gijn, J.; Hofman, A.; Jolles, J.; Breteler, M.M. Cerebral white matter lesions and cognitive function: The Rotterdam scan study. Ann. Neurol. 2000, 47, 145–151. [Google Scholar] [CrossRef] [Green Version]
  39. Kramer, J.H.; Mungas, D.; Reed, B.R.; Wetzel, M.E.; Burnett, M.M.; Miller, B.L.; Weiner, M.W.; Chui, H.C. Longitudinal MRI and cognitive change in healthy elderly. Neuropsychology 2007, 21, 412–418. [Google Scholar] [CrossRef]
  40. Shu, Y.; Wei, L.; De-Shan, Z.; Tang, Y. Enriched environment and white matter in aging brain. Anat. Rec. 2012, 295, 1406–1414. [Google Scholar]
  41. Ren, J.Q.; Aika, Y.; Heizmann, C.W.; Kosaka, T. Quantitative analysis of neurons and glial cells in the rat somatosensory cortex, with special reference to GABAergic neurons and parvalbumin-containing neurons. Exp. Brain Res. 1992, 92, 1–14. [Google Scholar] [CrossRef] [PubMed]
  42. Steven, W.S. The Scientist and Engineer’s Guide to Digital Signal Processing; California Technical Publishing: Poway, CA, USA, 1997; pp. 423–430. ISBN 0-9660176-3-3. [Google Scholar]
  43. Saleh, B.E.A.; Teich, M.C. Fundamental of Photonics; John Wiley & Sons: Hoboken, NJ, USA, 1991; ISBN 0-471-83965-5. [Google Scholar]
  44. Mahalati, R.N.; Gu, R.Y.; Kahn, J.M. Resolution limits for imaging through multi-mode fiber. Opt. Express 2013, 21, 1656–1668. [Google Scholar] [CrossRef] [PubMed]
  45. Synder, A.W.; Love, J.D. Optical Waveguide Theory; Chapman and Hall: London, UK, 1983; ISBN 0-412-24250-8. [Google Scholar]
  46. Okamoto, K. Fundamentals of Optical Waveguides; Academic Press: Cambridge, MA, USA, 2006; ISBN 0-12-525096-7. [Google Scholar]
  47. Marcuse, D.; Presby, H.M. Effects of profile deformations on fiber bandwidth. Appl. Opt. 1979, 18, 3758–3763. [Google Scholar] [CrossRef] [PubMed]
  48. Paxinos, G.; Watson, C. The Rat Brain; Academic Press: Cambridge, MA, USA, 2007; ISBN 0-12-547612-4. [Google Scholar]
  49. Paxinos, G. (Ed.) The Rat Nervous System, 3rd ed.; Academic Press: Cambridge, MA, USA, 2004; ISBN 0-12-547638-8. [Google Scholar]
  50. Chomiak, T.; Hu, B. What is the optimal value of the g-ratio for myelinated fibers in the rat CNS? PLoS ONE 2009, 4, e7754. [Google Scholar] [CrossRef]
  51. Garman, R.H. Histology of the Central Nervous System. Toxicol. Pathol. 2011, 39, 22–35. [Google Scholar] [CrossRef] [PubMed]
  52. Savchenko, V.L.; Nikonenko, I.R.; Skibo, G.G.; Mckanna, J.A. Distribution of microglia and astrocytes in different regions of the normal adult rat brain. Neurophysiology 1997, 29, 343–351. [Google Scholar] [CrossRef]
  53. Li, Y.; Jay, V.; Wong, C.S. Oligodendrocytes in the adult rat spinal cord undergo radiation-induced–apoptosis. Cancer Res. 1996, 56, 5417–5422. [Google Scholar] [PubMed]
Figure 1. (a) Experimental setup; (b) photograph of short multimode fiber (SMMF); (c,d) photographs of facets of SMMF.
Applsci 09 00216 g001
Figure 2. (a) The right half side of an image is an optical coherence microscopy (OCM) image of metal pattern; (b) the intensity profile indicated by the yellow solid line in (a).
Applsci 09 00216 g002
Figure 3. (a) OCM image of the mirror; (b) simulated absolute electric field of the signal wave with A01:A11:A21 = 1:0.447:0.837; and (c) intensity profiles of (a,b) at 0 and 3π/4.
Applsci 09 00216 g003
Figure 4. (a) OCM image of the polished Al plate; (b) OCM image obtained by averaging 30 OCM images selected randomly; and (c) intensity profiles of (b) and Figure 3b at 0 and 3π/4.
Applsci 09 00216 g004
Figure 5. (a) Photograph of windows on the skull of Rat 1; R, rostral; L, lateral; (b) variations of displacements of cortex surface and skull with time; (c) EKG of Rat 1, pulse 350–370 beats/min.
Applsci 09 00216 g005
Figure 6. (a) Photograph of the objective lens, SMMF with jig, rat brain on 3D slide stage, and the objective lens from the upper part; (b) extended photograph of (a); (c) photograph of the cortex into which the SMMF was inserted; (d) positions of the SMMF in Rat 1.
Applsci 09 00216 g006
Figure 7. (a) Photograph of tissue near the wound with the SMMF of Rat 1; (b) Photograph of the area indicated by B1 in (a). The arrow indicates oligodendrocytes lined up; (c) Photograph of the area indicated by B2 in (a). The arrow indicates the pyramidal cell layer.
Applsci 09 00216 g007
Figure 8. (a) En face (x–y) OCM image with an insertion length (IL) of 2.0 mm in Rat 1 (See Video S1); (b) Resliced (x–z) images of (a) (Video S2); (c) Typical en face image at a depth of 2.055 mm of (a); (d) Typical en face image at a depth of 2.536 mm with an IL of 2.5 mm in Rat 1; (e) En face (x–y) OCM image with an IL of 4.0 mm at P4 in Rat 2 (Video S3); (f) Resliced (x–z) images of (e) (Video S4); (g) Typical en face image at a depth of 2.038 mm with an IL of 2.0 mm at P4 in Rat 2; (h) Typical en face image at a depth of 2.547 mm with an IL of 2.5 mm at P4 in Rat 2.
Applsci 09 00216 g008
Figure 9. (a) 3D orthoslice OCM image with the region of X 51.5 μm, 49 pixel, Y 51.5 μm, 49 pixel, Z 104 μm, 43 pixel indicated by the dotted rectangle in Figure 8a (See Video S5); (b) 3D orthoslice OCM image with the region of X 14.9 μm, 13 pixel, Y 12.4 μm, 11 pixel, Z 8.1 μm 4 pixel indicated by the smaller dotted rectangle in Figure 8a (Video S6).
Applsci 09 00216 g009
Figure 10. (a) Dependence of sums of signal intensity in each en face image on the scan depth for Rat 1 for each IL; (b) dependence of sums of signal intensity in each en face image on the scan depth at P4 of Rat 2 for each IL; (c) dependence of integrations of signal intensities on IL for Rat 1 and Rat 2-P1 to P4, where each arrow indicates the position of maximum integration of signal intensities for Rat 2 from P1 to P4.
Applsci 09 00216 g010
Table 1. Typical distances and sizes of various cells.
Density 1/mm3Distance μmSize μmReference
Neuron 1)40,00029.2~20[37]
Glial cellAstrocyte 1)20,00036.84.9–5.4[37,51]
Microglia 1)106098.12.2–3.1[51,52]
Oligodendrocyte 2)771350.6~4.3[51,53]
1) Rat, somatosensory cortex; 2) Rat, spinal cord.

