Article

A Comparative Study of Regression Model and the Adaptive Neuro-Fuzzy Conjecture Systems for Predicting Energy Consumption for Jaw Crusher

by
Khaled Ali Abuhasel
Mechanical Engineering Department, College of Engineering, University of Bisha, Bisha 61922, Saudi Arabia
Appl. Sci. 2019, 9(18), 3916; https://doi.org/10.3390/app9183916
Submission received: 5 August 2019 / Revised: 11 September 2019 / Accepted: 12 September 2019 / Published: 18 September 2019
(This article belongs to the Section Mechanical Engineering)

Abstract

:
Crushing is a vital process for different industrial applications where a significant portion of power is consumed to properly blast rocks into a predefined size of fragmented rock. An accurate prediction of the energy needed to control this process rarely exists in the literature, hence there have been limited efforts to optimize the power consumption at the crushing stage by a jaw crusher; which is the most widely used type of crusher. The existence of accurate power prediction as well as optimizing the steps for primary crushing will offer vital tools in selecting a suitable crusher for a specific application. In this work, the specific power consumption of a jaw crusher is predicted with the help of the adaptive neuro-fuzzy interference system (ANFIS). The investigation included, aside from the power required for rock comminution, an optimization of the crushing process to reduce this estimated power. Results revealed the success of the model to accurately predict comminution power with an accuracy of more than 96% in comparison with the corresponding real data. The obtained results introduce good knowledge that may be used in future academic and industrial research.

1. Introduction

During the processing of raw materials in different industries such as the mining and cement sectors, the size reduction of fed rocks is primarily a mechanical process [1]. The rock blasting process is the most primary, and the first significant stage in these industrial sectors through which massive rocks are broken and fragmented into suitable smaller sizes before feeding to the processing plant. This process can be realized in mechanical systems commonly known as crushers. Primary crushers are capable of handling huge rocks of considerable size (typically around 1.5 m) to provide blasted rocks with a size reduction ratio varying from 3 to 10 [2]. The reduction ratio is the feed size to the product size.
The crushing process is a multi-stage dry process where each stage has a small size reduction ratio within a range of 3 to 6. Rock breakage is accomplished by crushing, impact, and abrasion corresponding to known modes of rock fracture including compressive, tensile, and shear. The applied mode can be defined according to rock mechanics and the load type. Rocks meet crushing or compressive failure, where rocks of two distinct size ranges are obtained. In this mode, the coarse rocks are produced due to tensile failure, while the small size rocks result from compressive failure occurring at loading points or due to shear stress between projected rocks [3]. In tensile failure mode (impact crushing), the rock possessing a higher stress over the stress needed to achieve fracture has a great tendency to break rapidly, producing smaller rock sizes and shapes. In the final mode, shear failure (attrition mode), the rocks are broken due to the particle–particle interaction producing a significant part of fine size rocks. The later mode can occur when too fast feeding of a crusher is applied, which is usually undesirable. Crushing in closed circuit operations produce more unwanted fine material than open circuit operations. The crushing action comes from stresses applied to rock particles by moving parts of the machine.
One of the most famous and oldest crushers is the jaw crusher [4,5]. Jaw crushers have been in practical usage for about 175 years. There are different types of jaw crushers; these can be distinguished by the presence of two plates where crushed materials are fed between them. One of these plates is fixed while the other swings. Jaw crushers are classified, according to the location of this pivoted swinging plate, into Blake, Dodge, and Universal crushers. The Blake crusher is considered the most common, where the swinging plate is pivoted at the top [6]. This crusher can be a double toggle or single toggle. Due to its simplicity, lower cost, and its higher efficiency, the single toggle jaw crusher is the most realized form in new applications.
Jaw crushers achieve size reduction mainly by compressing particles between relatively slow-moving, inclined surfaces. The material being fed into the machine enters from above, where the crushing surfaces are furthest apart, and is crushed into smaller fragments as it descends into the narrowest zone of crushing and is finally discharged by gravity.
The crushing surface in a jaw crusher consists of two rectangular plates, one fixed crushing face and an inclined mobile face, which moves a small distance back and forth from the fixed face [7]. The significant variables in jaw crushing are the angle of the jaws, rate of jaw movement, displacement of the movable plate, and the distance between the jaws at the discharge end, which controls the product size as shown in Figure 1 [8].
Several studies have dealt with size reduction, focusing on developing a theory or criterion that would be useful during the selection and evaluation of crushing equipment. However, none of these studies has satisfactorily successfully predicted the power consumption, a major source of running costs in crushing equipment. Donovan [9] provided an in-depth historical review on the most proposed physical basis regarding the criteria of crusher selection, prediction of crusher performance, laws of comminution, mechanisms of rock fracturing, and the corresponding application. As stated by Donovan [9], among the common laws of comminution, the theories proposed by Von Rittinger in 1867, Kick in 1883, and Bond in 1952 were found to correctly demonstrate the relationship between the product size reduction and the corresponding required input energy throughout the main three laws of comminution. The essential problem within these theories is their limited range of applicability as they are based on empirical equations fitted from experimental data applied in some instances. Eloranta [10] used Bond’s theory to estimate the crusher power consumption and recorded a 240% higher predicted power than the actual value. Thus, it is vital to consider data provided by the crusher manufacturers and designers who may rely on alternative methods of sizing and select crushing equipment for specific blasting operations. Bearman et al. [11] stated that these methods were subjective and relied on individual judgment, which led to the conservation over-design of crushers, so additional improvement efforts should be made to include rock fracture toughness in addition to all of the factors in a real crushing plant to be able to predict the corrected input power.
During the last decades, most of the cited work regarding rock blasting was focused on the quantity of matter and the related energy of particle fracture in addition to material properties relevant to fragmentation during the crushing process [12]. Single-particle breakage was used, which has the objective of relating the breakage pattern and nature of broken material to the resultant fragmented size distribution. Studies using single-particle breakage induce mathematical models that describe the size reduction of different breakage materials. These efforts can be extended to relate to the fracture consumption of energy and the produced broken size distribution to the physical property of the broken material.
While attempting to link the energy consumption and performance to major rock properties of the crushing system, Bearman et al. [13] performed extensive tests. The work provided an empirical relationship between the rock strength properties and crusher power intake as well as the produced broken size for a cone crusher. In this work, the fracture properties of the rock material were categorized in terms of rock particle strength, breakage energy, and the fragment size distribution of broken particles. Any inefficiency in crusher power consumption within the energy-intensive equipment leads to the loss of gigawatt-hours of electricity per year [14] (. Therefore, the most valuable step to reduce this power consumption is to properly improve comminution regardless of the applied technology to realize the crushing process [15]. The improvements in feed size operation lead to beneficial optimization in the performance due to the lowering of the system capital costs, reducing unit operating costs, and increasing of plant productivity [15]. The use of inefficient crushers may lead to many difficulties as the process quality may mainly depend on the quality of the crushers to feed the downstream process with product in an acceptable reduced size [16]. Thus, the necessity of optimizing the performance and power consumption of the primary crusher to reduce the operating costs of quarrying tools is urgent [17].
To optimize crushing energy efficiency, proper modeling relating to the stone strength and jaw crusher parameters is required to successfully estimate the power consumption [18]. Modeling based on energy consumption data can be accomplished by soft computing techniques [13,19,20,21]. The soft computing techniques are useful in providing accurate mathematical relations rather than computing techniques when exact relations are not available [22,23]. Two famous forms of artificial intelligence including neural networks and belief networks have been used to enhance the developed models of onsite aggregation system. The adaptive neuro-fuzzy interference system, ANFIS, is an example of soft computing techniques playing a great role in modeling an accurate input–output matrix relationship [24]. As such, ANFIS is a suitable model to predict specific energy consumption based on the input independent variables in the process of jaw crushing.
As the reducing size process depends on different performance characteristics of the crusher as well as various properties of the feeding rocks, the objective of the current work was to properly combine these parameters to achieve a low power consumption while maintaining a high product quality for a sustainable production process. In this work, the power consumption of the jaw crusher was predicted to provide a specific reduced rock size with the help of ANFIS modeling as one of the computing techniques playing a great importance in modeling the relationship of the input–output parameters. In the next subsection, details of the AFNFIS model are introduced, then the results of the calculations are presented, discussed, and compared with real data from an applied crusher to determine the level of accuracy to predict the required power consumed by the crusher. It is known that the issue of the prediction of the power consumption of a jaw crusher using the ANFIS model has not been addressed until now. Hopefully, the given approach and the findings from this study will be used for further research in the area of crushing performance.

2. Materials and Methods
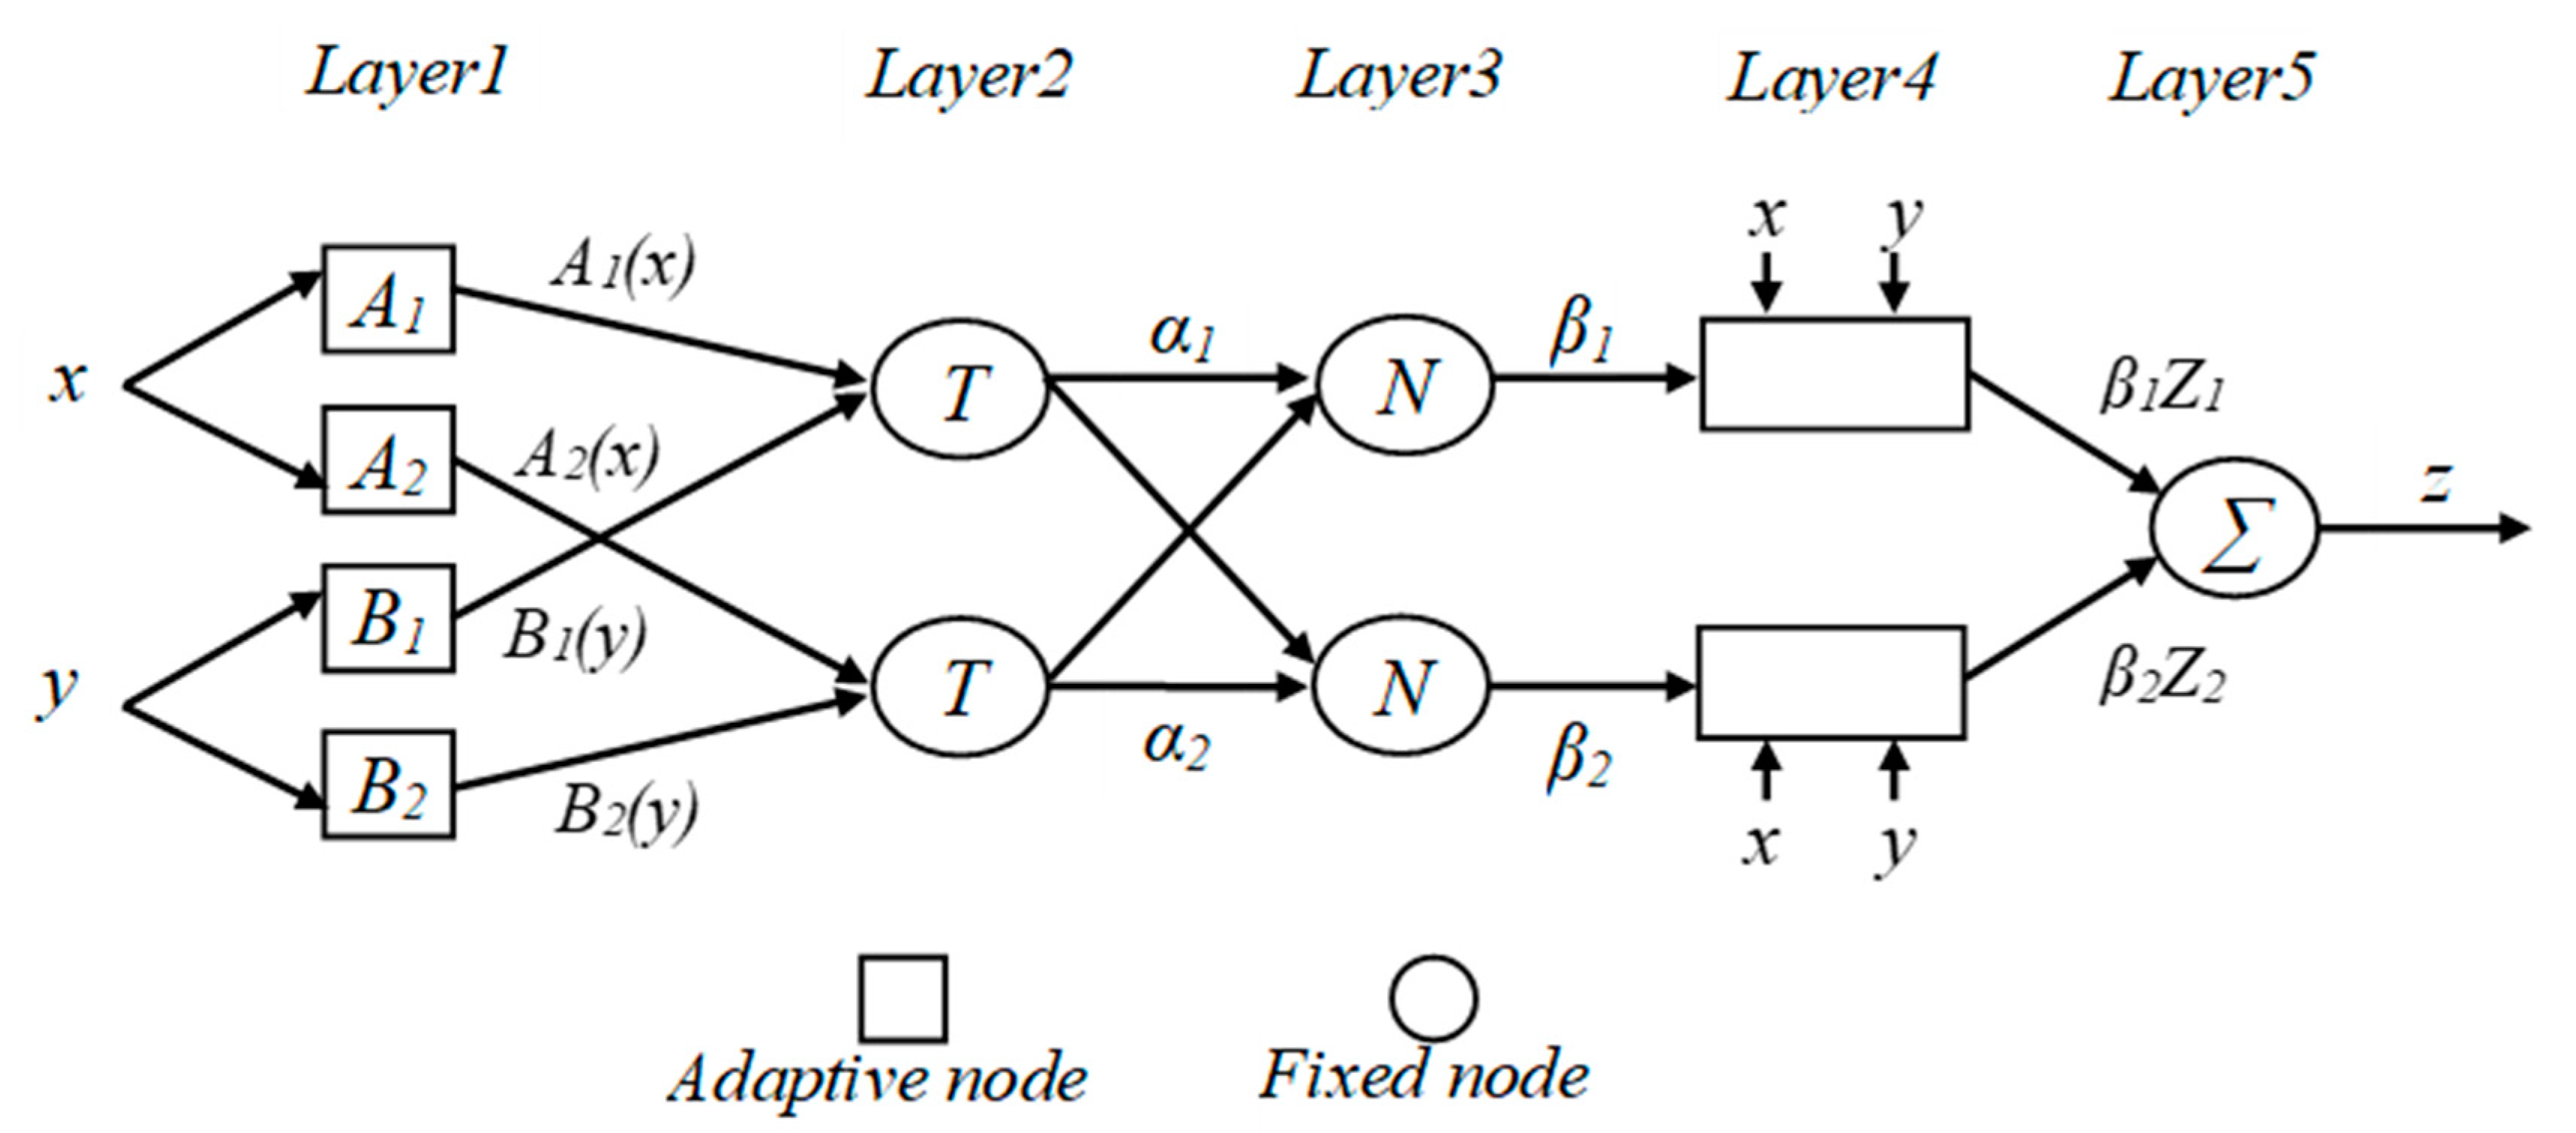
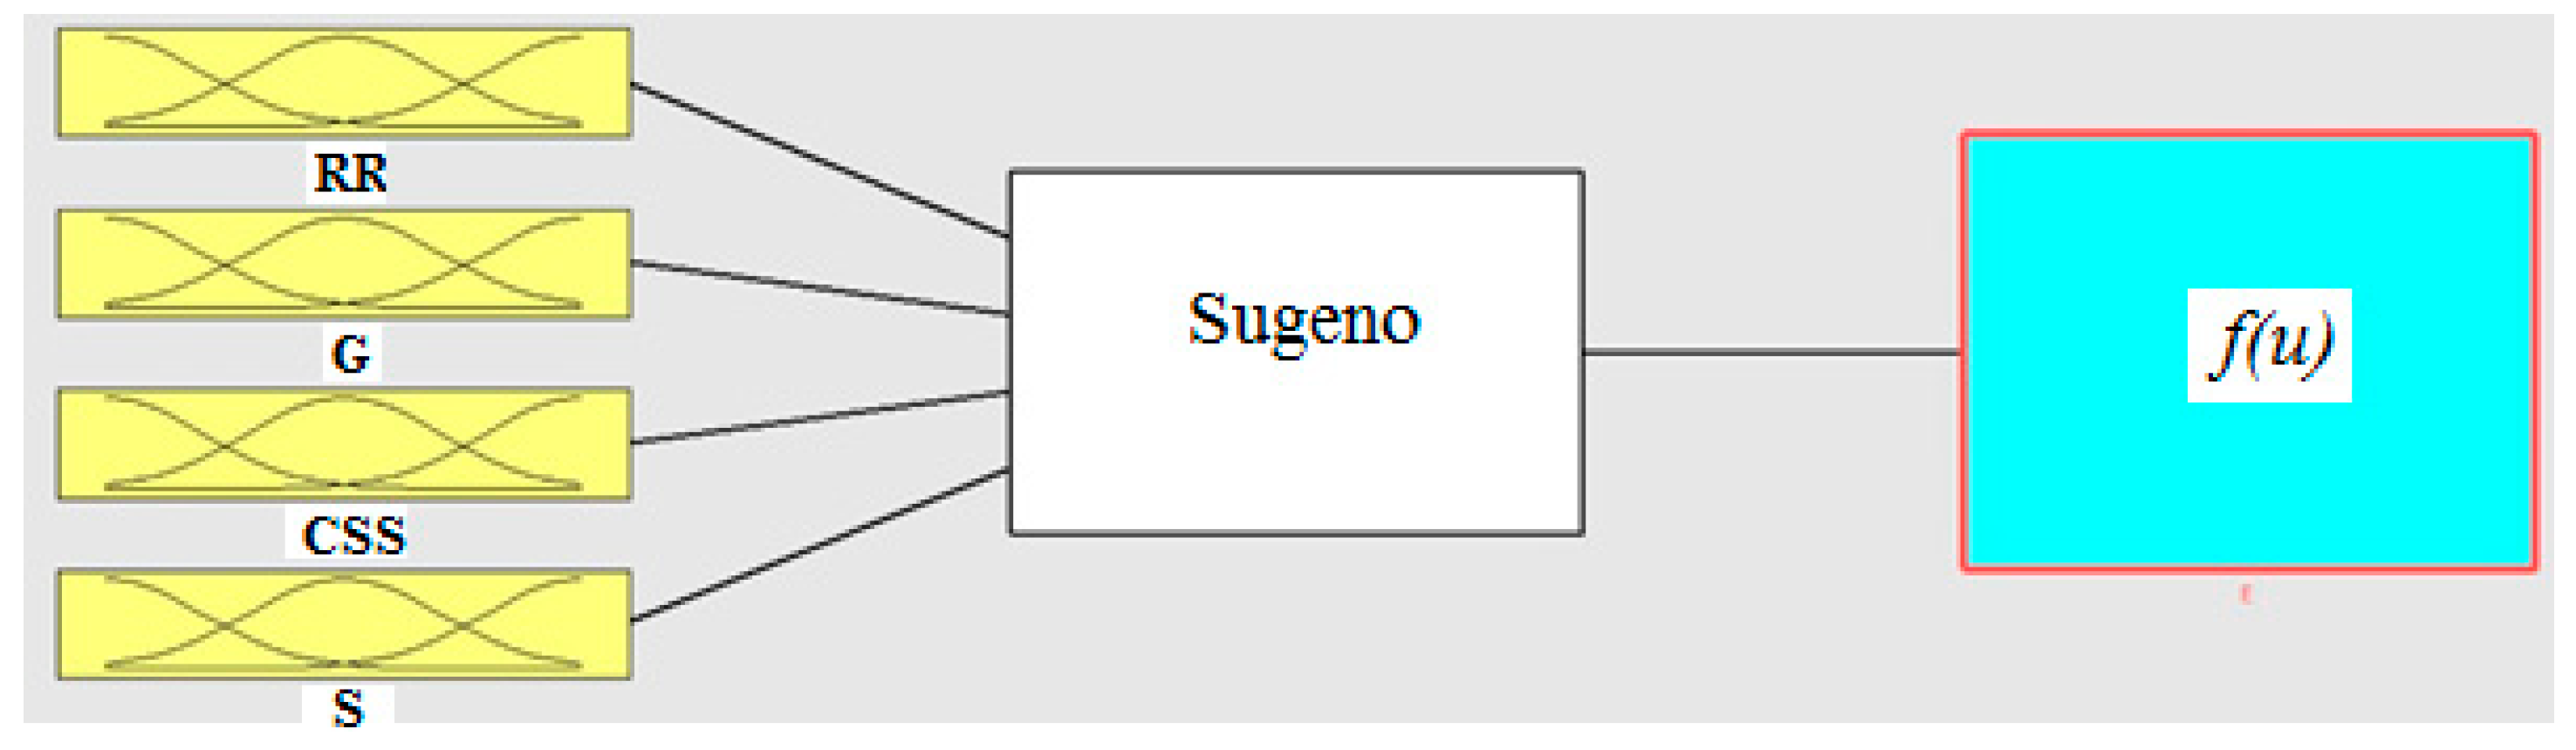
2.1. ANFIS Modeling

ANFIS is a neural-fuzzy predictive computing system based on an adaptive neural network [24] (. With the help of a hybrid learning sequence, ANFIS is used to generate input–output relations considering fuzzy if–then rules to provide different membership functions. The parameters of each function are determined by the ANFIS technique to follow already given empirical input–output data.
ANFIS uses five network layers to achieve the fuzzy interpretation steps shown below (Figure 2), where layer one is the parameters entering the system, layer two is the set database layer of the fuzzy, layer three is the fuzzy rule base structure layer, layer four is the decision making layer, and layer five is the output defuzzification layer; more information is available in the literature [25,26,27].
This system can be explained in terms of two suggested laws and literal values in each input, considering the following five layers:
Layer 1: where the output is the step to make a specified input satisfy the verbal label corresponding to the current node. In this layer, Gaussian membership functions are used to represent verbal values as a connection of aggregate production limits (see Figure 3).
First parameter function
A i ( u ) = e x p [ 1 2 ( u a i 1 b i 1 ) 2 ]
Second parameter function:
B i ( v ) = e x p [ 1 2 ( v a i 2 b i 2 ) 2 ]
where {ai, …, bi2}4 denote set of parameters.
As the limit values of modification, the shapes of the model vary considerably as seen below, displaying several forms of the functions on linguistic tags Ai, Bi. The parameters in this layer are described as attitude limits.
In Layer 2, each node calculates the firing strength of the related law. Here, the nodes are called the ‘rule nodes’. The outputs of the top and the bottommost neurons are as follow:
Upper neuron  α1 = A1(x) × B1(y)
Bottom neuron   α2 = A2(x) × B2(y)
In Layer 3, every node in this layer is considered by N, which indicates the regulation of the firing powers. The output of the upper and bottom neuron is made normal as follow:
Top   neuron     β 1 = α 1 α 1 + α 2
Bottom   neuron    β 2 = α 2 α 1 + α 2
Layer 4 provides the upper and lower neuron outputs as the result of normal firing intensity and inbuilt particle energy for the process.
Upper neuron   β1z1 = β1 (a1x + b1y)
Bottom neuron   β2z2 = β2 (a2x + b2y)
Layer 5 where the system overall output is determined by each node summing all the incoming signals. i.e.,
z= β1z1 + β2z2
Here, the combination set of neutral parameters are learned after providing the system training set { ( x k ,   y k ) ,   k = 1 , , K } . The corresponding sensed function for iterated k is determined by
E k = ( y k o k ) 2
where y k is the expected output and o k is the calculated output by the improved neural net.
The ANFIS model was built in MATLAB using a set of 32 readings (provided in Table 1). Various related functions were used to learn ANFIS; among them, two were closed side sets ((CSS), Gape G), and the reduction ratio (RR) and four functions of the rock strength (S) were selected to generate the ANFIS model.
This study presents a jaw crusher, which is a key tool in the dry process of making a cement plant. The procedure involves inputting the raw material for producing the cement into the jaw crusher. The size of the used rocks for the procedure on average amounted to a similar quantity for all of the experimentations conducted. The settings of the jaw crusher were set as shown in Table 1 so that all values in the experiment could be based purely on strength. Two different sets of experiments were conducted, and the results are recorded in Table 1. In each set of tests, all of the input data were fixed apart from the strength.
From the Gaussian membership function, the lowermost error of power consumption was determined to be implemented for ANFIS training. The input–output system construction of ANFIS when Gaussian membership function is used and entails 32 fuzzy rules produced from the related system of the input–output dataset corresponding to the Sugeno fuzzy model, as shown in Figure 4.
During the training stage, 32 efficiencies of the performance (training dataset) were used to conduct 500 intervals of learning, accommodating an estimated error of 0.0755, as shown in Figure 5.

2.2. Multiple Regression Model

Several engineering problems include identifying the association between two or more variables, in this case, known as correlation [28]. Finding how the variables are correlated is called regression analysis; these are powerful statistical methods that have been employed by researchers in many areas [29]. Regression modeling is the process by which correlation are fitted to data. In a nonlinear model of regression, considered as a special case, the nonlinear independent functions are used to work on the data, and the output values are compared from the values. In this study, multiple-input variables were used; therefore, we used the “multiple nonlinear regression” function. In this event, the multiple nonlinear regression evaluates the relationship between four variables by finding a nonlinear fit equation to the calculated data. Multiple non-linear regression includes refining the data and examining the correlation between all variables [30]. The generalized nature of a multiple non-linear regression model is shown in Equation (11):
Y = b 0 + i = 1 i = n , b j   X i b j + 1   j = 2 i 1
where Y is the output; Xi is the independent variables of the system; and b0, b1, …, bn are the correlation parameters. The coefficients were then trained to coincide with the model’s output and the training output.

3. Results and Discussion
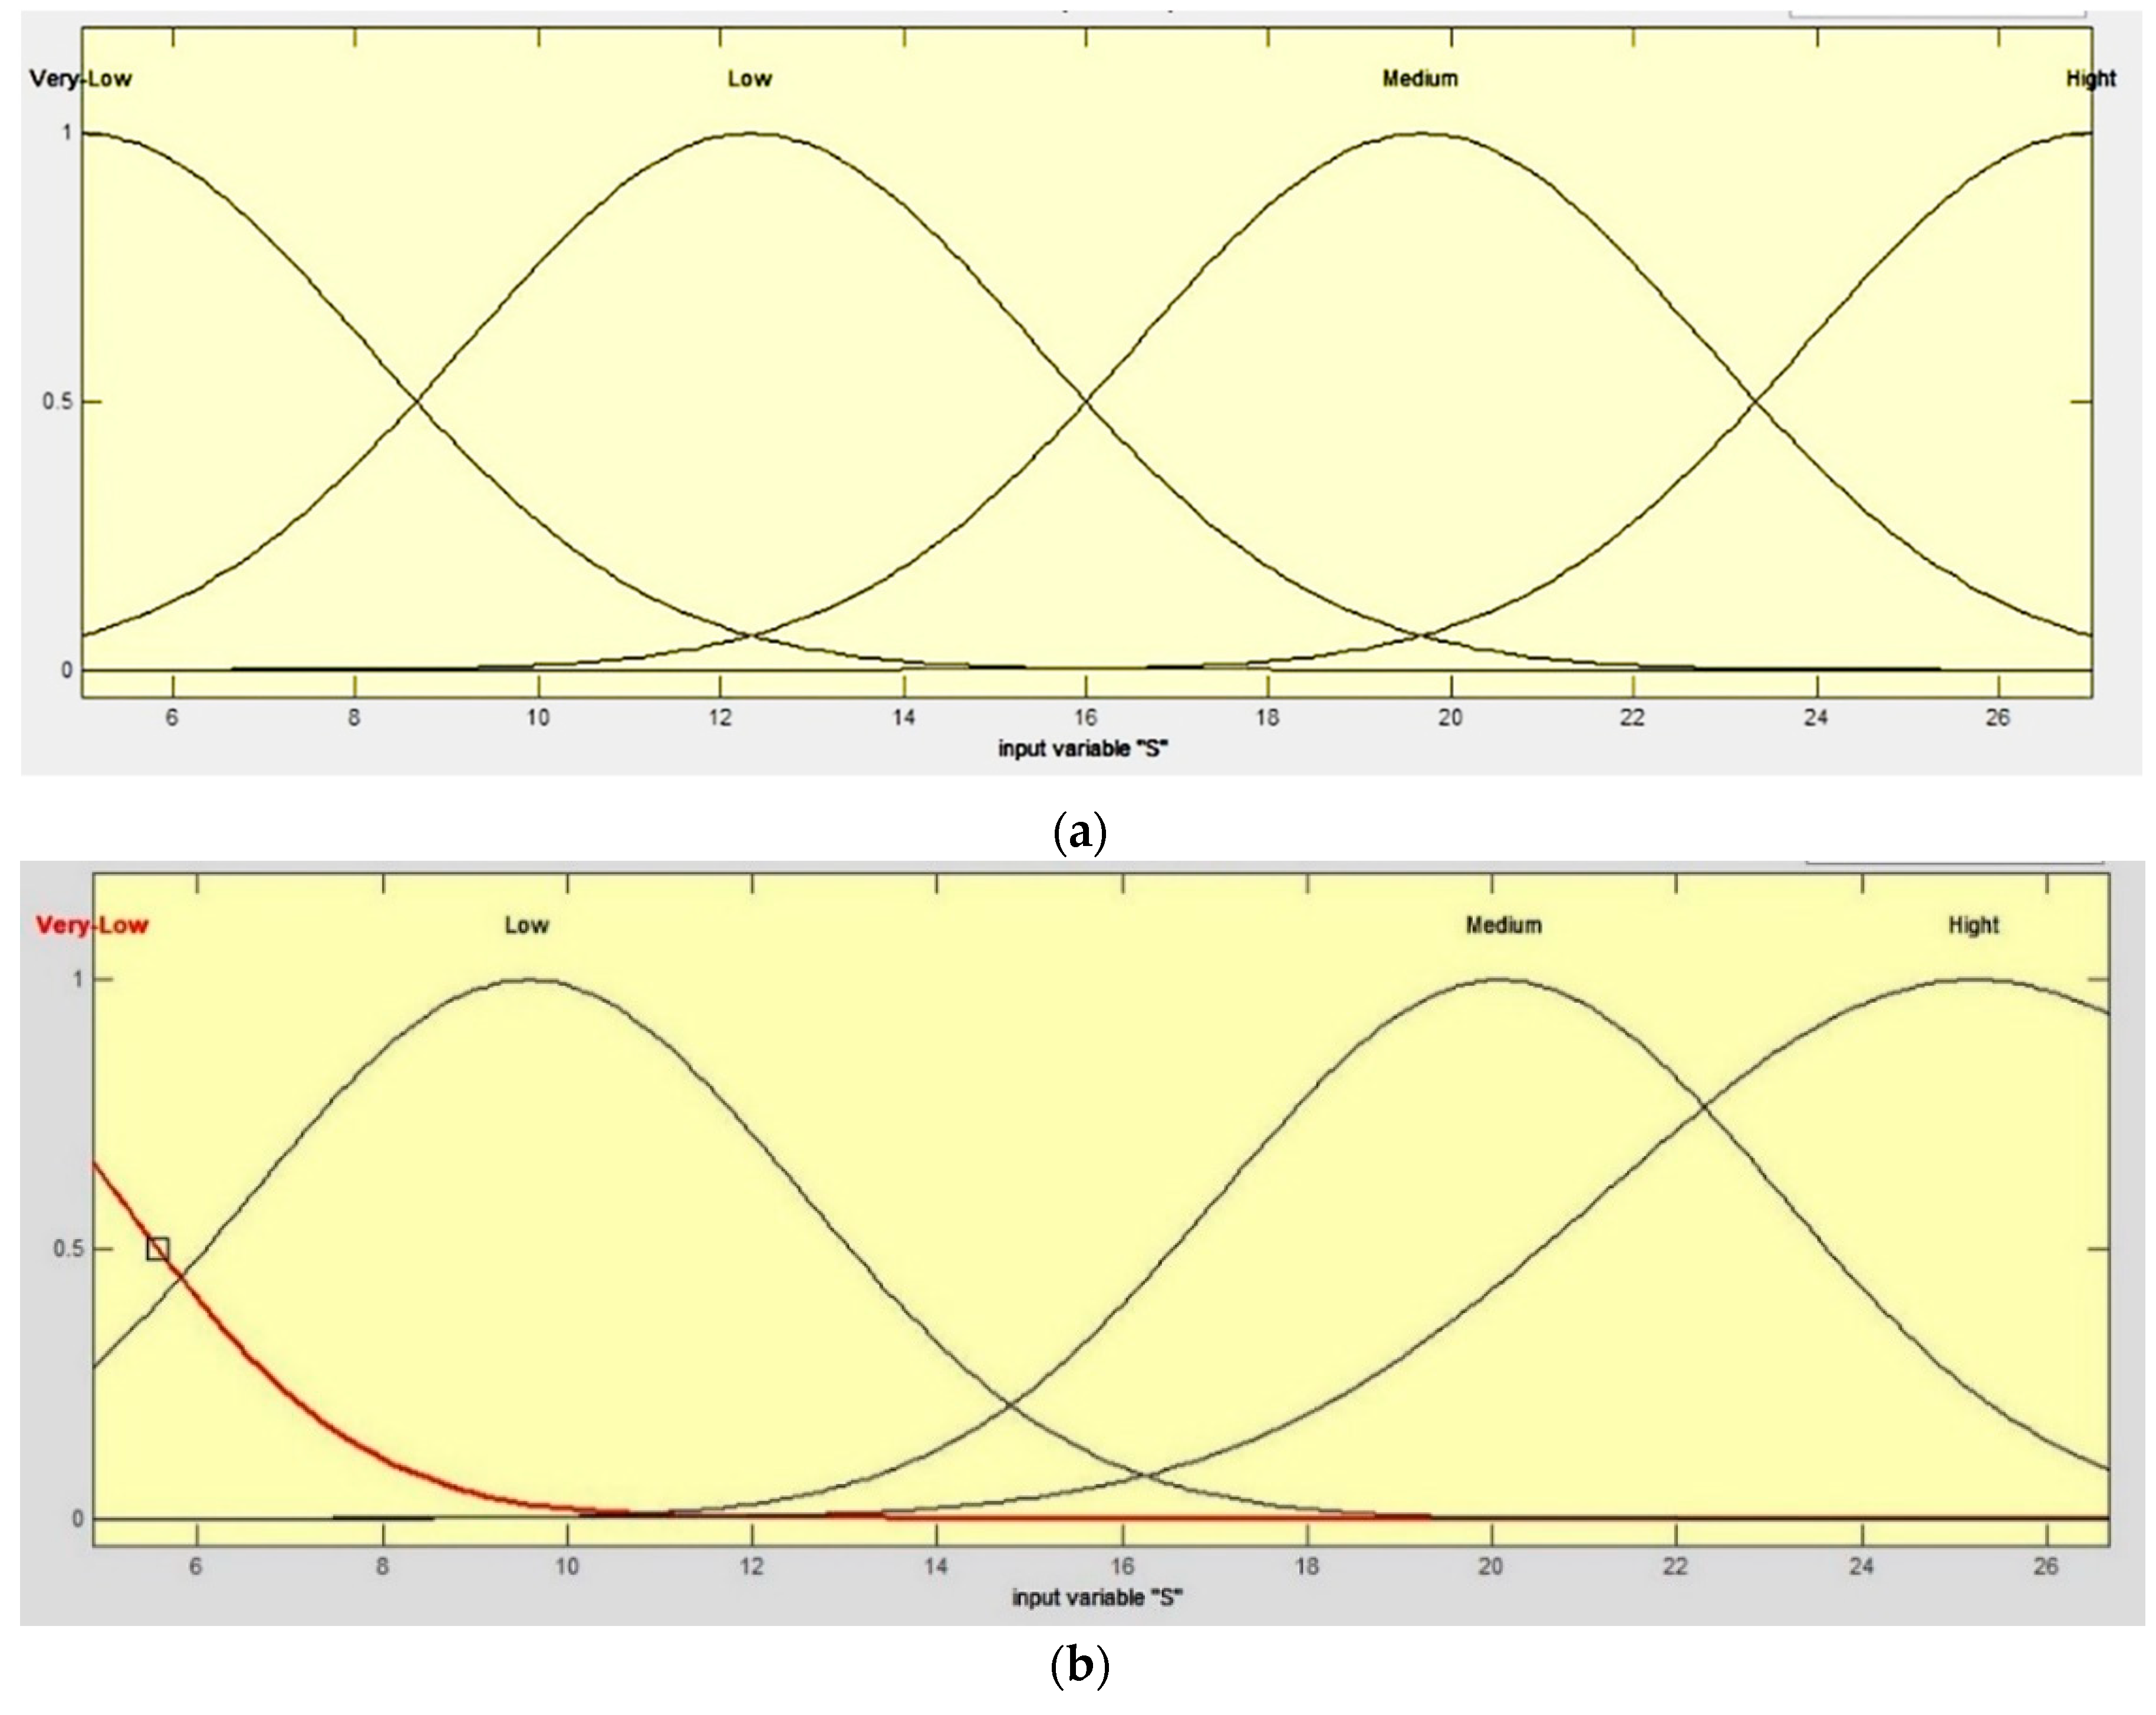
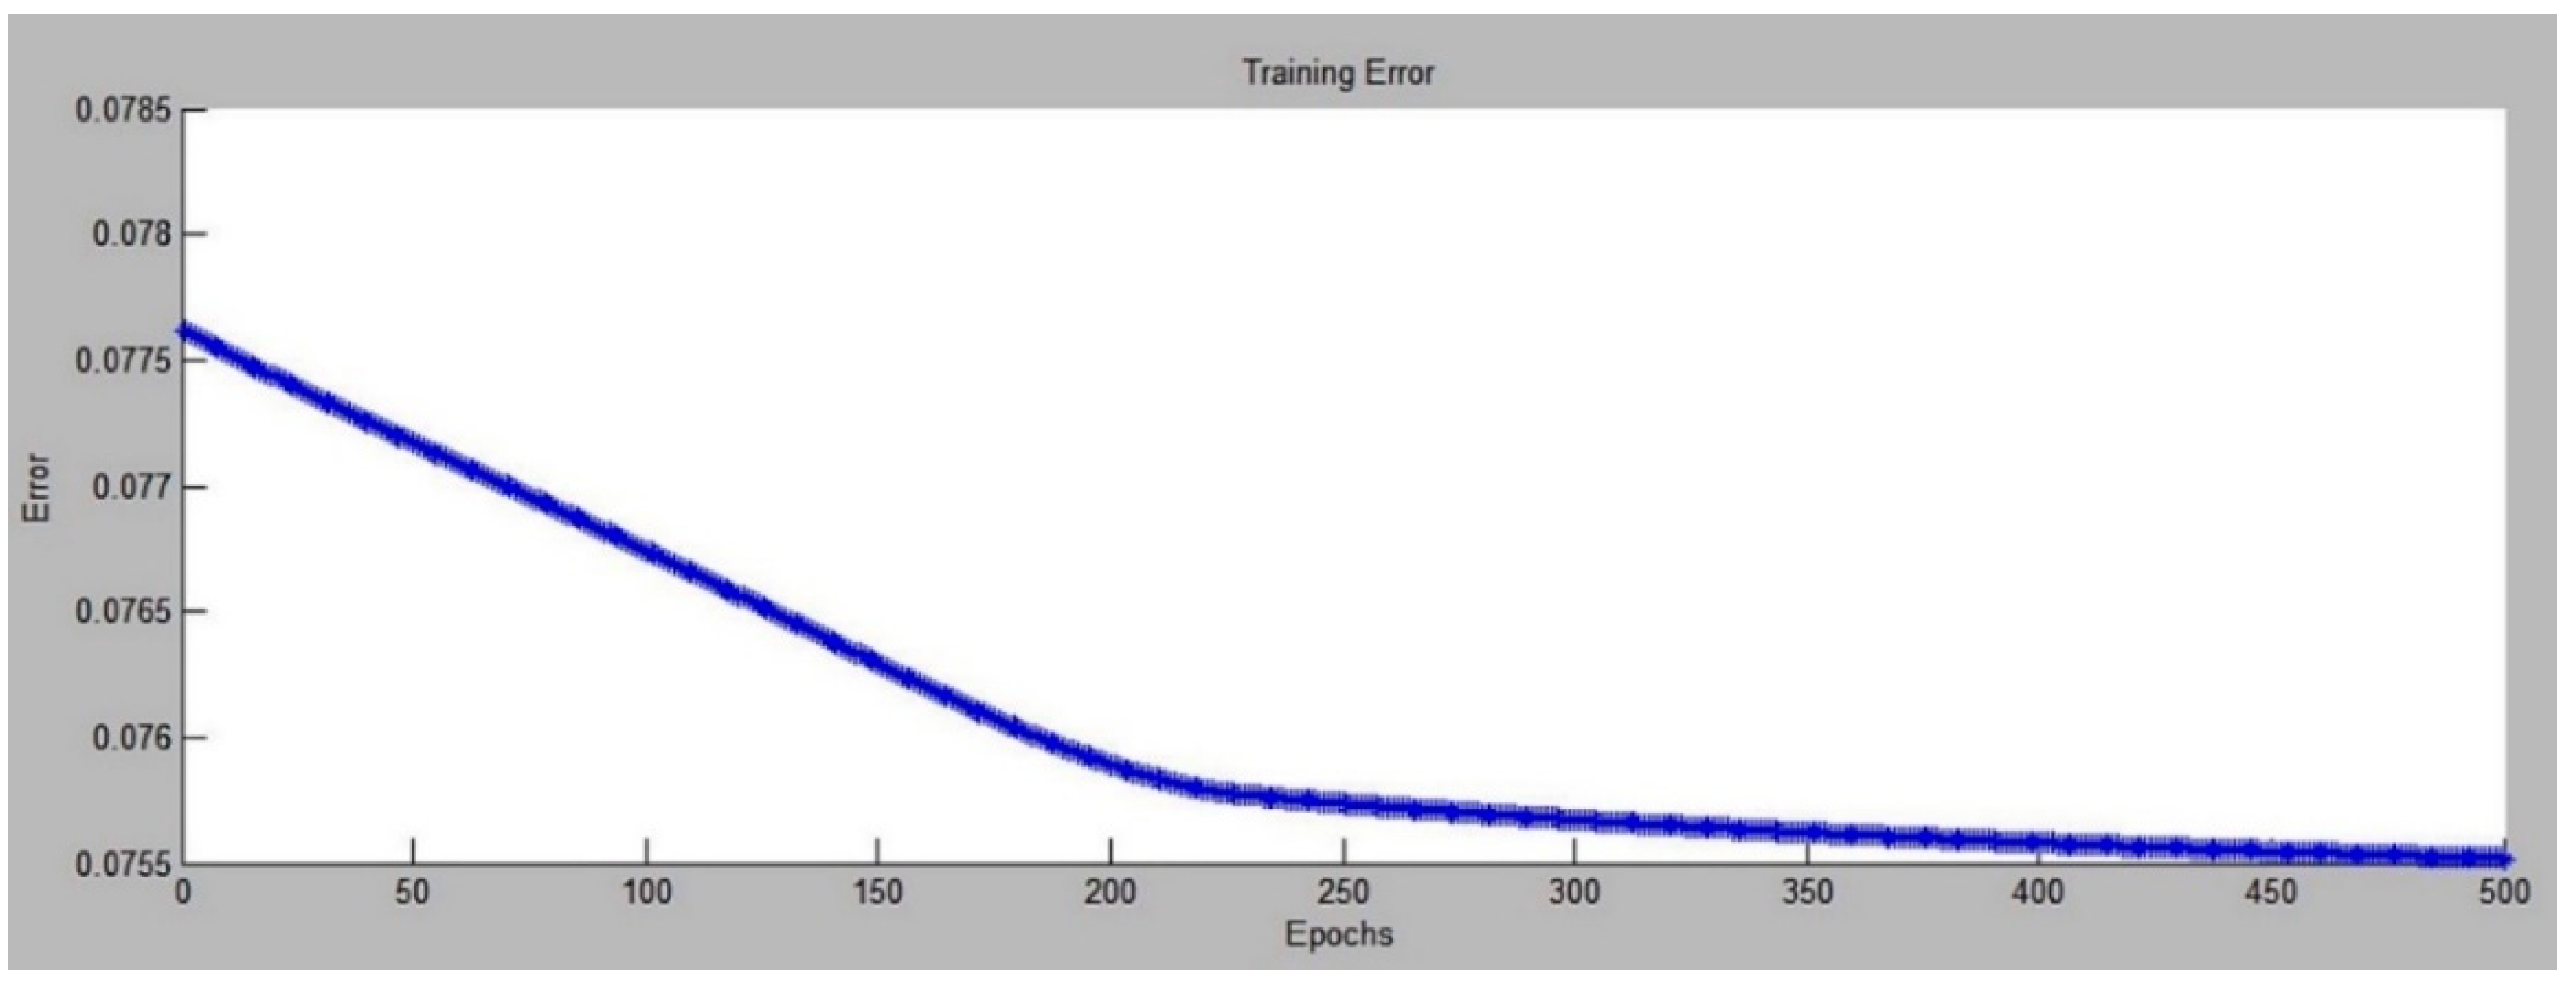
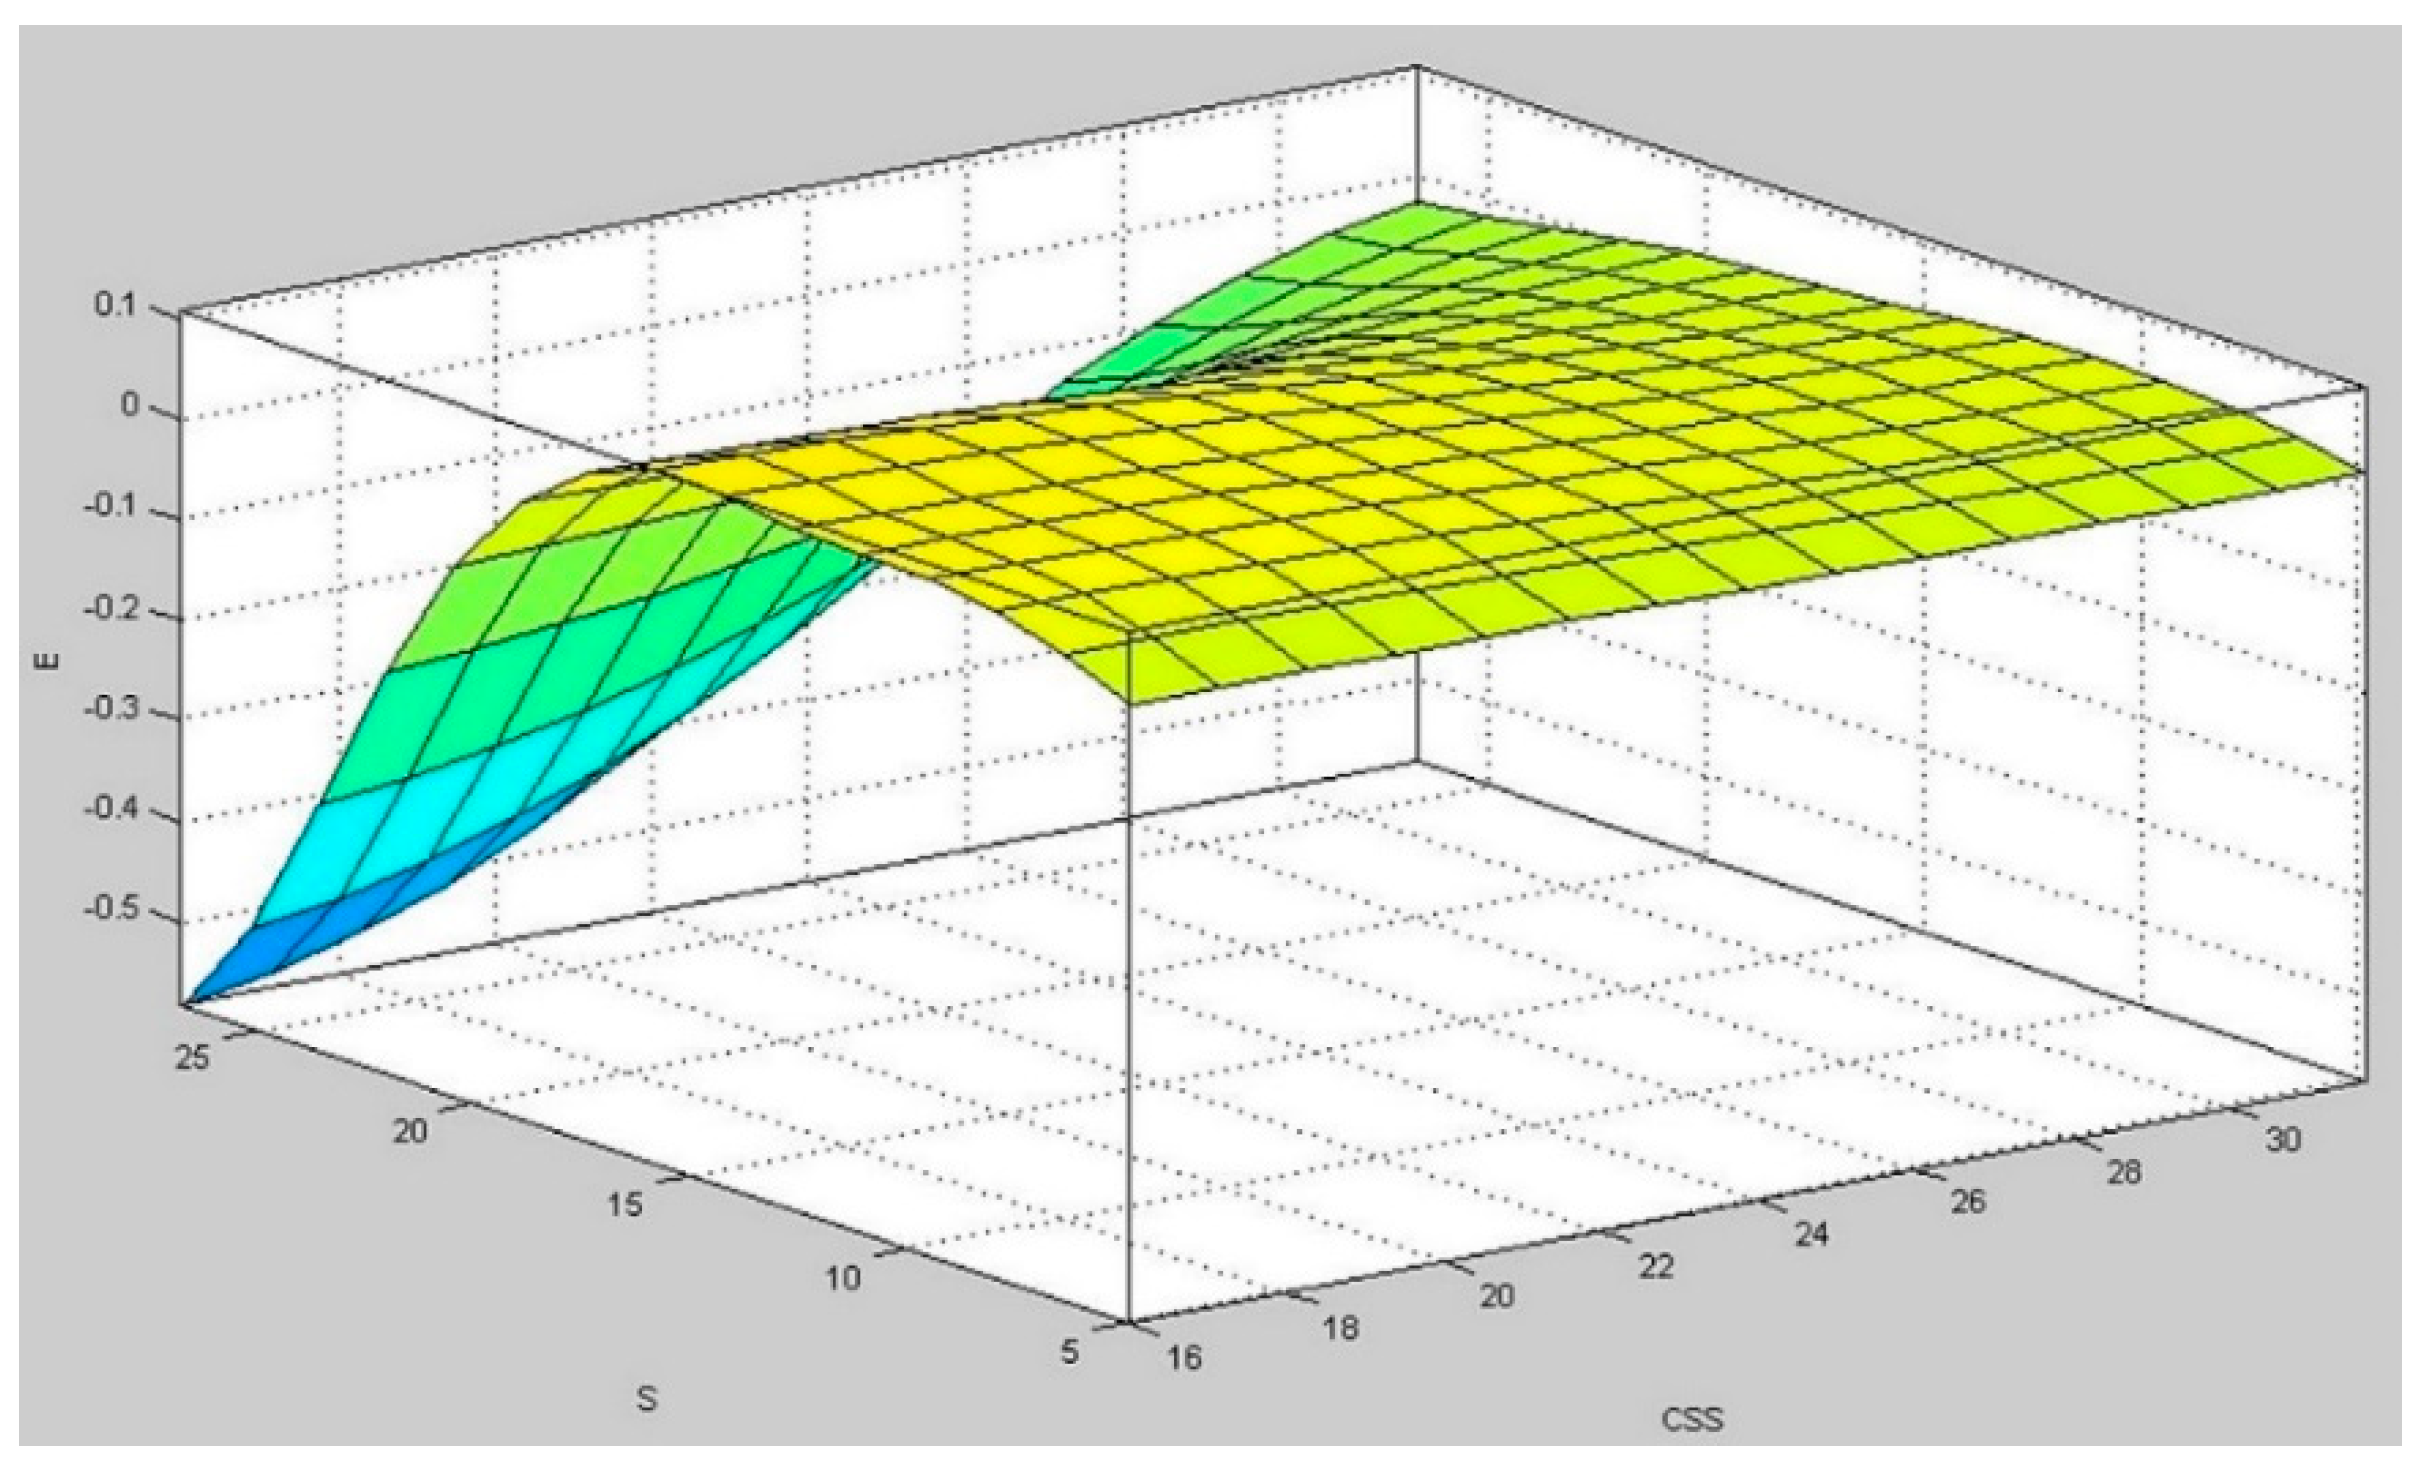
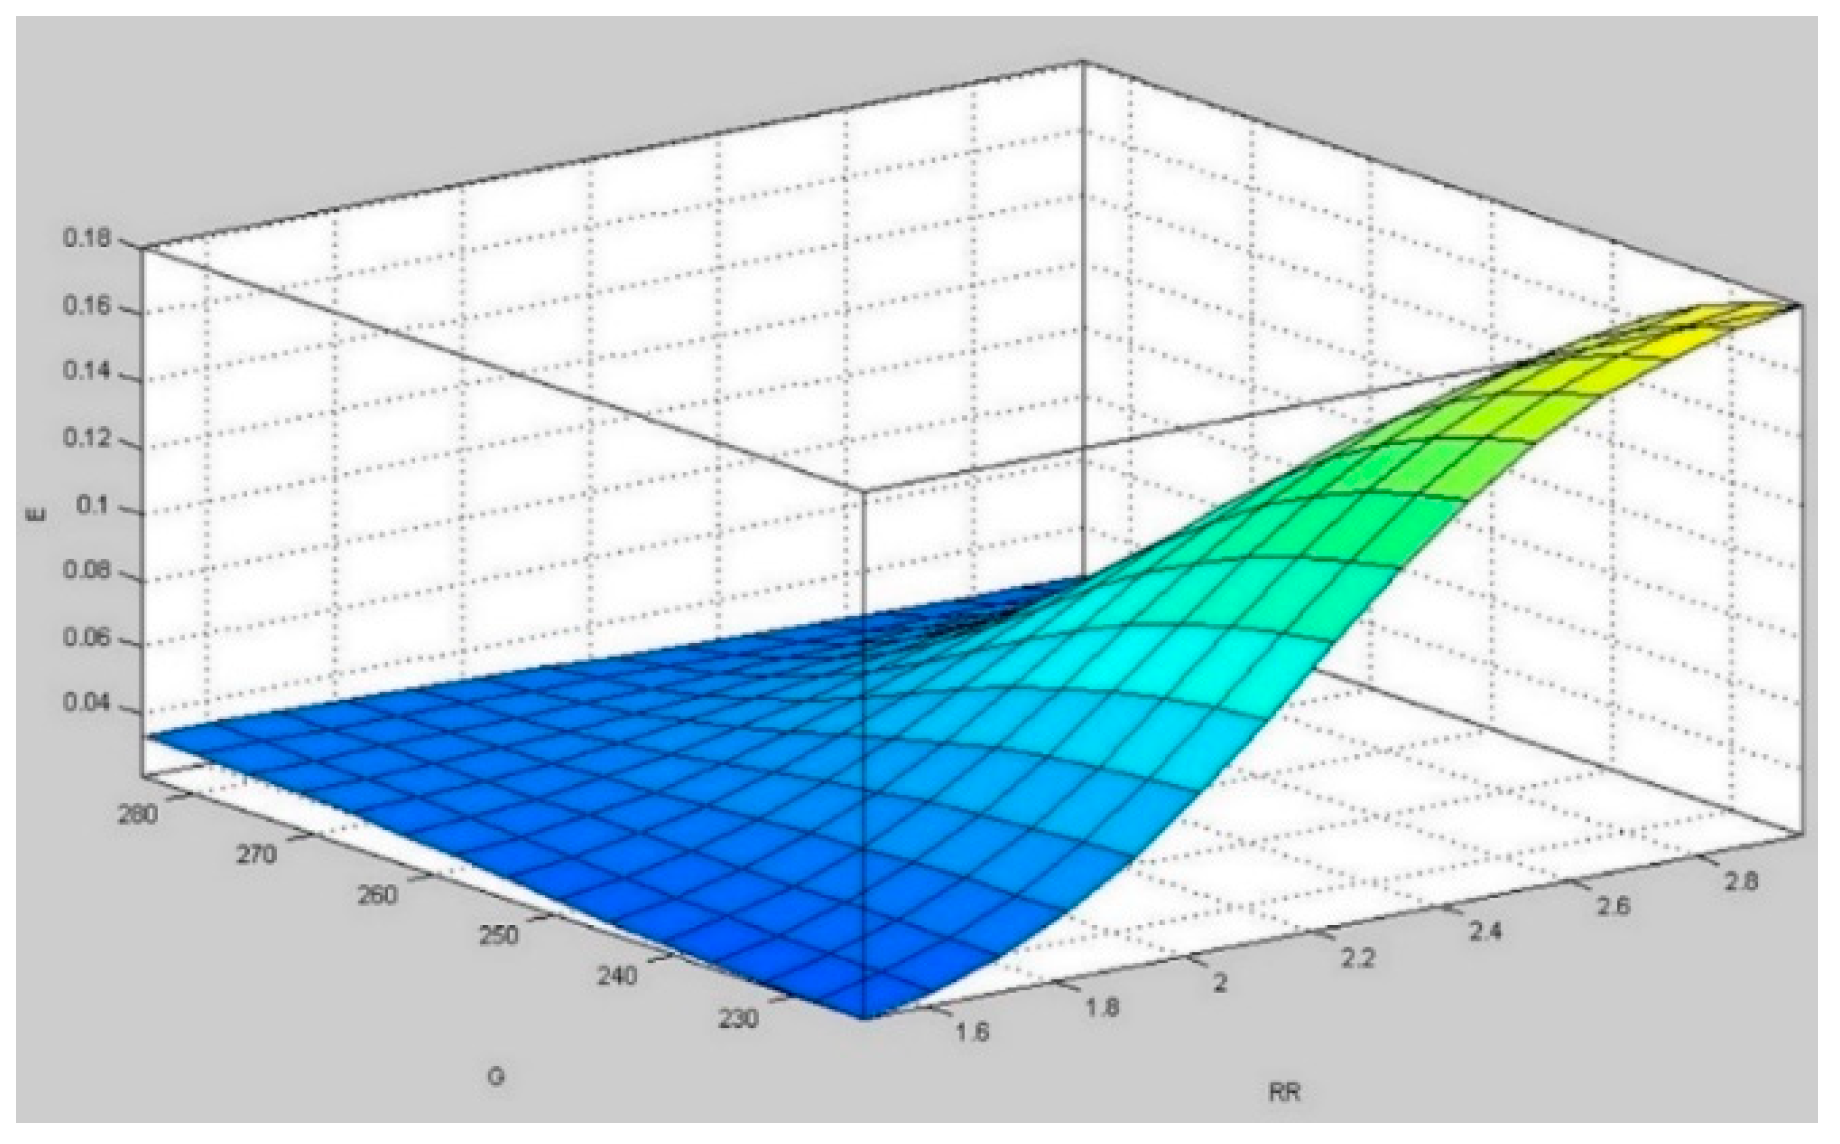
3.1. ANFIS Model

Figure 3a,b illustrate the original and the last membership functions of the stone strength. It was noted that tuning the final membership function led to remarkable changes in the low and high areas, but in the small and medium regions, there were minor changes. The significant changes in the very low and high areas indicated that all ranges of stone strength had a different effect on energy consumption (E). Additionally, Figure 3 shows that stone strength had the most significant impact on energy consumption.
Figure 6 and Figure 7 show the effects of the crushing parameters and stone material properties on energy consumption. According to Figure 6 and Figure 7, the reduction ratio (RR), gap (G), and stone strength (S) had a considerable effect on energy consumption, while the closed side set (CSS) had a minor impact on energy consumption.
In Figure 6 at a low strength level, it can be seen that the closed side set did not have a considerable effect such as at the high level of strength, and the consumption energy increased with the increase in the closed side set. Moreover, the energy consumption increased with the decrease in stone strength.
Figure 7 shows the variation of energy consumption with the variation in gape width and reduction ratio. Note the gap range of 230–250 mm; the energy consumption was directly proportional to the reduction ratio across the whole range of the reduction ratio.

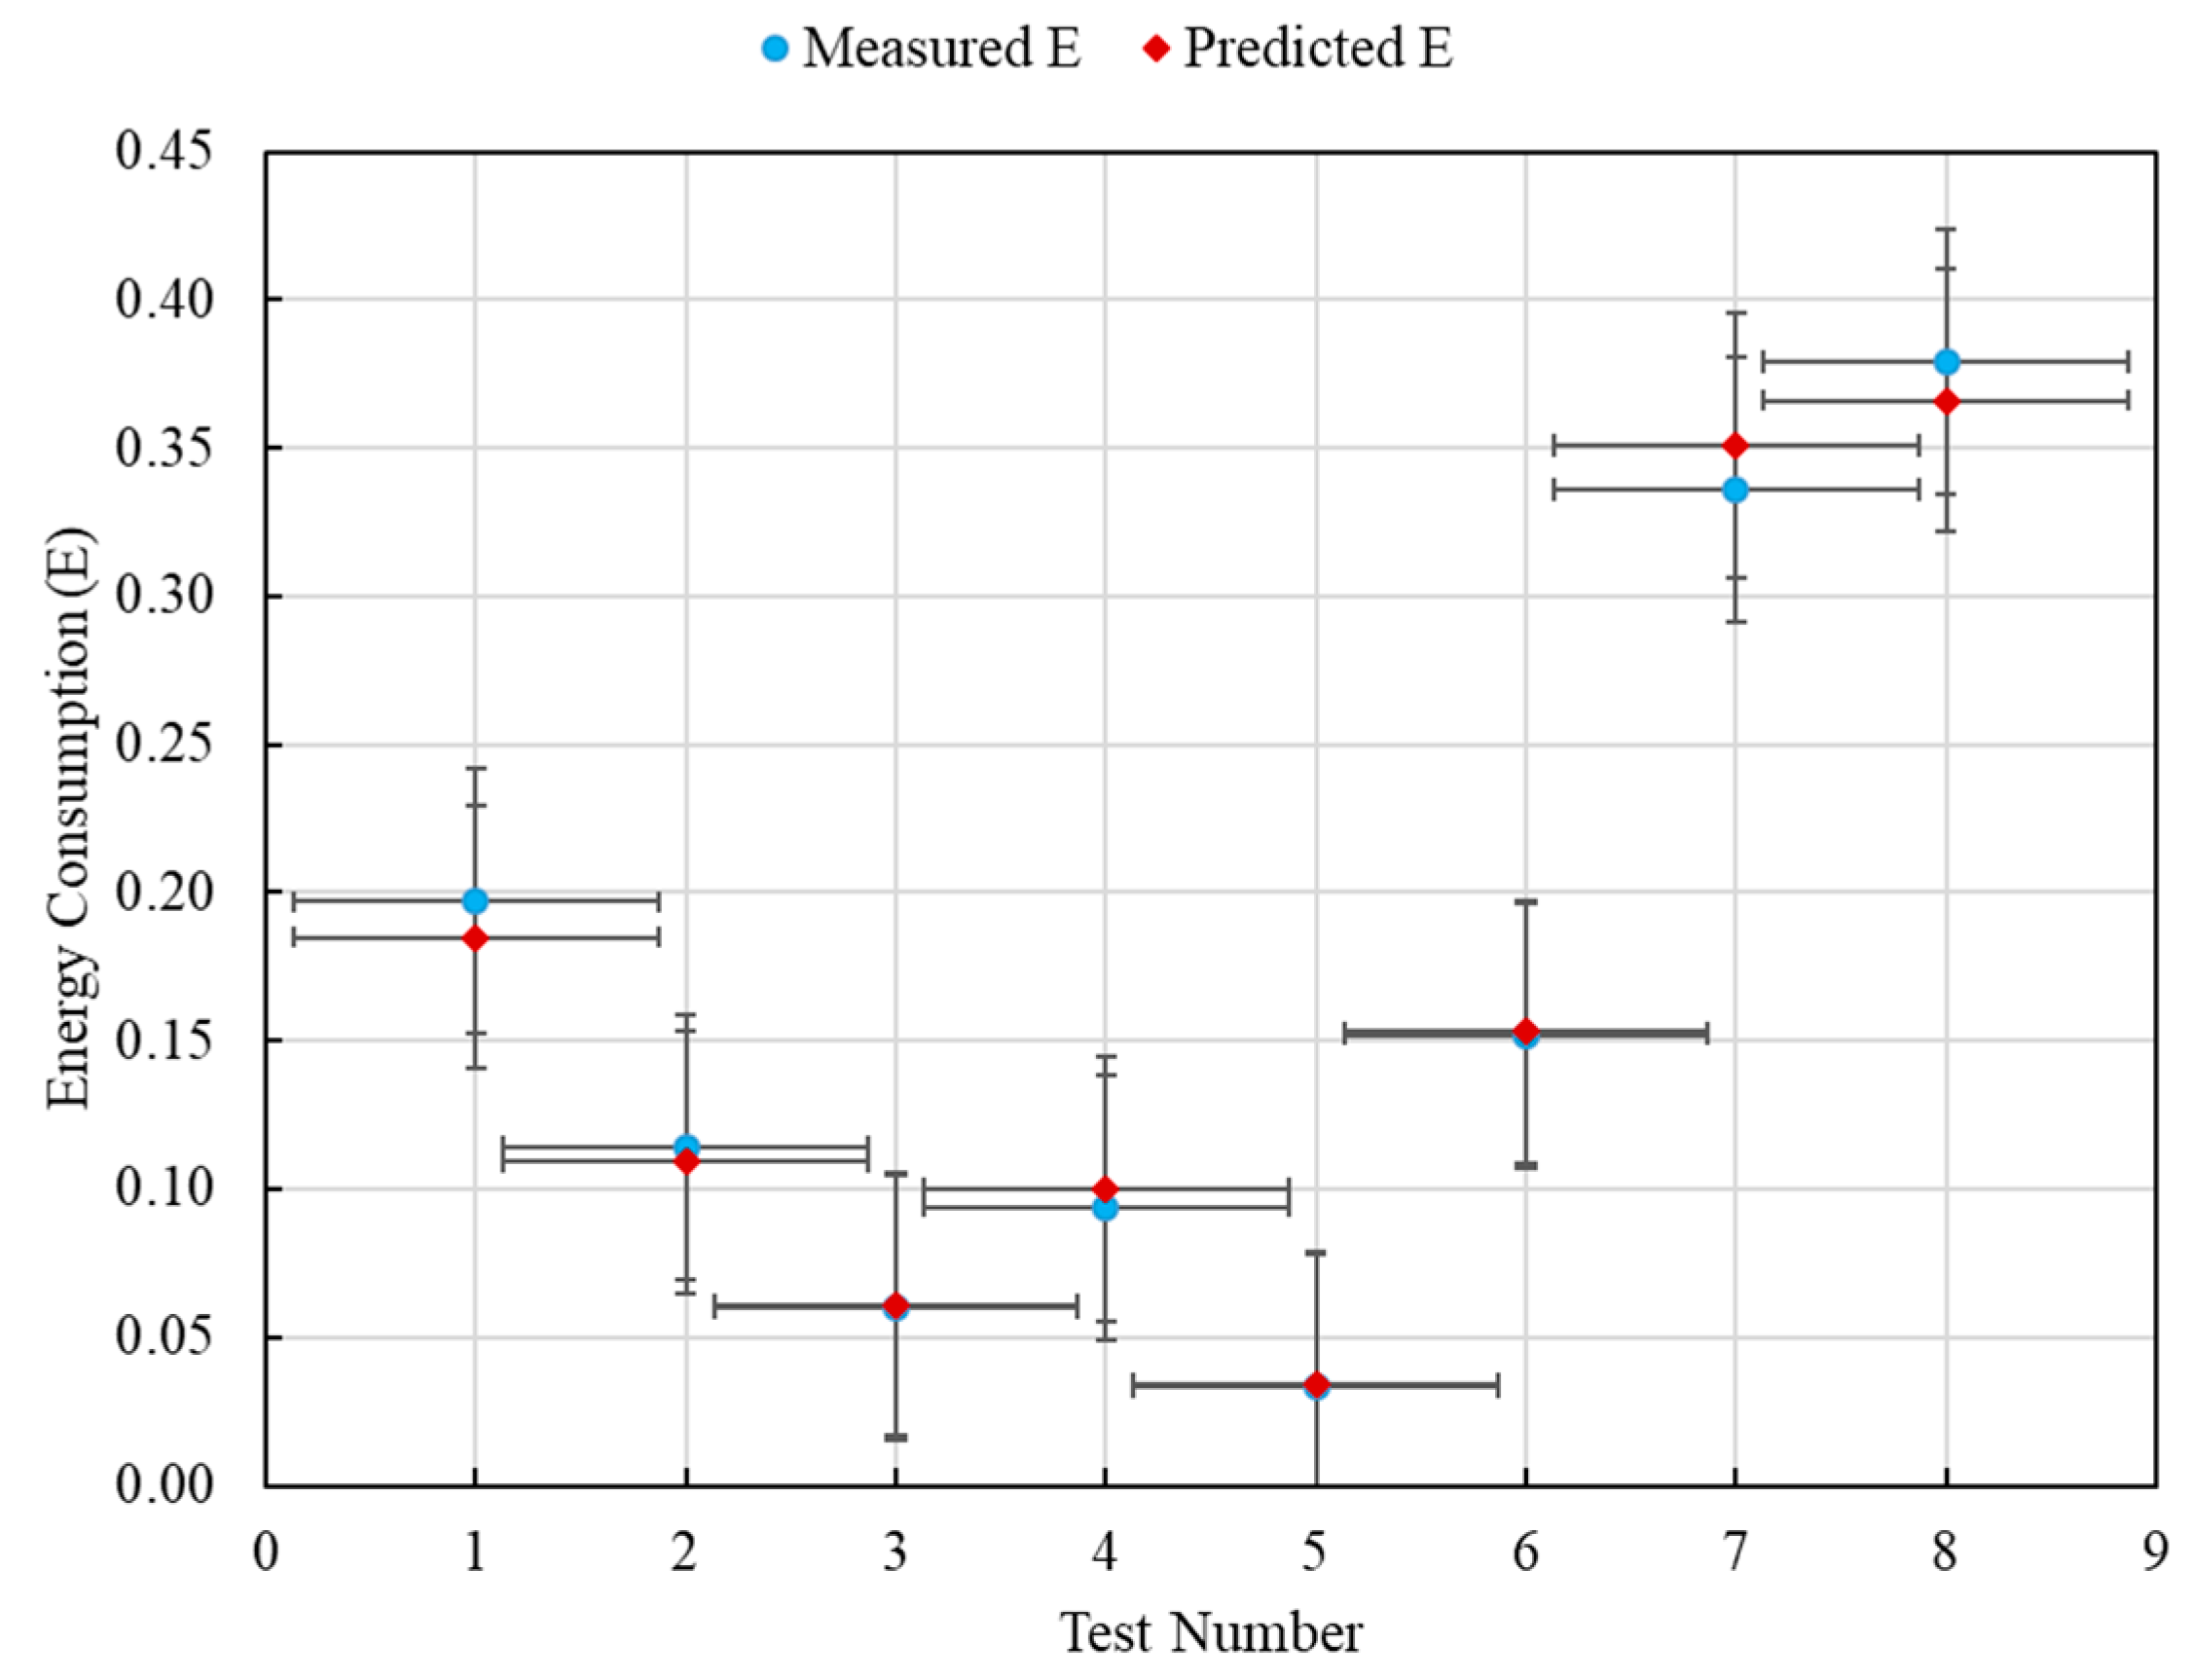
3.2. ANFIS Model Verification

The predicted power consumption (Ep) versus the measured power (Em) consumption from the real case study are compared in Table 2 and Figure 8.
A group of real data comprised of eight cases was used to run the ANFIS, then the ANFIS provided the predicted power consumption. Next, the Ep obtained by the ANFIS was compared with the measured Em. It was noticed that the maximum deviation was less than 6.5%, thus the ANFIS model provides a comparable value of power consumption that was very close to the actual values.
The error per cent Ei for any sample of data i (i varied from 1 to m, here m = 8) between the predicted values of energy by the ANFIS model (Epi) and the measured values (Emi) was estimated from the following equation:
E i = E m i E p i E m i × 100
While the corresponding average error percent Eav was computed using the following relation:
E a v = i = 1 m E i m
Based on the average error per cent provided in Table 2, the ANFIS model successfully predicted the power consumption with a 3.67% deviation from the measured data. Thus, the ANFIS model with gaussmf had an accuracy of more than 96% to predict the energy consumed by the jaw crusher.

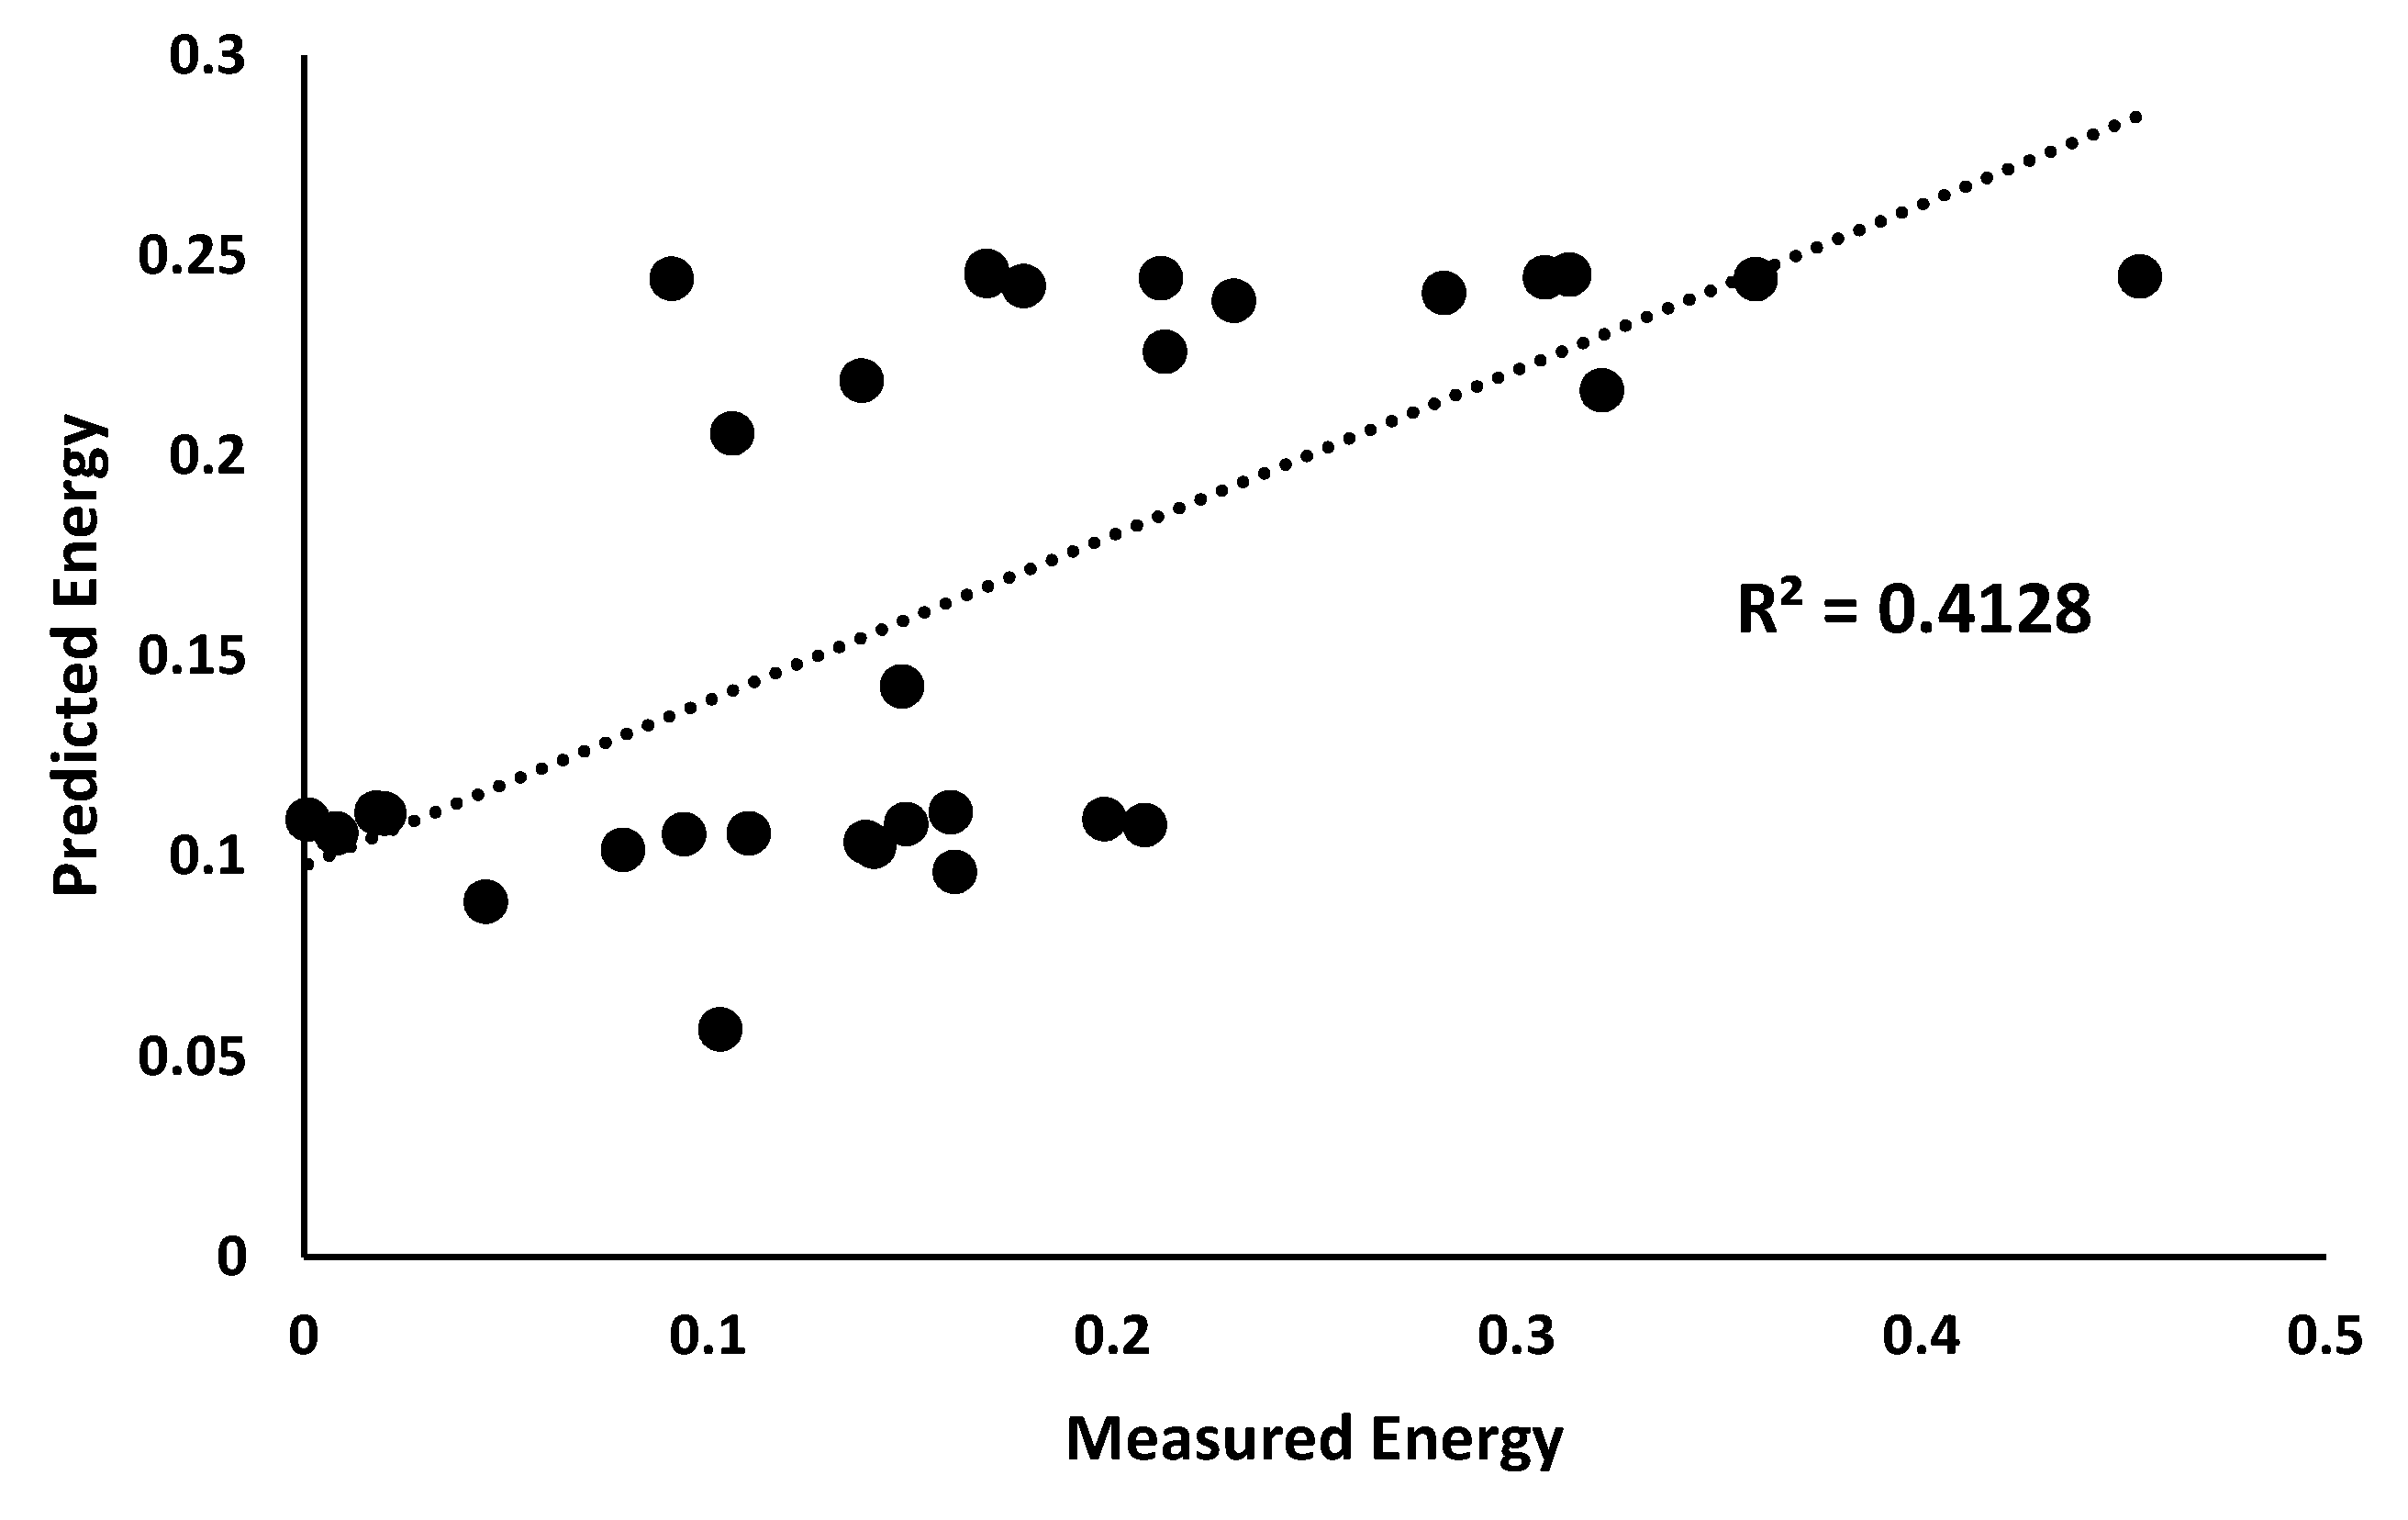
3.3. Working with the Regression Model

The regression system was designed, and the regression statistics of the Energy (E) were also calculated using MATLAB and the results are as shown in Figure 9 and Table 3. It can be summarized that the value of the coefficient correlation, R, of the energy prediction was about 0.41. This indicates that the regression system of best fit accounted for 42% of the variability of energy. The inferences and the calculated values of varying energy values are shown below, which further indicate that these values varied with each other as opposed to the ANFIS model. This may be the result of the varying coefficients of correlation between the independent variables. This can well be shown by the ANFIS systems.

4. Conclusions

In this work, the ANFIS model with gaussmf was used to obtain an accuracy relation to estimate the jaw crusher power consumption. The predictor input data included the closed side set, gap, stone strength, and targeted reduction ratio. A set of 32 specific energy consumption values were measured at various crushing conditions to generate the corresponding ANFIS model. Then, another set of eight measured data were used to evaluate the accuracy of the generated model to provide the specific energy consumption. Based on the average error percent, it was found that the ANFIS model with gaussmf had a high level of accuracy (more than 96%) to predict the specific energy consumption of jaw crusher. It was observed that the ANFIS model was more efficient than the regression model in terms of R2. Alternatively, the results showed that in some cases, the regression analysis, although a standard method in the modeling of such systems, failed to be reliable (R2 = 0.41), and hence, high-end models like the ANFIS model are preferred. The current study results proved the effectiveness of ANFIS as an accurate means of predicting the amount of energy applicable in the process of crushing. Therefore, the management team could further use the new model to assess the consumption of power early enough to enable them to take any necessary measures to avoid mistakes. The usefulness of the developed model could be improved further by a support system of decisions to assist the professionals working in the cement production plant.

Conflicts of Interest

The authors declare no conflicts of interest.

References

  1. Ashby, M.F.; Shercliff, H.; Cebon, D. Materials: Engineering, Science, Processing and Design; Butterworth-Heinemann: Oxford, UK, 2018. [Google Scholar]
  2. King, R.P. Modeling and Simulation of Mineral Processing Systems; Elsevier: Amsterdam, The Netherlands, 2012. [Google Scholar]
  3. Indraratna, B.; Sun, Y.; Nimbalkar, S. Laboratory assessment of the role of particle size distribution on the deformation and degradation of ballast under cyclic loading. J. Geotech. Geoenviron. Eng. 2016, 142, 04016016. [Google Scholar] [CrossRef]
  4. Mwangi, P.N.u.; Muvengei, O.M.; Mbuya, T.O. Review of Discrete Element Modelling in Optimisation of Energy Consumption of a Single-Toggle Jaw Crusher. In Proceedings of the Sustainable Research and Innovation Conference, Juja, Kenya, 2–4 May 2018; pp. 51–259. Available online: http://sri.jkuat.ac.ke/ojs/index.php/proceedings/article/view/684 (accessed on 18 September 2019).
  5. Ulsen, C.; Tseng, E.; Angulo, S.C.; Landmann, M.; Contessotto, R.; Balbo, J.T.; Kahn, H. Concrete aggregates properties crushed by jaw and impact secondary crushing. J. Mater. Res. Technol. 2019, 8, 494–502. [Google Scholar] [CrossRef]
  6. Weiss, N. SME Mining Engineering Handbook, 3rd ed.; American Institute of Mining, Metallurgical and Petroleum Engineering Inc.: Littleton, CO, USA, 2002. [Google Scholar]
  7. Revuelta, M.B. Mineral Processing. In Mineral Resources; Springer: Berlin, Germany, 2018; pp. 423–530. [Google Scholar]
  8. Sarkar, S.; Kumar, R.; Murthy, V. Experimental and Numerical Simulation of Crack Propagation in Sandstone by Semi Circular Bend Test. Geotech. Geol. Eng. 2019, 37, 1–13. [Google Scholar] [CrossRef]
  9. Donovan, J.G. Fracture Toughness Based Models for the Prediction of Power Consumption, Product Size, and Capacity of Jaw Crushers; Virginia Tech: Blacksburg, VA, USA, 2003. [Google Scholar]
  10. Eloranta, J. The efficiency of blasting versus crushing and grinding. In Proceedings of the 23rd Conference of Explosives and Blasting Technique, Las Vegas, NV, USA, 2–6 February 1997. [Google Scholar]
  11. Bearman, R.; Barley, R.; Hitchcock, A. Prediction of power consumption and product size in cone crushing. Miner. Eng. 1991, 4, 1243–1256. [Google Scholar] [CrossRef]
  12. Zhang, S.; Huang, Z.; Wang, H.; Li, G.; Sepehrnoori, K.; Wu, X.; Hong, C. Experimental study on the rock-breaking characteristics of abrasive liquid nitrogen jet for hot dry rock. J. Pet. Sci. Eng. 2019. [CrossRef]
  13. Bearman, R.T. Jaw and Impact Crushers. In SME Mineral Processing and Extractive Metallurgy Handbook; Society for Mining, Metallurgy, and Exploration, Inc.: Englewood, CO, USA, 2019; p. 367. [Google Scholar]
  14. Hofler, A.A. Fundamental Breakage Studies of Mineral Particles with an Ultrafast Load Cell Device. Ph.D. Thesis, University of Utah, Salt Lake City, UT, USA, 1992. [Google Scholar]
  15. Napier-Munn, T.J. Mineral Comminution Circuits: Their Operation and Optimization. Julius Kruttschnitt Mineral Research Centre: Indooroopilly, Australia, 1996. [Google Scholar]
  16. Svensson, A.; Steer, J. New cone crusher technology and developments in comminution circuits. Miner. Eng. 1990, 3, 83–103. [Google Scholar] [CrossRef]
  17. DeDiemar, R. New concepts in Jaw Crusher technology. Miner. Eng. 1990, 3, 67–74. [Google Scholar] [CrossRef]
  18. Legendre, D. Numerical and Experimental Optimization Analysis of a Jaw Crusher and a Bubble Column Reactor; Åbo Akademi University: Turku, Finland, 2019. [Google Scholar]
  19. Larison, B.W. Aggregate Production Modeling Using Neural Networks and Belief Networks. Master’s Thesis, University of Alberta, Edmonton, AB, Canada, 1999. [Google Scholar]
  20. Shi, J.J. Mathematical Models for Maximizing Aggregate Plant Production. J. Constr. Eng. Manag. 1999, 125, 53–60. [Google Scholar] [CrossRef]
  21. Halabian, A.M.; Shamsabadi, P.J. Numerical modeling of the RAP construction process and its effects on RAP behavior. Int. J. Geomech. 2014, 15, 04014085. [Google Scholar] [CrossRef]
  22. Sivacoumar, R.; Raj, S.M.; Chinnadurai, S.J.; Jayabalou, R. Modeling of fugitive dust emission and control measures in stone crushing industry. J. Environ. Monit. 2009, 11, 987–997. [Google Scholar] [CrossRef] [PubMed]
  23. Wang, B.; Martin, U.; Rapp, S. Discrete element modeling of the single-particle crushing test for ballast stones. Comput. Geotech. 2017, 88, 61–73. [Google Scholar] [CrossRef]
  24. Karaboga, D.; Kaya, E. Adaptive network based fuzzy inference system (ANFIS) training approaches: A comprehensive survey. Artif. Intell. Rev. 2018, 1–31. [Google Scholar] [CrossRef]
  25. Kasabov, N.K. Foundations of Neural Networks, Fuzzy Systems, and Knowledge Engineering; Auckland University of Technology: Auckland, New Zealand, 1996. [Google Scholar]
  26. Fullér, R. Fuzzy systems. In Introduction to Neuro-Fuzzy Systems; Springer: Berlin, Germany, 2000; pp. 1–131. [Google Scholar]
  27. Maher, I.; Eltaib, M.; Sarhan, A.A.; El-Zahry, R. Cutting force-based adaptive neuro-fuzzy approach for accurate surface roughness prediction in end milling operation for intelligent machining. Int. J. Adv. Manuf. Technol. 2015, 76, 1459–1467. [Google Scholar] [CrossRef]
  28. Belegundu, A.D.; Chandrupatla, T.R. Optimization Concepts and Applications in Engineering; Cambridge University Press: Cambridge, UK, 2019. [Google Scholar]
  29. Weigend, A.S. Time Series Prediction: Forecasting the Future and Understanding the Past; Routledge: London, UK, 2018. [Google Scholar]
  30. Cox, D.R. Analysis of Binary Data; Routledge: London, UK, 2018. [Google Scholar]
Figure 1. Kinematic of a single jaw crusher [3].
Applsci 09 03916 g001
Figure 2. Adaptive Neuro-Fuzzy Interference System(ANFIS) network for a two-input ‘Sugeno’ fuzzy model.
Applsci 09 03916 g002
Figure 3. Initial and final membership functions of stone strength (s); (a) initial, (b) final.
Applsci 09 03916 g003
Figure 4. Fuzzy rule architecture of the Gaussian membership function
Applsci 09 03916 g004
Figure 5. Training error.
Applsci 09 03916 g005
Figure 6. Energy (E) in relation to change of closed side set (CSS) and strength (S).
Applsci 09 03916 g006
Figure 7. Energy (E) in relation to change of gape (G) and the reduction ratio (RR).
Applsci 09 03916 g007
Figure 8. Error bars for the predicted energy with the help of the ANFIS model versus the measured energy values for different test data.
Applsci 09 03916 g008
Figure 9. Comparing calculated and inference energy consumption by the regression model.
Applsci 09 03916 g009
Table 1. Measured power consumption at different crushing conditions.
No.Reduction RatiosGape (mm)CSS (mm)StrengthPower Consumption kWh/t
11.528431.755.6970.103
27.7980.161
318.5760.02
49.8990.094
522.4930.018
612.9310.001
79.9940.008
826.6620.16
99.2110.139
107.0670.045
118.8930.141
1212.960.198
1311.2930.208
1411.4610.149
1510.0080.11
168.710.079
172.97224166.0970.106
187.2050.213
199.0980.23
2011.990.359
2112.5980.307
226.5670.321
236.6960.138
2412.1290.091
2510.5580.178
2618.1640.169
2713.2330.169
2813.9020.313
2912.8740.454
3012.2690.212
319.720.282
324.8630.148
Table 2. The ANFIS predicted powers versus the measured energy consumed by the jaw crusher.
Test No.ParametersPower Consumption kWh/tError (%)
RRGape (mm)CSS (mm)S (MPa)Measured EPredicted E
11.528431.7521.6660.1970.1856.09
28.330.1140.1094.39
36.2860.060.0611.67
48.0690.0940.16.38
52.97224164.8970.0330.0343.03
68.0710.1520.1530.66
78.6350.3360.3514.46
811.0210.3790.3663.43
Average Error3.76
R20.9947
Table 3. Regression statistics and coefficient values for the regression equation of energy prediction.
Regression StatisticsCoefficient
Root Mean Squared Error0.086Interceptb0 = −79.4983
R20.413reduction ratiosb1 = −14.417, b2 = 0.30816
Adjusted R20.35Gapeb3 = 0.7962, b4 = 0.9599
p-value0.00169Cssb5 = −3.0399, b6 = 0.961
Strengthb7 = 70.200, b8 = −4.117

