Improvement of ANFIS Model for Prediction of Compressive Strength of Manufactured Sand Concrete

 ,
,  ,
, 

Abstract
1. Introduction
2. Research Significance
3. Materials and Methods
3.1. Adaptive Neuro Fuzzy Inference System (ANFIS)
3.2. Teaching-Learning-Based Optimization (TLBO)
3.2.1. Initialization of the Population
3.2.2. Teacher Phase
3.2.3. Learner Phase
3.3. Principal Component Analysis (PCA)
- Preparation and normalization of inputs;
- Calculation of the covariance matrix;
- Calculation of the eigenvalues and eigenvectors;
- Estimation of the proportion of total variance of each principal component;
- Identification of the loading of principal components and contribution of inputs.
3.4. Collection of Data
3.5. Quality Assessment Criteria
4. Results and Discussions
4.1. PCA’s Results
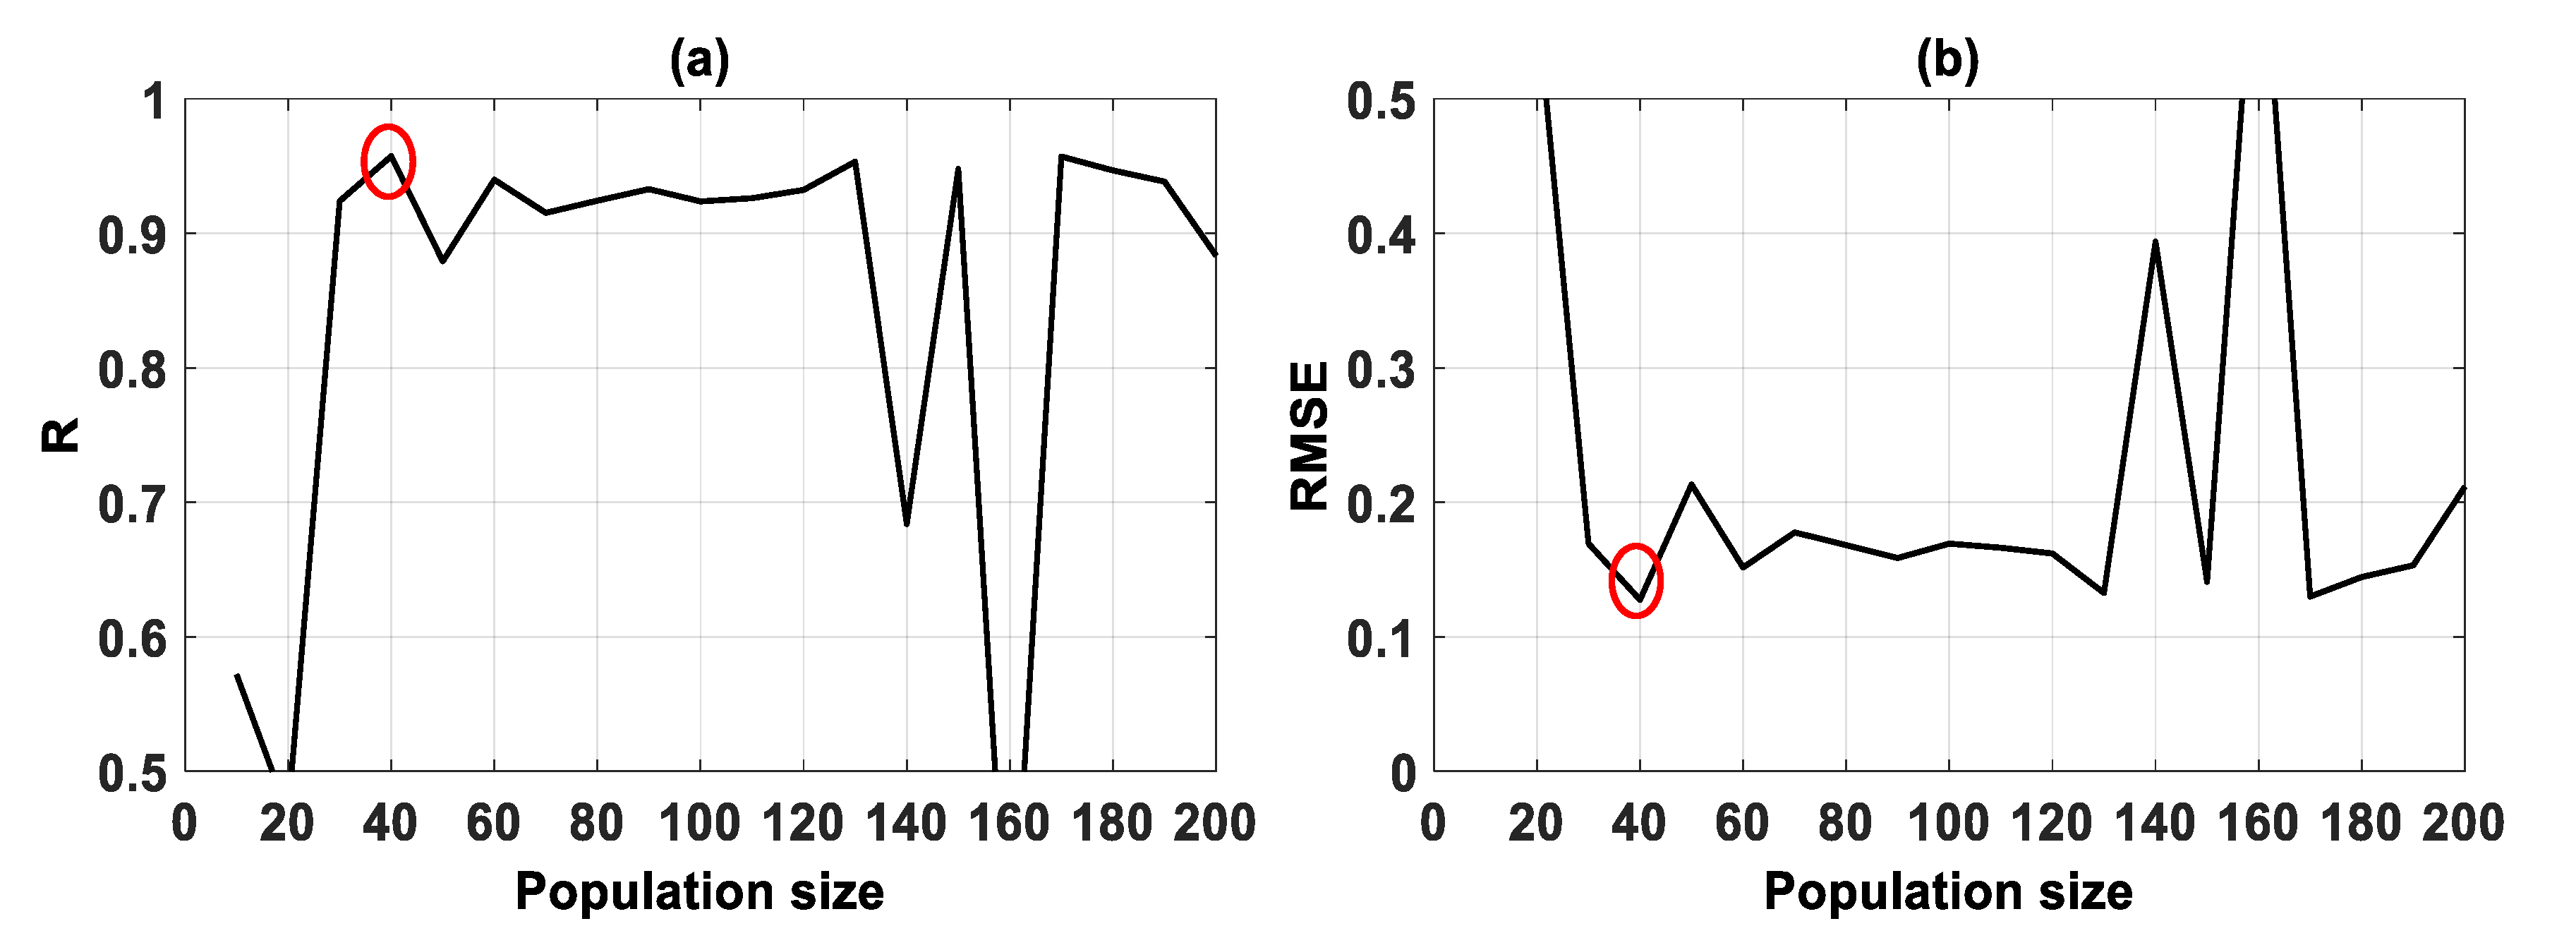
4.2. Optimization Procedure: Determination of Optimal Population Size
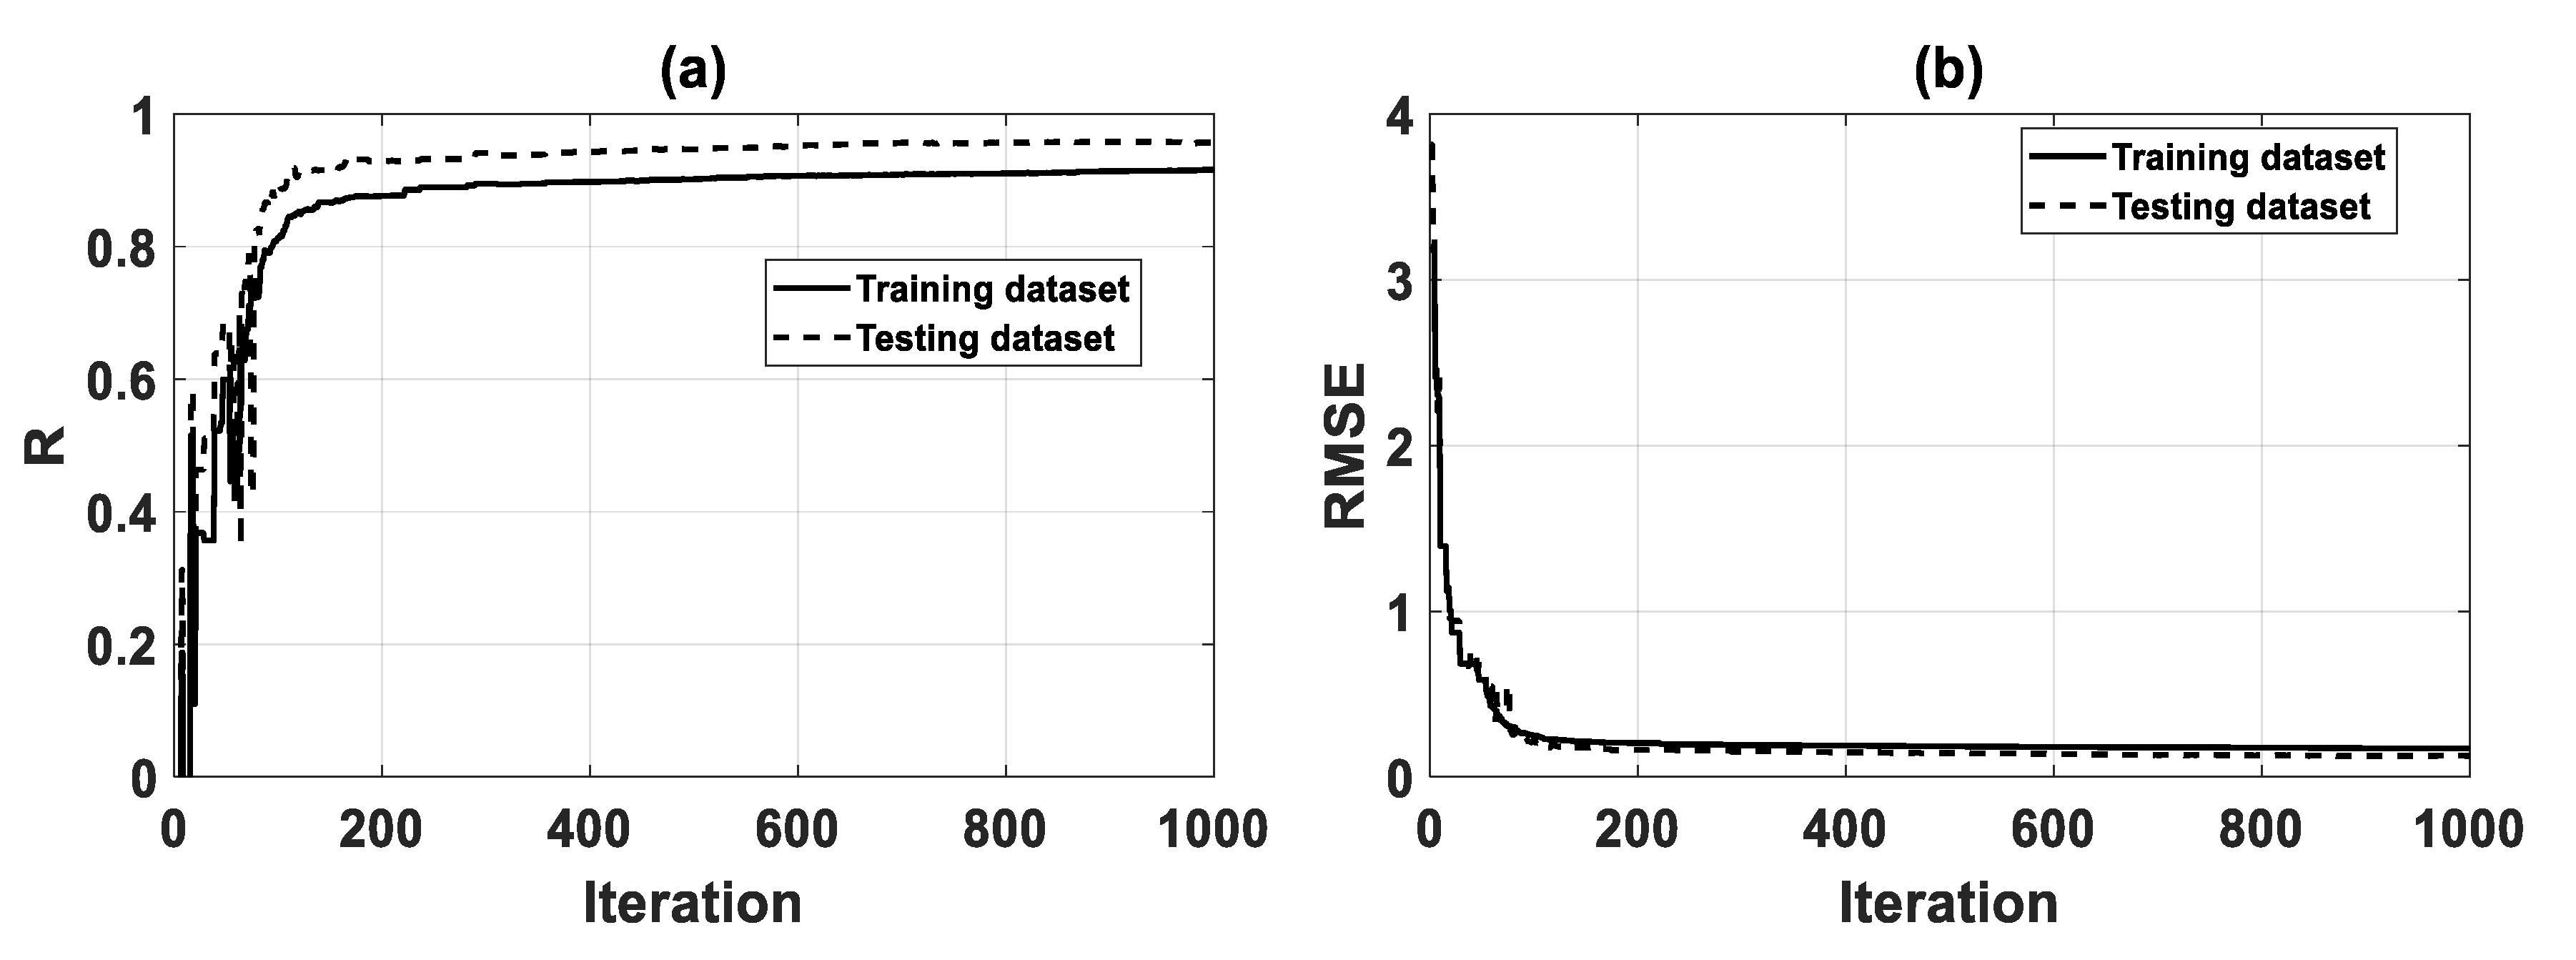
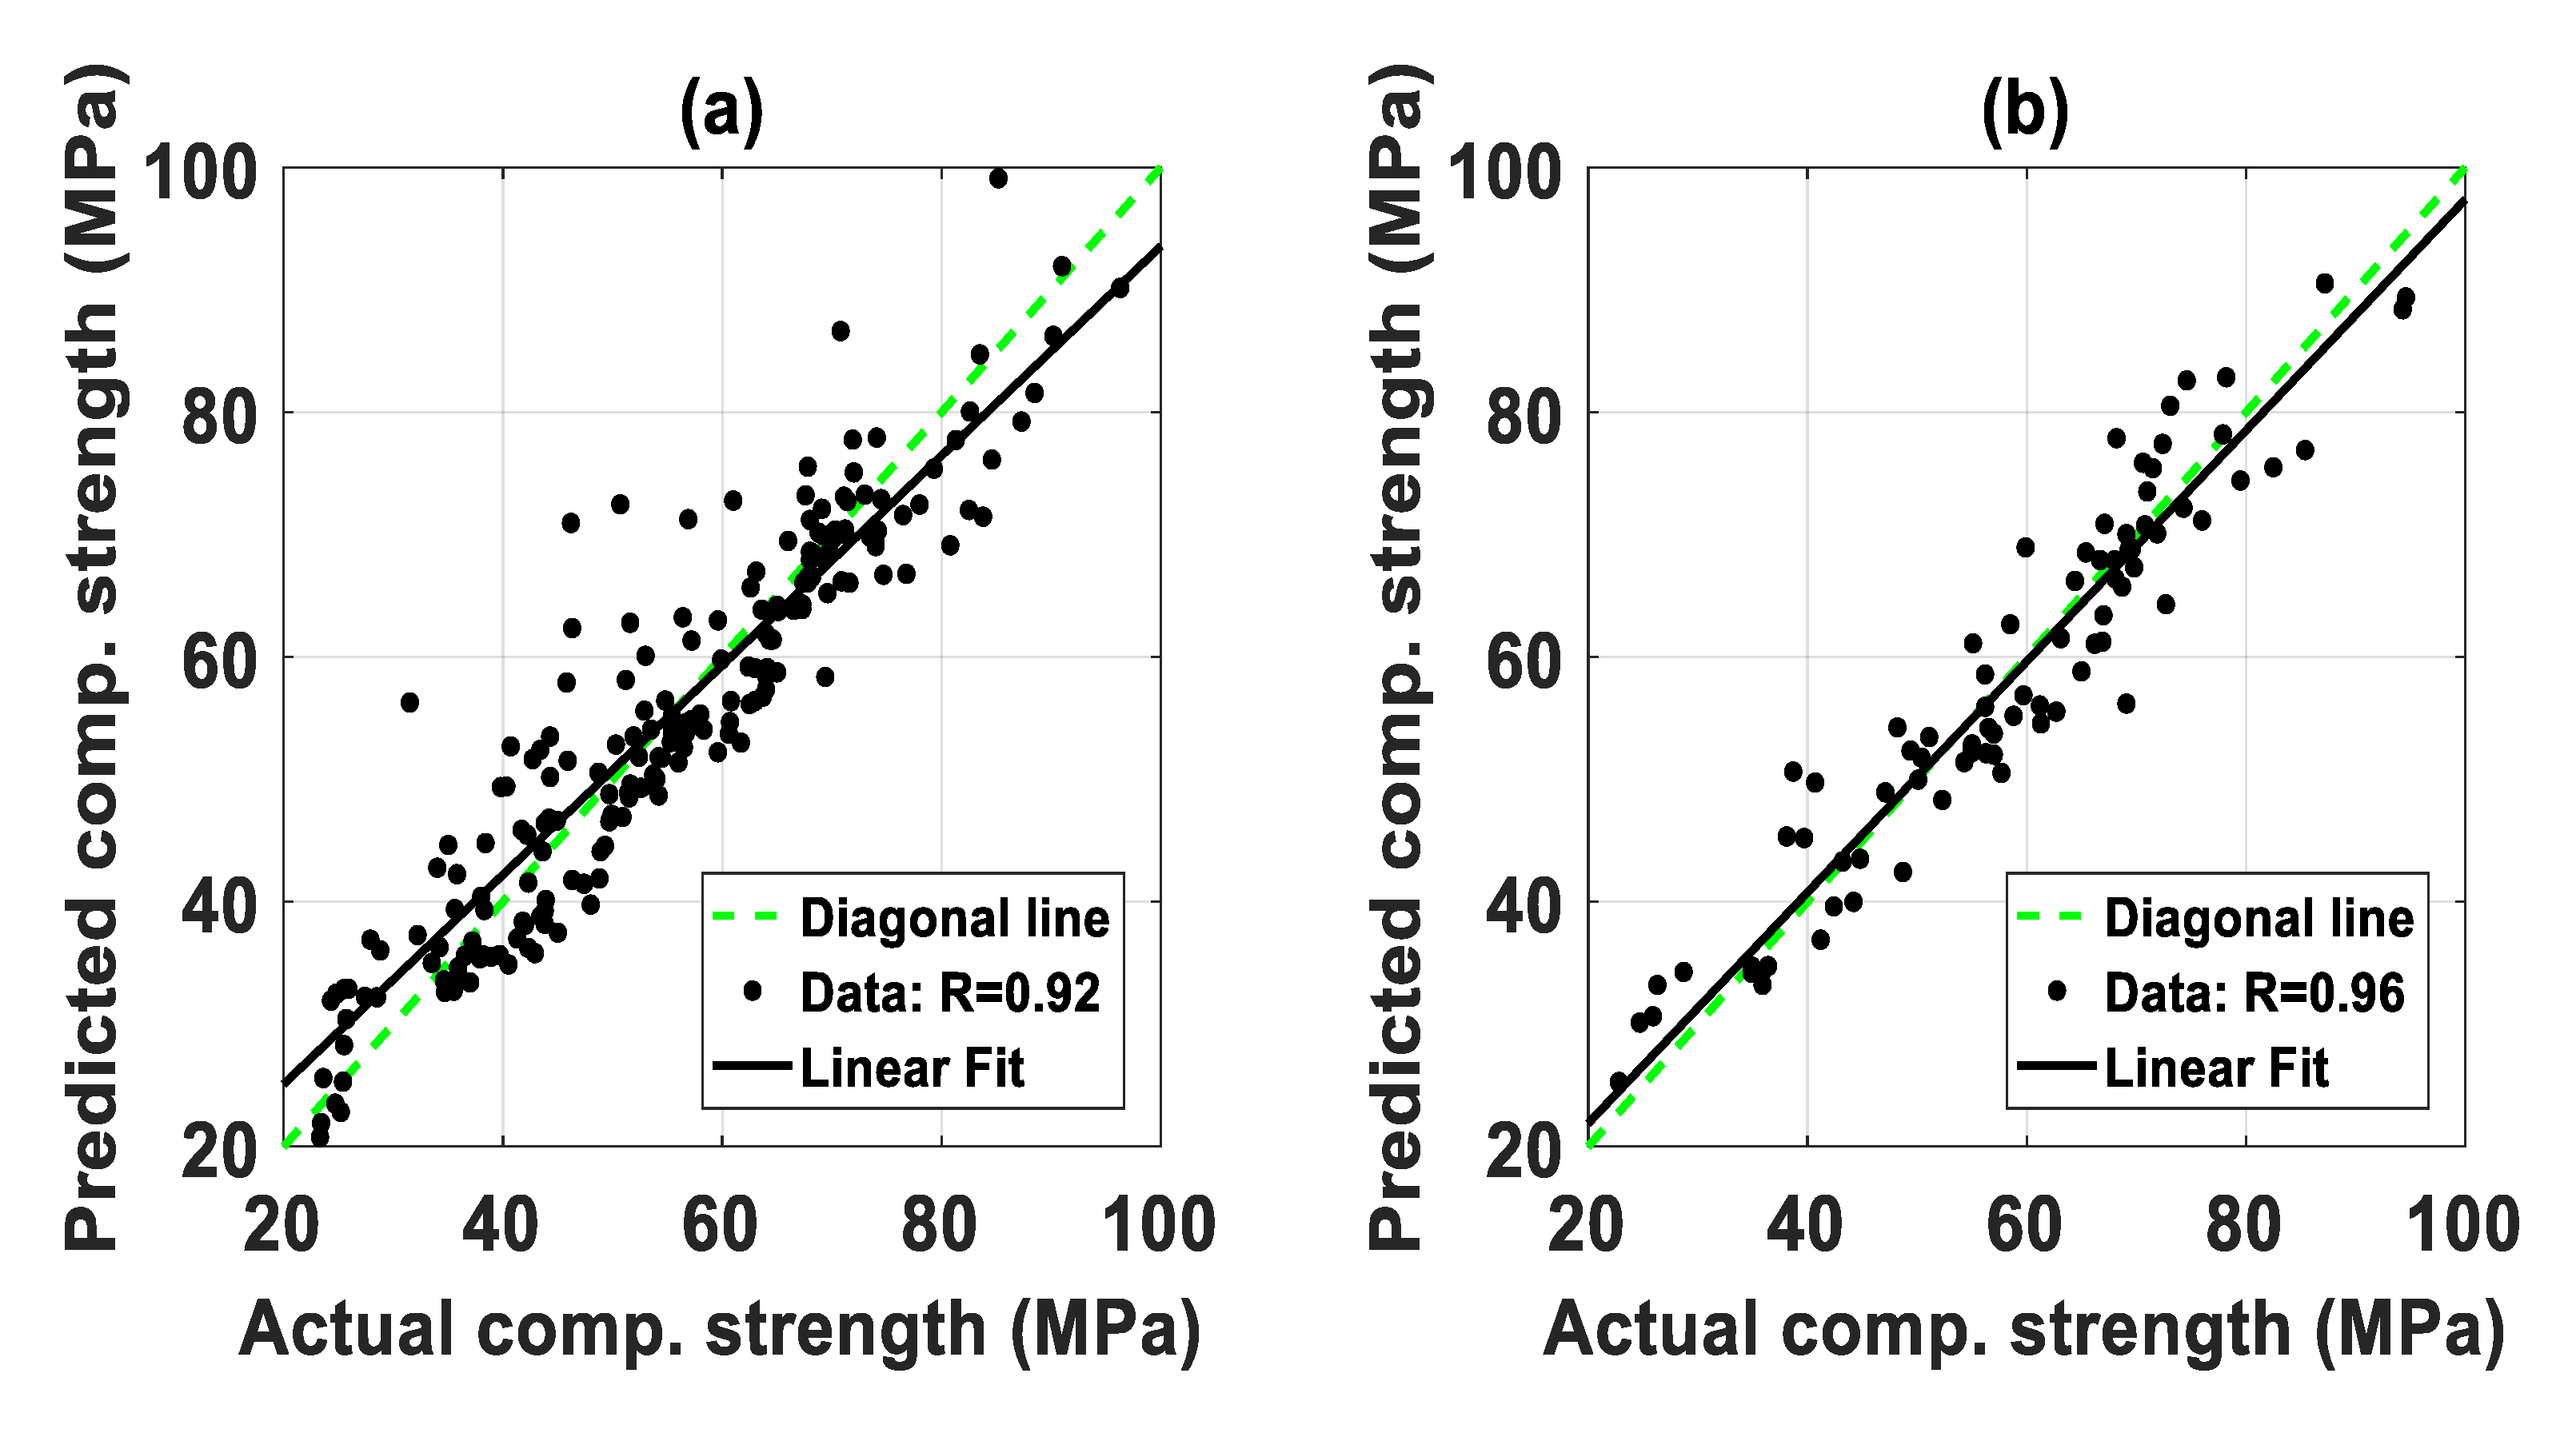
4.3. Prediction Capability: Improvement of Single ANFIS
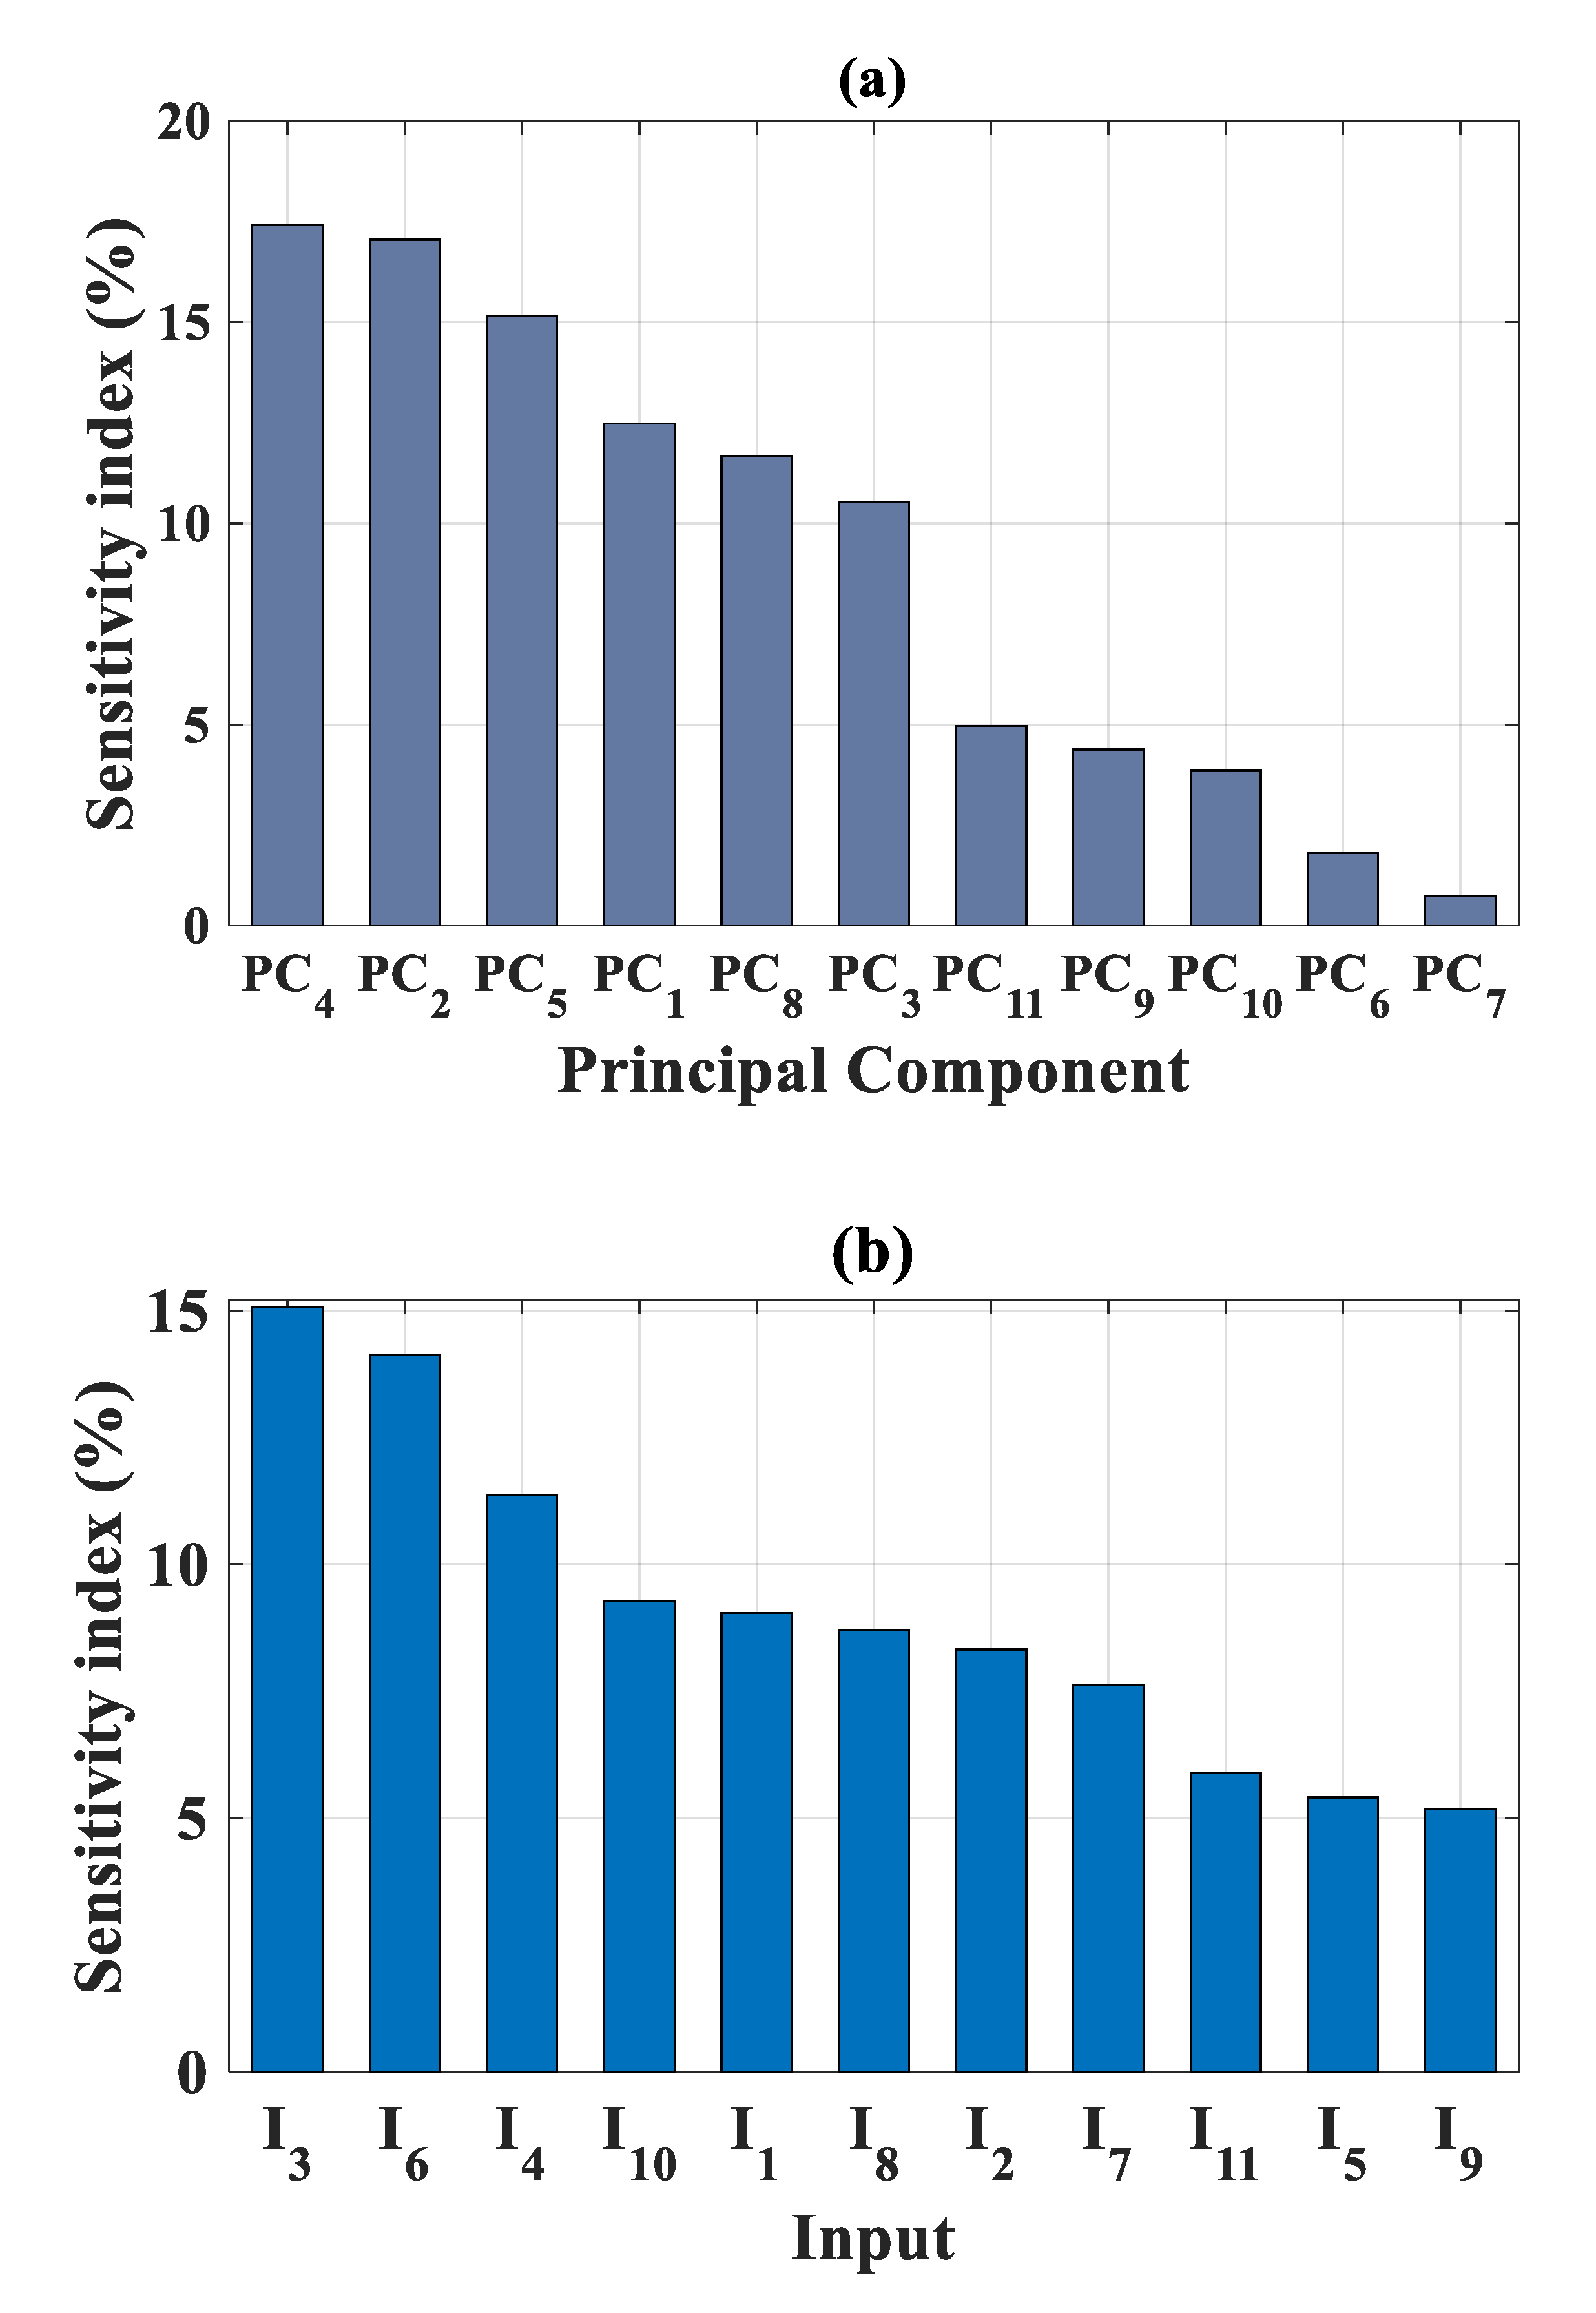
4.4. Sensitivity Analysis
4.5. Comparison with Existing Models in the Literature
5. Conclusions
Author Contributions
Conflicts of Interest
Abbreviations
| Designation | Explanation |
| MSC | Manufactured Sand Concrete |
| ANFIS | Adaptive Neuro Fuzzy Inference System |
| ANN | Artificial Neural Networks |
| SVM | Support Vector Machine |
| FL | Fuzzy Logic |
| TLBO | Teaching-Learning-Based Optimization |
| PCA | Principal Component Analysis |
| PCk (k = 1:11) | Principal components |
| EV | Explained variance |
| CS | Cumulative sum |
| AI | Artificial Intelligence |
| R | Correlation Coefficient |
| RMSE | Root Mean Squared Error |
| MAE | Mean Absolute Error |
| Std | Standard deviation |
| Ii (I = 1:11) | Designation of inputs |
| Y | Designation of target |
References
- Nanthagopalan, P.; Santhanam, M. Fresh and hardened properties of self-compacting concrete produced with manufactured sand. Cem. Concr. Compos. 2011, 33, 353–358. [Google Scholar] [CrossRef]
- Ji, T.; Chen, C.-Y.; Zhuang, Y.-Z.; Chen, J.-F. A mix proportion design method of manufactured sand concrete based on minimum paste theory. Constr. Build. Mater. 2013, 44, 422–426. [Google Scholar] [CrossRef]
- Shen, W.; Yang, Z.; Cao, L.; Cao, L.; Liu, Y.; Yang, H.; Lu, Z.; Bai, J. Characterization of manufactured sand: Particle shape, surface texture and behavior in concrete. Constr. Build. Mater. 2016, 114, 595–601. [Google Scholar] [CrossRef]
- Swamy, R.N. The Alkali-Silica Reaction in Concrete; CRC Press: Boca Raton, FL, USA, 2002. [Google Scholar]
- Zhao, S.B.; Ding, X.X.; Li, C.Y. Bond-Slip Relation of Plain Steel Bar in Concrete with Machine-Made Sand. Available online: https://www.scientific.net/AMM.238.142 (accessed on 5 July 2019).
- Li, B.; Ke, G.; Zhou, M. Influence of manufactured sand characteristics on strength and abrasion resistance of pavement cement concrete. Constr. Build. Mater. 2011, 25, 3849–3853. [Google Scholar] [CrossRef]
- Gonçalves, J.; Tavares, L.; Filho, R.T.; Fairbairn, E.; Cunha, E. Comparison of natural and manufactured fine aggregates in cement mortars. Cem. Concr. Res. 2007, 37, 924–932. [Google Scholar] [CrossRef]
- Yamei, H.; Lihua, W. Effect of Particle Shape of Limestone Manufactured Sand and Natural Sand on Concrete. Procedia Eng. 2017, 210, 87–92. [Google Scholar] [CrossRef]
- Mundra, S.; Sindhi, P.; Chandwani, V.; Nagar, R.; Agrawal, V. Crushed rock sand—An economical and ecological alternative to natural sand to optimize concrete mix. Perspect. Sci. 2016, 8, 345–347. [Google Scholar] [CrossRef]
- Guan, M.; Liu, W.; Lai, M.; Du, H.; Cui, J.; Gan, Y. Seismic behaviour of innovative composite walls with high-strength manufactured sand concrete. Eng. Struct. 2019, 195, 182–199. [Google Scholar] [CrossRef]
- Guan, M.; Lai, Z.; Xiao, Q.; Du, H.; Zhang, K. Bond behavior of concrete-filled steel tube columns using manufactured sand (MS-CFT). Eng. Struct. 2019, 187, 199–208. [Google Scholar] [CrossRef]
- Li, B.; Wang, J.; Zhou, M. Effect of limestone fines content in manufactured sand on durability of low- and high-strength concretes. Constr. Build. Mater. 2009, 23, 2846–2850. [Google Scholar] [CrossRef]
- Shen, W.; Liu, Y.; Wang, Z.; Cao, L.; Wu, D.; Wang, Y.; Ji, X. Influence of manufactured sand’s characteristics on its concrete performance. Constr. Build. Mater. 2018, 172, 574–583. [Google Scholar] [CrossRef]
- Ding, X.; Li, C.; Xu, Y.; Li, F.; Zhao, S. Experimental study on long-term compressive strength of concrete with manufactured sand. Constr. Build. Mater. 2016, 108, 67–73. [Google Scholar] [CrossRef]
- Yang, R.; Yu, R.; Shui, Z.; Guo, C.; Wu, S.; Gao, X.; Peng, S. The physical and chemical impact of manufactured sand as a partial replacement material in Ultra-High Performance Concrete (UHPC). Cem. Concr. Compos. 2019, 99, 203–213. [Google Scholar] [CrossRef]
- Park, S. Study on the Fluidity and Strength Properties of High Performance Concrete Utilizing Crushed Sand. Int. J. Concr. Struct. Mater. 2012, 6, 231–237. [Google Scholar] [CrossRef]
- Donza, H.; Cabrera, O.; Irassar, E. High-strength concrete with different fine aggregate. Cem. Concr. Res. 2002, 32, 1755–1761. [Google Scholar] [CrossRef]
- Mak, S.L.; Torii, K. Strength development of high strength concretes with and without silica fume under the influence of high hydration temperatures. Cem. Concr. Res. 1995, 25, 1791–1802. [Google Scholar] [CrossRef]
- Armaghani, D.J.; Hatzigeorgiou, G.D.; Karamani, C.; Skentou, A.; Zoumpoulaki, I.; Asteris, P.G. Soft computing-based techniques for concrete beams shear strength. Procedia Struct. Integr. 2019, 17, 924–933. [Google Scholar] [CrossRef]
- Yeh, I.-C. Modeling of strength of high-performance concrete using artificial neural networks. Cem. Concr. Res. 1998, 28, 1797–1808. [Google Scholar] [CrossRef]
- Asteris, P.G.; Ashrafian, A.; Rezaie-Balf, M. Prediction of the compressive strength of self-compacting concrete using surrogate models. 2019, 24, 137–150. Comput. Concr. 2019, 24, 137–150. [Google Scholar]
- Asteris, P.G.; Kolovos, K.G. Self-compacting concrete strength prediction using surrogate models. Neural Comput. Applic. 2019, 31, 409–424. [Google Scholar] [CrossRef]
- Sarir, P.; Chen, J.; Asteris, P.G.; Armaghani, D.J.; Tahir, M.M. Developing GEP tree-based, neuro-swarm, and whale optimization models for evaluation of bearing capacity of concrete-filled steel tube columns. Eng. Comput. 2019, 1–19. [Google Scholar] [CrossRef]
- Apostolopoulou, M.; Armaghani, D.J.; Bakolas, A.; Douvika, M.G.; Moropoulou, A.; Asteris, P.G. Compressive strength of natural hydraulic lime mortars using soft computing techniques. Procedia Struct. Integr. 2019, 17, 914–923. [Google Scholar] [CrossRef]
- Van Dao, D.; Ly, H.-B.; Trinh, S.H.; Le, T.-T.; Pham, B.T. Artificial Intelligence Approaches for Prediction of Compressive Strength of Geopolymer Concrete. Materials 2019, 12, 983. [Google Scholar]
- Dao, D.; Trinh, S.H.; Ly, H.-B.; Pham, B.T. Prediction of Compressive Strength of Geopolymer Concrete Using Entirely Steel Slag Aggregates: Novel Hybrid Artificial Intelligence Approaches. Appl. Sci. 2019, 9, 1113. [Google Scholar] [CrossRef]
- Golafshani, E.M.; Behnood, A. Estimating the optimal mix design of silica fume concrete using biogeography-based programming. Cem. Concr. Compos. 2019, 96, 95–105. [Google Scholar] [CrossRef]
- Bingöl, A.F.; Tortum, A.; Gül, R. Neural networks analysis of compressive strength of lightweight concrete after high temperatures. Mater. Des. (1980–2015) 2013, 52, 258–264. [Google Scholar] [CrossRef]
- Mishra, M.; Bhatia, A.S.; Maity, D. A comparative study of regression, neural network and neuro-fuzzy inference system for determining the compressive strength of brick–mortar masonry by fusing nondestructive testing data. Eng. Comput. 2019, 1–15. [Google Scholar] [CrossRef]
- Bui, D.T.; Abdullahi, M.M.; Ghareh, S.; Moayedi, H.; Nguyen, H. Fine-tuning of neural computing using whale optimization algorithm for predicting compressive strength of concrete. Eng. Comput. 2019, 1–12. [Google Scholar] [CrossRef]
- Behnood, A.; Golafshani, E.M. Predicting the compressive strength of silica fume concrete using hybrid artificial neural network with multi-objective grey wolves. J. Clean. Prod. 2018, 202, 54–64. [Google Scholar] [CrossRef]
- Peng, C.-H.; Yeh, I.-C.; Lien, L.-C. Building strength models for high-performance concrete at different ages using genetic operation trees, nonlinear regression, and neural networks. Eng. Comput. 2010, 26, 61–73. [Google Scholar] [CrossRef]
- Tsai, H.-C.; Lin, Y.-H. Predicting high-strength concrete parameters using weighted genetic programming. Eng. Comput. 2011, 27, 347–355. [Google Scholar] [CrossRef]
- Yeh, I.-C. Optimization of concrete mix proportioning using a flattened simplex–centroid mixture design and neural networks. Eng. Comput. 2008, 25, 179–190. [Google Scholar] [CrossRef]
- Alipour, R.; Toghroli, A.; Mu’Azu, M.; Katebi, J.; Mohammadhassani, M.; Khalafi, S.; Mohamad, E.T.; Wakil, K.; Khorami, M. Computational optimized finite element modelling of mechanical interaction of concrete with fiber reinforced polymer. Comput. Concr. 2019, 23, 061. [Google Scholar]
- Asteris, P.G.; Nikoo, M. Artificial bee colony-based neural network for the prediction of the fundamental period of infilled frame structures. Neural Comput. Appl. 2019, 1–11. [Google Scholar] [CrossRef]
- Jang, J.R. ANFIS: Adaptive-network-based fuzzy inference system. IEEE Trans. Syst. Man Cybern. 1993, 23, 665–685. [Google Scholar] [CrossRef]
- Nguyen, P.T.; Tuyen, T.T.; Shirzadi, A.; Pham, B.T.; Shahabi, H.; Omidvar, E.; Amini, A.; Entezami, H.; Prakash, I.; Phong, T.V. Development of a Novel Hybrid Intelligence Approach for Landslide Spatial Prediction. Appl. Sci. 2019, 9, 2824. [Google Scholar] [CrossRef]
- Kaloop, M.R.; Kumar, D.; Samui, P.; Gabr, A.R.; Hu, J.W.; Jin, X.; Roy, B. Particle Swarm Optimization Algorithm-Extreme Learning Machine (PSO-ELM) Model for Predicting Resilient Modulus of Stabilized Aggregate Bases. Appl. Sci. 2019, 9, 3221. [Google Scholar] [CrossRef]
- Xu, H.; Zhou, J.; Asteris, P.G.; Armaghani, D.J.; Tahir, M.M. Supervised Machine Learning Techniques to the Prediction of Tunnel Boring Machine Penetration Rate. Appl. Sci. 2019, 9, 3715. [Google Scholar] [CrossRef]
- Le, L.T.; Nguyen, H.; Dou, J.; Zhou, J. A Comparative Study of PSO-ANN, GA-ANN, ICA-ANN, and ABC-ANN in Estimating the Heating Load of Buildings’ Energy Efficiency for Smart City Planning. Appl. Sci. 2019, 9, 2630. [Google Scholar] [CrossRef]
- Pham, B.T.; Son, L.H.; Hoang, T.-A.; Nguyen, D.-M.; Bui, D.T. Prediction of shear strength of soft soil using machine learning methods. Catena 2018, 166, 181–191. [Google Scholar] [CrossRef]
- Jang, J.; Sun, C.; Mizutani, E. Neuro-Fuzzy and Soft Computing-A Computational Approach to Learning and Machine Intelligence [Book Review]. IEEE Trans. Autom. Control. 1997, 42, 1482–1484. [Google Scholar] [CrossRef]
- Esmaeili, M.; Osanloo, M.; Rashidinejad, F.; Aghajani Bazzazi, A.; Taji, M. Multiple regression, ANN and ANFIS models for prediction of backbreak in the open pit blasting. Eng. Comput. 2014, 30, 549–558. [Google Scholar] [CrossRef]
- Pham, B.T.; Nguyen, M.D.; Van Dao, D.; Prakash, I.; Ly, H.B.; Le, T.T.; Ho, L.S.; Nguyen, K.T.; Ngo, T.Q.; Hoang, V.; et al. Development of artificial intelligence models for the prediction of Compression Coefficient of soil: An application of Monte Carlo sensitivity analysis. Sci. Total. Environ. 2019, 679, 172–184. [Google Scholar] [CrossRef] [PubMed]
- Pham, B.T.; Jaafari, A.; Prakash, I.; Singh, S.K.; Quoc, N.K.; Bui, D.T. Hybrid computational intelligence models for groundwater potential mapping. Catena 2019, 182, 104101. [Google Scholar] [CrossRef]
- Karaboga, D.; Kaya, E. Adaptive network based fuzzy inference system (ANFIS) training approaches: A comprehensive survey. Artif. Intell. Rev. 2018, 1–31. [Google Scholar] [CrossRef]
- Le, L.M.; Ly, H.-B.; Pham, B.T.; Le, V.M.; Pham, T.A.; Nguyen, D.-H.; Tran, X.-T.; Le, T.-T. Hybrid Artificial Intelligence Approaches for Predicting Buckling Damage of Steel Columns Under Axial Compression. Materials 2019, 12, 1670. [Google Scholar] [CrossRef]
- Termeh, S.V.R.; Khosravi, K.; Sartaj, M.; Keesstra, S.D.; Tsai, F.T.-C.; Dijksma, R.; Pham, B.T. Optimization of an adaptive neuro-fuzzy inference system for groundwater potential mapping. Hydrogeol. J. 2019, 1–24. [Google Scholar] [CrossRef]
- Takagi, T.; Sugeno, M. Derivation of Fuzzy Control Rules from Human Operator’s Control Actions. IFAC Proc. Vol. 1983, 16, 55–60. [Google Scholar] [CrossRef]
- Takagi, T.; Sugeno, M. Fuzzy Identification of Systems and Its Applications to Modeling and Control. In Readings in Fuzzy Sets for Intelligent Systems; Elsevier BV: Amsterdam, The Netherlands, 1993; pp. 387–403. [Google Scholar]
- Abraham, A. Adaptation of Fuzzy Inference System Using Neural Learning. In Granular Computing; Springer Science and Business Media LLC: Berlin, Germany, 2005; Volume 181, pp. 53–83. [Google Scholar]
- Nguyen, H.-L.; Le, T.-H.; Pham, C.-T.; Le, T.-T.; Ho, L.S.; Le, V.M.; Pham, B.T.; Ly, H.-B. Development of Hybrid Artificial Intelligence Approaches and a Support Vector Machine Algorithm for Predicting the Marshall Parameters of Stone Matrix Asphalt. Appl. Sci. 2019, 9, 3172. [Google Scholar] [CrossRef]
- Aditya, M.; Chandranath, C.; Singh, R.N. Flood Forecasting Using ANN, Neuro-Fuzzy, and Neuro-GA Models. J. Hydrol. Eng. 2009, 14, 647–652. [Google Scholar]
- Nayak, P.C.; Sudheer, K.P.; Rangan, D.M.; Ramasastri, K.S. Short-term flood forecasting with a neurofuzzy model. Water Resour. Res. 2005, 41, 41. [Google Scholar] [CrossRef]
- Bui, K.-T.T.; Bui, D.T.; Zou, J.; Van Doan, C.; Revhaug, I. A novel hybrid artificial intelligent approach based on neural fuzzy inference model and particle swarm optimization for horizontal displacement modeling of hydropower dam. Neural Comput. Appl. 2016, 29, 1495–1506. [Google Scholar] [CrossRef]
- Bui, D.T.; Khosravi, K.; Li, S.; Shahabi, H.; Panahi, M.; Singh, V.P.; Chapi, K.; Shirzadi, A.; Panahi, S.; Chen, W.; et al. New Hybrids of ANFIS with Several Optimization Algorithms for Flood Susceptibility Modeling. Water 2018, 10, 1210. [Google Scholar]
- Chen, M.-Y. A hybrid ANFIS model for business failure prediction utilizing particle swarm optimization and subtractive clustering. Inf. Sci. 2013, 220, 180–195. [Google Scholar] [CrossRef]
- Jaafari, A.; Panahi, M.; Pham, B.T.; Shahabi, H.; Bui, D.T.; Rezaie, F.; Lee, S. Meta optimization of an adaptive neuro-fuzzy inference system with grey wolf optimizer and biogeography-based optimization algorithms for spatial prediction of landslide susceptibility. Catena 2019, 175, 430–445. [Google Scholar] [CrossRef]
- Pham, B.T.; Prakash, I. Spatial Prediction of Rainfall Induced Shallow Landslides Using Adaptive-Network-Based Fuzzy Inference System and Particle Swarm Optimization: A Case Study at the Uttarakhand Area, India. In Advances and Applications in Geospatial Technology and Earth Resources; Springer Science and Business Media LLC: Berlin, Germany, 2017; pp. 224–238. [Google Scholar]
- Ly, H.-B.; Le, L.M.; Duong, H.T.; Nguyen, T.C.; Pham, T.A.; Le, T.-T.; Le, V.M.; Nguyen-Ngoc, L.; Pham, B.T. Hybrid Artificial Intelligence Approaches for Predicting Critical Buckling Load of Structural Members under Compression Considering the Influence of Initial Geometric Imperfections. Appl. Sci. 2019, 9, 2258. [Google Scholar] [CrossRef]
- Cavaleri, L.; Asteris, P.G.; Psyllaki, P.P.; Douvika, M.G.; Skentou, A.D.; Vaxevanidis, N.M. Prediction of Surface Treatment Effects on the Tribological Performance of Tool Steels Using Artificial Neural Networks. Appl. Sci. 2019, 9, 2788. [Google Scholar] [CrossRef]
- Asteris, P.G.; Nozhati, S.; Nikoo, M.; Cavaleri, L.; Nikoo, M. Krill herd algorithm-based neural network in structural seismic reliability evaluation. Mech. Adv. Mater. Struct. 2018, 26, 1146–1153. [Google Scholar] [CrossRef]
- Rao, R.; Savsani, V.; Vakharia, D.; Savsani, V. Teaching–learning-based optimization: A novel method for constrained mechanical design optimization problems. Comput. Des. 2011, 43, 303–315. [Google Scholar] [CrossRef]
- Rao, R.V.; Savsani, V.J.; Vakharia, D.P. Teaching–learning-based optimization: An optimization method for continuous non-linear large scale problems. Inf. Sci. 2012, 183, 1–15. [Google Scholar] [CrossRef]
- Rao, R.V.; Patel, V. An elitist teaching-learning-based optimization algorithm for solving complex constrained optimization problems. Int. J. Ind. Eng. Comput. 2012, 3, 535–560. [Google Scholar] [CrossRef]
- Hassanzadeh, Y.; Jafari-Bavil-Olyaei, A.; Aalami, M.-T.; Kardan, N. Experimental and numerical investigation of bridge pier scour estimation using ANFIS and teaching–learning-based optimization methods. Eng. Comput. 2019, 35, 1103–1120. [Google Scholar] [CrossRef]
- Abhishek, K.; Kumar, V.R.; Datta, S.; Mahapatra, S.S. Application of JAYA algorithm for the optimization of machining performance characteristics during the turning of CFRP (epoxy) composites: Comparison with TLBO, GA, and ICA. Eng. Comput. 2017, 33, 457–475. [Google Scholar] [CrossRef]
- Cheng, M.-Y.; Prayogo, D. A novel fuzzy adaptive teaching–learning-based optimization (FATLBO) for solving structural optimization problems. Eng. Comput. 2017, 33, 55–69. [Google Scholar] [CrossRef]
- Bayat, M.; Ghorbanpour, M.; Zare, R.; Jaafari, A.; Pham, B.T. Application of artificial neural networks for predicting tree survival and mortality in the Hyrcanian forest of Iran. Comput. Electron. Agric. 2019, 164, 104929. [Google Scholar] [CrossRef]
- Jolliffe, I.T. Principal Component Analysis; Springer Series in Statistics, 2nd ed.; Springer: New York, NY, USA, 2002; ISBN 978-0-387-95442-4. [Google Scholar]
- Gosav, S.; Praisler, M.; Birsa, M.L. Principal Component Analysis Coupled with Artificial Neural Networks—A Combined Technique Classifying Small Molecular Structures Using a Concatenated Spectral Database. Int. J. Mol. Sci. 2011, 12, 6668–6684. [Google Scholar] [CrossRef]
- Defernez, M.; Kemsley, E.K. Avoiding overfitting in the analysis of high-dimensional data with artificial neural networks (ANNs). Analyst 1999, 124, 1675–1681. [Google Scholar] [CrossRef]
- May, R.; Dandy, G.; Maier, H. Review of Input Variable Selection Methods for Artificial Neural Networks. Artificial Neural Networks—Methodological Advances and Biomedical Applications; IntechOpen Limited: London, UK, 2011. [Google Scholar]
- Feng, S.; Zhou, H.; Dong, H. Using deep neural network with small dataset to predict material defects. Mater. Des. 2019, 162, 300–310. [Google Scholar] [CrossRef]
- Le, T.-T.; Guilleminot, J.; Soize, C. Stochastic continuum modeling of random interphases from atomistic simulations. Application to a polymer nanocomposite. Comput. Methods Appl. Mech. Eng. 2016, 303, 430–449. [Google Scholar] [CrossRef]
- Krzanowski, W.J. Principles of Multivariate Analysis: A User’s Perspective, Revised, Subsequent ed.; Oxford University Press: New York, NY, USA, 2000; ISBN 978-0-19-850708-6. [Google Scholar]
- Ly, H.-B.; Desceliers, C.; Le, L.M.; Le, T.-T.; Pham, B.T.; Nguyen-Ngoc, L.; Doan, V.T.; Le, M. Quantification of Uncertainties on the Critical Buckling Load of Columns under Axial Compression with Uncertain Random Materials. Materials 2019, 12, 1828. [Google Scholar] [CrossRef]
- Noori, R.; Sabahi, M.; Karbassi, A.; Baghvand, A.; Zadeh, H.T.; Karbassi, A. Multivariate statistical analysis of surface water quality based on correlations and variations in the data set. Desalination 2010, 260, 129–136. [Google Scholar] [CrossRef]
- Pham, B.T.; Jaafari, A.; Prakash, I.; Bui, D.T. A novel hybrid intelligent model of support vector machines and the MultiBoost ensemble for landslide susceptibility modeling. Bull. Eng. Geol. Environ. 2019, 78, 2865–2886. [Google Scholar] [CrossRef]
- Ding, X.; Li, C.; Xu, Y.; Li, F.; Zhao, S. Dataset of long-term compressive strength of concrete with manufactured sand. Data Brief. 2016, 6, 959–964. [Google Scholar] [CrossRef]
- Zhao, S.; Ding, X.; Zhao, M.; Li, C.; Pei, S. Experimental study on tensile strength development of concrete with manufactured sand. Constr. Build. Mater. 2017, 138, 247–253. [Google Scholar] [CrossRef]
- Zhao, S.; Hu, F.; Ding, X.; Zhao, M.; Li, C.; Pei, S. Dataset of tensile strength development of concrete with manufactured sand. Data Brief. 2017, 11, 469–472. [Google Scholar] [CrossRef]
- Cavaleri, L.; Chatzarakis, G.E.; Trapani, F.D.; Douvika, M.G.; Roinos, K.; Vaxevanidis, N.M.; Asteris, P.G. Modeling of surface roughness in electro-discharge machining using artificial neural networks. Adv. Mater. Res. 2017, 6, 169. [Google Scholar]
- Chen, H.; Asteris, P.G.; Armaghani, D.J.; Gordan, B.; Pham, B.T. Assessing Dynamic Conditions of the Retaining Wall: Developing Two Hybrid Intelligent Models. Appl. Sci. 2019, 9, 1042. [Google Scholar] [CrossRef]
- Psyllaki, P.; Stamatiou, K.; Iliadis, I.; Mourlas, A.; Asteris, P.; Vaxevanidis, N. Surface treatment of tool steels against galling failure. MATEC Web Conf. 2018, 188, 04024. [Google Scholar] [CrossRef]
- Asteris, P.G.; Plevris, V. Anisotropic masonry failure criterion using artificial neural networks. Neural Comput. Applic. 2017, 28, 2207–2229. [Google Scholar] [CrossRef]
- Khozani, Z.S.; Khosravi, K.; Pham, B.T.; Kløve, B.; Mohtar, W.H.M.W.; Yaseen, Z.M. Determination of compound channel apparent shear stress: Application of novel data mining models. J. Hydroinform. 2019. [Google Scholar] [CrossRef]
- Pham, B.T.; Nguyen, M.D.; Bui, K.-T.T.; Prakash, I.; Chapi, K.; Bui, D.T. A novel artificial intelligence approach based on Multi-layer Perceptron Neural Network and Biogeography-based Optimization for predicting coefficient of consolidation of soil. Catena 2019, 173, 302–311. [Google Scholar] [CrossRef]
- Zhou, J.; Nekouie, A.; Arslan, C.A.; Pham, B.T.; Hasanipanah, M. Novel approach for forecasting the blast-induced AOp using a hybrid fuzzy system and firefly algorithm. Eng. Comput. 2019, 1–10. [Google Scholar] [CrossRef]
- Nguyen, M.D.; Pham, B.T.; Tuyen, T.T.; Hai Yen, H.P.; Prakash, I.; Vu, T.T.; Chapi, K.; Shirzadi, A.; Shahabi, H.; Dou, J.; et al. Development of an Artificial Intelligence Approach for Prediction of Consolidation Coefficient of Soft Soil: A Sensitivity Analysis. Open Constr. Build. Technol. J. 2019, 13. [Google Scholar]
- Ly, H.-B.; Monteiro, E.; Le, T.-T.; Le, V.M.; Dal, M.; Regnier, G.; Pham, B.T. Prediction and Sensitivity Analysis of Bubble Dissolution Time in 3D Selective Laser Sintering Using Ensemble Decision Trees. Materials 2019, 12, 1544. [Google Scholar] [CrossRef]


| Parameter | Compressive Strength of Cement | Tensile Strength of Cement | Curing Age | Dmax of Crushed Stone | Stone Powder Content in Sand | Fineness Modulus of Sand |
| Unit | MPa | MPa | Days | mm | % | [-] |
| Notation | I1 | I2 | I3 | I4 | I5 | I6 |
| Min | 35.50 | 6.90 | 3.00 | 16.00 | 0.00 | 2.20 |
| Average | 47.95 | 8.25 | 80.93 | 28.31 | 7.54 | 3.06 |
| Median | 46.80 | 8.00 | 28.00 | 31.50 | 6.60 | 3.15 |
| Max | 63.40 | 10.20 | 388.00 | 31.50 | 20.00 | 3.50 |
| Std | 4.29 | 0.60 | 102.36 | 3.68 | 4.48 | 0.27 |
| CV (%) | 8.95 | 7.29 | 126.48 | 12.99 | 59.42 | 8.98 |
| Parameter | Water to Binder Ratio | Water to Cement Ratio | Water | Sand Ratio | Slump | Cubic Compressive Strength of Concrete * |
| Unit | [-] | [-] | kg/m3 | % | mm | MPa |
| Notation | I7 | I8 | I9 | I10 | I11 | Y |
| Min | 0.25 | 0.31 | 120.00 | 28.00 | 11.00 | 19.00 |
| Average | 0.43 | 0.46 | 175.49 | 37.23 | 98.34 | 55.80 |
| Median | 0.45 | 0.45 | 180.00 | 36.00 | 70.00 | 56.45 |
| Max | 0.69 | 0.69 | 291.00 | 44.00 | 260.00 | 96.30 |
| Std | 0.09 | 0.07 | 15.16 | 4.00 | 66.64 | 16.70 |
| CV (%) | 20.81 | 14.42 | 8.64 | 10.74 | 67.77 | 29.93 |
| Input | PC1 | PC2 | PC3 | PC4 | PC5 | PC6 | PC7 | PC8 | PC9 | PC10 | PC11 |
|---|---|---|---|---|---|---|---|---|---|---|---|
| I1 | 14.02 | 5.43 | 17.64 | 0.92 | 12.21 | 0.24 | 0.18 | 2.43 | 2.92 | 8.73 | 35.28 |
| I2 | 11.81 | 4.96 | 26.94 | 0.00 | 5.63 | 1.38 | 0.00 | 0.05 | 2.70 | 12.69 | 33.85 |
| I3 | 3.57 | 1.07 | 3.60 | 40.88 | 36.66 | 0.86 | 0.34 | 10.97 | 1.84 | 0.21 | 0.00 |
| I4 | 18.43 | 1.64 | 0.81 | 1.73 | 5.55 | 2.68 | 1.27 | 61.74 | 2.57 | 0.05 | 3.53 |
| I5 | 10.04 | 0.58 | 3.31 | 10.17 | 2.96 | 57.17 | 6.72 | 0.42 | 5.69 | 2.93 | 0.00 |
| I6 | 0.09 | 1.55 | 10.78 | 42.35 | 33.39 | 3.42 | 4.56 | 0.22 | 2.40 | 1.05 | 0.19 |
| I7 | 18.97 | 10.34 | 4.49 | 0.01 | 1.73 | 0.16 | 0.93 | 0.18 | 11.30 | 31.64 | 20.26 |
| I8 | 6.48 | 31.74 | 0.04 | 0.06 | 0.35 | 0.91 | 1.91 | 0.07 | 15.77 | 37.60 | 5.07 |
| I9 | 9.87 | 1.82 | 15.68 | 0.04 | 0.51 | 0.17 | 57.86 | 12.10 | 0.08 | 1.80 | 0.06 |
| I10 | 1.70 | 34.07 | 2.63 | 0.85 | 0.02 | 0.96 | 0.28 | 2.83 | 51.88 | 3.23 | 1.54 |
| I11 | 5.03 | 6.79 | 14.08 | 3.00 | 0.99 | 32.05 | 25.95 | 9.00 | 2.84 | 0.07 | 0.21 |
| EV | 29.71 | 19.71 | 14.32 | 9.80 | 7.57 | 6.60 | 5.25 | 3.69 | 2.30 | 0.90 | 0.16 |
| CS | 29.71 | 49.42 | 63.73 | 73.54 | 81.10 | 87.70 | 92.95 | 96.64 | 98.94 | 99.84 | 100.00 |
| Criteria | Training Dataset | Testing Dataset |
|---|---|---|
| R | 0.92 | 0.96 |
| RMSE | 6.62 | 4.93 |
| MAE | 4.77 | 4.09 |
| Error mean | −0.08 | 0.26 |
| Error Std | 6.64 | 4.95 |
| Slope | 0.86 | 0.94 |
| Model | Data Used | Designation | R | RMSE | MAE | Error Std | Slope |
|---|---|---|---|---|---|---|---|
| Individual ANFIS | raw | ANFIS/R | 0.86 | 8.58 | 6.24 | 8.63 | 0.78 |
| Individual ANFIS | pre-processed | ANFIS/P | 0.93 | 6.46 | 5.28 | 6.49 | 0.89 |
| Individual ANN | pre-processed | ANN/P | 0.90 | 7.67 | 5.06 | 7.67 | 0.77 |
| ANFIS+TLBO | raw | ANFIS-TLBO/R | 0.88 | 7.65 | 5.02 | 7.59 | 0.76 |
| ANFIS+TLBO | pre-processed | ANFIS-TLBO/P | 0.96 | 4.93 | 4.09 | 4.95 | 0.94 |
| PCs | PC1 | PC2 | PC3 | PC4 | PC5 | PC6 | PC7 | PC8 | PC9 | PC10 | PC11 |
| Sensitivity index (%) | 12.48 | 17.04 | 10.53 | 17.41 | 15.16 | 1.80 | 0.72 | 11.68 | 4.37 | 3.85 | 4.95 |
| Inputs | I1 | I2 | I3 | I4 | I5 | I6 | I7 | I8 | I9 | I10 | I11 |
| Sensitivity index (%) | 9.04 | 8.32 | 15.07 | 11.36 | 5.41 | 14.12 | 7.61 | 8.71 | 5.19 | 9.27 | 5.89 |
| Curing Age | Model | R | RMSE | MAE | Error Std | Slope |
|---|---|---|---|---|---|---|
| 7 days | Ding et al. [14] (Equation (6) in [14] *) | 0.61 | 14.42 | 10.25 | 10.41 | 1.77 |
| Our model | 0.90 | 7.43 | 5.22 | 6.06 | 0.99 | |
| Δ (%) | +29.00 | +48.49 | +49.03 | +41.78 | +76.00 | |
| 28 days | Ding et al. [14] (Equation (5)) | 0.92 | 5.31 | 4.44 | 5.32 | 0.94 |
| Our model | 0.95 | 5.20 | 4.08 | 5.18 | 0.87 | |
| Δ (%) | +3.00 | +2.07 | +8.11 | +2.63 | −7.00 | |
| 56 days | Ding et al. [14] (Equation (6) in [14] *) | 0.91 | 6.36 | 3.90 | 5.38 | 0.68 |
| Our model | 0.87 | 5.94 | 5.43 | 4.46 | 0.83 | |
| Δ (%) | −4.00 | +6.53 | −39.23 | +17.01 | +15.00 | |
| 3–388 days | Ding et al. [14] (Equation (6) in [14] *) | 0.77 | 12.82 | 9.96 | 12.54 | 0.66 |
| Our model | 0.93 | 6.16 | 4.57 | 6.17 | 0.88 | |
| Δ (%) | +16.00 | +51.92 | +54.11 | +50.76 | +22.00 |
© 2019 by the authors. Licensee MDPI, Basel, Switzerland. This article is an open access article distributed under the terms and conditions of the Creative Commons Attribution (CC BY) license (http://creativecommons.org/licenses/by/4.0/).
Share and Cite
Ly, H.-B.; Pham, B.T.; Dao, D.V.; Le, V.M.; Le, L.M.; Le, T.-T. Improvement of ANFIS Model for Prediction of Compressive Strength of Manufactured Sand Concrete. Appl. Sci. 2019, 9, 3841. https://doi.org/10.3390/app9183841
Ly H-B, Pham BT, Dao DV, Le VM, Le LM, Le T-T. Improvement of ANFIS Model for Prediction of Compressive Strength of Manufactured Sand Concrete. Applied Sciences. 2019; 9(18):3841. https://doi.org/10.3390/app9183841
Chicago/Turabian StyleLy, Hai-Bang, Binh Thai Pham, Dong Van Dao, Vuong Minh Le, Lu Minh Le, and Tien-Thinh Le. 2019. "Improvement of ANFIS Model for Prediction of Compressive Strength of Manufactured Sand Concrete" Applied Sciences 9, no. 18: 3841. https://doi.org/10.3390/app9183841
APA StyleLy, H.-B., Pham, B. T., Dao, D. V., Le, V. M., Le, L. M., & Le, T.-T. (2019). Improvement of ANFIS Model for Prediction of Compressive Strength of Manufactured Sand Concrete. Applied Sciences, 9(18), 3841. https://doi.org/10.3390/app9183841