Abstract
A novel in situ stress monitoring method, based on rheological stress recovery (RSR) theory, was proposed to monitor the stress of rock mass in deep underground engineering. The RSR theory indicates that the tiny hole in the rock can close gradually after it was drilled due to the rheology characteristic, during which process the stress that existed in the rock can be monitored in real-time. Then, a three-dimensional stress monitoring sensor, based on the vibrating wire technique, was developed for in field measurement. Furthermore, the in-field monitoring procedures for the proposed technique are introduced, including hole drilling, sensor installation, grouting, and data acquisition. Finally, two in situ tests were carried out on deep roadways at the Pingdingshan (PDS) No. 1 and No. 11 coal mines to verify the feasibility and reliability of the proposed technique. The relationship between the recovery stress and the time for the six sensor faces are discussed and the final stable values are calculated. The in situ stress components of rock masses under geodetic coordinates were calculated via the coordinate transformation equation and the results are consistent with the in situ stress data by different methods, which verified the effectiveness of the proposed method.
1. Introduction
Recently, more and more underground engineering with characteristics of long and deep burial will be built in deep, soft surrounding rock areas [1,2,3,4,5,6]. In situ stress measurement in these areas is essential to determine the mechanical properties of fractured rock masses, analyze the stability of underground structures (e.g., tunnels, caverns, shafts, and other openings), and design the rock support system [7,8,9]. At present, two in situ stress monitoring methods, namely hydraulic fracturing and overcoring [10,11], are widely used in many fields and have obtained acceptable results. These two methods are generally suitable for hard and intact rock as they are assumed that the rock masses have the characteristics of being homogeneous, continuous, isotropic, and linearly elastic. However, most of surrounding rock masses in underground engineering, especially in deep coal mines, are usually soft, fractured, and show a significant time-dependent behavior [12,13,14]. In consequence, these two commonly used methods are hardly applied not only in terms of the theoretical assumption but in implementing the measurements.
In order to undertake in situ stress measurements in deep soft rock masses, Zhang et al. [15] proposed a new stress monitoring theory named the rheological stress recovery method, in which it is suggested that compressive stress transducers are embedded in holes drilled into the surrounding rock and grouted into place. Due to the strong rheological characteristics of soft fractured rock mass, the measured stresses of the transducers will increase gradually and eventually reach a stable value. The initial stress of the rock mass before drilling can be determined by analyzing the measured stress. This method can also be used to obtain the long-term disturbed stress field of the surrounding rock if more than one measuring point is set in the drilling holes.
A three-dimensional vibrating wire compressive stress transducer was developed, as described in the RSR method statement [15]. The sensor was approximately cubic, including three orthogonal sensor faces, and the measuring range was 0–35 MPa. The measuring performance of the transducer was investigated using physical model tests on cement mortar samples and the results confirmed the linear relationship between the loading stress and the measured stress of transducer [16,17]. The affecting factors, including rheological properties of the rock mass, the elastic mechanical properties of the cement mortar body, and the grouting time, etc., on the measured stress of the transducers when they are buried into the rheological rock masses were investigated using theoretical analysis and numerical simulation [18].
In this paper, the in situ stress monitoring method was extended to the field. The measuring instrument and corresponding functions are first introduced. The measuring procedures, including preparations, field measurements, and data analysis, are presented in detail. The initial applications of the RSR method were carried out in soft rock masses at deep levels within the coal mine and the measuring data were collected and used to determine the in situ stresses. Finally, the results obtained from the proposed method and that from the traditional methods are compared.
2. RSR Measuring Technique
2.1. RSR Method Introduction
According to continuum mechanics, there are six individual components for the stress state at a point, including three normal stress components (σx, σy, σz) and three shearing components (τxy, τzy, τxz). In rectangular coordinates, the normal stress in any arbitrary plane can be expressed by the following equation:
where σn is the normal stress component in an arbitrary plane; and l, m, n represent the direction cosine between plane normal and x, y, z axes, respectively. Considering that only normal stress components can be obtained from the sensors, six normal stress components in different directions are required to determine the stress state at a point, which can be expressed as follows:
where σni (i = 1, 2, …, 6) is the normal stress obtained from the transducers and li, mi, ni represent the directions cosine between sensor element and x, y, z axes, respectively.
2.2. Monitoring Sensor Design
Based on the RSR method, a monitoring transducer was designed. As shown in Figure 1, the external structure of the transducer is approximate cube with a side length of 80 mm, and it contains three orthogonal sensor faces. The transducer uses a vibrating wire as the sensor element, which has a measuring range from 0 to 35 MPa. Since only three normal stress components can be obtained for each transducer, two transducers should be buried together as a group for each measuring point during the monitoring process. As shown in Figure 2, the two transducers are placed in advance into the grouting materials to form a sensing column for convenience. According to the research of Zhu et al. [16] the directions of the six sensor faces should be recorded and the space of the two transducers should be more than 1.2 times the side length in order to avoid interactions during grouting.
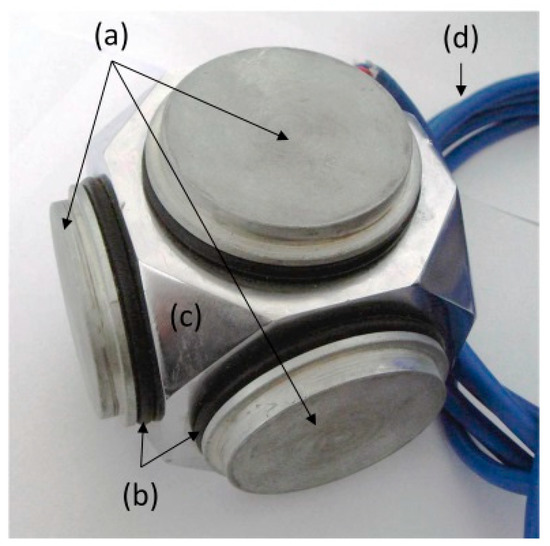
Figure 1.
External view of 3D comprehensive stress transducer ((a). sensor faces; (b). sealing washer; (c). supporting body; (d). cable).
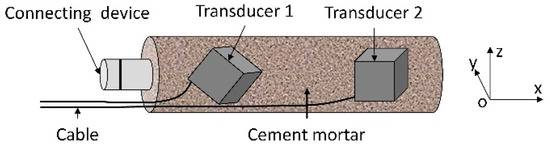
Figure 2.
Schematic diagram of the grouted sensing column showing the placing of the two transducers.
Further, the measuring instruments for the 3D compressive stress sensors, including installing equipment and data acquisition instrumentation, were also developed. The installing equipment is used to push the sensing column and record the burying depth and rotation angle during the installation procedure. As shown in Figure 3, the equipment consists a pushing rod, a three-dimensional roller and a goniometer. The pushing rod includes two alternative lengths (1 m and 1.5 m) of hollow bar made of stainless steel or aluminum alloy. The pushing rod also can be used as the grouting pipe when necessary. The three-dimensional roller is 130 mm in diameter and it is installed in front and between the pushing rods. The goniometer is connected to the transducer column via the front-end rabbet and the instrument displays the angle with the vertical direction during pushing of the sensing column. The function of the data acquisition instrument is to display and store digital signals that are converted from the analog transducer data. Note that electronic productions are not safe in some underground engineering because the existence of gas, especially in a deep coal mine. Therefore, an explosion-proof data acquisition instrument was developed to satisfy the application requirements for using in coal mines (as shown in Figure 4). The explosion-proof data acquisition instrument has a Chinese National explosion-proof certificate and can output many kinds of digital signal, such as temperature, voltage, current, resistance, bridge, and strain, etc.
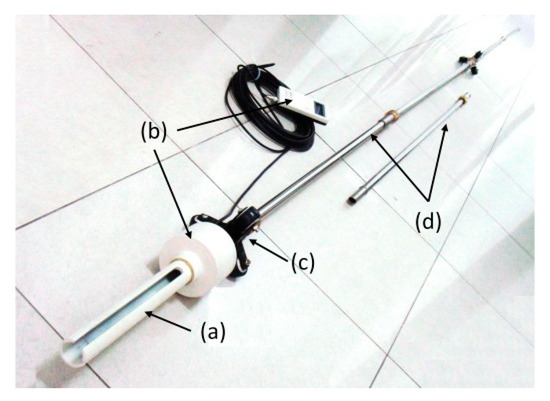
Figure 3.
Sensor installation equipment ((a). Slot; (b). goniometer; (c). roller; (d). pushrod).
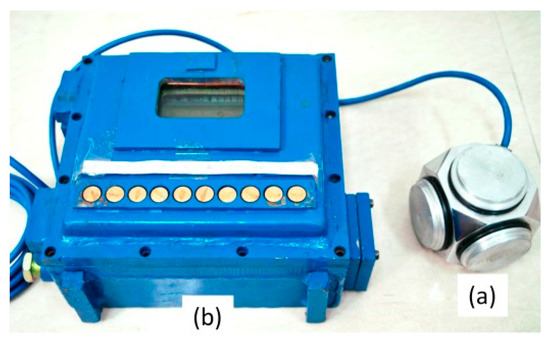
Figure 4.
Explosion-proof data acquisition instrument ((a). 3D comprehensive stress transducer; (b). data acquisition instrument).
2.3. In Situ Implementation Method
The implementation procedures of the RSR method for in situ stress measurement include the following three parts:
(1) Preparation. This step, including measurement location selection, measurement device checking and the sensing column grouting. As the RSR method is applied in the rock masses showing time-dependent behavior, the burial depth and rock mass quality of the measurement locations should be considered firstly. According to research on the concept of deep underground engineering and rock mass classification [19], it can be suggested that, in general, for the RSR method, the burial depth should exceed 600 m and the rock mass class should be in the range from the third grade to the fifth grade. The device checking should ensure that all of the instrumentation is in good order and satisfies the measuring requirements. The grouting material for the sensing column are the same as that used for borehole grouting. During grouting, the angles between the six sensor faces with the axes and the initial frequencies should be recorded.
(2) Field measurements. The method can be conducted in the field after the preparations have been completed and the steps described in detail below have been implemented:
- Hole drilling. Sensors holes in the surrounding rock, usually are drilled from underground roadways, tunnels, chamber, etc., until the set depth is reached (Figure 5a). To facilitate sensing column installation and grout flow, the drilled hole is downward and has an appropriate inclination angle of 1–3°. Additionally, the sufficient space of holes should be retained to accommodate the sensing column. The appropriate diameter of the drilled hole is 130 mm per diameter of the sensing column and commonly-used drills. After drilling, the hole should be flushed quickly with water to remove residual debris. However, it is worth noting that the duration time of flushing should not be too long to prevent rock falling due the water-softening effect.
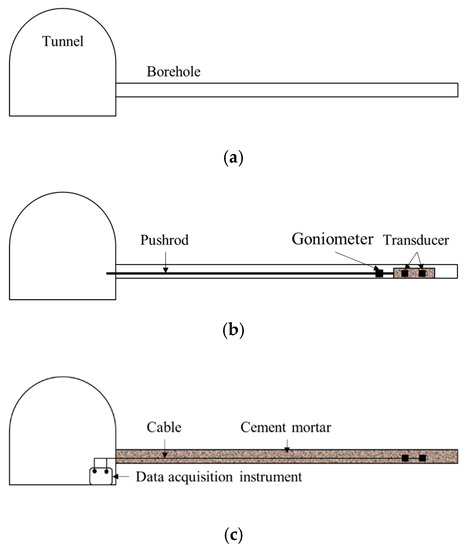 Figure 5. Testing procedures of the RSR method. (a) Hole drilling; (b) transducer installation; (c) hole grouting and data recording.
 - Transducer installation. The connecting device pre-grouted with the sensing column is connected to the goniometer slot and the initial angle displayed by the goniometer is recorded when the y-axis is horizontal (Figure 2). Using the push rod and rollers, the sensing column is inserted incrementally into the preset measurement location and the final displayed angle is recorded (Figure 5b). After this, the push rods, rollers, and goniometer will be withdrawn. The above steps are repeated when more than one test point is required. As the attachment between the connection device and slot is free-sliding in axial direction of the drilled hole, the pushing rods cannot be arbitrary pulled out to prevent the separation of connection before the sensing column is in place. If it has to be in special case, it should be conducted slowly using the cables of the goniometer and sensing column to keep the consistency of the rotation angle during the installation.
- Hole grouting. The grouting pipe is pulled to the place nearby the sensing column, sealing the hole, leaving open the injection and vent holes. The drilled hole is filled with pumped grout and slurry materials, so that the rock mass will be in close contact with the sensing column (Figure 5c). Jiang et al. [20] investigated the relationship between grouting time and recovery stress and found that the longer solidification time of slurry materials, the smaller the recovery stress of the sensing column will eventually be. In order to ensure complete filling with the grouting slurry, the bore of the hole should be sealed to prevent leakage and the grouting pressure is appropriately controlled at 0.2–0.5 MPa. After grouting, some of the on-site slurry is processed to provide standard test specimens and the mechanical parameters during different periods are tested.
- Data collection. The frequency of the sensor faces and corresponding measurement times should be collected at least once a day at the first 15 days after grouting. Subsequent measuring frequency can be decreased gradually according to the recorded data until no obvious change is observed. During the record period, blasting activities in the vicinity, excavations, and abnormal cases that may affect the output accuracy of the measurements can be recorded.
(3) Data analysis. There are three steps to calculate the original stress state of rock. Firstly, screening the measured data with any recorded abnormal incidents to ensure the accuracy of the data used for the stress analysis. According to the relationship between frequency and compressive stress, which is derived from calibration tests on cement mortar test specimens, the variations of compressive stress with measuring time can be plotted for the six sensor faces. Secondly, the stress recovery rate can be calculated by combining with the rheological properties of rock masses and the final stresses for each sensor face. Finally, the stress state for the measuring point in the geodetic coordinates can be calculated with coordinate transformation. The detailed analysis process will be presented below.
3. Validation of the Proposed Method
3.1. Regional Engineering Geology of Test Points
The proposed RSR method were verified by conducting the in field tests in the deep roadway of the PDS No. 1 and No. 11 coal mines. The PDS coalfield, which is one of the three largest coal production areas in China, is located in the north of Pingdingshan City, Henan Province. As shown in Figure 6, the PDS coalfield has a length of 38 km and width of 20 km, approximately. The general geological structure is a series of folds in NW direction with limb angles in the range of 8–12°. Faults in this area can be divided into two types: parallel to the direction of the fold axis, which mainly included the Guodishan normal fault and the Baishigou reverse fault, and the other type is perpendicular to the direction of fold axis, which mainly includes the Luogang and Xiaxian normal faults. The Guodishan normal fault, located to the southeast of the No. 11 coal mine and the nearby Guodishan Mountain, has great influence on the in situ stress distribution of the PDS coalfield.
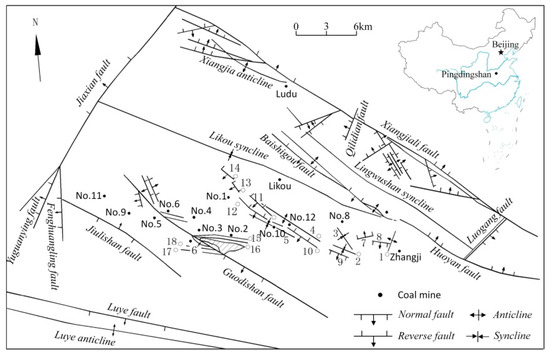
Figure 6.
Regional geological structure and mining distributions of the PDS coalfield (1. Qiannie anticline; 2. Renzhuang syncline; 3. Jiaozan syncline; 4. Guozhuang anticline; 5. Niuzhuang syncline; 6. Haotang; 7. Zhangwan fault; 8. Xindian fault; 9. Renzhuang fault; 10. No. 12 coal mine fault; 11. No. 11 coal mine fault; 12. Niuzhuang fault; 13. Zhuyuan fault; 14. Zhangjia fault; 15. G hole fault; 16. Inclined shaft fault; 17. Haotang No. 1 fault; 18. Zhangjiazhuang fault.).
The test location of the PDS No. 1 coal mine was located in the inclined roadway of the third level with the burying depth of 877 m, approximately (Figure 7). The excavated geology and borehole data show the Zhangjia fault, which strikes in the NW direction is located to the southwest of the mining area. The test location of the PDS No. 11 coal mine was located in the inclined return airway of the second level with the burying depth of 780 m (Figure 8). In order to investigate the basic mechanical properties of surrounding rock in the test sites, the rock specimens were collected and uniaxial compression tests were carried out. The test results are listed in Table 1.
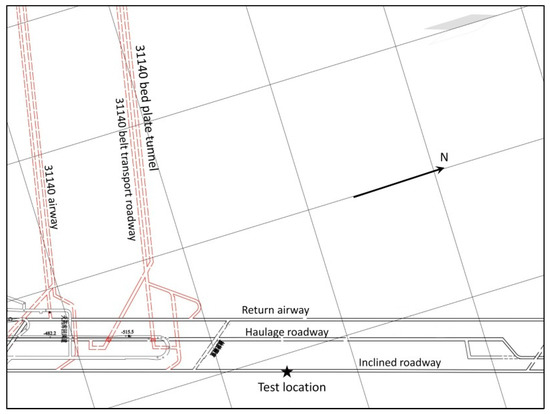
Figure 7.
Roadways distribution of test location in PDS No. 1 coal mine.
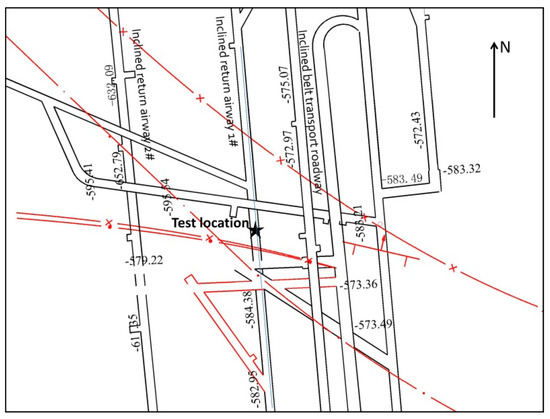
Figure 8.
Roadways distribution of test location in PDS No. 11 coal mine.

Table 1.
Average value of rock parameters obtained from uniaxial compression tests.
3.2. In Field Measuring Process
As shown in Figure 9, two transducers were grouted in cement mortar using the developed steel mold to produce a sensing column before the test. During the process, a release agent was first brushed onto the mold surface. Two transducers were placed in the mold with different orientations and the connection devices were fixed in the side hole of the mold. The cap of the mold then was closed tightly with bolts and the cement mortar was injected into the mold. The sensing column was demolded after 24 h and maintained for 28 days in wet steam. Since the mechanical properties of cement mortar should be consistent with those of the rock mass, the grade of cement mortar was chosen as M20 or M10, based on the mechanical parameters of the rock shown in Table 1. The detail ratios of cement mortar and the parameters of the grouted specimens obtained from the uniaxial compression test are presented in Table 2.
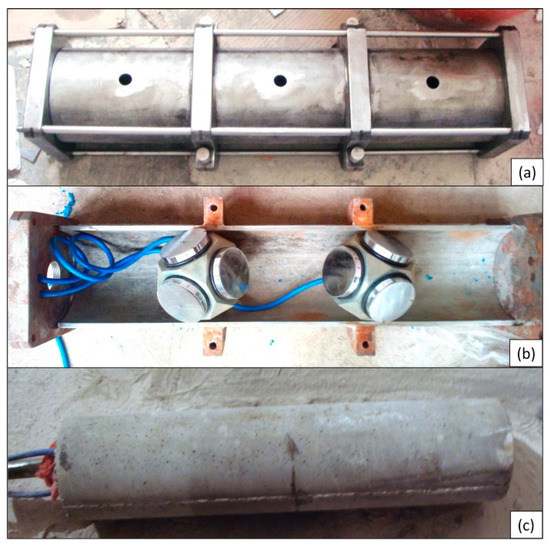
Figure 9.
Production process for the column transducers: (a) Steel mold; (b) placing the 3D comprehensive pressure transducers; (c) column transducer.
Table 2.
Average value of cement mortar obtained from uniaxial compression tests.
The test hole, with a diameter of 130 mm and dip angle of 2°, were drilled in side walls of different roadways in PDS No. 1 and No. 11 coal mines. The spans of the test roadways in the No. 1 and No. 11 coal mines were 4.5 m and 4.8 m, respectively. As a result, the depths of drilled holes were 23 m and 25 m, which are five times of the spans in each roadway. After drilling, the sensing column was pushed to the bottom of the test hole using the installing equipment. The actual buried depths of the sensing columns were 22.5 m and 24 m as debris accumulates at the bottom of the drilled holes. After the grouting pipe was pushed near to the sensing column, the test hole was sealed and grouted with the cement mortar and the grouting pressure was 0.3 MPa. The detailed testing process is presented in Figure 10.
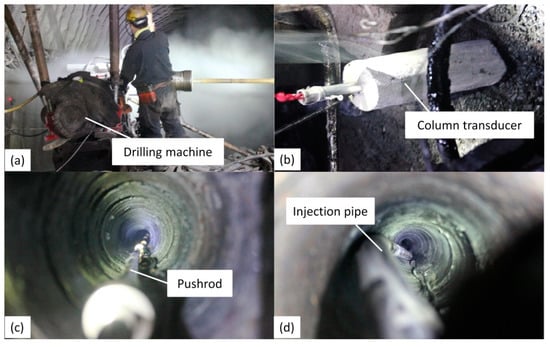
Figure 10.
Test process for the RSR method in the PDS No. 1 coal mine: (a) Drilling the hole; (b) installing the column transducer; (c) connecting the pushrods; (d) injection pipe for grouting with the cement mortar.
3.3. Test Results
According to theory of designing the transducer, the relationship between the compressive stress applied on the sensor face and the output frequency can be expressed as follows:
where P is the compressive stress, f is the output frequency and f0 is the initial frequency. The coefficient K is related to the properties of transducer and usually determined via calibrating test. It should be noted that the calibrating coefficient K generally is obtained in the condition that the compressive stress P is applied directly on the sensor face. When the transducers are buried into the rock and used to measure the rock stress, the calibrating coefficient K cannot be used directly because the compressive stress acting on the sensor face is very complicated and is not equal to the initial rock stress. As shown in Figure 11, to simulate the measuring performance of a transducer embedded in a rock mass, cement mortar body model tests are carried out in a true-triaxial loading system (Manufactured by the Institute of Rock and Soil Mechanics, Chinese Academy of Science, China). The relationship between the exterior loading stress and the output frequencies can be expressed as:
where Pc is the exterior loading acting on the sample face, LF is the loading factor and defined as the ratio of the measured compressive stress to the exterior loading.
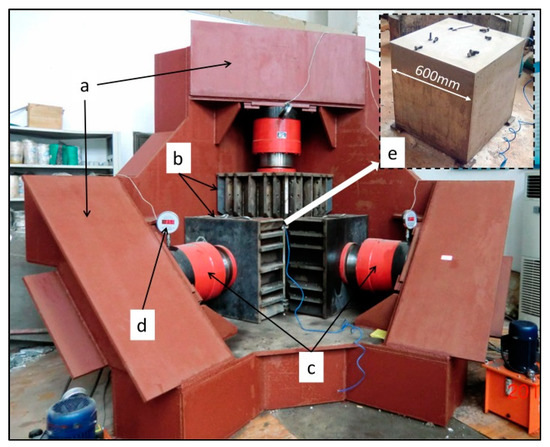
Figure 11.
Model tests on a cement mortar body. ((a). steel support frame; (b). steel dowels; (c). hydraulic jack; (d). pressure gauge; (e). cement mortar body with a transducer embedded in the middle).
To obtain the LF, tests have been conducted on four cement mortar samples with elastic modulus varying from 0.86 GPa to 6.48 GPa. The test results show that the value of LF decreases as the elastic modulus increases. Figure 12 shows the test results, and it can be found that the value of LF decreases as the elastic modulus increases. Figure 13 shows the linear fitting relationship between LF and the elastic modulus of the cement mortar. According to the elastic modulus listed in Table 2, the values of LF in PDS No. 1 and No. 11 coal mines are 0.591 and 0.777, respectively.
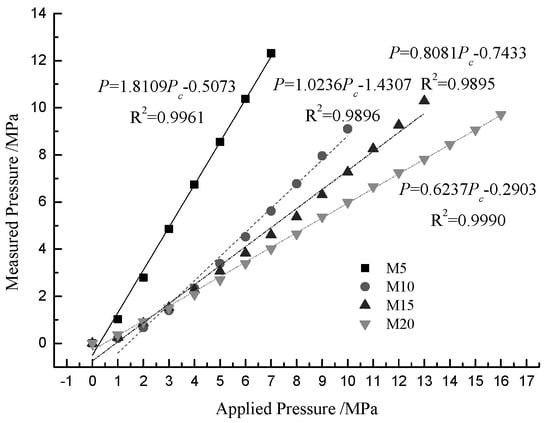
Figure 12.
Results of calibration tests.
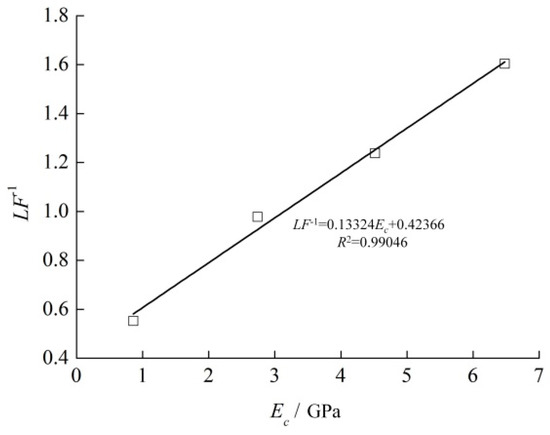
Figure 13.
Relationship between elastic modulus and loading factor.
The information of transducers embedded in the PDS No. 1 coal mine is presented in Table 3., where the Azimuthal angle and dip angle are based on geodetic coordinates (x axis: north, y axis: west, z axis: vertical). Figure 14 shows the frequency evolution process of the six sensor elements with time during the measurement in PDS No. 1 coal mine. As shown in Figure 14, the testing time lasted 181 days.
Table 3.
Information for transducers embedded in PDS No. 1 coal mine.
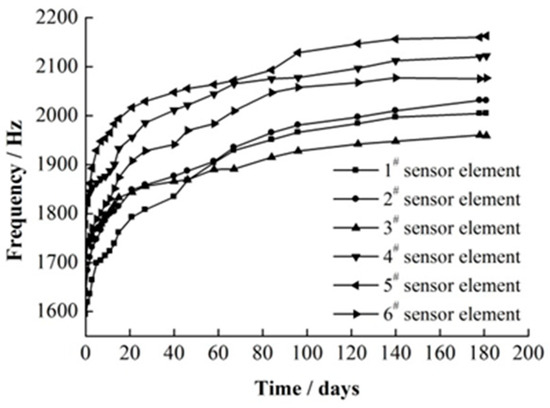
Figure 14.
Frequency change with time of buried transducers in PDS No. 1 coal mine.
According to Equation (4), the variation in the compressive stress output from the transducer with test time can be obtained (see Figure 15). From Figure 15, it can be observed that the measured stresses increase rapidly during the first few days and gradually become stable when the time of the test exceeded 140 days. The characteristics of stress curves show are similar to classic creep curves for rock masses where the transient creep stage and steady-state creep stage are contained. It was also found that the time for the stress become stable was much longer than the relaxation time obtained from the creep test, which generally is in hundreds of hours. This indicated that the rheological process of the rock mass is much slower than that of the rock specimens.
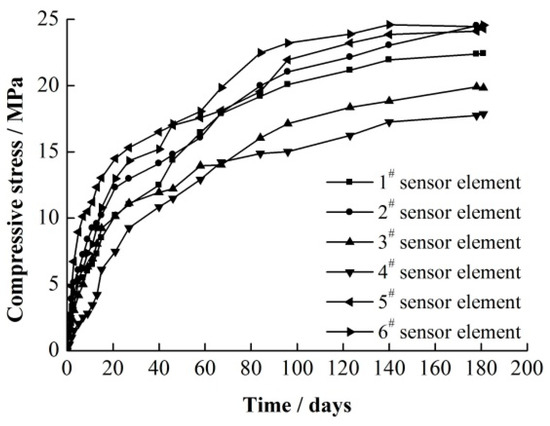
Figure 15.
Comprehensive stress recovery curves for PDS No. 1 coal mine.
Numerical simulations for transducers embedded in rock masses show recovery rate, which is defined as the ratio of the stress by a transducer to the initial stress of the rock mass before drilling, depends on the rheological properties of the rock mass [18]. For the Burgers model, which usually is used to describe significant rheological behavior of highly jointed rock masses and/or rock masses subject to high stress, the recovery rates are 100% and are independent of the rheological parameters. The Boltzmann model commonly is employed to describe the limited viscosity of rock masses with good mechanical properties or that are subject to low stresses. For this type of behavior, the recovery rate is in the range from 40% to 70% and is highly related to the rheological parameters of the rock mass. Therefore, the rheological properties should be considered when measuring the in situ stress of rock mass. According to previous studies on rock rheology in deep coal mines [21,22,23,24], the Burgers model and its improved viscoelastic model mostly are used to describe the rheological properties of rock masses. Considering the rock type and basic mechanical parameters shown in Table 1, the rheological behavior of the tested rock masses both are assumed in this study to satisfy the Burgers viscoelastic model. As a result, the final measured normal stress components shown in Figure 15 are equal to the actual stress components of rock masses.
Based on the six measured normal stresses in different directions, the in situ stress components under geodetic coordinates were solved using Equation (2) and the principal stress components also were calculated. The results are listed in Table 4 and Table 5, respectively. It is evident that the maximum principal stress is approximately horizontal and the intermediate principal stress is close to vertical. The ratio of maximum horizontal principal stress and vertical stress is 1.157, which indicates that tectonic movements play a major role in the in situ stress field.
Table 4.
In situ stress under geodetic coordinates of test points in the PDS No. 1 coal mine.
Table 5.
Principal stress results for the test points in the PDS No. 1 coal mine.
Furthermore, in situ stress measurement using the overcoring technique was carried out close to the location of the RSR method test conducted and a comparison of the principal stresses from different methods is presented in Figure 16. From Figure 16, it can be observed that the principal stresses obtaining from the overcoring method were smaller than those obtained by the RSR method, while the directions are similar to each other.
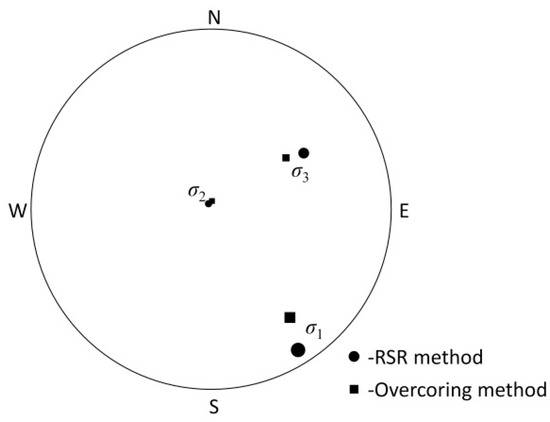
Figure 16.
Comparison of principal stress components from the RSR and overcoring methods in the PDS No. 1 coal mine.
Similarly, the test information for the in situ stress measurements in the PDS No. 11 coal mine is listed in Table 6. It should be mentioned that tests to measure in situ stress by the overcoring method were carried out twice before RSR method, but finally failed due to fracturing and water-softened properties of the rock mass. Figure 17 shows the frequency change of the six sensor faces during the whole test. The measured normal stresses were calculated using Equation (4) and the stress recovery curves are shown in Figure 18. In contrast to the results from the No. 1 coal mine, the time for stress recovery stabilized is shown by the curves to be shorter and the stress recovery rate was faster. The mechanical parameters presented in Table 1 show that the measured rock mass in the No. 11 coal mine was weaker. This indicates that the weakness of the rock mass is beneficial for stress recovery, which agrees well with the numerical simulation results [18]. Table 7 presents the solved in situ stress results and Table 8 summarized the related the principal stresses. It can be observed that the ratio of maximum horizontal principal stress to vertical stress is 1.33. The dip angle of the three principal stresses are not close to horizontal or vertical. According to the description of geological structure of the PDS coal mine area, this indicates the Guodishan fault has a great influence on the in situ stresses of the No. 11 coal mine.
Table 6.
Information from transducers embedded in the PDS No. 11 coal mine.
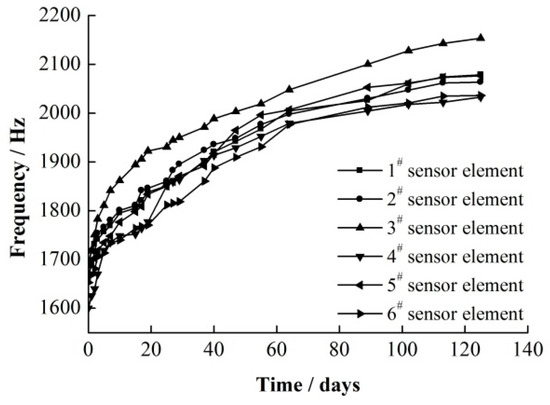
Figure 17.
Frequency change with time of transducers buried in the PDS No. 11 coal mine.
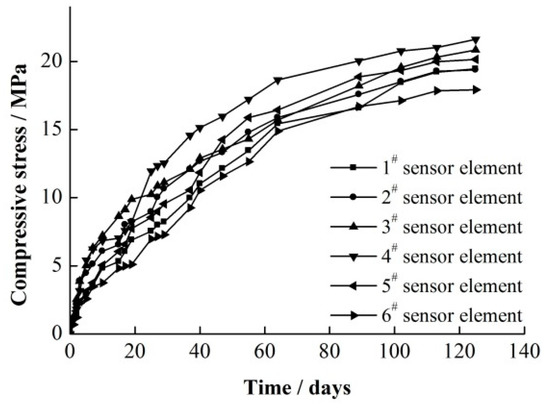
Figure 18.
Comprehensive stress recovery curves for the PDS No. 11 coal mine.
Table 7.
In situ stresses under geodetic coordinates for the test points in the PDS No. 11 coal mine.
Table 8.
Principal stress results for the test points in the PDS No. 11 coal mine.
4. Discussion
In continuum mechanics, stress is defined as the force across a small boundary per unit area of that boundary. As for the concept of small, the true value of in situ stress is not available from practical measurement and, in consequence, the measuring error cannot be calculated. Therefore, it is difficult to estimate from data analysis whether the results obtained from the RSR method are acceptable. During in situ stress measurements in deep fractured rock masses it is always found the test results are very different when alternative methods are employed. However, it cannot be judged that one of the methods is correct and others are not because the accuracy depends mainly on the degree of similarity between the real measuring environment and the measuring assumptions of each specific method. Similarity incorporates two aspects: one is the consistency of the measuring object and measuring assumptions, i.e., whether the method is suitable for the measurement. The other is the consistency of the measuring process and measuring assumptions, i.e., whether significant factors that can affect the result exist during implementation of the test method. It may be the case that the result of a method is correct and reliable only when both of the above two conditions are satisfied.
Based on the two conditions, several factors, including strength of cement mortar, surrounding rock strength, and time interval for installment and grout setting, that may affect the measuring results were discussed.
4.1. Strength of Cement Mortar
The strength of cement mortar on the rates of stress recovery Ri was investigated. The shear modulus ratio Gi, which means the ratio of shear modulus of cement mortar to the surrounding rock, was firstly defined. Then, the rates of stress recovery under six Gi, including 1:10, 1:1, 2:1, 5:1, 10:1, and 20:1 were calculated, respectively. Figure 19 shows the relationship between the stress recovery ratio and shear modulus ratio. From Figure 19, it is clearly that when the Gi is 0.1, the rate of stress recovery is only 0.66. With increasing of value of Gi, the Ri increases gradually and finally remains constant. This result indicates that the strength of cement mortar has little effect on measured stress when the cement mortar shear modulus is larger than that of surrounding rock.
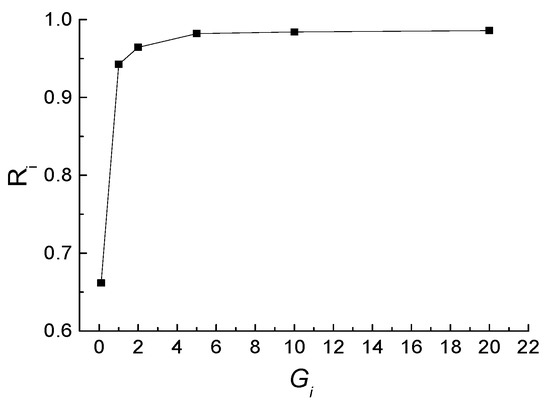
Figure 19.
Relationship between stress recovery ratio and shear modulus ratio.
Additionally, the transducer was buried in the cement mortar and the measured stresses are different with the applied or initial stress because the strength difference between transducer and cement mortar. The loading factor LF, which is defined as the ratio of measured stress to the applied stress, was proposed to describe this difference. According to the linear fitting equation between LF and elastic modulus (Figure 13), the value of LF can be calculated for cement mortar with different strength. The results are consistent with the that obtained by Wang et al. [25] for earth pressure sensors. Wang et al. [25] also indicated that the loading factor LF is the parameter only relates to the intrinsic properties of transducer and cement mortar strength and the value of LF can be ignored and the LF obtained from the tests can be used for in situ measurement.
4.2. Installing Time Interval
The second factor is the time interval after borehole is drilled before the injected cement mortar solidified. Beside the time interval of installment, the setting time of grout also has an effect on the stress measurement. To discuss the relationship between grout setting time and rate of stress recovery, seven different grout setting time t0, including 0 h, 10 h, 20 h, 50 h, 100 h, 200 h, and 500 h, were set. As shown in Figure 20, for different grout setting time t0, the rates of stress recovery increases with the time and finally near to 1.0, which means that recovered stresses (or measured stresses) can nearly reach to the initial stress. Therefore, for the Burgers viscoelastic model, the recovery stress can reach to 100% of the applied regardless of grout setting time. These results indicate that the time interval for grout setting time have effect on measuring time, but little on the measured in situ stress.
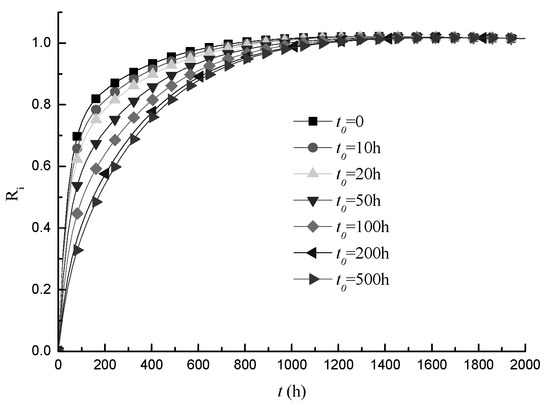
Figure 20.
Relationship between grout setting time and rate of stress recovery.
Jiang et al. [20] investigated the relationship between grouting time and recovery stress and found that the longer solidification time of slurry materials, the smaller the recovery stress of the sensing column will eventually be, so grouting should be carried out immediately after the sensing column has been installed and the use of quick-setting grout materials is appropriate. Therefore, considering that the stress recovery rate is very high during the first few hours, a short time interval for installation will definitely increase the accuracy of the measurement.
5. Conclusions
The rheological stress recovery method was adopted to measure the in situ stresses of rock masses involving time-dependent behavior. Based on the developed measuring instruments, the procedures of the RSR method have been proposed and a monitoring sensor has also been developed. The application of the RSR method in deep coal mines have also been introduced and following conclusions can be drawn.
- (1)
- The procedures of the proposed technique include preparation, field measurements, and data analysis three steps. The in situ stress measurement can be conducted in the field after the preparations have been completed and this step contains hole drilling, sensors installation, grouting and data acquisition, which is the most significant part for the proposed technique.
- (2)
- The proposed technique was validated by in situ tests carried out on deep roadways at the PDS No. 1 and No. 11 coal mines. The in situ stress components of rock masses under geodetic coordinates were calculated via the coordinate transformation equation and compared with the precious in situ stress data collected by overcoring technique. The comparing results show that the principal stresses obtaining from the overcoring method were smaller than that obtained by the RSR method, while the directions are similar with each other.
- (3)
- The influence factors that may affect the measuring results were discussed. The strength of cement mortar has little effect on measured stress when the cement mortar shear modulus is larger than that of surrounding rock, further, the time interval and grout setting time have effect on measuring time, but little on the measured in situ stress.
The RSR method considers rock mass as a rheological material. It is more suitable to reflect the true mechanical properties of deep buried soft rock masses. The rheological properties of a rock mass are assumed to satisfy the Burgers viscoelastic model and the recovery rate was 100% for the measured rock masses, as a result, the in situ stress values obtained during the present study may be larger than the true values.
Author Contributions
B.L. analyzed the calculation results and wrote the article; Y.Z. conducted the experimental tests and the discussion of the results; Q.L. reviewed and edited the paper; X.L. offered useful suggestions for the preparation and writing of the paper.
Funding
The study was supported by the National Natural Science Foundation of China (grant nos. 51874275, 51974289), the Open Research Fund of State Key Laboratory of Coking Coal Exploitation and Comprehensive Utilization (grant no. SKL1802), and Natural Science Foundation of Hubei Province (grant no. 2019CFB535).
Acknowledgments
We also highly appreciate the contribution of data collection from China Pingmei Shenma Group. Finally, the authors would like to thank reviewers for useful comments and editors for improving the manuscript.
Conflicts of Interest
The authors declare no conflict of interest.
References
- Yu, H.T.; Zhang, Z.W.; Chen, J.T.; Bobet, A.; Zhao, M.; Yuan, Y. Analytical solution for longitudinal seismic response of tunnel liners with sharp stiffness transition. Tunn. Undergr. Space Technol. 2018, 77, 103–114. [Google Scholar] [CrossRef]
- Liu, X.; Fang, Q.; Zhang, D.L. Mechanical responses of existing tunnel due to new tunnelling below without clearance. Tunn. Undergr. Space Technol. 2018, 80, 44–52. [Google Scholar] [CrossRef]
- Zhou, H.; Zhang, C.Q.; Li, Z.; Hu, D.W.; Hou, J. Analysis of mechanical behavior of soft rocks and stability control in deep tunnels. J. Rock Mech. Geotechnol. Eng. 2014, 6, 219–226. [Google Scholar] [CrossRef]
- Zhang, H.; Chen, L.; Zhu, Y.M.; Zhou, Z.L.; Chen, S.G. Stress field distribution and deformation law of large deformation tunnel excavation in soft rock mass. Appl. Sci. 2019, 9, 865. [Google Scholar] [CrossRef]
- Zhang, H.; Chen, L.; Chen, S.; Sun, J.; Yang, J. The spatiotemporal distribution law of microseismic events and rockburst characteristics of the deeply buried tunnel group. Energies 2018, 11, 3257. [Google Scholar] [CrossRef]
- Yang, S.Q.; Chen, M.; Jing, H.W.; Chen, K.F.; Meng, B. A case study on large deformation failure mechanism of deep soft rock roadway in Xin’An coal mine, China. Eng. Geol. 2017, 217, 89–101. [Google Scholar] [CrossRef]
- Ljunggren, C.; Chang, Y.; Janson, T.; Christiansson, R. An overview of rock stress measurement methods. Int. J. Rock Mech. Min. Sci. 2003, 40, 975–989. [Google Scholar] [CrossRef]
- Liu, X.; Liu, Q.; Liu, B.; Zhu, Y.; Zhang, P. Failure Behavior for Rocklike Material with Cross Crack under Biaxial Compression. J. Mater. Civ. Eng. 2019, 31, 06018025. [Google Scholar] [CrossRef]
- Liu, X.; Liu, Q.; Wei, L.; Huang, X. Improved strength criterion and numerical manifold method for fracture initiation and propagation. Int. J. Geomech. 2017, 17, E4016007. [Google Scholar] [CrossRef]
- Haimson, B.C.; Cornet, F.H. ISRM suggested methods for rock stress estimation—Part 3: Hydraulic fracturing (HF) and/or hydraulic testing of pre-existing fractures (HTPF). Int. J. Rock Mech. Min. Sci. 2003, 40, 1011–1020. [Google Scholar] [CrossRef]
- GE, X.R.; HOU, M.X. A new 3D in situ rock stress measuring method: Borehole wall stress relief method (BWSRM) and development of geostress measuring instrument based on BWSRM and its primary applications to engineering. Chin. J. Rock Mech. Eng. 2011, 30, 2161–2180. [Google Scholar]
- He, M.C.; Xie, H.P.; Peng, S.P. Study on rock mechanics in deep mining engineering. Chin. J. Rock Mech. Eng. 2005, 24, 2803–2813. [Google Scholar]
- Sun, J.; Wang, S. Rock mechanics and rock engineering in China: Developments and current state-of-the-art. Int. J. Rock Mech. Min. Sci. 2000, 37, 447–465. [Google Scholar] [CrossRef]
- Zhu, Y.; Chen, L.; Zhang, H.; Zhou, Z.; Chen, S. Physical and mechanical characteristics of soft rock tunnel and the effect of excavation on supporting structure. Appl. Sci. 2019, 9, 1517. [Google Scholar] [CrossRef]
- Zhang, F.; Liu, Q.S.; Zhang, C.Y. Measurement of geostress and sensor about rheological stress recovery method. Rock Soil Mech. 2014, 35, 3273–3279. [Google Scholar]
- Zhu, Y.G.; Liu, Q.S. A new three-dimensional pressure transducer for measuring soft rock stress. Geotech. Test. J. 2016, 39, 703–711. [Google Scholar] [CrossRef]
- Liu, Q.S.; Jiang, J.J.; Zhang, C.Y.; Zhu, Y.G. Experimental investigation on the mechanical behavior of a new three-dimensional pressure transducer. Arab. J. Sci. Eng. 2016, 41, 1–12. [Google Scholar] [CrossRef]
- Wang, Y.Y.; Ji, J.; Jiang, J.D. Simulation of stress recovery rule of three-dimensional pressure transducer embedded in rheological rock. Sci. Technol. Eng. 2016, 16, 82–87. [Google Scholar]
- He, M.C. Conception system and evaluation indexes for deep engineering. Chin. J. Rock Mech. Eng. 2005, 24, 2854–2858. [Google Scholar]
- Jiang, J.J.; Liu, Q.S.; Xu, J. Analytical investigation for stress measurement with the rheological stress recovery method in deep soft rock. Int. J. Min. Sci. Technol. 2016, 26, 1003–1009. [Google Scholar] [CrossRef]
- Gao, Y.F.; Qu, Z.J.; Niu, X.L. Rheological law for soft rock tunnel and evolution law for stress field in deep mine. J. China Coal Soc. 2007, 32, 1244–1252. [Google Scholar]
- Meng, Q.B.; Han, L.J.; Qiao, W.G. Research on deformation failure characteristics of the deep high-stress soft rock roadways. J. Min. Saf. Eng. 2012, 29, 481–486. [Google Scholar]
- Peng, S.P.; Wang, X.L.; Liu, X.W. Research on rheological characteristics of rock in the weak coal-bearing strata. J. China Coal Soc. 2001, 26, 149–152. [Google Scholar]
- Sun, J. Rock rheological mechanics and its advance in engineering applications. Chin. J. Rock Mech. Eng. 2007, 26, 1081–1106. [Google Scholar]
- Wang, S.; Yu, J.; Ma, S. Relationship between cell-indicated earth pressures and field earth pressures in backfills. Eur. J. Environ. Civ. Eng. 2014, 19, 773–788. [Google Scholar] [CrossRef]
© 2019 by the authors. Licensee MDPI, Basel, Switzerland. This article is an open access article distributed under the terms and conditions of the Creative Commons Attribution (CC BY) license (http://creativecommons.org/licenses/by/4.0/).