Article

Numerical Investigation of Multi-SDBD Plasma Actuators for Controlling Fluctuating Wind Load on Building Roofs

1
Key Laboratory of Building Safety and Efficiency of the Ministry of Education, Hunan University, Changsha 410082, China
2
College of Electronic and Information Engineering, South-Central Minzu University, Wuhan 430074, China
3
School of Vocational Engineering, Health and Sciences, RMIT University, GPO Box 2476, Melbourne, VIC 3001, Australia
*
Author to whom correspondence should be addressed.
Appl. Sci. 2019, 9(17), 3493; https://doi.org/10.3390/app9173493
Submission received: 2 August 2019 / Revised: 19 August 2019 / Accepted: 20 August 2019 / Published: 23 August 2019
(This article belongs to the Section Civil Engineering)

Abstract

:
The present research aims to explore, by large-eddy simulation (LES), the potentiality and mechanism of multiple surface dielectric barrier discharge (multi-SDBD) plasma actuators to manipulate mean and fluctuating wind loads on a low-rise building. Three actuator configurations are located on the roof to induce directional wall jets in different directions. The effects of these configurations on flow structure and wind loads are studied in absence and presence of approaching flow. Results show that all subgrid-scale models can obtain accurate roof pressure, and for the diffusion and convection terms, the bounded central differencing scheme can provide more accurate predictions for the roof pressure. The control impact of active actuators gradually weakens with the increase of the approaching flow velocity. The direction of the wall jet can determine the position of the limited roof region with the reduced mean pressure coefficient. The multi-SDBD actuators continue to absorb the upstream flow and blow this flow downstream, meaning the wall jet exerts strong pressure on the local roof area at the end of the jet, which results in a significant reduction of the mean pressure coefficient. Furthermore, the counter-rotating vortices caused by the wall jet restrain the size and strength of the vortex shedding, thereby achieving the purpose of reducing the fluctuating pressure coefficient. Further analysis of the instantaneous vorticity fields indicates that the intensity and size of streamwise shedding vortices can be restrained by small-scale spanwise vortices induced by the plasma actuators. Under the action of the wall jet blowing from the trailing edge to the leading edge, the fluctuating lift and drag coefficients can be reduced by over 15% and the fluctuating pressure coefficient can be reduced by about 20% from the no actuation situation.

1. Introduction

Typhoons are some of the major natural disasters faced by human beings, which have brought great financial losses and casualties. Wind damage and destruction frequently occur as a large number of low-rise buildings are located along the coastal areas of southeast China. The post-disaster statistics show that typical failures observed are mainly concentrated on the roof structure, such as the roof ridges, corners, or windward eaves. In a powerful typhoon, the roof is generally subjected to tremendous wind pressures. When the wind pressures exceed the bearing capacity of the roof, the roof can be overturned, causing the failure of gable walls and even complete collapse of the building. Hence, it is necessary to adopt effective strategies to reduce wind pressures on the surface of the roof.
Many passive and active flow control technologies have been implemented to improve the aerodynamic characteristics of different obstacles. As for buildings, typical passive control strategies have included local shape modifications and additional ancillary structures. The experimental results of Yuan et al. [1] showed that facade appurtenances equipped on the four side faces of high-rise buildings could greatly restrain the variation range of negative peak pressure, and the largest value of this pressure could be reduced by about 42% on the higher leading corner. Bitsuamlak et al. [2] showed that high wind-induced suctions on the building envelope could be reduced by over 25% after simple architectural elements, such as trellises and ribs, were installed on a low-rise building. Aly et al. [3] found that the large chamfers for roof edges can reduce the drag force of low-rise buildings by nearly 20%, and a 28% uplift reduction was achieved by replacing sharp roof edges with airfoil edges. Li et al. [4] pointed out that roof spoilers close to the gable wall had a noticeable reduction effect on wind pressures on the roofs of low-rise, gable-roof buildings, and mean wind pressure can be reduced by 95% on the local roof area. However, these passive methods had a limited operating range. The control effects of these methods were often not optimal and even had an adverse impact on system performance, as they did not operate within the original design conditions.
In recent years, various active control strategies have been gradually applied to decrease wind loads of different structures. For example, Zhang et al. [5] proposed using steady suction control to reduce the across-wind loading on a high-rise building and found that this control method disturbed the motion or development of large-scale leading edge vortices. Wang et al. [6] used two small affiliated rotating cylinders to reduce the drag of a circular cylinder by suppressing the vortex shedding. Qu et al. [7] found that a slot synthetic jet located at the rear surface of a square cylinder was used to achieve a drag reduction and shorten the wake vortex formation length. However, these active strategies require complex moving parts or mechanical configuration.
The dielectric barrier discharge (DBD) plasma actuators can be divided into volume discharge actuators and surface discharge actuators. If the electrodes are located on both sides of a dielectric barrier layer, the plasma actuators are called surface DBD (SDBD) actuators; otherwise, they are volume DBD actuators. Since the volume DBD actuators are not suitable for flow control [8], the multi-SDBD plasma actuators are employed in the present study to explore plasma-based flow-control strategies. The main features of the actuators over other active control methods are their small size, light weight, quick response times, and easy installation because of the absence of moving parts. A single-SDBD plasma actuator is a very simple device consisting of asymmetric upper and lower electrodes separated by a dielectric plate. A power supply is applied on two electrodes to produce low-temperature plasma at the actuator surface. Under the action of the strong electric field, the plasma collides with surrounding neutral molecules and transfers its momentum to the ambient fluid, thereby a body force is created above the dielectric. The body force can induce a wall jet in quiescent air, and in an existing flow the body force is employed to get a beneficial modification of the mean velocity profile of the near-wall flow [9]. Dong et al. [10] proposed that the drag reduction of a scaled train model can be obtained by using a SDBD plasma actuator to suppress the flow separation. They also found that the surface temperature of the dielectric and the induced flow velocity were increased as the applied voltage increased. The increased surface temperature may not affect the flow field around the train model. Kopiev et al. [11] pointed out that two SDBD plasma actuators can reduce the vortex noise of a cylinder by 10 dB with the reduction of wake width and turbulent level. According to the experimental research of plasma flow control for a delta wing, Sidorenko et al. [12] believed that continuous plasma actuation with the airflow direction can delay the vortex breakdown to improve the wing lift. These studies show that the actuators have broad application prospects in flow control.
At present, there are two types of mathematical models for plasma actuators: the first-principles model and the phenomenological model. The first-principles model appears to describe the charging process of the plasma and capture the basic physical quantities necessary to accurately estimate body force distributions [13]. However, this model involves complex chemical equations and difficult solution processes for Navier–Stokes equations, resulting in long computational time and massive storage consumption. These factors hinder the usability of this model.
In contrast, since the phenomenological model is relatively easy to implement and has less computational costs, it is more suitable for application in research studies. The phenomenological model proposed by Shyy et al. [14] was successfully applied to the simulations of plasma-controlled flows around different obstacles. Rizzetta et al. [15] used this model to mitigate unsteady vortex shedding and flow separation around a circular cylinder, and the results showed that the mean drag was reduced by over 50% and the oscillatory lift was virtually eliminated. Zhang et al. [16] studied the flow field around a gurney flap with this model placed in the front part of the flap to produce a counter-current wall jet. They found a 15% drag reduction. Rizzetta et al. [17] also utilized this model to improve the aerodynamic performance of a flat-plate wing and discovered that the outboard wall jet can increase both the lift and the rolling moment by over 30%. Zhang et al. [18] employed this model to achieve plasma circulation control for an elliptic airfoil and pointed out that the plasma control efficiency for lift augmentation was superior to the conventional jet control method. These examples show that this model has become a prevalent approach for the simulation of plasma actuators. Therefore, the model is adopted in the current research. However, the application of the plasma actuators in manipulating fluctuating wind load needs to be further studied based on the model. Also, the mechanism of plasma actuators to reduce fluctuating wind load on the surface of objects is still unclear. Thus, it is urgent to strengthen this research.
The current study can be considered as a continuation of the authors’ previous work [19] on plasma actuators. The previous work experimentally and numerically demonstrated the variation of mean pressure and peak negative pressure on the roof centerline under the action of plasma actuators, but did not investigate the effect of the actuators on fluctuating pressure. Compared with the previous work, the innovation of this study is the exploration of the influence and control mechanisms of plasma actuators on fluctuating wind load, such as fluctuating pressure. Moreover, based on the temporal evolution of the instantaneous vorticity field, this study reveals how SDBD actuation interacts with the shedding vortices. The next section introduces the modeling and numerical methods. The grid independence study and the validation of the numerical model are performed in the following section. In the fourth section, the results and discussions in absence and presence of approaching flow are presented regarding the change of mean and fluctuating wind loads, as well as for the flow field under the influence of three actuator arrangements. The final section presents a summary and conclusion.

2. Modeling and Numerical Methods

2.1. Conservation Equations

The unsteady three-dimensional Navier–Stokes equations [20] are adopted for the flow field simulation, and the right-hand side of the equations is augmented by a source term representing the body force of plasma actuators. For the incompressible flow, the mass and momentum conservation equations are written as:
u i x i = 0
ρ u i t + ρ u i u j x j = x j μ u i x j p x i τ i j x j i + F i
where ui, xi, ρ, t, μ, p, and τij correspond to the velocity vector, position vector, density, time, molecular viscosity coefficient, pressure, and stress tensor. Additionally, Fi is the body force component per unit volume in N/m3 and will be described in detail in the following section.

2.2. Numerical Model for Body Force Generation

The plasma active region of the phenomenological model [14] with a local Cartesian coordinate system is illustrated in Figure 1. The wedge region AOBB’A’O’ composed of points A, O, B, B’, A’ and O’ in the figure is depicted by the dashed line. A high-frequency voltage is applied on the upper and lower electrodes of the plasma actuator to ionize the air and generate the plasma. The plasma is assumed by the phenomenological model to exist only in the wedge region with width b and height a; namely, the wedge region is the plasma active region after the actuator is ignited. Under the influence of the electric field, the plasma can collide with surrounding neutral molecules to cause directional movement of the surrounding fluid. Therefore, the phenomenological model recognizes that the plasma actuators can apply the body force to the surrounding fluid. The phenomenological model assumes that the body force exists only in the wedge region, and the body force is parallel to the plane ABB’A’ (the inclined surface of the wedge region AOBB’A’O’) and points to the lower right. The body force F is obtained by
F = ω α ρ c e c Δ t E
where ω, α, ρc, ec, and ∆t represent the voltage frequency, collision factor, charge density, electronic charge, and charge time, respectively. The linear distribution of the electric field strength E is defined as E = E0k1x’ − k2y’, where E0 = U0/d, k1 = (E0Eb)/b, and k2 = (E0Eb)/a. Moreover, Eo, Uo, d, and Eb represent the maximum electric field strength at the boundary OO’, peak voltage, horizontal distance, and minimum electric field strength at the boundary ABB’A’, respectively. Here, k1 and k2 are the intermediate variables for the linearization. According to the research [19], the values of the parameters are chosen as follows: b = 8 mm, a = 4 mm, ω = 6.5 kHz, Uo = 7.5 kV, α = 0.35, ρc = 1011 cm−3, ∆t = 6.7 μs, d = 0.15 cm, Eb = 30 kV/cm. The detailed methods for determining these parameters can be found in the literature [14]. Aiming to scale the actuation strength, a normalized scaling parameter Dc is defined by Rizzetta et al. [15,17] to show the ratio of body force to inertial force. This can be written as
D c = ρ c e c E o L ρ U 2
where ρ is the fluid density, L is the reference length, and U is the free stream velocity. In the present simulation, the scaling parameter is set as 0.6.

2.3. Reference Model and Computational Method

The 1:40 geometrical scale model of the flat-roof low-rise building [19] is employed as the reference model with height h of 200.0 mm, as shown in Figure 2a. The building model has a rectangular cross-section with a length l of 0.8875 h and a width w of 0.59 h. Figure 2b shows the cross-sectional scheme of three actuator configurations at the roof centerline, which are named cases A, B, and C. The wall-jet direction for each case is also shown in this figure. Each copper electrode has a length of 0.85 h, a width of 0.02 h, and a thickness of 0.0005 h. Since Shieh [21] pointed out that the effect of electrodes on the flow structure can be ignored, the present simulation does not consider this effect.
The numerical simulations in absence and presence of the plasma actuation are conducted on a 3-dimensional computational grid, as shown in Figure 3a,b. The computational domain size is 18 h × 8 h × 4 h along the x-, y-, and z-axes, and the building model is mounted on the ground. The resulting blockage ratio is 2.77%, which does not exceed the 3% threshold value [22]. Since the size is very long in the x-axis direction, this domain is divided into 2 parts, named Zone-1 and Zone-2. In order to reduce the computation cost and capture the flow physics, the C-typed grid topology method is employed in Zone-1 to obtain hexagonal grids with a normalized minimal grid size of Δz/h = 0.0003 (Δz = 0.00006 m) on the roof surface, as shown in Figure 3c,d. This size is close to the suggested value of 0.00025 m from the large-eddy simulation (LES) of a cylinder with a plasma actuator [15]. The minimal grid size is raised by keeping a rate of 1.10 away from the building body surface. Zone-2 also adopts the structured grids, as shown in Figure 3b.
The boundary conditions of the computational domain are shown in Figure 3a. The detailed definition method of the velocity inlet boundary can be found in [23]. The building and ground surfaces are also set as the no-slip stationary wall. When the wind speeds U are 4, 7, and 10 m/s (i.e., Reynolds numbers Re are 5.3 × 10⁴, 9.3 × 10⁴, and 1.3 × 10⁵, respectively, based on the building height h), the dimensionless vertical profiles of the streamwise mean velocity and turbulence intensity at the inlet boundary from the present simulation are compared with the experimental data [19], as shown in Figure 4. In these figures, Vz and Iz are the mean velocity and turbulence intensity, respectively, at a specific height of z, and I2h means the turbulence intensity at the double building height. These figures show that numerical results are congruent with experimental data.
The numerical simulations are performed using the software Fluent. For the steady simulations, Meng et al. [24] studied the sensitivity of building wind pressures to different turbulence models and pointed out that the re-normalization group (RNG) k-epsilon model can obtain accurate results. This model with the non-equilibrium wall function is employed by the present study to obtain the initial flow field used for the transient simulation. For the unsteady simulations, the LES and detached eddy simulation (DES) turbulence models can provide more accurate predictions for the mean velocity fields around the building [23]. Combined with the sensitivity analysis of the subgrid-scale models described in the next section, the LES model with the Smagorinsky–Lilly subgrid-scale model is used for the transient simulation. The detailed description and equations of the LES model can be found in the study [23]. The body force and plasma active region are encoded into the conservation equations by the macro function DEFINE_SOURCE. The conservation equations are discretized by the finite volume method and the discretized equations are calculated using the SIMPLE-Consistent (SIMPLEC) algorithm, where SIMPLE is the semi-implicit method for pressure-linked equations. The spatial discretization has a second-order accuracy, and the bounded second order implicit Euler scheme is adopted for the time integration. According to the discretization-scheme sensitivity analysis described in the next section, the discretization schemes for the diffusion and convection terms are the bounded central differencing scheme. According to the numerical analysis [23], the most economical non-dimensional time step of ∆t × U/h = 0.175 (∆t = 0.005 s) is adopted by the present study with 25 sub-iterations, where U is the wind speed of 7 m/s. The convergence criterion of all dependent variables is set as 10−5 for the normalized residuals.

3. Verification and Validation

The drag and lift coefficients, Cd and Cl, are respectively defined as:
C d = F d / 0.5 ρ V h 2 l w
C l = F l / 0.5 ρ V h 2 l w
where Fd and Fl are wind loads acting on the whole building model along x- and z-directions, respectively (the directions are presented in Figure 2; Vh means the free stream velocity at the building height h). The time history of a physical quantity can be expressed as a non-dimensional coefficient CXXX(ti), where ti is the time instance and i indicates the sample sequence number (i = 1, 2,..., N). The mean and root-mean-square (RMS) values of this coefficient, CXXX,mean and CXXX,rms, are respectively calculated as follows:
C X X X , m e a n = i = 1 N C X X X ( t i ) / N
C X X X , r m s = i = 1 N ( C X X X ( t i ) C X X X , m e a n ) 2 / ( N 1 )
where CXXX can be Cd or Cl.
The mean and RMS pressure coefficients, Cp,mean and Cp,rms, can also be calculated by the normalized pressure coefficient Cp (= (p(t) − p0)/0.5ρVh2) on the building surface, where p(t) is the pressure of the given location at time t and p0 is the reference static pressure of the free stream. The RMS pressure coefficient is also called the fluctuating pressure coefficient. To quantitatively describe the influence of plasma actuators on wind loads, the change rates of mean and fluctuating pressure coefficients, ηp,mean and ηp,rms, are considered as the following equations:
η p , m e a n = ( | C p , m e a n * | | C p , m e a n | ) / | C p , m e a n |
η p , r m s = ( C p , r m s * C p , r m s ) / C p , r m s
where Cp,mean and C*p,mean are the mean pressure coefficients without and with the plasma actuation, respectively; Cp,rms and C*p,rms are the fluctuating pressure coefficient without and with the plasma actuation, respectively. If ηp,mean < 0, it means that the absolute value of the mean pressure coefficient decreases after the actuators are ignited; otherwise, the absolute value of the mean pressure coefficient increases after the actuators are ignited. If ηp,rms < 0, it means that the fluctuating pressure coefficient decreases with the plasma actuation; otherwise, the fluctuating pressure coefficient increases with the plasma actuation.
The Strouhal number St is defined as:
S t = f s h / V h
where fs means the vortex shedding frequency obtained from the spectral analysis for the time signal of the drag coefficient, and Vh represents the free stream velocity at the building height h.
To check the mesh sensitivity, a comparative study is conducted by varying the grid numbers without the plasma actuation, and the detail information is shown in Table 1. In this table, Δz/h is the dimensionless first mesh size adjacent to the roof surface, Δy/h is the dimensionless mesh size close to the building surface in the y-axis direction. It can be seen from the table that the deviations are very small among the results of these grids. Moreover, the mesh number of Grid-2 is close to the recommended value of 4.8 million from the flow simulation around a rectangular building [23]. Therefore, Grid-2 is adopted by the later study. Concerning Grid-2, the normalized wall distance y+ of the first near-wall meshes has a maximum of about 4 at the corners of the windward wall and is less than 1 (generally around 0.4) for the remaining building surfaces.
The comparative studies are performed based on case A without the plasma actuation to investigate the sensitivity of the roof pressure to subgrid-scale models and discretization schemes. Figure 5a compares the mean pressure coefficients along the roof centerline, as obtained with four subgrid-scale models. The experimental data are from the literature [19], and these subgrid-scale models include the Smagorinsky–Lilly (SL) model, kinetic energy transport (KET) model, wall-adapting local eddy-viscosity (WALE) model, and wall-modeled LES (WMLES) model. The differences among the computational results of the four subgrid-scale models are small, and the computational results are in good agreement with the experimental data. This indicates that all subgrid-scale models can obtain accurate roof pressures. Figure 5b compares the mean pressure coefficients along the roof centerline, as obtained by the application of five discretization schemes to the diffusion and convection terms. The bounded central differencing scheme exhibits the highest level of performance among all discretization schemes, since the result obtained with the bounded central differencing scheme is the closest to the experimental data from the literature [19].
To validate the numerical method, the mean pressure coefficient change rates from the present simulation under varying wind speeds are compared with the experimental results [19]. The mean pressure coefficient change rate ηp,mean along the roof centerline for all cases is shown in Figure 6. When the wind speed is small, there is an obvious difference between the experimental data and the simulation results at some data points. The reason for this difference may be that the heating effect and chemical reaction of the active actuators are not considered in the present simulation. In summary, the numerical results agree with the experimental data, indicating that the numerical method adopted by this paper is reasonable and reliable. The wind speed of 7 m/s is selected as the object of subsequent researches. It can also be noted that the control effect of the plasma actuators continues to decrease as the wind speed increases.

4. Results and Discussion

4.1. Plasma Actuators in Quiescent Air

To investigate the plasma influence in quiescent air, velocity magnitude and velocity component contours for all cases on the roof centerline are shown in Figure 7 and Figure 8. In these figures and the subsequent similar figures, the upper and lower electrodes are illustrated by black rectangular regions, and the height of these regions is ten-times larger than the used electrode thickness to show the position of the actuators clearly. When the actuators are active, case A produces an induced near-wall jet with the direction from the trailing edge towards the leading edge, and the flow has a final velocity of approximately 2 m/s around the leading edge. An induced near-wall jet with the direction from the middle of the roof to leading and trailing edges is induced by case B, and the flow velocity reaches a maximum of around 1.8 m/s close to the leading and trailing edges. Moreover, case C generates an induced near-wall jet with the direction from leading and trailing edges to the middle of the roof, and the maximum velocity is about 1.8 m/s near the middle of the roof. Since the wall jet has opposite flow directions in the middle of the roof, a vertical synthetic jet appears above this region. The similar experimental result for the synthetic jet phenomenon was described by Santhanakrishnan et al. [25]. The reason for increasing the jet velocity is that the flow moving along the induced wall-jet direction is accelerated every time it passes over the next actuator, and builds up to reach to the maximum velocity at the end of the jet.
As can be seen from Figure 8a,c,e, the x-velocity of the induced jet for each case is larger than the z-velocity, indicating that the wall jet is dominated in the wall-parallel direction. This is consistent with a similar numerical study on the wind turbine blade by Ebrahimi et al. [26]. According to Figure 8b,d,f, a negative z-velocity exists above every single-SDBD actuator, and a positive z-velocity appears downstream of the jet induced by each actuator. This shows that each plasma actuator exerts a suction force on the flow above itself and blows the flow downstream, thereby generating a pressure force on the downstream flow. The pressure contours of all cases shown in Figure 9 prove this. In this figure, the range and amplitude of negative pressure regions reduce continuously along the wall-jet direction, while the range and amplitude of positive pressure regions increase rapidly. This implies that in terms of the influence of the multi-SDBD plasma actuators, the suction effect quickly decreases along the induced jet direction, and at the same time the pressure effect increases dramatically.

4.2. Flow Control of Plasma Actuators in Flowing Air

During the simulation, the building model has an unsteady wind load in the initial three seconds, and for comparison of the control effects of different plasma actuator arrangements, the stable stage (subsequent fifteen seconds) is used for analysis. The quantitative data of mean and fluctuating wind loads under all cases are given in Table 2 for comparative analysis. Compared with the no actuation situation, all cases have no effect on the mean drag coefficient, and case A has the smallest mean Cl value (an about 5% reduction). This indicates that the control effect is closely related to the configuration and position of the active plasma actuators. Since the actuators are only placed on the roof, they mainly affect the wind load on the roof (i.e., the z-direction wind load) and there is no change in the mean drag coefficient. For the vortex-induced vibration, the RMS value of the wind load (i.e., the fluctuating wind load) is much more concerning than the mean value due to the better reflection of the structural vibration characteristic. Among all cases, case A has the lowest fluctuating Cd (a 15.79% reduction) and the lowest fluctuating Cl (a 15.45% reduction). Such results mean that case A is the best configuration of multi-SDBD plasma actuators for reducing fluctuating wind load. Moreover, cases B and C also show good control of the fluctuating Cd and Cl with decrements of over 6.30%. This shows that the vibration amplitude of the roof along the x-direction and z-direction can be significantly reduced by all cases. Compared with the no actuation situation, the Strouhal numbers of cases A and B are decreased, implying the delay of the vortex shedding period, and the Strouhal number is increased for case C. This indicates that the active actuators can affect the vortex shedding frequency.
Figure 10 shows the time histories of the drag coefficients acting on the building model from the simulation results of different cases. It can be seen that the drag coefficient of the no actuation situation is highly unsteady, with its amplitude fluctuating randomly and significantly as a function of the time. The drag coefficient fluctuation amplitudes of all cases are obviously reduced in comparison to the no actuation situation. This indicates that the active actuators can reduce the instability of the drag coefficient. Figure 11 illustrates the power spectral density (PSD) of the fluctuating drag coefficient acting on the building model from the simulation results of different cases. In this figure, f is the frequency. For a blunt body, such as a low-rise building, the vortex shedding seems to be the primary source of the fluctuating pressure of the building surface [27]. Large-scale vortex shedding often means the strong fluctuating wind load. When the reduction frequency is around 0.196, the PSD peaks of all cases are much lower than the no actuation situation, suggesting a sharp weakening of the strength of the shedding vortex led by the flow separation. Besides, the PSD of all cases at the reduction frequencies of 0.32, 0.36, 0.41, and 0.46 is significantly increased in comparison to the no actuation situation, implying that the active actuators can induce the small-scale vortex with high frequency.
The contours of the mean pressure coefficient and its change rate on the whole roof from the simulation results are shown in Figure 12. When the actuators are inactive, Cp,mean on the entire roof is a negative value and the absolute value increases along the flow direction. This is because the incoming flow separates from the building model at the blunt leading edge and a large recirculation region is formed on the roof, while the incoming flow stays attached to the windward surface of the building model. Then, the shear layer entrains the air flow of the recirculation zone to move downstream while the pressure-driven backflow must balance the air mass loss produced by the shear layer entrainment. The process leads to a strong negative pressure gradient on the roof. In addition, according to the experimental research [28], the approaching flow of the present research can be approximated as a uniform flow.
After the actuators are ignited, the negative Cp,mean still appears on the whole roof surface and it is observed that the distribution of Cp,mean changes significantly for all cases, indicating that the negative pressure gradient effect caused by the flow separation still dominates and the wall jet has a significant impact on this negative pressure gradient. It can be seen from Figure 12c that the ηp,mean of the whole roof is negative and it is the smallest (about −20%) in the vicinity of the entire leading edge, suggesting that case A with actuation sharply reduces the |Cp,mean| near the entire leading edge. Figure 12e shows that the ηp,mean has the lowest value (about −5%) around leading edges and in the middle of the trailing edge, implying that case B in presence of actuation obviously reduces the |Cp,mean| around entire leading edges and in the middle of the trailing edge. According to Figure 12g, the ηp,mean has the smallest value (approach to −7%) in the middle of the roof, showing that case C with excitation significantly reduces the |Cp,mean| in the entire middle part of the roof. By checking the changes described above, it is found that local roof regions with the negative and minimal ηp,mean are precisely placed at the end of the wall jet for each case. Similar to the effects of an active single-SDBD plasma actuator in the quiescent air, the actuator with the incoming flow still absorbs the near-wall flow upstream of the induced jet and blows the flow downstream, leading to a pressure force being applied on the downstream flow. In other words, the wall jet exerts a pressure on the downstream near-wall flow. Furthermore, this pressure is directly related to the speed of the wall jet. As the wall jet is continuously accelerated by each single-SDBD actuator, the wall jet has the greatest momentum at the end. At the same time, the maximum pressure is transmitted from the wall jet to the body surface during the interaction of the wall jet with the body surface, resulting in the negative and minimal ηp,mean. This is why the absolute value of the mean wind pressure coefficient is reduced dramatically at the end of the wall jet. It is also seen from these analyses that multi-SDBD plasma actuators are selective for the position of roof areas with a significant reduction of mean wind load, and this roof area is limited.
Cases B and C have the ability to increase the absolute value of the Cp,mean on another partial area of the roof. For example, the positive and maximal ηp,mean (approach to 1.5%) in Figure 12e is located near the middle of the roof, and the positive and bigger ηp,mean (about 5% and 0.3%, respectively) in Figure 12g is close to the leading edge and in the middle of the trailing edge. From further analyses, it is suggested that the roof region with the positive and maximal ηp,mean is placed at the beginning of the wall jet. The reason for this change is that the active actuators exert a suction force on the near-wall flow at the beginning of the induced jet. For the ηp,mean, the absolute value of its minimum value is much bigger than that of its maximum value for each case, leading to the fact that the pressure effect of multi-SDBD actuators is much stronger than the suction effect. In summary, the wall jet slightly increases the mean wind load at the beginning of the jet and dramatically reduces this wind load at the end of the jet.
The contours of the fluctuating pressure coefficient and its change rate on the whole roof from the simulation results are shown in Figure 13. When the actuators are inactive, the Cp,rms has an increasing trend along the flow direction, which is consistent with the experimental result of a similar cube observed by Ito et al. [29] when approaching flow is uniform (Re is 5 × 10⁴). The reason for this trend is that the mean separated shear flow does not reattach to the roof. After the actuators are ignited, the Cp,rms distributions change significantly and the values of the ηp,rms on the whole roof are almost negative for all cases, indicating that the active actuators have an excellent control effect on the fluctuating pressure coefficient. It can be seen from Figure 13c that the minimum value of the ηp,rms (below −20%) is near the middle of the roof. This may be owing to the fact that the counter-rotating vortex on the backward half of the roof is induced by the near-wall jet with the direction from the trailing edge to the leading edge [19]. Figure 13g shows that the minimal ηp,rms (less than −14%) is close to the roof middle. This may be because after active actuators induce a directional near-wall jet, many counter-rotating vortices appear on the forward half of the roof and near the trailing edge [19]. These counter-rotating vortices succeed in suppressing the size of the shedding vortices, meaning that large-scale vortex shedding may become small-scale vortex shedding. This is why the wall jet reduces the fluctuating wind load on the roof.
Figure 14 demonstrates the contours of the mean x-velocity component for all cases. With the discharge off, the near-wall flow velocity is between −1 and 1 m/s. It is known that the flow on the front half of the roof surface moves toward the leading edge, while the flow on the rear half moves to the trailing edge. After the actuators are ignited, the near-wall flow direction for each case is changed to coincide with the velocity direction of the induced jet when there is no incoming flow. This indicates that the near-wall jet is successfully induced by each case with the incoming flow. Moreover, the flow velocity at the back of the near-wall jet is obviously increased by each case compared with the no actuation situation, showing that in the recirculation region the effect of the active actuators on the near-wall flow is stronger than that of the incoming flow. Such changes are due to the fact that the near-wall flow is subjected to a time-mean body force under the action of a high-frequency disturbance from the actuators. It can also be noted that in absence and presence of the plasma actuation the flow separation point is always located at the leading edge, there is no change in the position of the separation shear layer, and the shear layer never reattaches to the roof. This indicates that the active actuators have no effect on the flow separation point. The reason for these phenomena may be that the actuators are placed behind the flow separation point so that the flow separation is completely caused by the architectural shape (i.e., the leading-edge, sharp corner of the roof).
The RMS value of the velocity may be regarded as the fluctuating velocity. In the recirculation zone, it is primarily produced by the shedding vortices as a consequence of the flow separation at the front edge of a low-rise building. The region of the maximum fluctuating velocity is located in the near wake behind the building model, as shown in Figure 15. Obviously, the fluctuating velocity area of over 2.7 m/s for each case is lower than that of the no actuation situation. This shows that the active actuators can manipulate the vortex shedding process in the wake. It is remarkable that the area of the fluctuating velocity greater than 3.1 m/s disappears completely in case A. This decline means that case A with the actuation is the most capable of mitigating the strength and size of the wake vortices.
To fully demonstrate the mechanism of plasma flow control, the no actuation situation and case A are selected for further comparison and analysis. For the flow control of the building structure, the spanwise vortex structure can be identified by the spanwise vorticity (i.e., the y-vorticity component), and the streamwise vortex structure can be identified by the streamwise vorticity (i.e., the x-vorticity component) [30]. Figure 16 shows the temporal evolution of the instantaneous y-vorticity component for case A and the no actuation situation. It can be observed that under the action of the wall jet, many small-scale spanwise vortices continue to appear on the roof. Figure 17 shows the temporal evolution of the instantaneous x-vorticity component for case A and the no actuation situation. When there is no actuation, almost all pairs of streamwise shedding vortices exist in the recirculation zone. It can also be noted at the same time that the strength and size of these streamwise vortices are significantly reduced after the actuators are ignited. These results indicate that the active actuators can result in the formation of small-scale spanwise vortices so as to restrain the strength and size of streamwise shedding vortices in the recirculation zone.
The skin friction coefficient Cf (= τw/0.5ρVh2) can be calculated by the wall shear stress τw [31]. Figure 18 illustrates the contours of mean skin friction coefficients on the building surfaces for all cases. The mean Cf distribution of each case on the windward and lateral walls is almost the same as that of the no actuation situation, indicating that the active actuators have no influence on the skin friction coefficient of the wall. Compared with the no actuation situation, the mean Cf of all cases on the roof surface is increased obviously. Each local roof area with the increase of mean Cf is located just below the plasma active region. These results indicate that the active actuators can increase the velocity gradient on the roof surface.

5. Conclusions

In this study, large-eddy simulations have been conducted to understand the plasma flow control effect on local wind pressures and to reveal the control mechanism of multi-SDBD plasma actuators. Three configurations of multi-SDBD plasma actuators are proposed and tested by the simulations, which can induce three directions of near-wall jets on the whole roof. Numerical results indicate that depending on wall jets, these configurations successfully change the flow structure around the roof and effectively reduce mean and fluctuating wind pressures on the local roof. Moreover, the skin friction coefficient on the roof surface can be increased by the configurations. As the wind speed increases, the control effect of the plasma actuators on the wind pressure continues to decrease. The following conclusions can be summarized.
(1)
The mean drag coefficient is not significantly affected by these configurations, because the actuators are only placed on the roof. In all configurations, the configuration with the near-wall jet direction from the trailing edge to the leading edge (i.e., case A) has a noticeable reduction of mean lift coefficient. The fluctuating lift and fluctuating drag coefficients can be significantly reduced by these configurations owing to the decline of the strength and size of the shedding vortices.
(2)
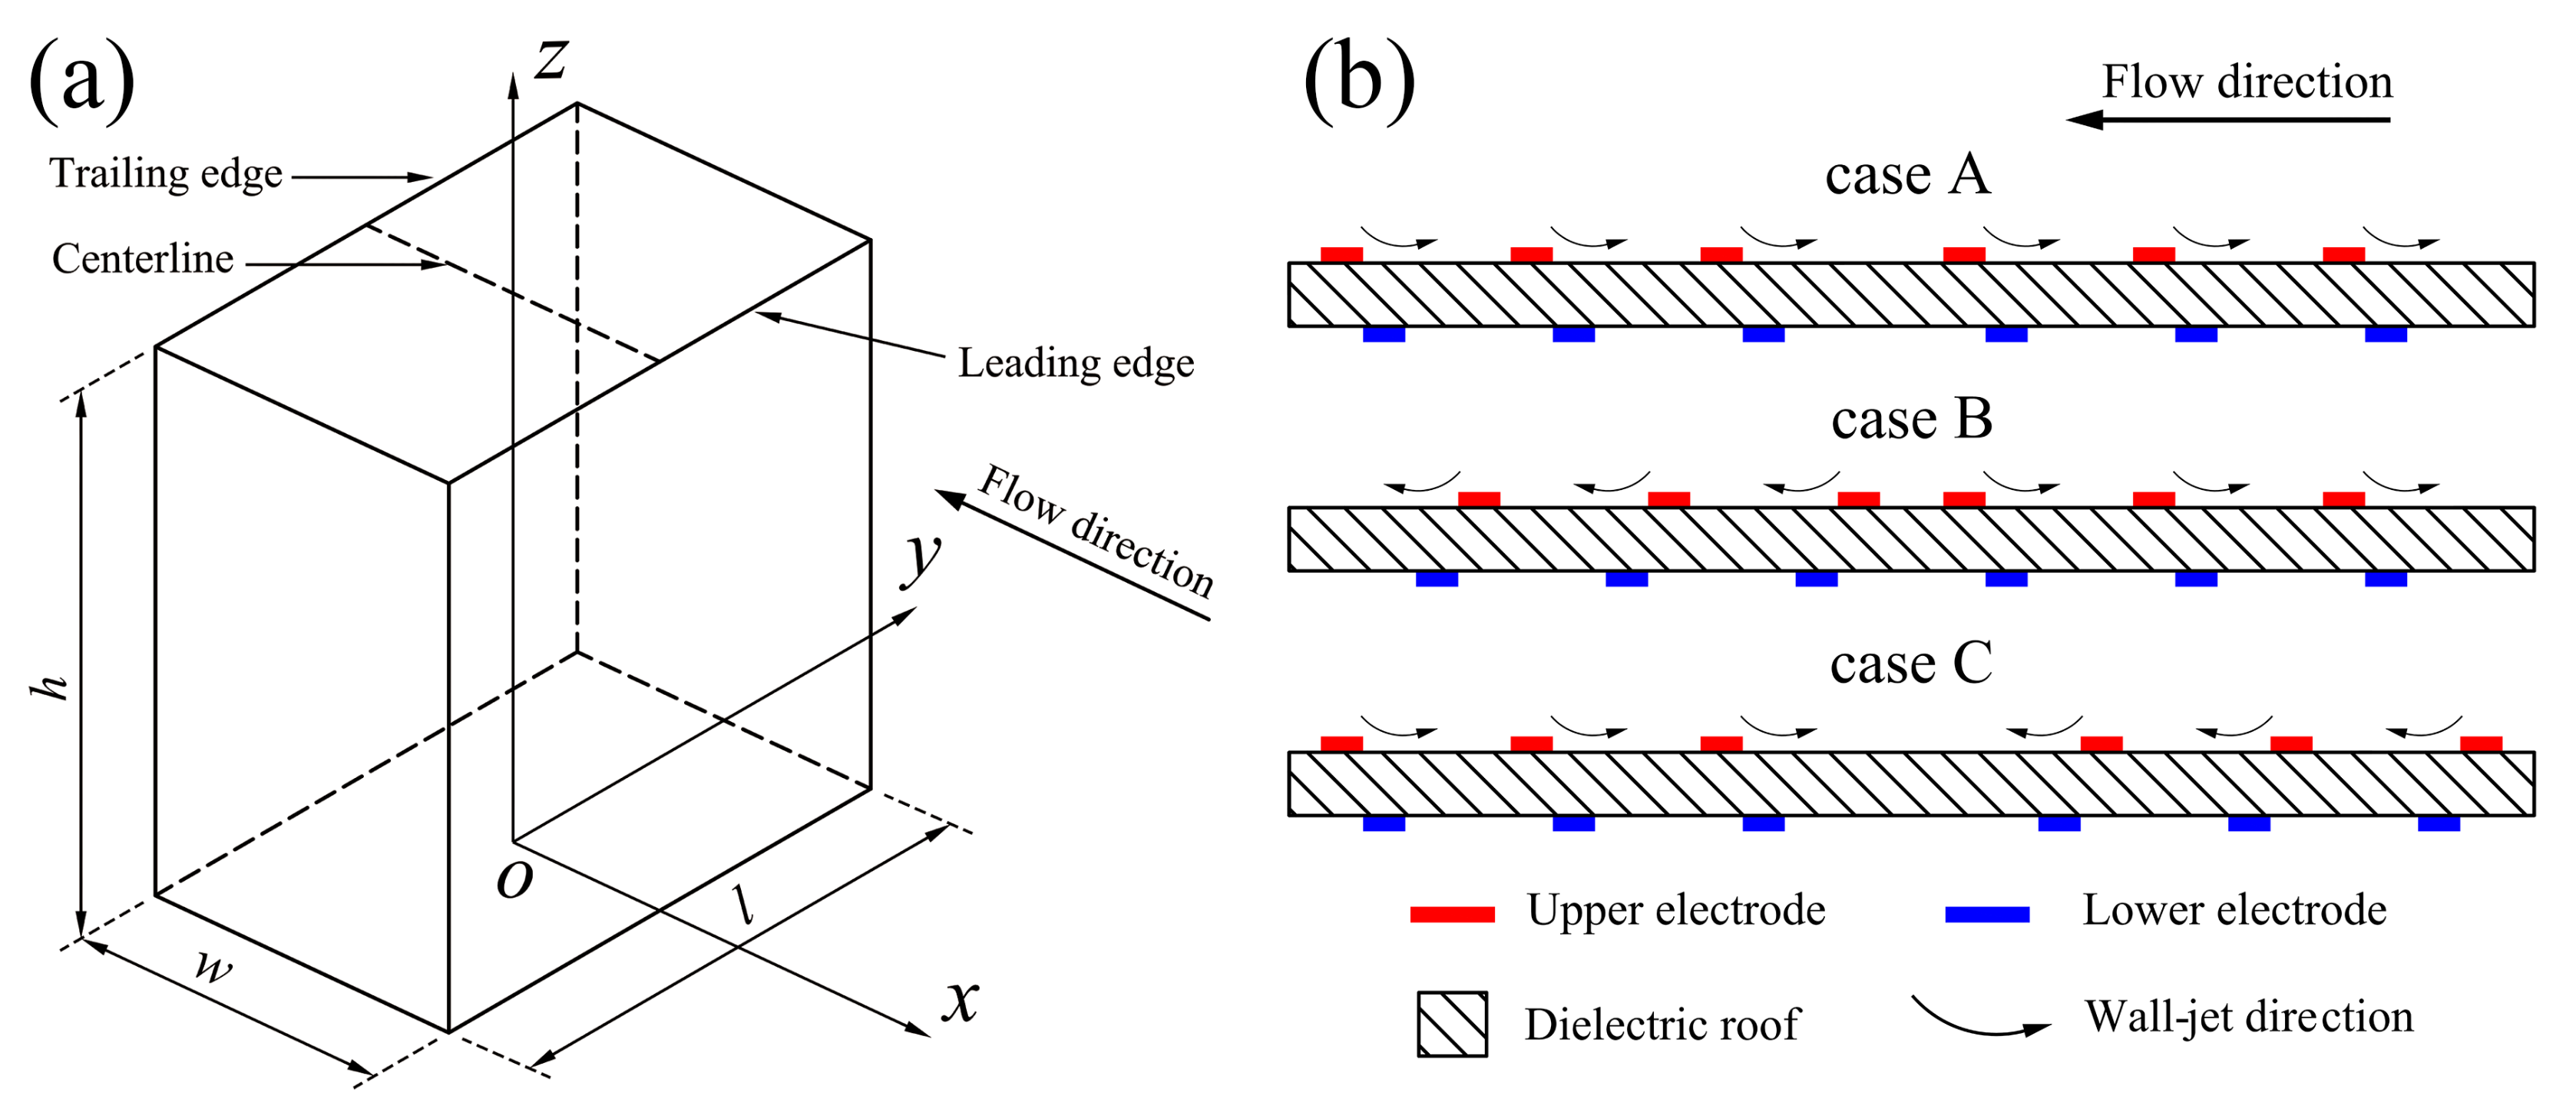
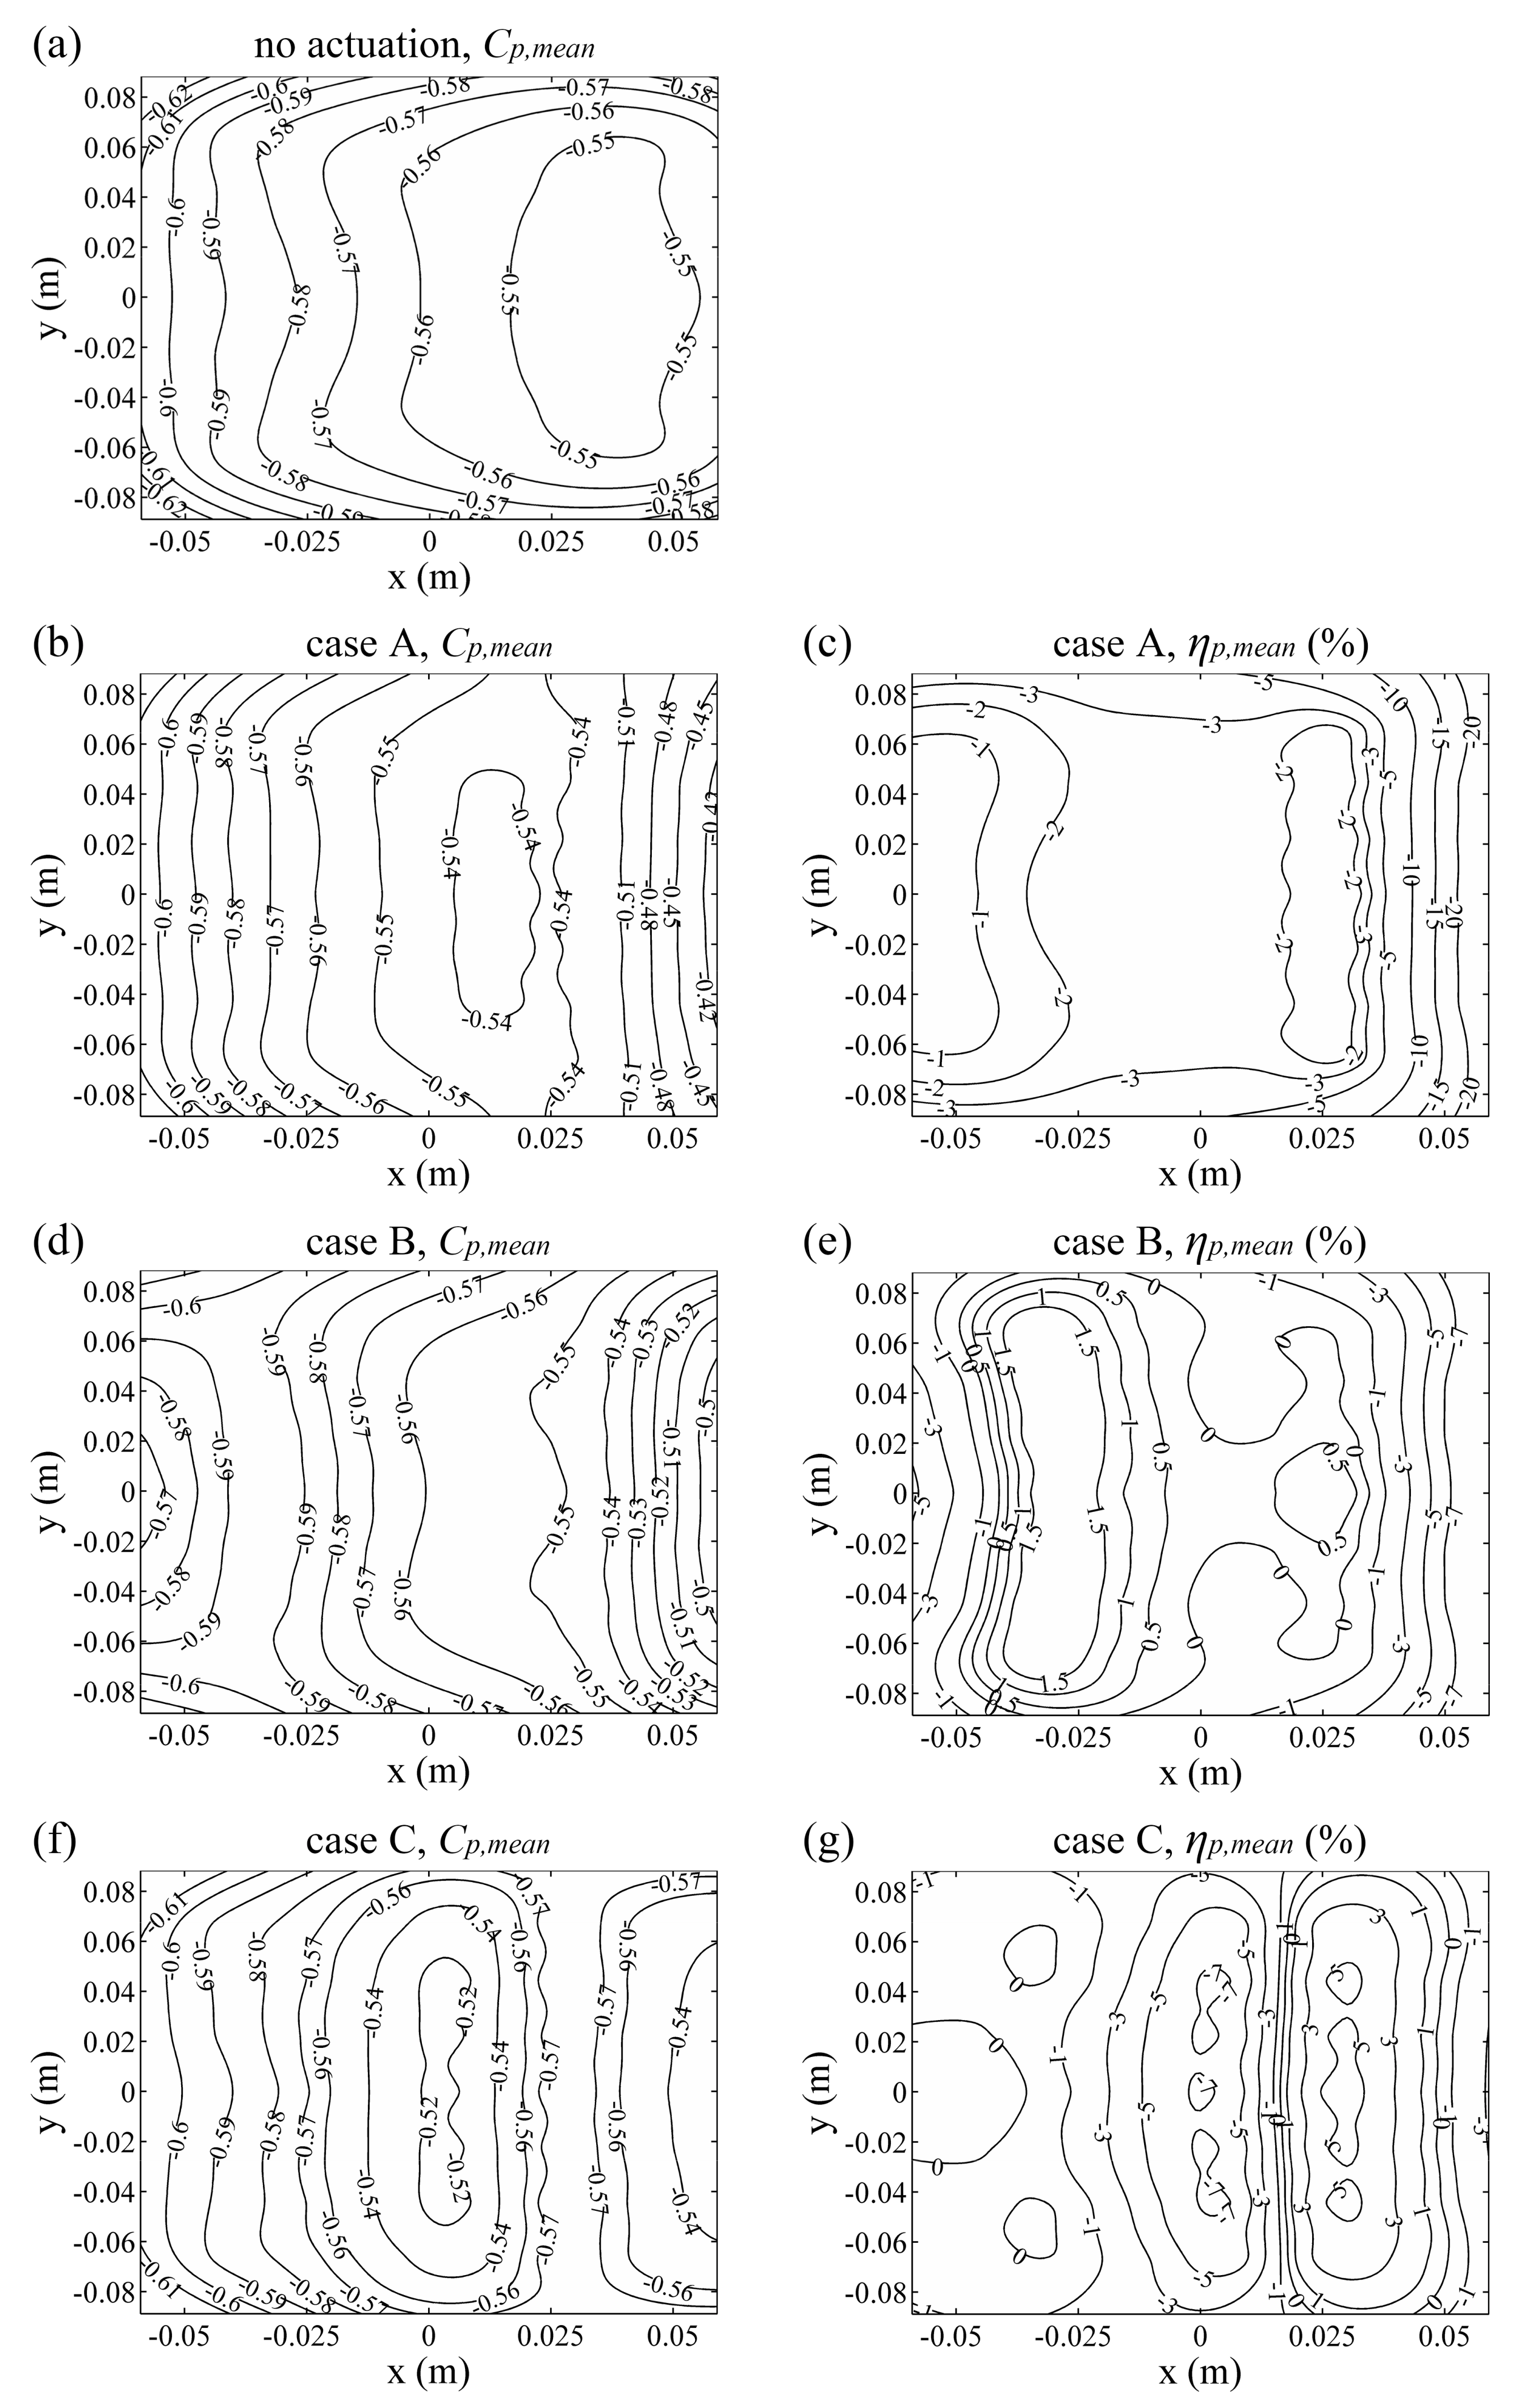
The roof area location with the reduced mean pressure coefficient is determined by the near-wall jet direction. Each single-SDBD plasma actuator can absorb the near-wall flow upstream of the actuator, and meanwhile can blow the flow downstream, resulting in the fact that the wall jet exerts a pressure on the downstream near-wall flow. Under the action of multi-SDBD plasma actuators, the wall jet is continuously accelerated to obtain the greatest momentum at the end and to exert the maximum pressure on the local roof area, leading to the apparent reduction of the mean pressure coefficient absolute value. This is also the reason why the limited roof regions with the reduced absolute value are located precisely at the end of the wall jet. Results show that under the effect of the wall jet blowing from the trailing edge to the leading edge (i.e., case A), the maximum reduction ratio of the mean pressure coefficient absolute value can reach 20% near the leading edge. Also, the pressure effect of multi-SDBD plasma actuators is far greater than their suction effect.
(3)
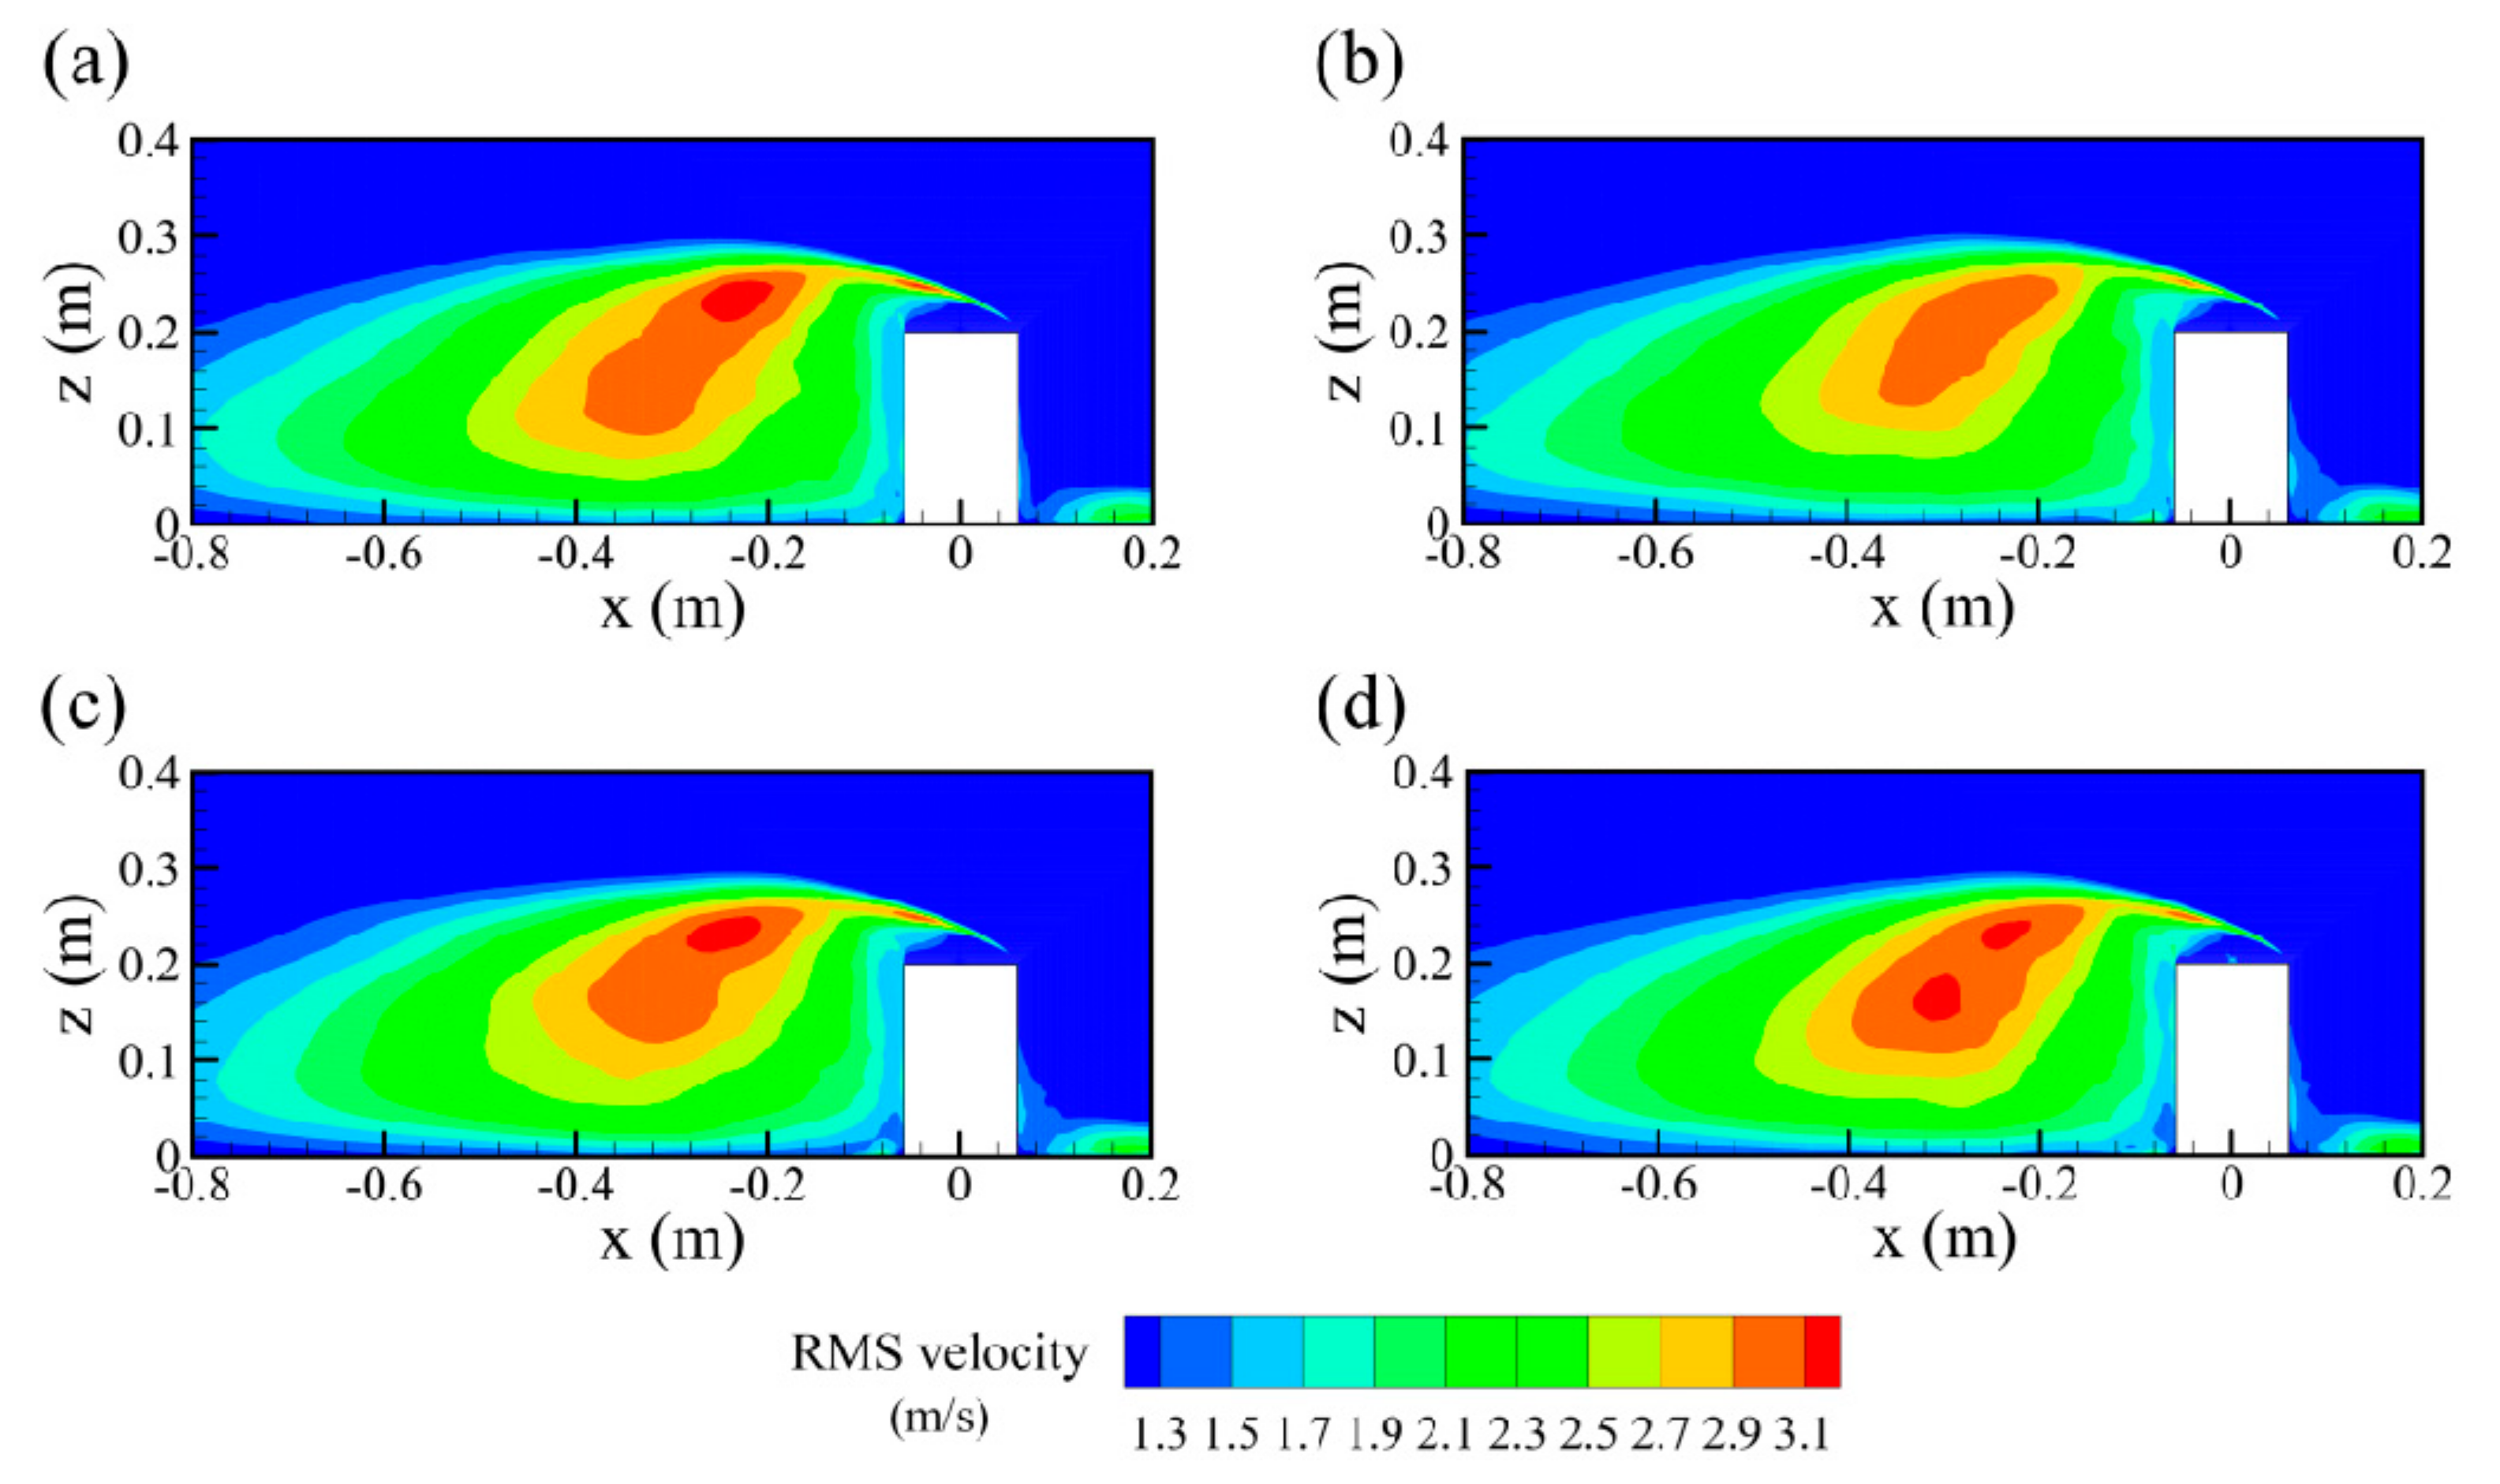
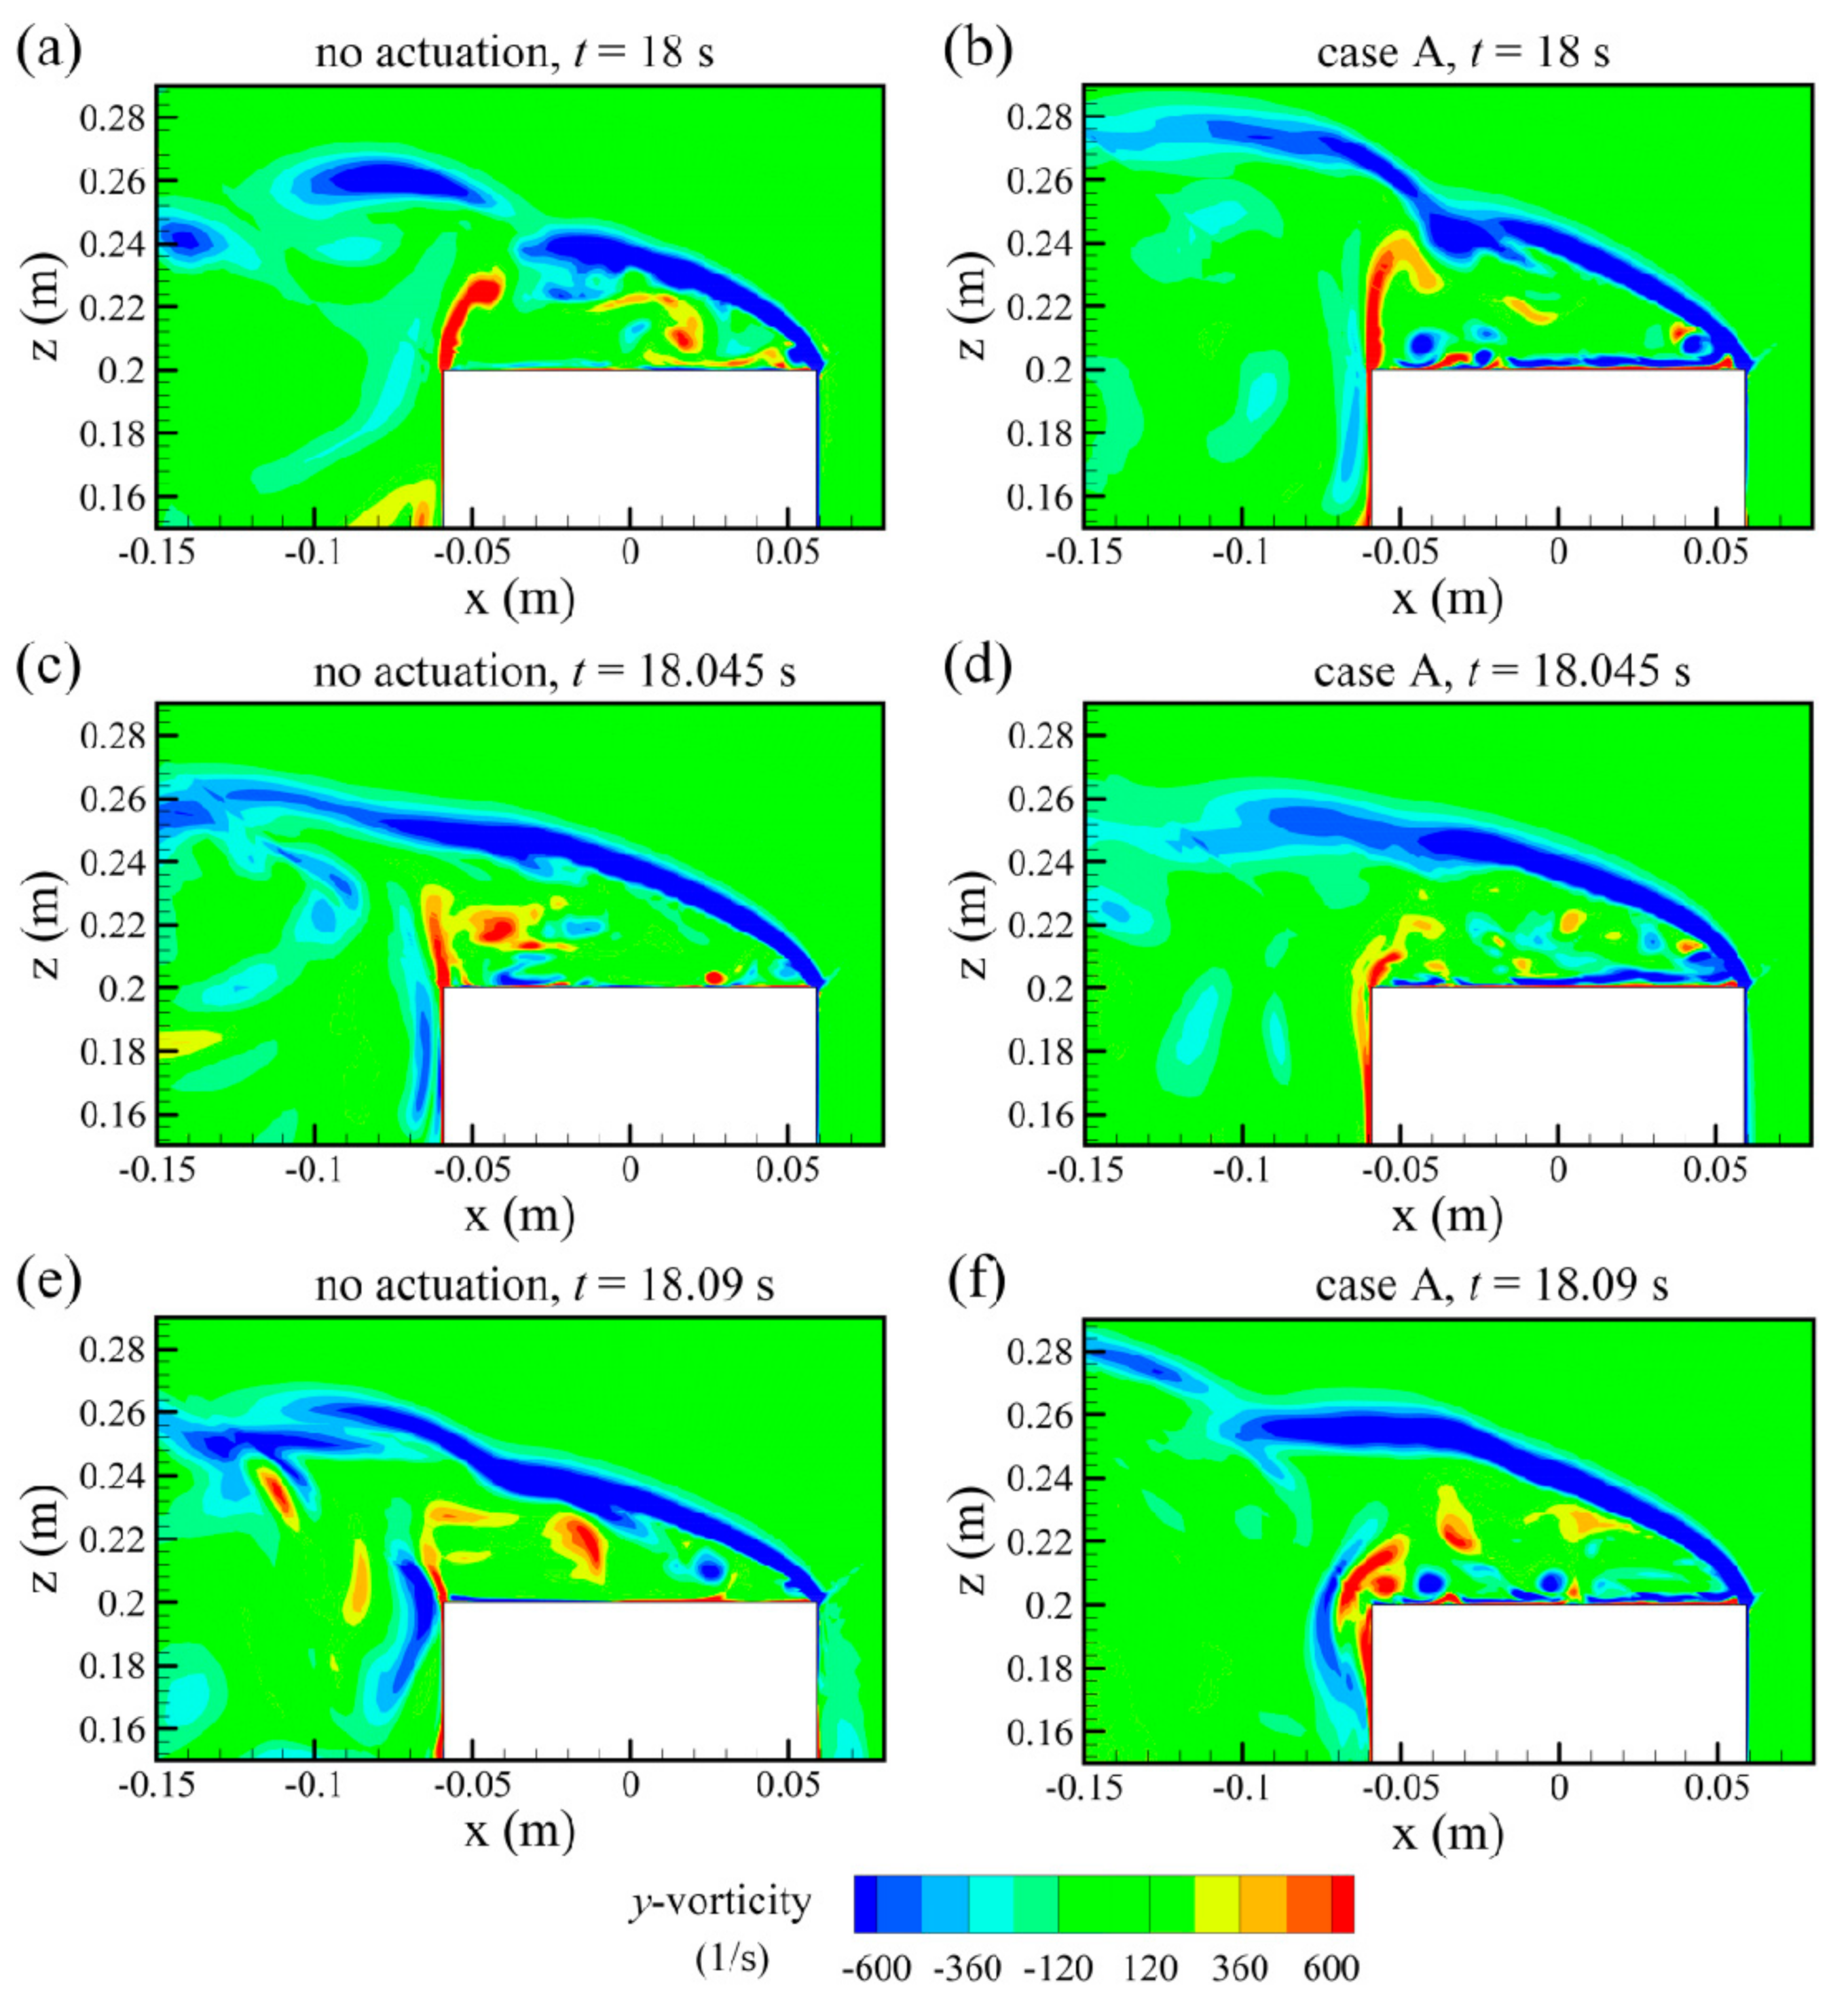
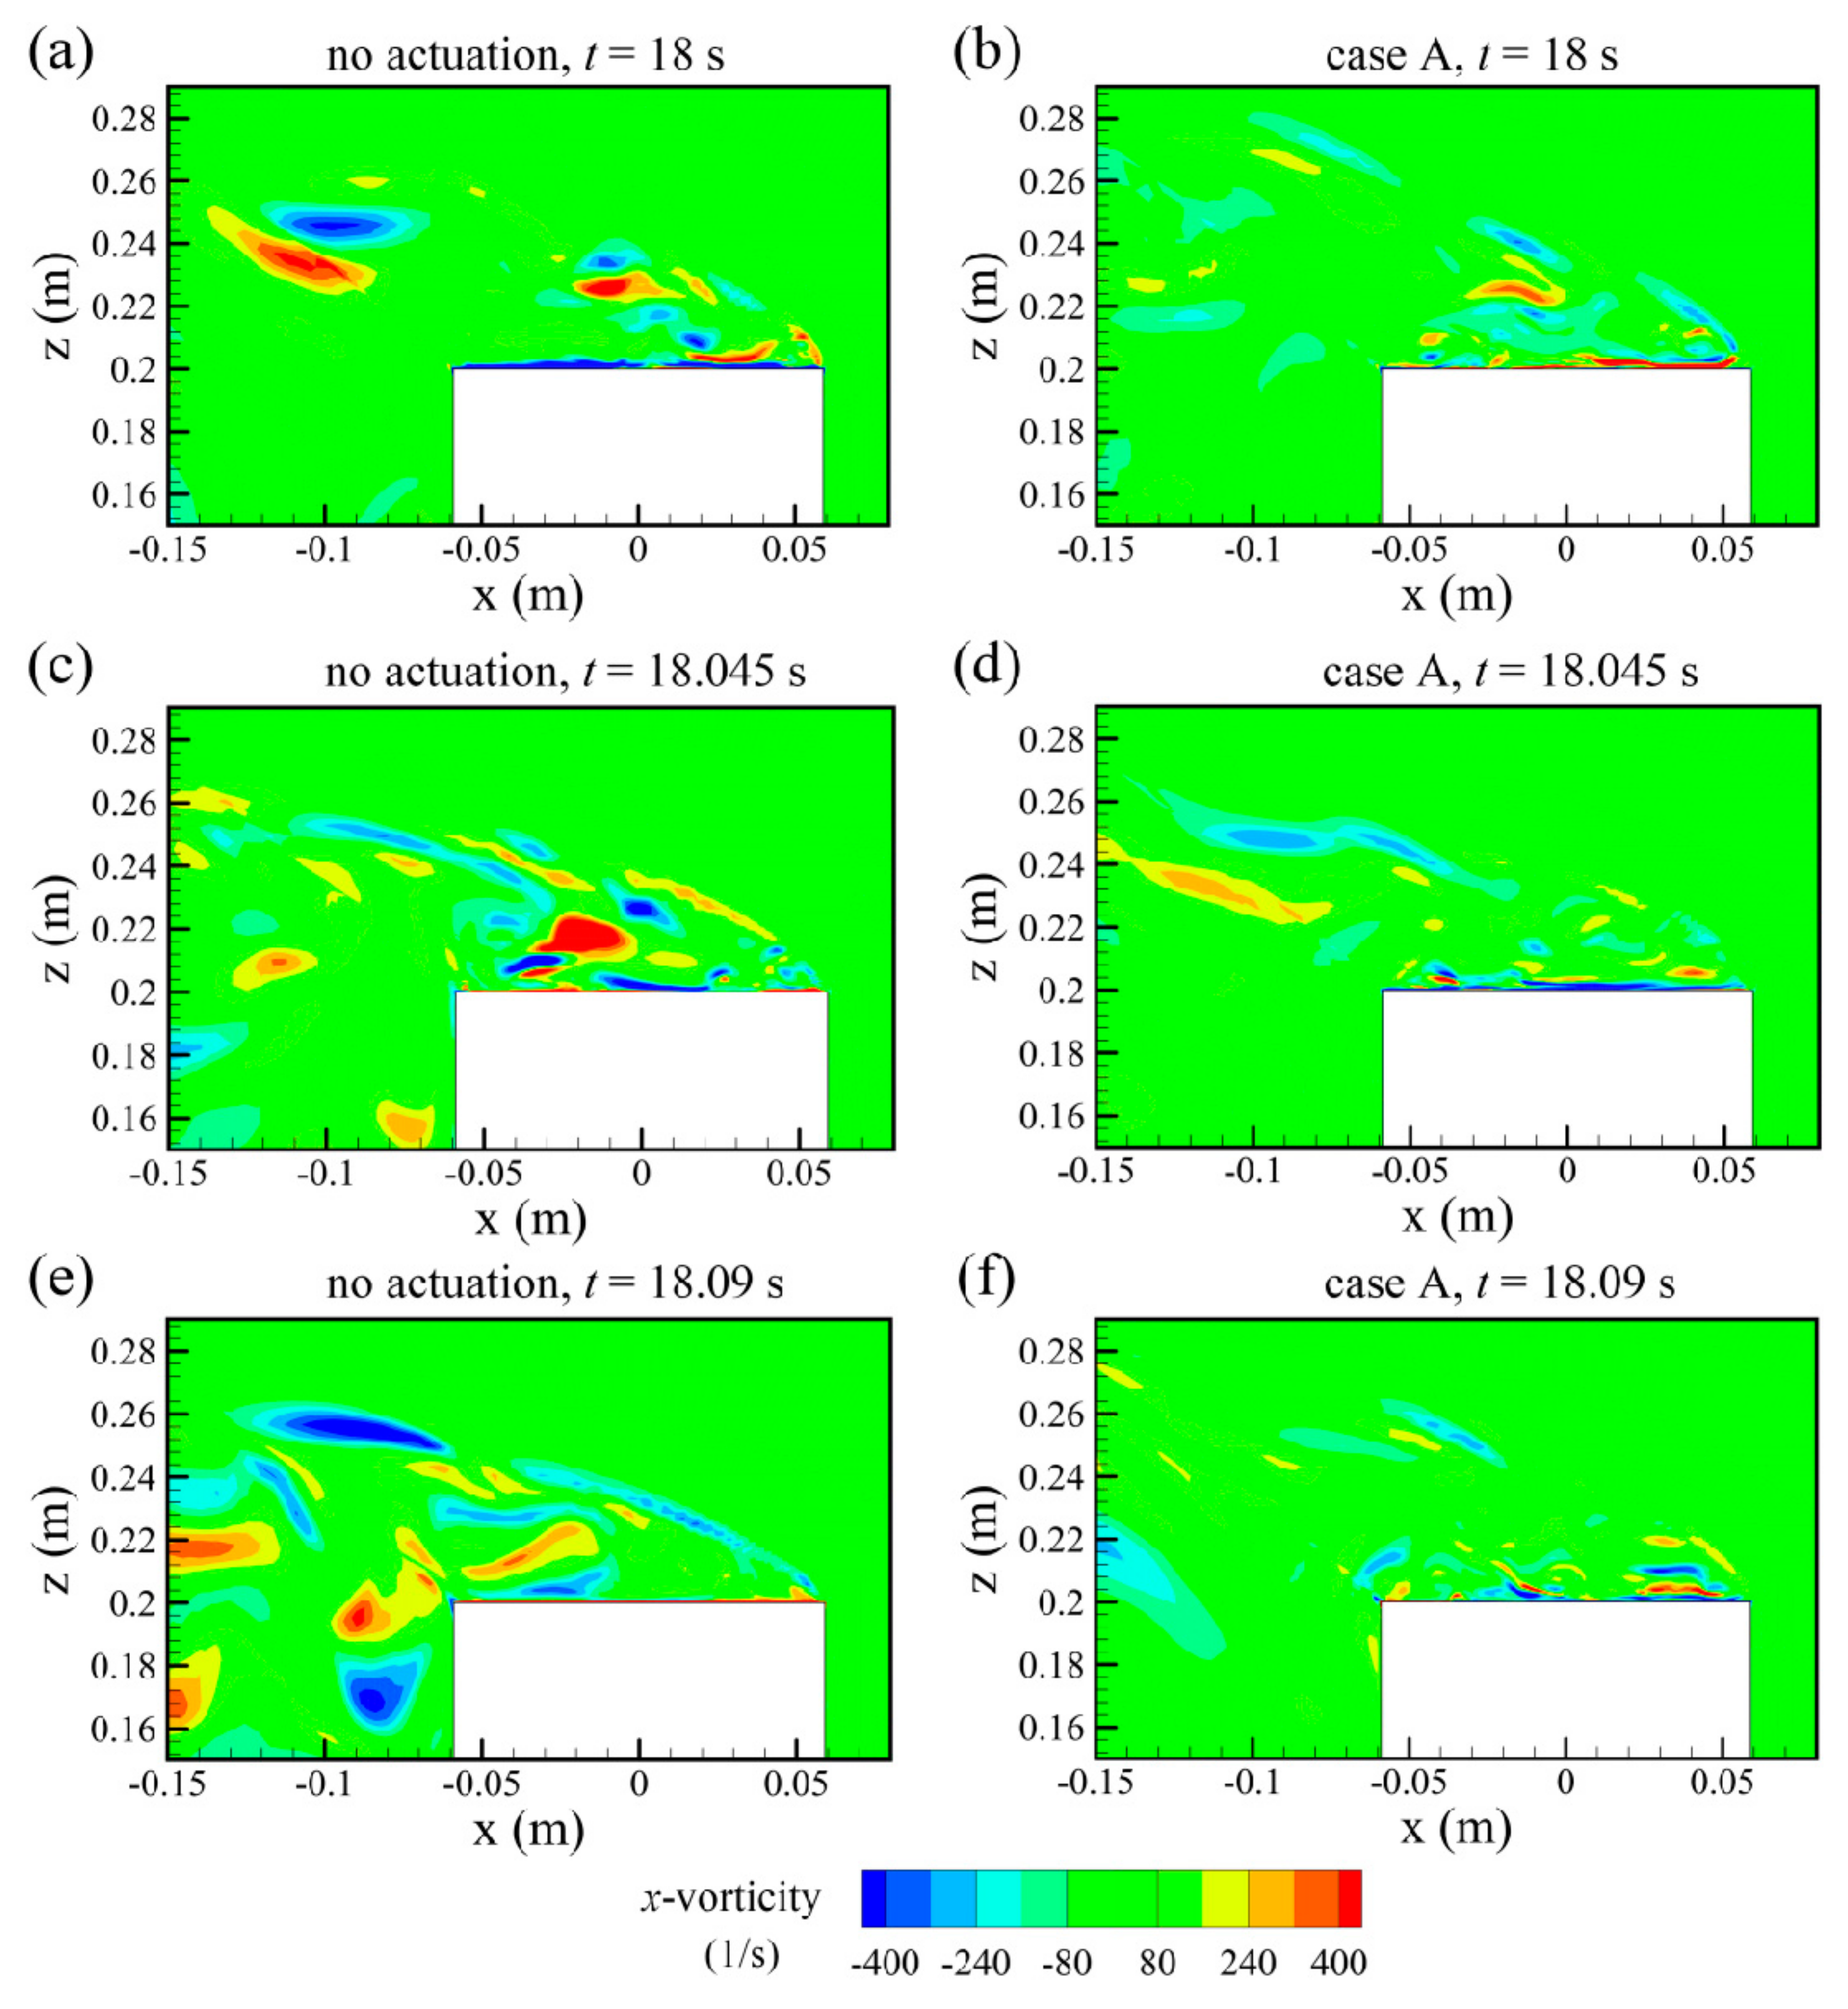
The influence of the wall jet on the shedding vortices is the key to understanding the reduction of the fluctuating pressure coefficient. In the recirculation region, the effect of the active actuators on the near-wall flow is much stronger than that of the incoming flow. Under the action of the wall jet, the small-scale spanwise vortices appear on the roof. These vortices suppress the intensity and size of streamwise shedding vortices produced by the flow separation at the leading edge, resulting in a reduction of the fluctuating pressure coefficient on most roof areas. Results show that after the actuators are ignited, the fluctuating pressure coefficient can be reduced by 20% at most from the no actuation situation.
The results of the investigations above show that multi-SDBD plasma actuators can provide an improvement in the wind-resistance performance for the roof of a low-rise building. Although simulations and related experiments in the present research are about a small-scale building model with a dimension of 100 to 200 mm, these results can supply a theoretical basis for more engineering applications. In future applications, plasma actuators may be placed vertically on the lateral sides of a high building to control the vortex shedding in the crosswind direction and reduce the aerodynamic drag. The annular plasma synthetic jet actuators with the outward jet direction may be used to address the edge effect on the building roof. The nanosecond pulsed plasma actuators can release large amounts of heat and generate shock waves, so they may be used to remove water droplets from the building surface in a high humidity environment. However, the actuators have the main disadvantage of a short lifetime as a result of the plasma etching of the dielectric material during the discharge process. The dielectric material should be further investigated to inhibit the dielectric surface oxidation and enhance the actuator performance.

Author Contributions

X.Z. conceived and designed the research, collected and analyzed data, and wrote and revised the paper. Z.L. provided the funding. F.S. guided the experiment. Z.Z. revised the translation. C.W. and J.H. supervised the research.

Funding

The work presented in this paper is supported by National Natural Science Foundation of China (No: 51478179; 51678233).

Conflicts of Interest

The authors declare no conflict of interest.

References

  1. Yuan, K.; Hui, Y.; Chen, Z. Effects of facade appurtenances on the local pressure of high-rise building. J. Wind. Eng. Ind. Aerodyn. 2018, 178, 26–37. [Google Scholar] [CrossRef]
  2. Bitsuamlak, G.T.; Warsido, W.; Ledesma, E.; Chowdhury, A.G. Aerodynamic Mitigation of Roof and Wall Corner Suctions Using Simple Architectural Elements. J. Eng. Mech. 2013, 139, 396–408. [Google Scholar] [CrossRef]
  3. Aly, A.-M.; Bresowar, J. Aerodynamic mitigation of wind-induced uplift forces on low-rise buildings: A comparative study. J. Build. Eng. 2016, 5, 267–276. [Google Scholar] [CrossRef]
  4. Li, G.; Gan, S.; Li, H. Wind Pressure Mitigation on Gable Roofs for Low-Rise Buildings Using Spoilers. J. Struct. Eng. 2018, 144, 04018104. [Google Scholar] [CrossRef]
  5. Zhang, H.; Xin, D.; Ou, J. Steady suction for controlling across-wind loading of high-rise buildings. Struct. Des. Tall Spéc. Build. 2016, 25, 785–800. [Google Scholar] [CrossRef]
  6. Wang, J.; Xu, Y.; Tian, Y. Active control of circular cylinder flow by affiliated rotating cylinders. Sci. China Ser. E Technol. Sci. 2013, 56, 1186–1197. [Google Scholar] [CrossRef]
  7. Qu, Y.; Sun, M.; Feng, L.; Pan, C.; Gao, Q.; He, G.; Wang, J. Wake vortex evolution of square cylinder with a slot synthetic jet positioned at the rear surface. J. Fluid Mech. 2017, 812, 940–965. [Google Scholar] [CrossRef]
  8. Kriegseis, J.; Möller, B.; Grundmann, S.; Tropea, C. Capacitance and power consumption quantification of dielectric barrier discharge (DBD) plasma actuators. J. Electrost. 2011, 69, 302–312. [Google Scholar] [CrossRef]
  9. Maden, I.; Maduta, R.; Kriegseis, J.; Jakirlić, S.; Schwarz, C.; Grundmann, S.; Tropea, C. Experimental and computational study of the flow induced by a plasma actuator. Int. J. Heat Fluid Flow 2013, 41, 80–89. [Google Scholar] [CrossRef]
  10. Dong, L.; Gao, G.; Peng, K.; Wei, W.; Li, C.; Wu, G. Effects of surface dielectric barrier discharge on aerodynamic characteristic of train. AIP Adv. 2017, 7, 075112. [Google Scholar] [CrossRef] [Green Version]
  11. Kopiev, V.F.; Kazansky, P.N.; Kopiev, V.A.; Moralev, I.A.; Zaytsev, M.Y.; Kazansky, P.; Moralev, I.; Zaytsev, M. HF DBD Plasma Actuators for Reduction of Cylinder Noise in Flow. J. Phys. D Appl. Phys. 2017, 50, 475204. [Google Scholar] [CrossRef]
  12. Sidorenko, A.A.; Budovskiy, A.D.; Maslov, A.A.; Postnikov, B.V.; Zanin, B.Y.; Zverkov, I.D.; Kozlov, V.V. Plasma control of vortex flow on a delta wing at high angles of attack. Exp. Fluids 2013, 54, 1–12. [Google Scholar] [CrossRef]
  13. Kotsonis, M.; Ghaemi, S. Experimental and numerical characterization of a plasma actuator in continuous and pulsed actuation. Sens. Actuators A Phys. 2012, 187, 84–94. [Google Scholar] [CrossRef]
  14. Shyy, W.; Jayaraman, B.; Andersson, A. Modeling of glow discharge-induced fluid dynamics. J. Appl. Phys. 2002, 92, 6434–6443. [Google Scholar] [CrossRef]
  15. Rizzetta, D.P.; Visbal, M.R. Large Eddy Simulation of Plasma-Based Control Strategies for Bluff Body Flow. AIAA J. 2009, 47, 717–729. [Google Scholar] [CrossRef]
  16. Zhang, Z.; Feng, L.; Wang, J.; Liu, P. Gurney-Flap Drag Penalty Reduction with a DBD Plasma Actuator. J. Aerosp. Eng. 2017, 30, 4017060. [Google Scholar] [CrossRef]
  17. Rizzetta, D.; Visbal, M. Plasma flow control simulations of a low-Reynolds number low-aspect-ratio wing. Comput. Fluids 2012, 70, 95–114. [Google Scholar] [CrossRef]
  18. Zhang, P.F.; Yan, B.; Liu, A.B.; Wang, J.J. Numerical Simulation on Plasma Circulation Control Airfoil. AIAA J. 2010, 48, 2213–2226. [Google Scholar] [CrossRef]
  19. Zhang, X.; Li, Z.; Wang, C.; Hu, J.; Zhou, L. Experimental and numerical analyses of multi-DBD plasma actuators to reduce wind loads and modify local flow on the roofs of low-rise buildings. AIP Adv. 2018, 8, 095314. [Google Scholar] [CrossRef] [Green Version]
  20. Abdulqadir, S.A.; Iacovides, H.; Nasser, A. The physical modelling and aerodynamics of turbulent flows around horizontal axis wind turbines. Energy 2016, 119, 1–33. [Google Scholar] [CrossRef]
  21. Shieh, T.-H. Study of influencing characteristics on boundary-layer separation controlled by using DBD plasma actuator with modified model. Int. J. Heat Mass Transf. 2017, 113, 1212–1233. [Google Scholar] [CrossRef]
  22. Mou, B.; He, B.-J.; Zhao, D.-X.; Chau, K.-W. Numerical simulation of the effects of building dimensional variation on wind pressure distribution. Eng. Appl. Comput. Fluid Mech. 2017, 11, 293–309. [Google Scholar] [CrossRef]
  23. Liu, J.; Niu, J. CFD simulation of the wind environment around an isolated high-rise building: An evaluation of SRANS, LES and DES models. Build. Environ. 2016, 96, 91–106. [Google Scholar] [CrossRef]
  24. Meng, F.-Q.; He, B.-J.; Zhu, J.; Zhao, D.-X.; Darko, A.; Zhao, Z.-Q. Sensitivity analysis of wind pressure coefficients on CAARC standard tall buildings in CFD simulations. J. Build. Eng. 2018, 16, 146–158. [Google Scholar] [CrossRef]
  25. Santhanakrishnan, A.; Jacob, J.D.; Suzen, Y. Flow control using plasma actuators and linear/annular plasma synthetic jet actuators. In Proceedings of the 3rd AIAA Flow Control Conference, San Francisco, CA, USA, 5–8 June 2006. [Google Scholar]
  26. Ebrahimi, A.; Movahhedi, M. Power improvement of NREL 5-MW wind turbine using multi-DBD plasma actuators. Energy Convers. Manag. 2017, 146, 96–106. [Google Scholar] [CrossRef]
  27. Terres-Nicoli, J.M.; Kopp, G.A. Mechanisms of the vertical vortex induced vibration of the Storebælt Bridge. In Proceedings of the 11th Americas Conference on Wind Engineering, San Juan, Puerto Rico, 22–26 June 2009. [Google Scholar]
  28. Castro, I.P.; Robins, A.G. The flow around a surface-mounted cube in uniform and turbulent streams. J. Fluid Mech. 1977, 79, 307–335. [Google Scholar] [CrossRef]
  29. Ito, S.; Okuda, Y.; Kikitsu, H.; Ohashi, M.; Taniguchi, T.; Taniike, Y. Experimental study on flow and pressure fields over the roof of a cube by PIV measurements. In Proceedings of the Fourth International Symposium on Computational Wind Engineering, Yokohama, Japan, 16–19 July 2006; pp. 435–438. [Google Scholar]
  30. Xin, D.; Zhang, H.; Ou, J. Secondary wake instability of a bridge model and its application in wake control. Comput. Fluids 2018, 160, 108–119. [Google Scholar] [CrossRef]
  31. Tominaga, Y.; Akabayashi, S.-I.; Kitahara, T.; Arinami, Y. Air flow around isolated gable-roof buildings with different roof pitches: Wind tunnel experiments and CFD simulations. Build. Environ. 2015, 84, 204–213. [Google Scholar] [CrossRef]
Figure 1. Plasma active region in the phenomenological model.
Applsci 09 03493 g001
Figure 2. The building model and actuator configurations [19]: (a) reference model; (b) cross-sectional scheme of three actuator configurations.
Applsci 09 03493 g002
Figure 3. Computational domain and grid arrangement: (a) side view and top view; (b) grids for each zone; (c) grids on the roof surface, where the normalized minimal grid size ∆z/h is 0.0003; (d) grids on the windward wall, where the normalized minimal grid size ∆z/h is 0.00037.
Applsci 09 03493 g003
Figure 4. Profiles of mean velocity and turbulence intensity under different wind speeds U: (a) U = 4 m/s; (b) U = 7 m/s; (c) U = 10 m/s.
Applsci 09 03493 g004
Figure 5. Comparison of mean pressure coefficients along the roof centerline obtained with (a) four subgrid-scale models and (b) five discretization schemes.
Applsci 09 03493 g005
Figure 6. Mean pressure coefficient change rates along the roof centerline: (a) case A with the wall-jet direction from the trailing edge to the leading edge; (b) case B with the wall-jet direction from the middle of the roof to the leading and trailing edges; (c) case C with the wall-jet direction from the leading and trailing edges to the middle of the roof.
Applsci 09 03493 g006
Figure 7. Velocity magnitude contours: (a) case A; (b) case B; (c) case C.
Applsci 09 03493 g007
Figure 8. Velocity component contours: (a,b) case A; (c,d) case B; (e,f) case C.
Applsci 09 03493 g008
Figure 9. Pressure contours: (a) case A; (b) case B; (c) case C.
Applsci 09 03493 g009
Figure 10. Time histories of drag coefficients: (a) no actuation and case A; (b) no actuation and case B; (c) no actuation and case C.
Applsci 09 03493 g010
Figure 11. Power spectral density of RMS drag coefficient.
Applsci 09 03493 g011
Figure 12. Contours of the mean pressure coefficient and its change rate on the whole roof: (a) no actuation; (b,c) case A; (d,e) case B; (f,g) case C.
Applsci 09 03493 g012
Figure 13. Contours of the fluctuating pressure coefficient and its change rate on the whole roof: (a) no actuation; (b,c) case A; (d,e) case B; (f,g) case C.
Applsci 09 03493 g013
Figure 14. Contours of mean x-velocity component: (a) no actuation; (b) case A; (c) case B; (d) case C.
Applsci 09 03493 g014
Figure 15. RMS velocity contours: (a) no actuation; (b) case A; (c) case B; (d) case C.
Applsci 09 03493 g015
Figure 16. Evolution of instantaneous y-vorticity component with the time t: (a,b) t = 18 s; (c,d) t = 18.045 s; (e,f) t = 18.09 s.
Applsci 09 03493 g016
Figure 17. Evolution of instantaneous x-vorticity component with the time t: (a,b) t = 18 s; (c,d) t = 18.045 s; (e,f) t = 18.09 s.
Applsci 09 03493 g017
Figure 18. Contours of mean skin friction coefficients on the building surfaces with different cases. (a) no actuation; (b) case A; (c) case B; (d) case C.
Applsci 09 03493 g018
Table 1. Grid independence test of the computational domain with three different mesh numbers.
Grid No.Mesh Numbers
(Million)
Δz/hΔy/hMean CdMean ClRMS CdRMS ClSt
Grid-12.780.00060.02−2.190.5580.1470.1050.207
Grid-24.470.00030.01−2.220.5650.1520.1100.196
Grid-36.360.00010.0075−2.200.5610.1500.1060.191
z/h means the dimensionless first mesh size adjacent to the roof surface, Δy/h means the dimensionless mesh size close to the building surface in the y-axis direction, Mean Cd and Mean Cl represent the mean drag and lift coefficients, respectively, RMS Cd and RMS Cl represent the fluctuating drag and lift coefficients, respectively, St is the Strouhal number.)
Table 2. Mean and RMS values of drag and lift coefficients.
No ActuationCase ACase BCase C
Mean Cd−2.22−2.21−2.21−2.23
Mean Cl0.5650.5400.5610.560
RMS Cd0.1520.1280.1370.137
RMS Cl0.1100.0930.1030.099
St0.1960.1480.1910.209

