1. Introduction
The industrialisation of buildings is the future direction for the development of the construction industry, and this transformation will allow for sustainable development of the construction industry. Prefabricated shear wall structure systems are widely used in high-rise buildings, which can reduce resource consumption and facilitate environmental protection. In prefabricated buildings, the connections are critical for the mechanical performance of the structure in meizoseismal areas [
1], particularly the vertical connection of the components, the quality and reliability of the connection are crucial to the architecture.
Various precast building connection methods have been proposed by scholars, and their tensile properties have been evaluated, including grouted sleeve connections, etc. [
2,
3,
4]. The grouted sleeve has been developed [
5,
6], and its uniaxial tensile properties have been extensively studied [
7,
8,
9,
10]. Research has shown that the bearing capacity is affected by the grouted sleeve strength, grout strength, rebar diameter, and bond strength [
11]. The bond strength of the grout and rebar plays a key role in determining the bearing capacity, and has thus attracted the attention of researchers. In addition, a novel grouted rolling pipe splice has been proposed and its mechanical performance has been tested [
12,
13]. A plug-in filling hole for lap-joint steel bars, was tested considering the rebar diameter, anchor length, and concrete strength, and the results indicated that the connection was reliable [
14]. In design theory, the anchoring test was carried out and the calculation formula of the lap length design was given based on the reliability analysis [
15], including straight reinforcement and mechanical anchoring. Liu [
16] carried out the pull-out test on grouted-filled lap splice, and established the formula for calculating the ultimate overlap length, and carried out reliability analysis based on the central point method. Both had given the anchor length with reliability guarantee. In the above connections, the complicated joining processes and expensive connecting equipment greatly increases the cost, and the research also indicated that the connection had anchor failure due to the poor interval quality of the connection. Therefore, the concealed operation of the above connection method has a certain degree of security risks in application.
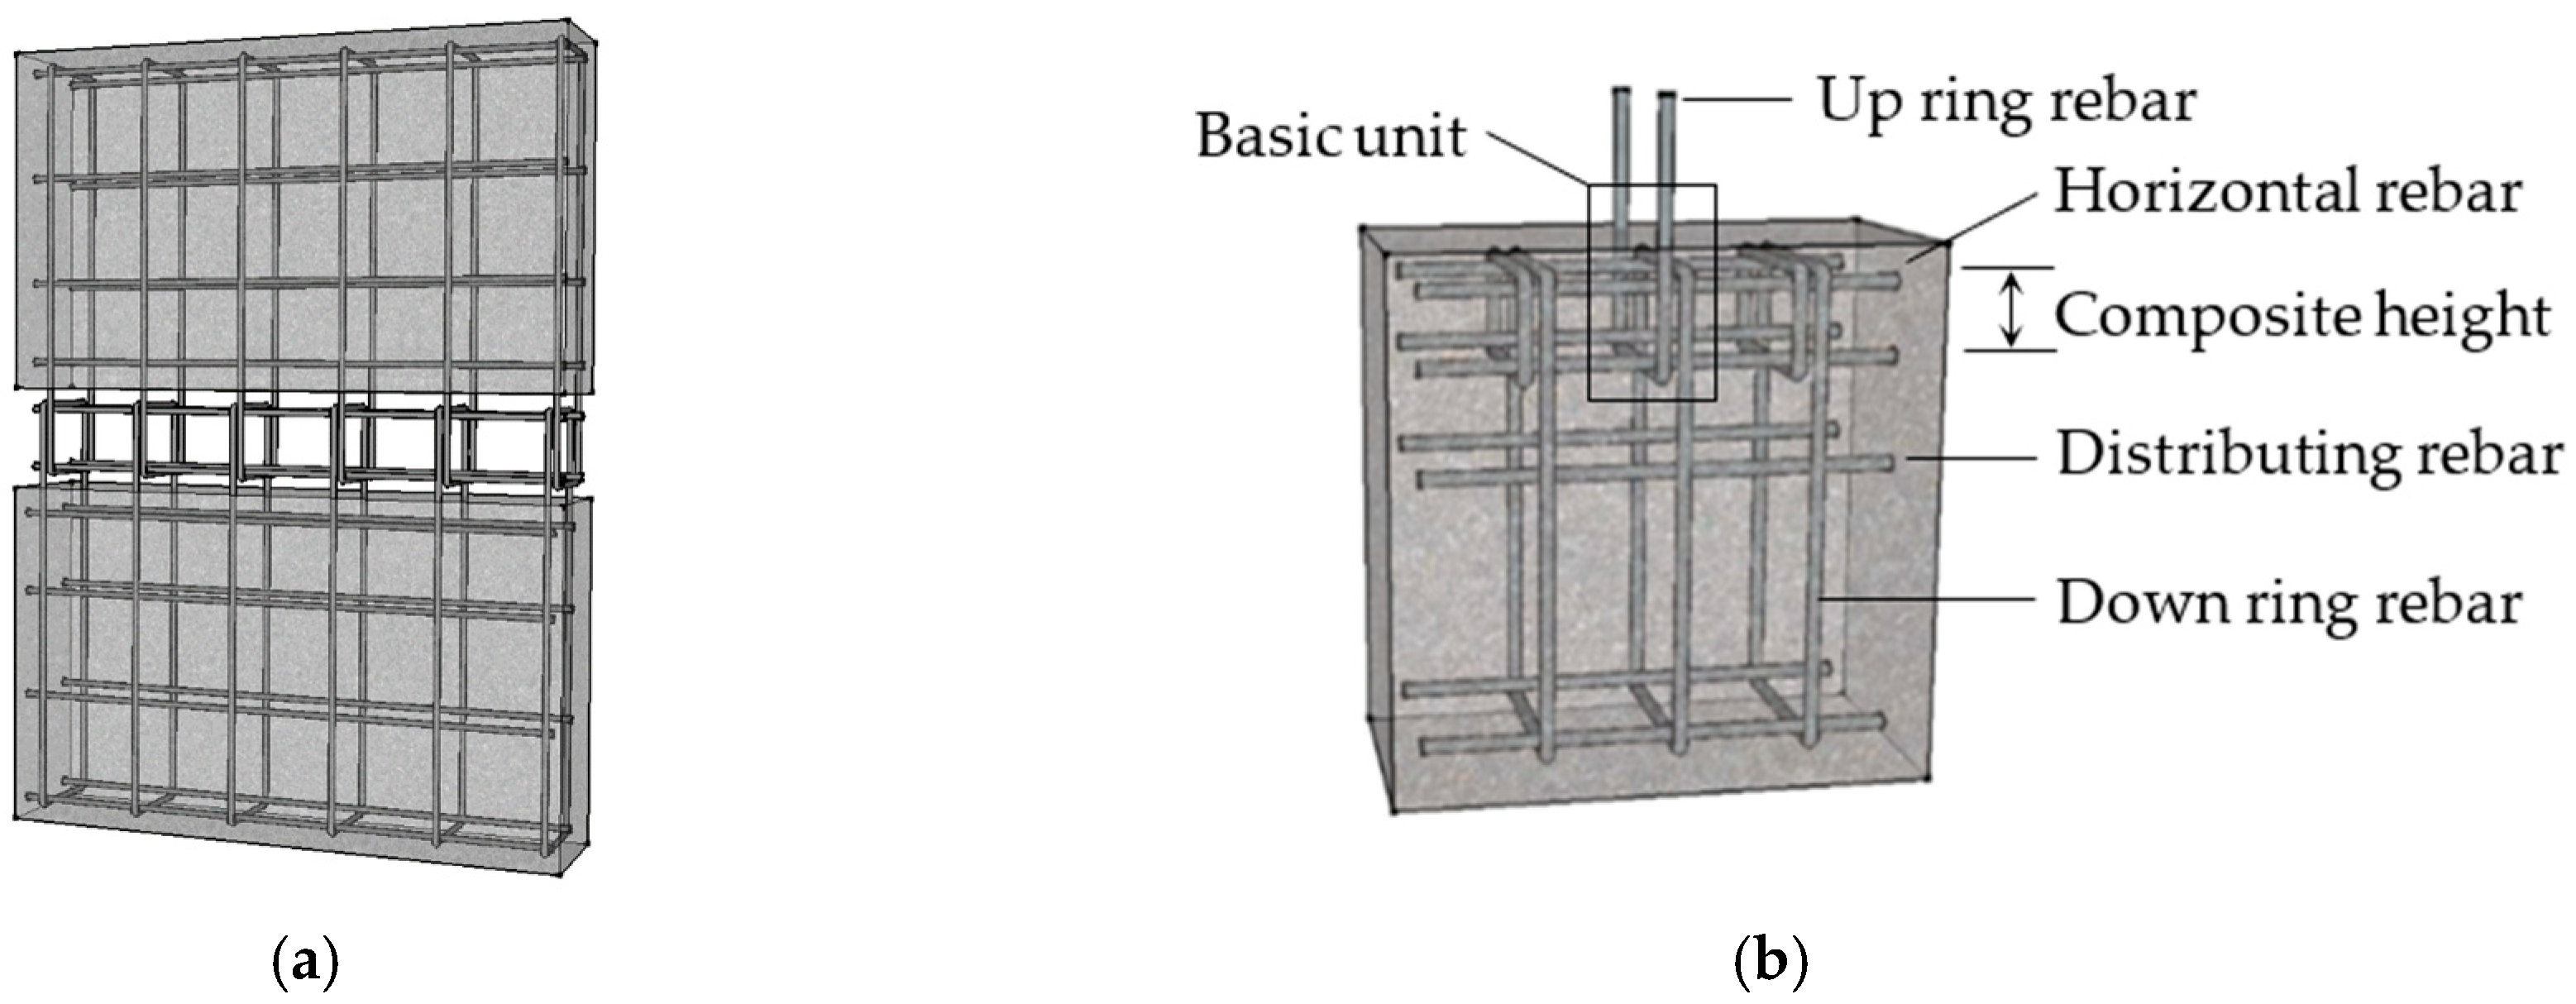
A new connection called ring joint comprising interlocked ring rebar and inserted horizontal rebar has been proposed. The connection area is poured on-site, and a continuous beam is then formed, which strengthens the joining area significantly, as shown in
Figure 1a. This connection saves the sleeve consumption, and there are no concealed operations, which can guarantee the quality and reliability under reasonable design conditions. In research, Lu [
17] conducted cyclic tests considering the height–width ratio and the joining height with the connecting area in the middle of the walls, and the results indicated that the connection was safe. To evaluate the mechanical performance, cyclic in-plane tests [
18] and the flexural out-of-plane tests [
19] were conducted when the connection was applied to the bottom of the shear wall. The above experimental research indicates that the joint can meet the relevant specifications in China. There is still a lack of research on mechanical mechanism and application of anchor design, so further research is necessary.
In this paper, the pull-out test was carried out to evaluate the anchoring performance. The mechanism was clear and the bearing capacity model could predict the bearing capacity well. Anchor length was determined based on reliability analysis and design suggestions were proposed, which could promote the application of the connection technology.
2. Experimental Research
Pull-out test was carried out to evaluate the bearing capacity, and composite height and relative horizontal position were taken into consideration. Ring rebar pull-out and fracture were observed, and data was analyzed. The connection could work well under reasonable design.
2.1. Model Deign and Properties Test
Each specimen consists of three basic units and its dimension is 400 × 200 × 400 mm considering the characteristics of the joint, and a schematic diagram in
Figure 1b is used to show interval details. Composite height is the overlap size of the up and down rebars, and four levels is taken into consideration, as shown in
Table 1, and each group consists of three specimens. Horizontal position is the relative horizontal position of the up and down rebars in one basic unit, and it consists of adjacent and interval arrangement. The specification of rebars is HRB400. The concrete specification in all groups is C30.
The mechanical properties of the rebar were obtained, and the results are summarised in
Table 2. Concrete test pieces with dimensions of 150 mm × 150 mm × 150 mm were prepared during pouring and subjected to the same maintenance conditions. The concrete cube compressive strength and elastic modulus are 37.04 MPa and 3.19×10⁴ N/mm
2, respectively.
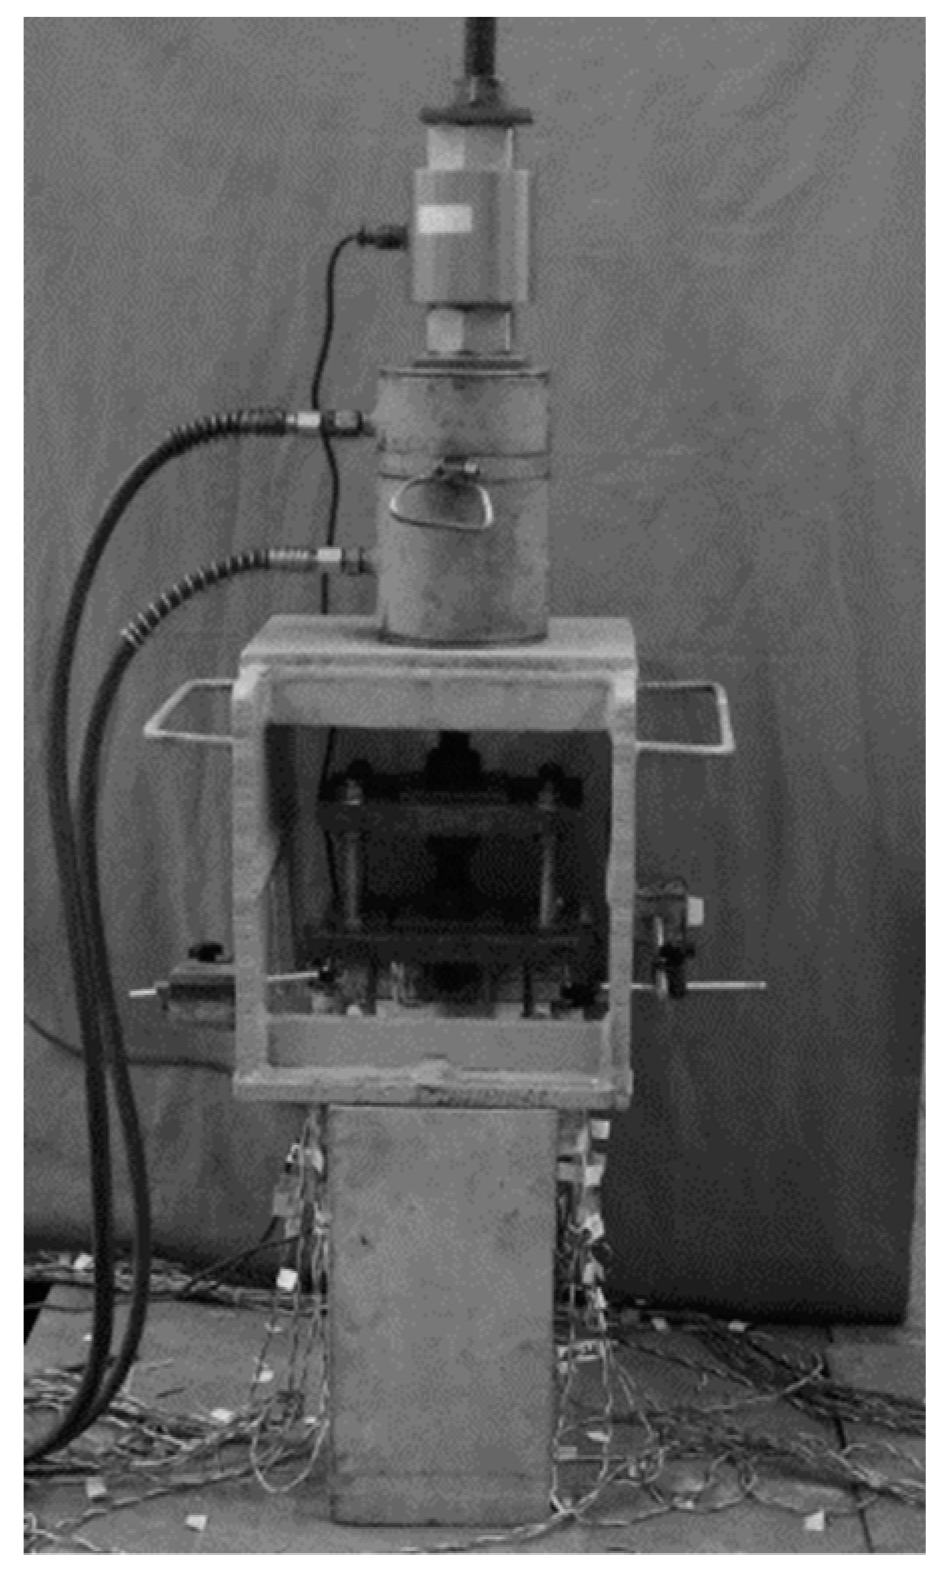
2.2. Test and Measuring Device
The test setup and measurement is illustrated in
Figure 2 and
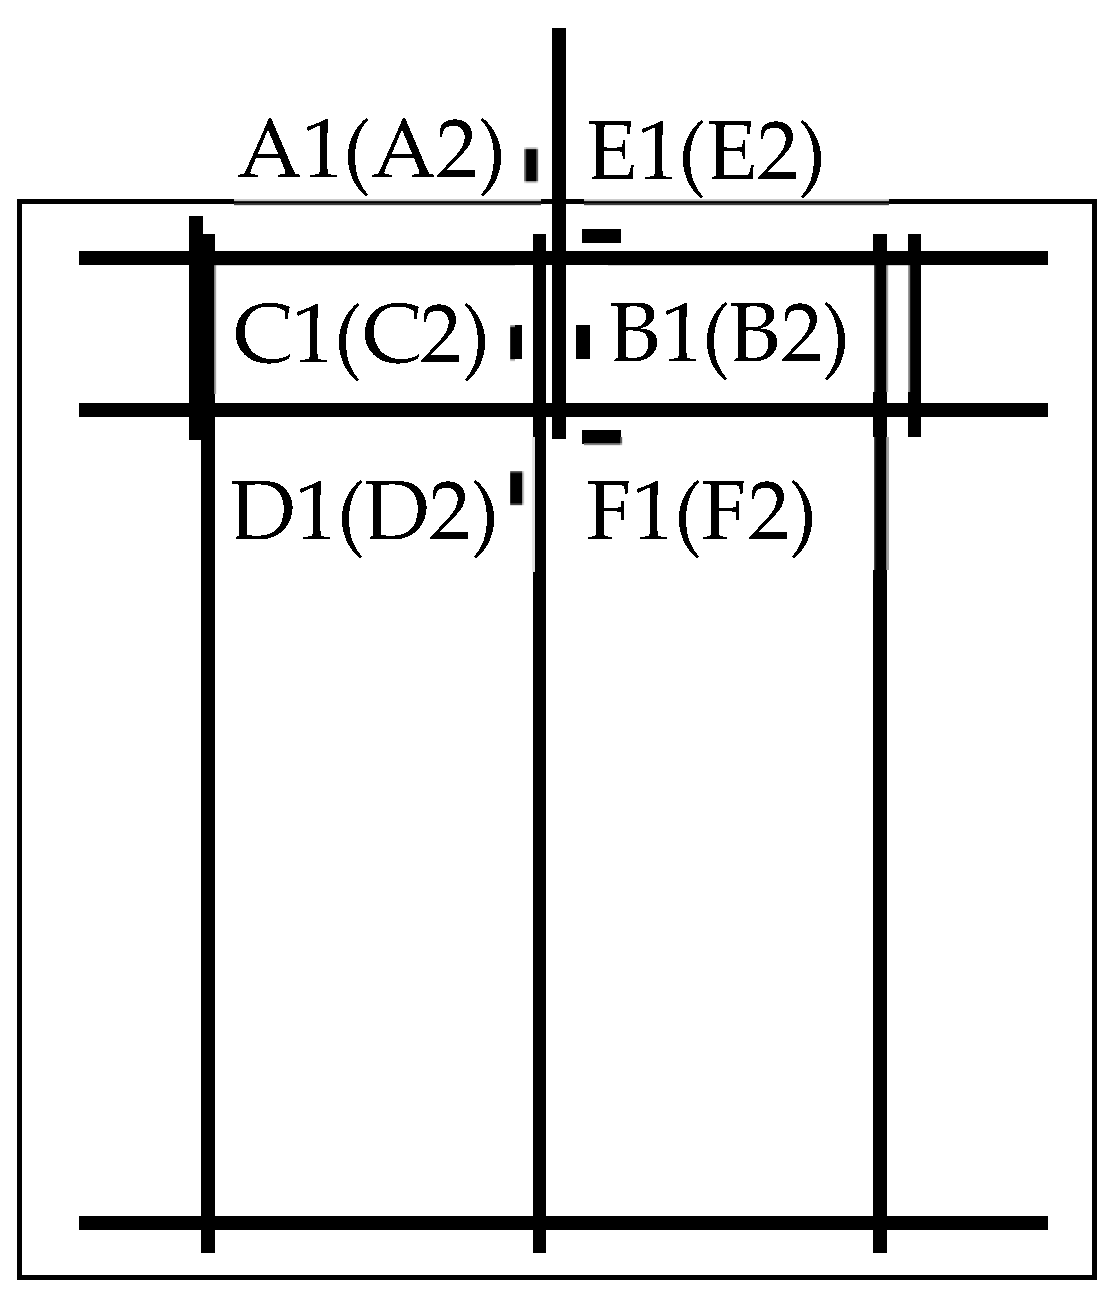
Figure 3. To achieve synchronous loading, a steel plate was welded to the rebar at a distance of 100 mm from the test piece. A reaction frame device was designed for counter force loading. The test piece, reaction frame, hydraulic jack, and force sensor were connected by steel rods. A preloading of 5 kN was implemented to detect the loading and collecting devices. In the official loading, the loading was slowly increased until the specimen had broken and the test was stopped when the ring rebar fractured or the bearing capacity decreased to 85% of the peak load. Two sensors were arranged on both sides of the specimen to measure the displacement of the rebars, and the strain values were recorded by gauges (
Figure 3) arranged for mechanical analysis and numerical model validation. The force, displacement, and strain were all recorded simultaneously.
2.3. Results Analysis
2.3.1. Phenomena and Modes
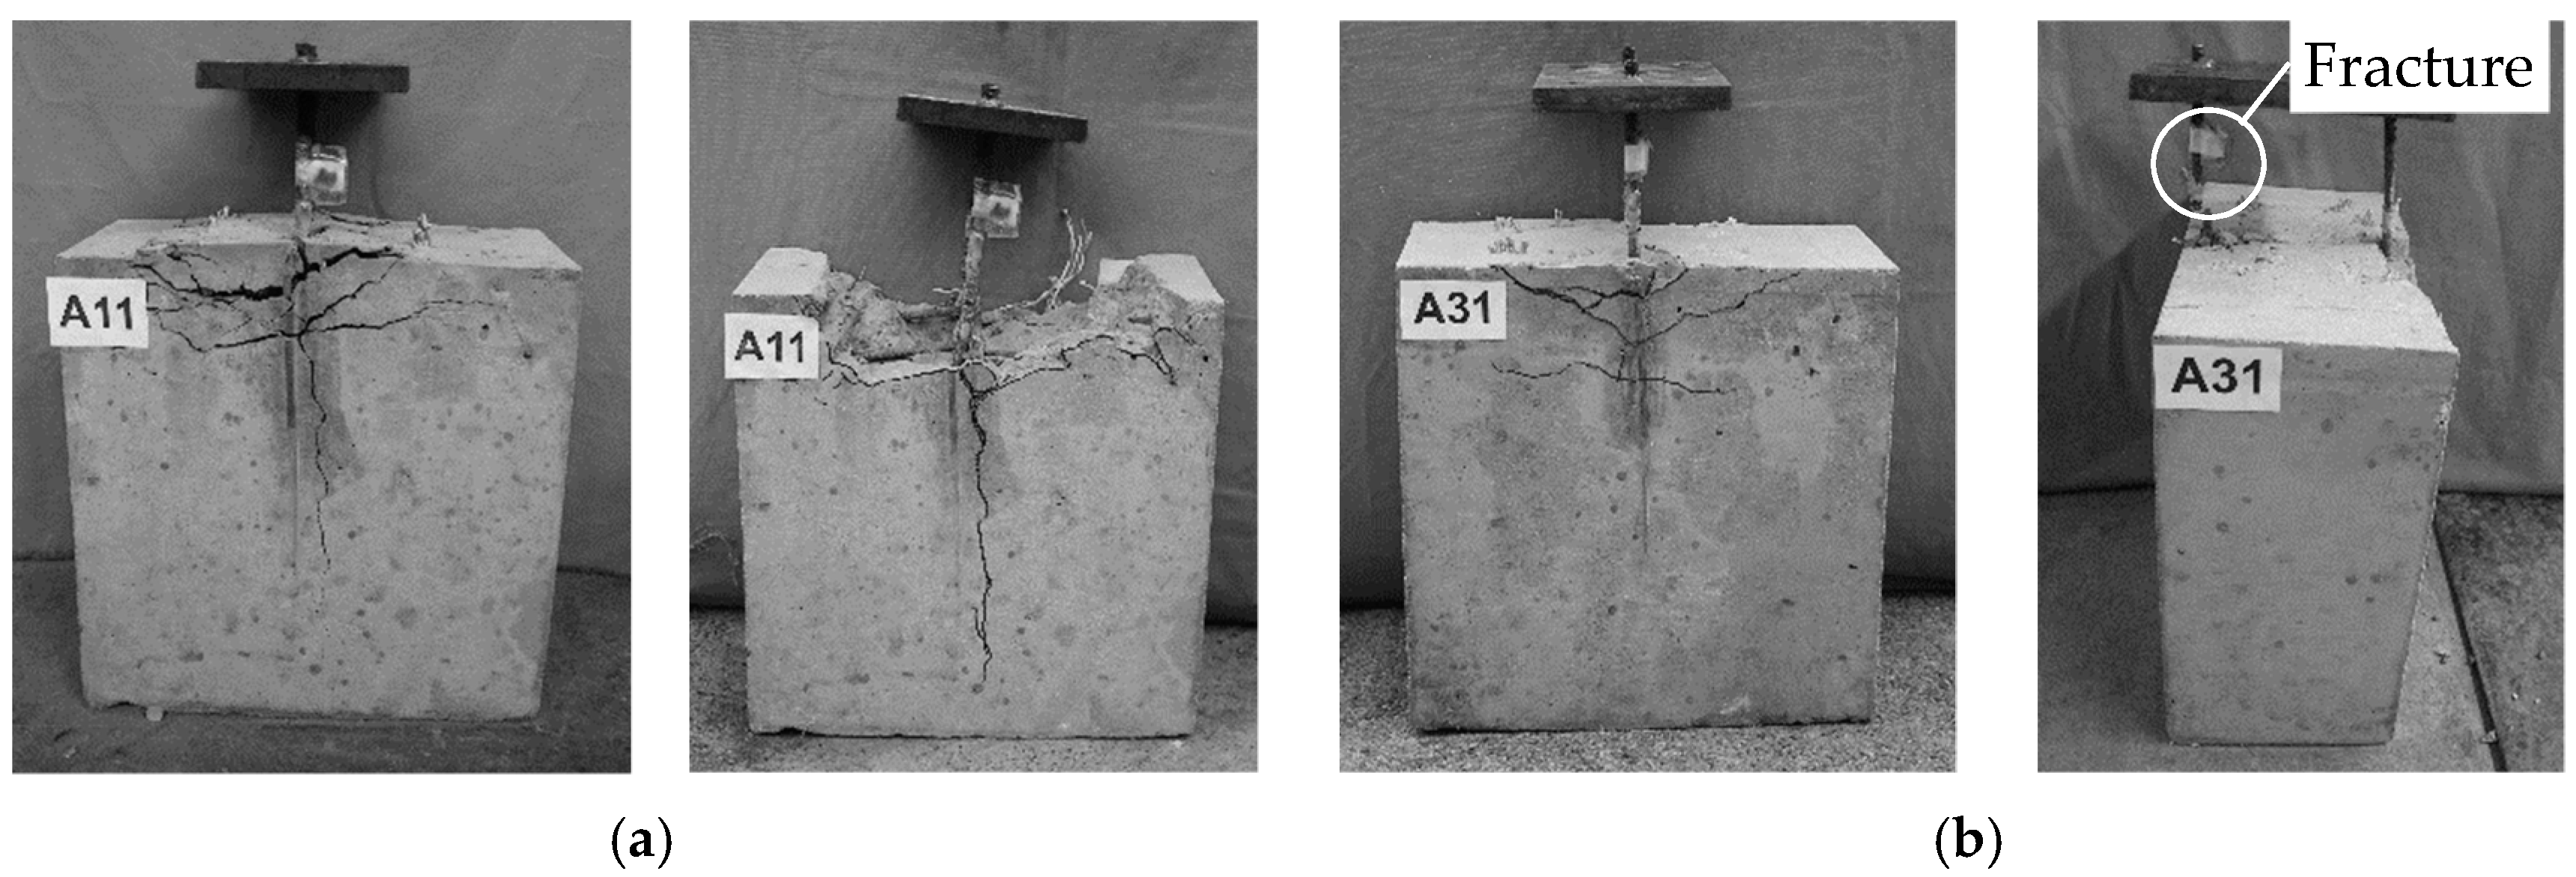
Two failure modes were observed including ring rebar pull-out and ring rebar fracture, the former mode occurred in group A1 and the latter mode occurred in other groups. In this section, A11 and A31 are chosen as being representative to show the details in loading.
Specimen A11 was in the elastic stage until 40 kN, then some cracks appeared around the up-ring rebars, and some cross cracks were observed on the surface of the concrete. Some V-shaped cracks appeared on both sides when loaded to 43 kN. After that, the cracks developed rapidly and reached 5 mm, and the up-ring rebar and horizontal rebars yielded at 46 kN and 50 kN respectively. When loaded to 70 kN, more vertical run-through cracks appeared at the down-ring rebar position. The up-ring rebar was pull-out at a load of 81 kN, and concrete spalling and inverted V-shaped deformation of horizontal rebars were observed. The crack and failure mode are shown in
Figure 4a. Specimen A31 was initially in the elastic phase, as was A11. Up-ring rebar yielded when loaded to 46 kN, some cracks appeared around the rebars and gradually developed into oblique cracks at 52 kN. V-shaped cracks appeared on both sides when loaded to 58 kN, and cracks increased with loading. The horizontal rebar yielded at 63 kN, and horizontal cracks appeared at the down-ring rebar position when loaded to 65 kN. Up-ring rebar yielded when loaded to 80 kN, 92 kN was recorded as the ultimate load when one side of rebar fractured, while the horizontal rebars were always in the flexible phase. The final failure mode are shown in
Figure 4b.
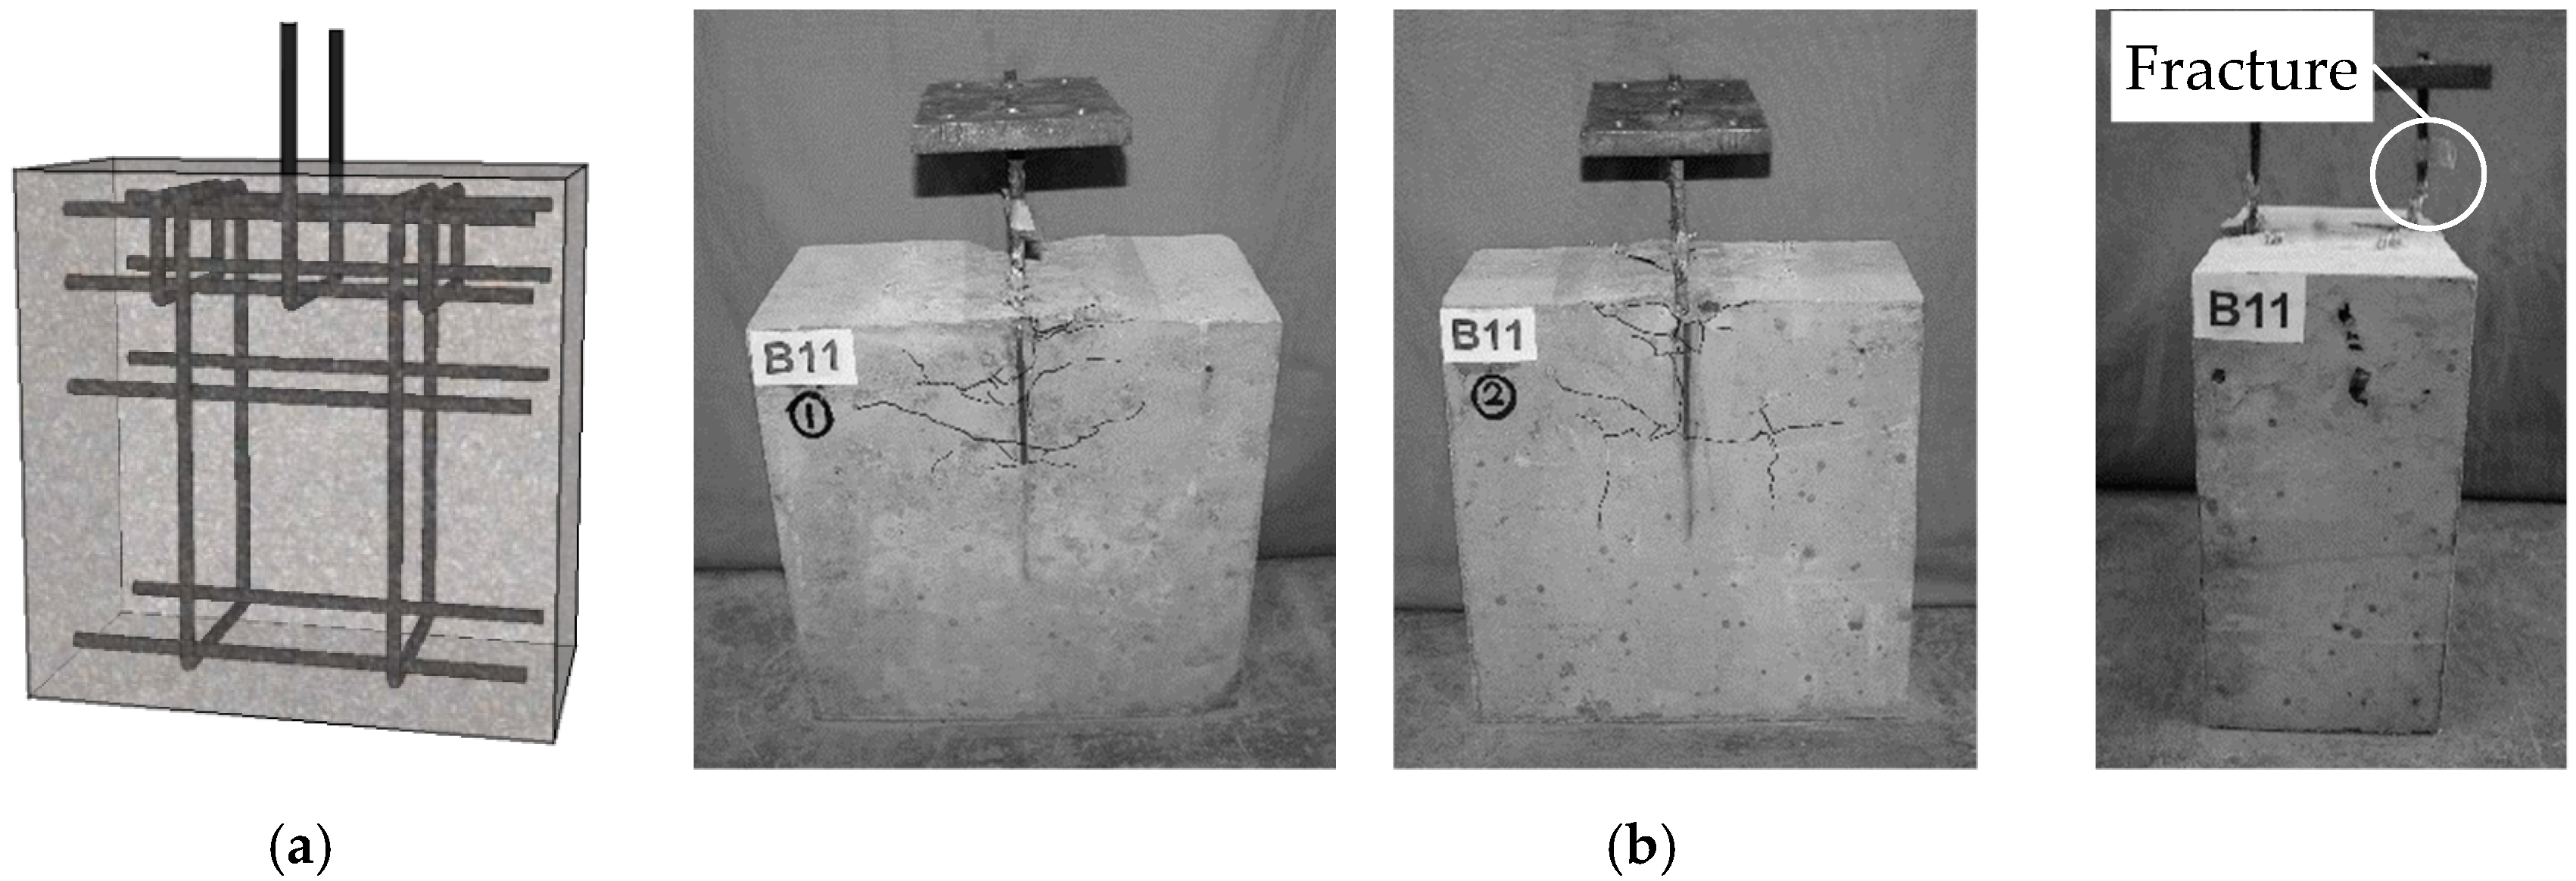
The interval arrangement was shown in
Figure 5a, and the damage process was basically the same as the specimens in group A3 and ring rebar fracture occurred. A number of vertical cracks appeared at the down-ring rebar position and horizontal cracks appeared at the down horizontal rebars in final failure mode. Obviously, this arrangement is an unfavorable factor. The crack and failure mode are shown in
Figure 5.
2.3.2. Bearing Capacity and Deformation Performance
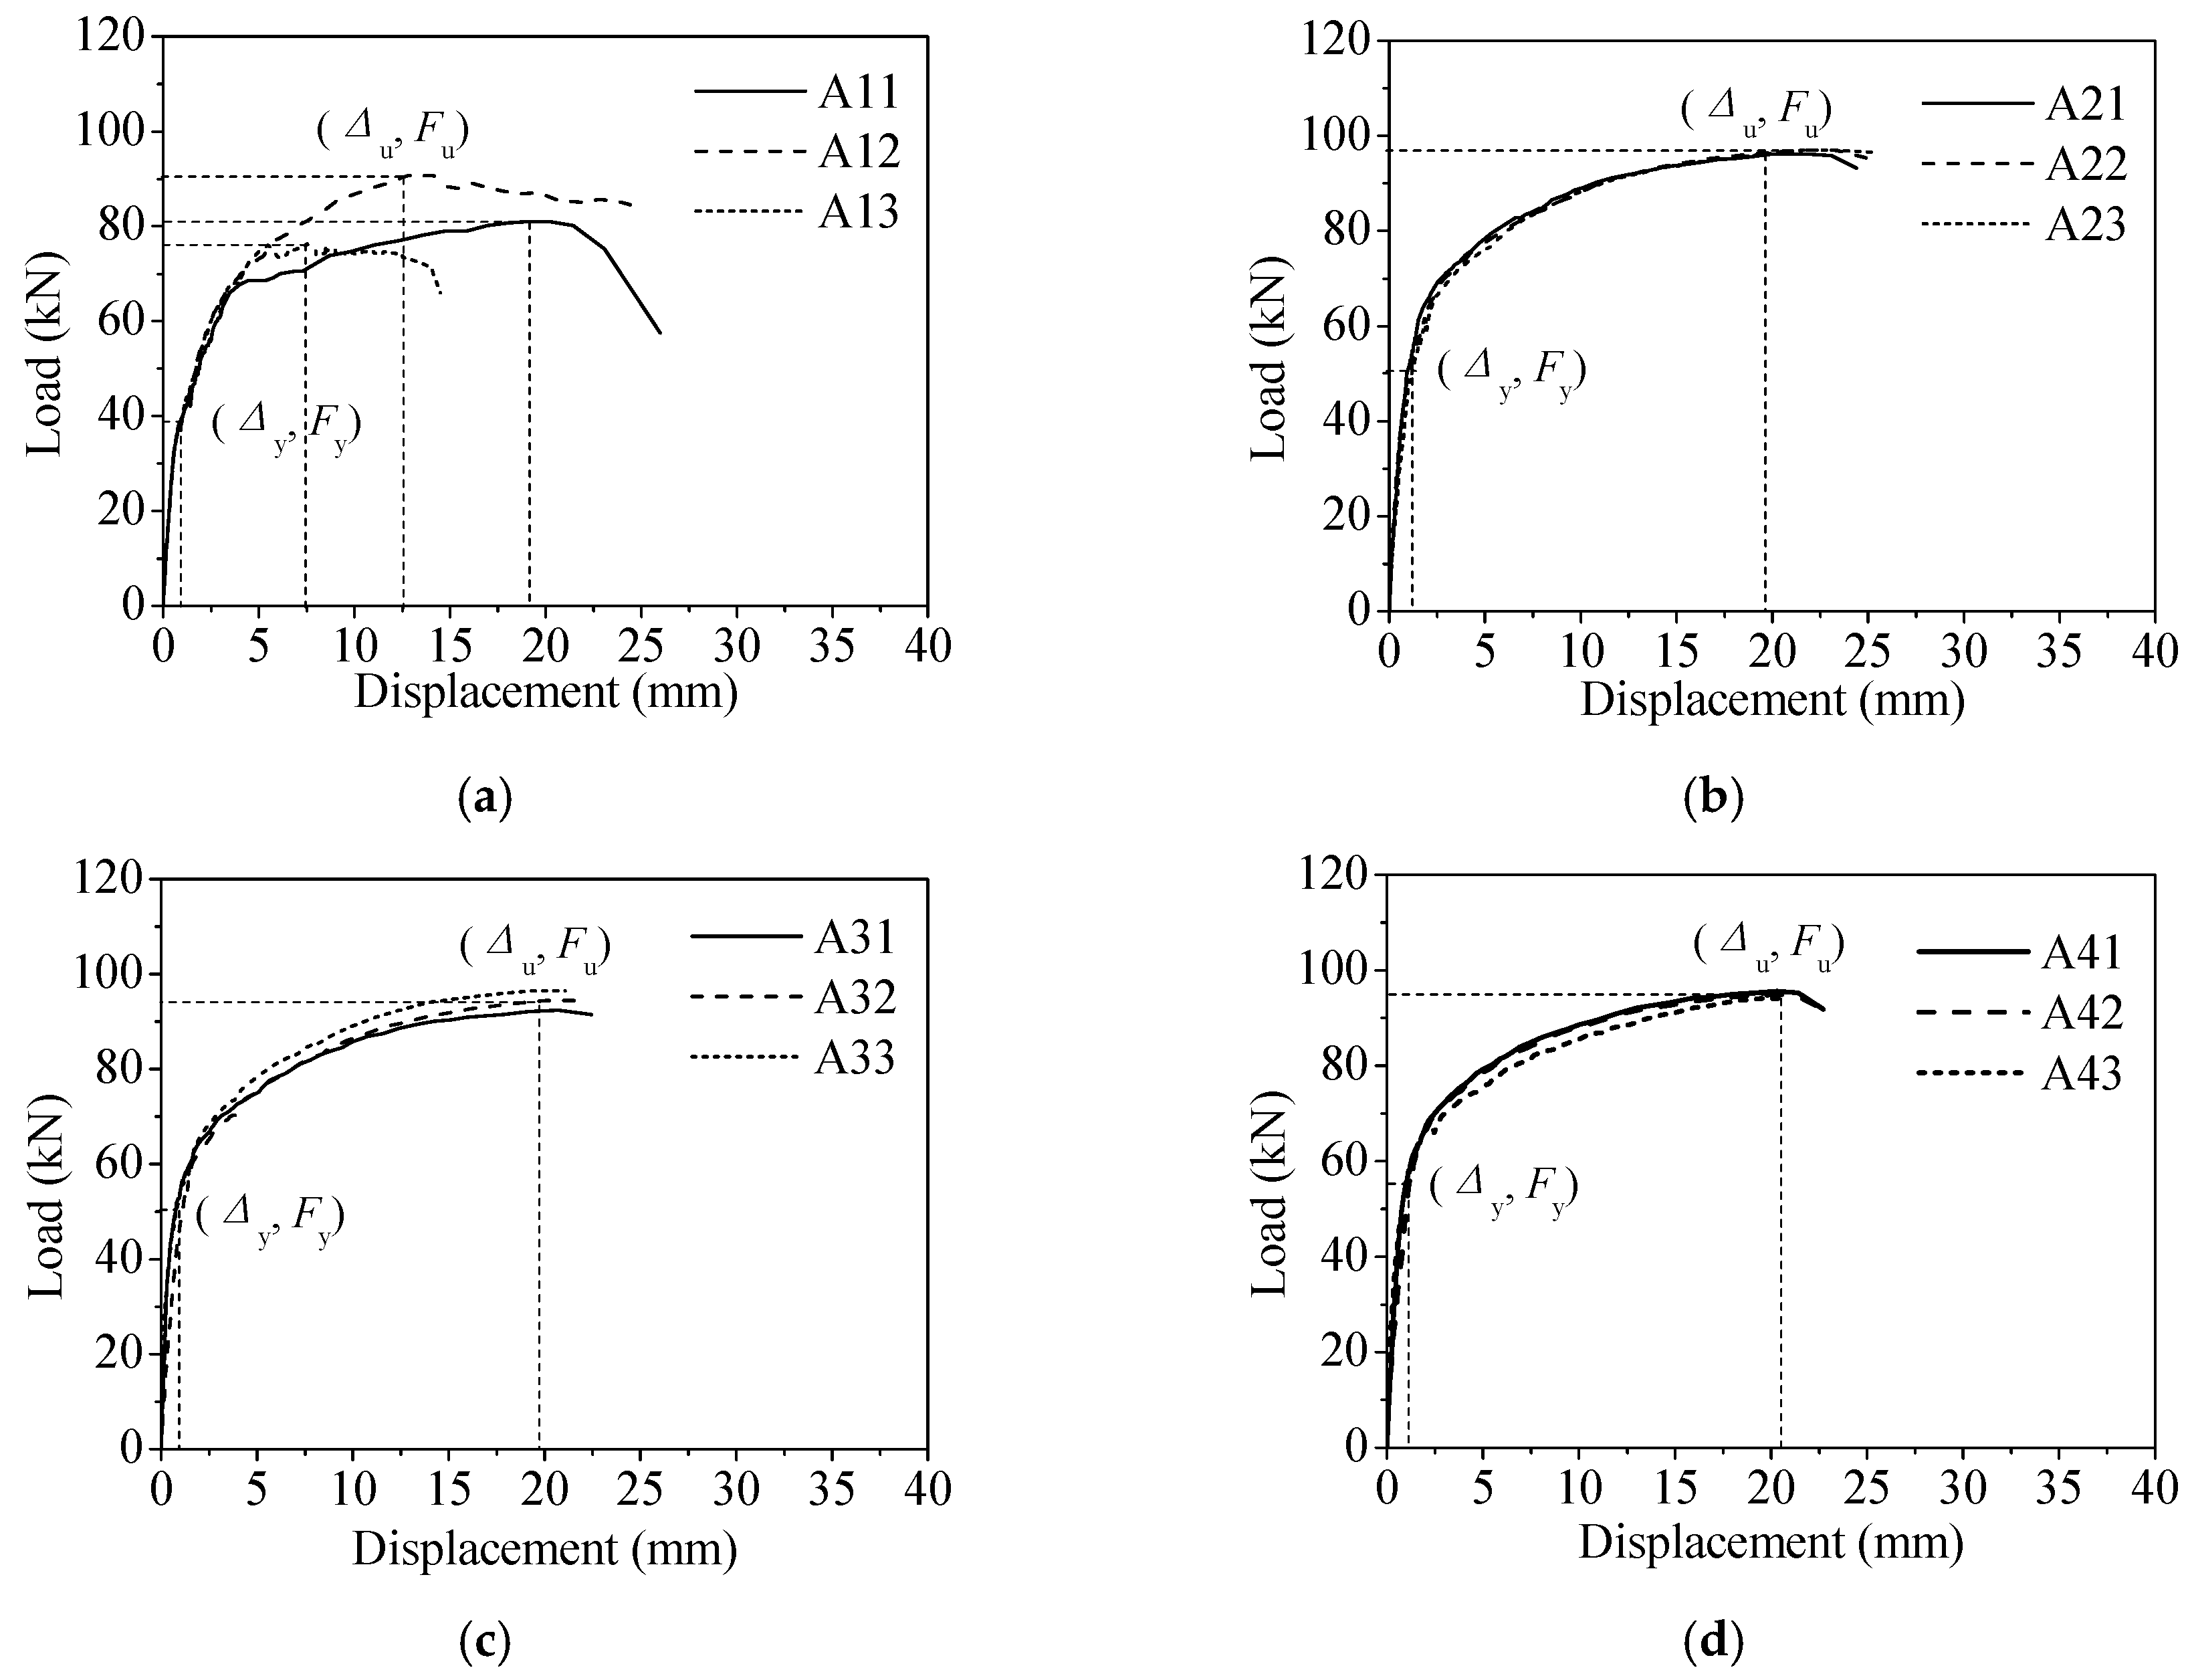
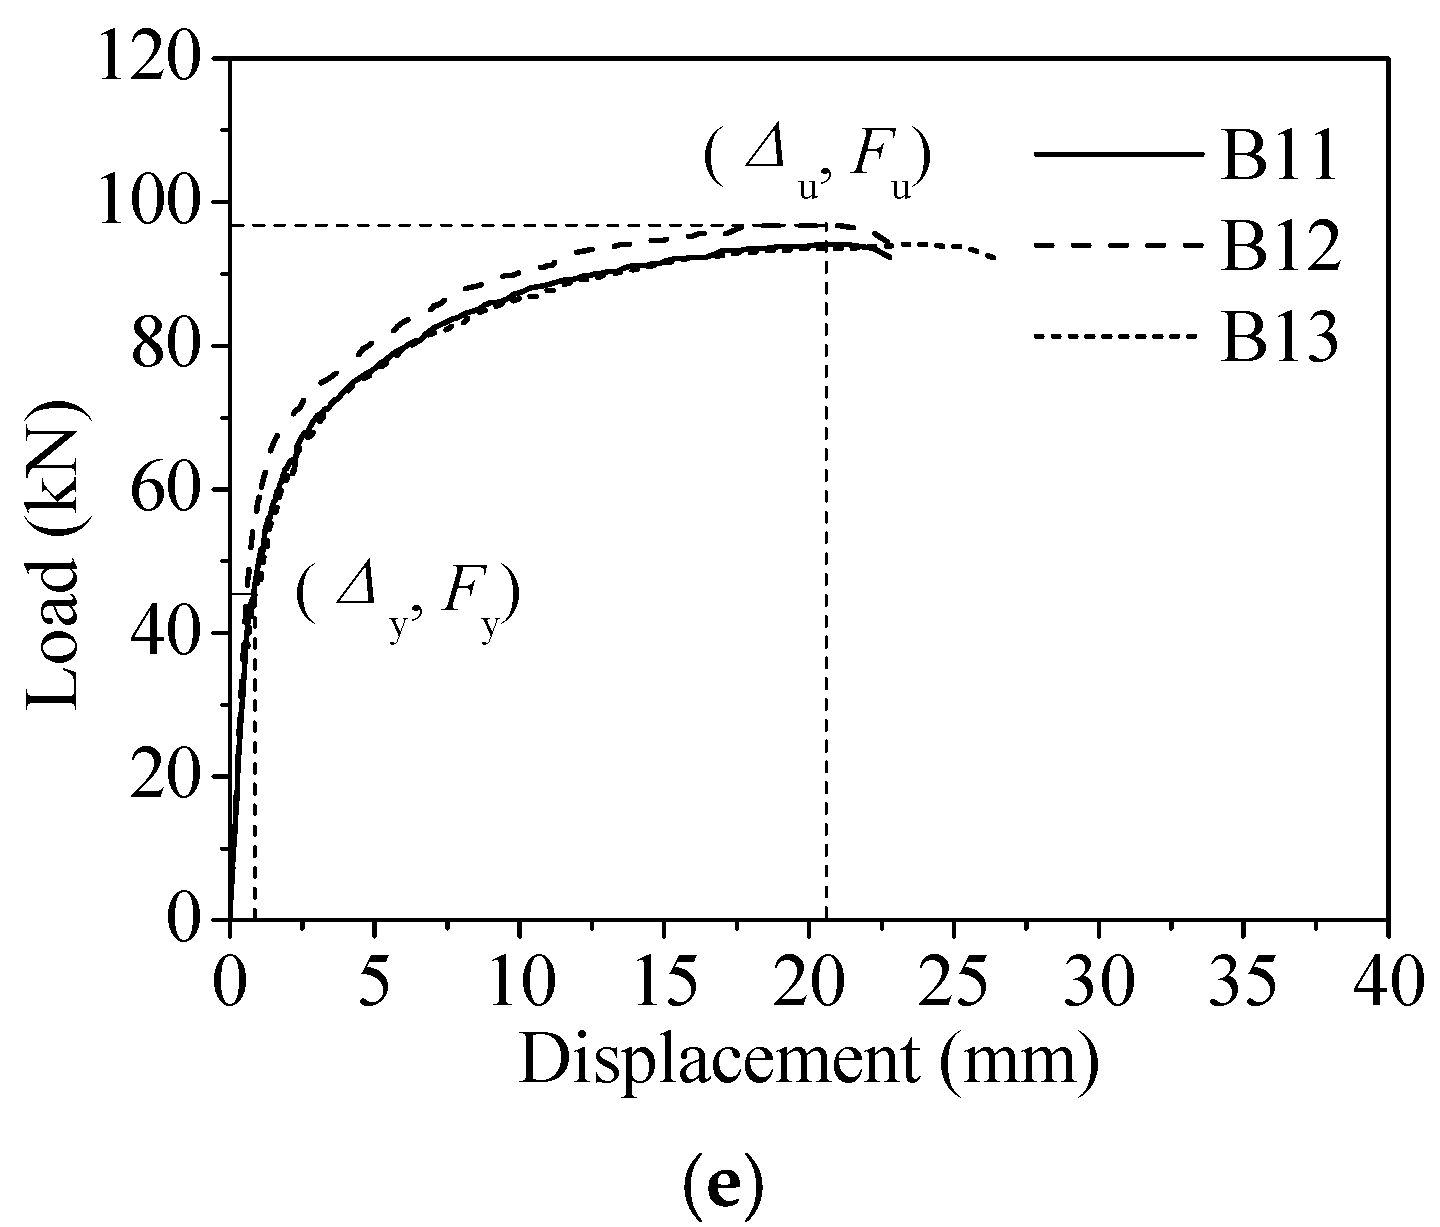
The force
versus displacement curves were the basis for evaluating the bearing capacity performance, and the results were shown in
Figure 6. The curves are initially linear and specimens are in flexible phase. The gradient of the curves decreases and specimens enter the elastoplastic stage with increasing loading. The curves decrease abruptly in the pull-out specimens, and the curves show an increasing trend before the plastic stage in rebar fracture specimens. The curves develop without abrupt changes until the rebar fractures. Obviously, small discrepancies in curves indicates that the bearing performance is stable and reliable. The yield ratio (
Fy/
Fu) and ductility coefficient (Δ
u/Δ
y) are important indicators to evaluate the bearing capacity and deformation capacity of the joint.
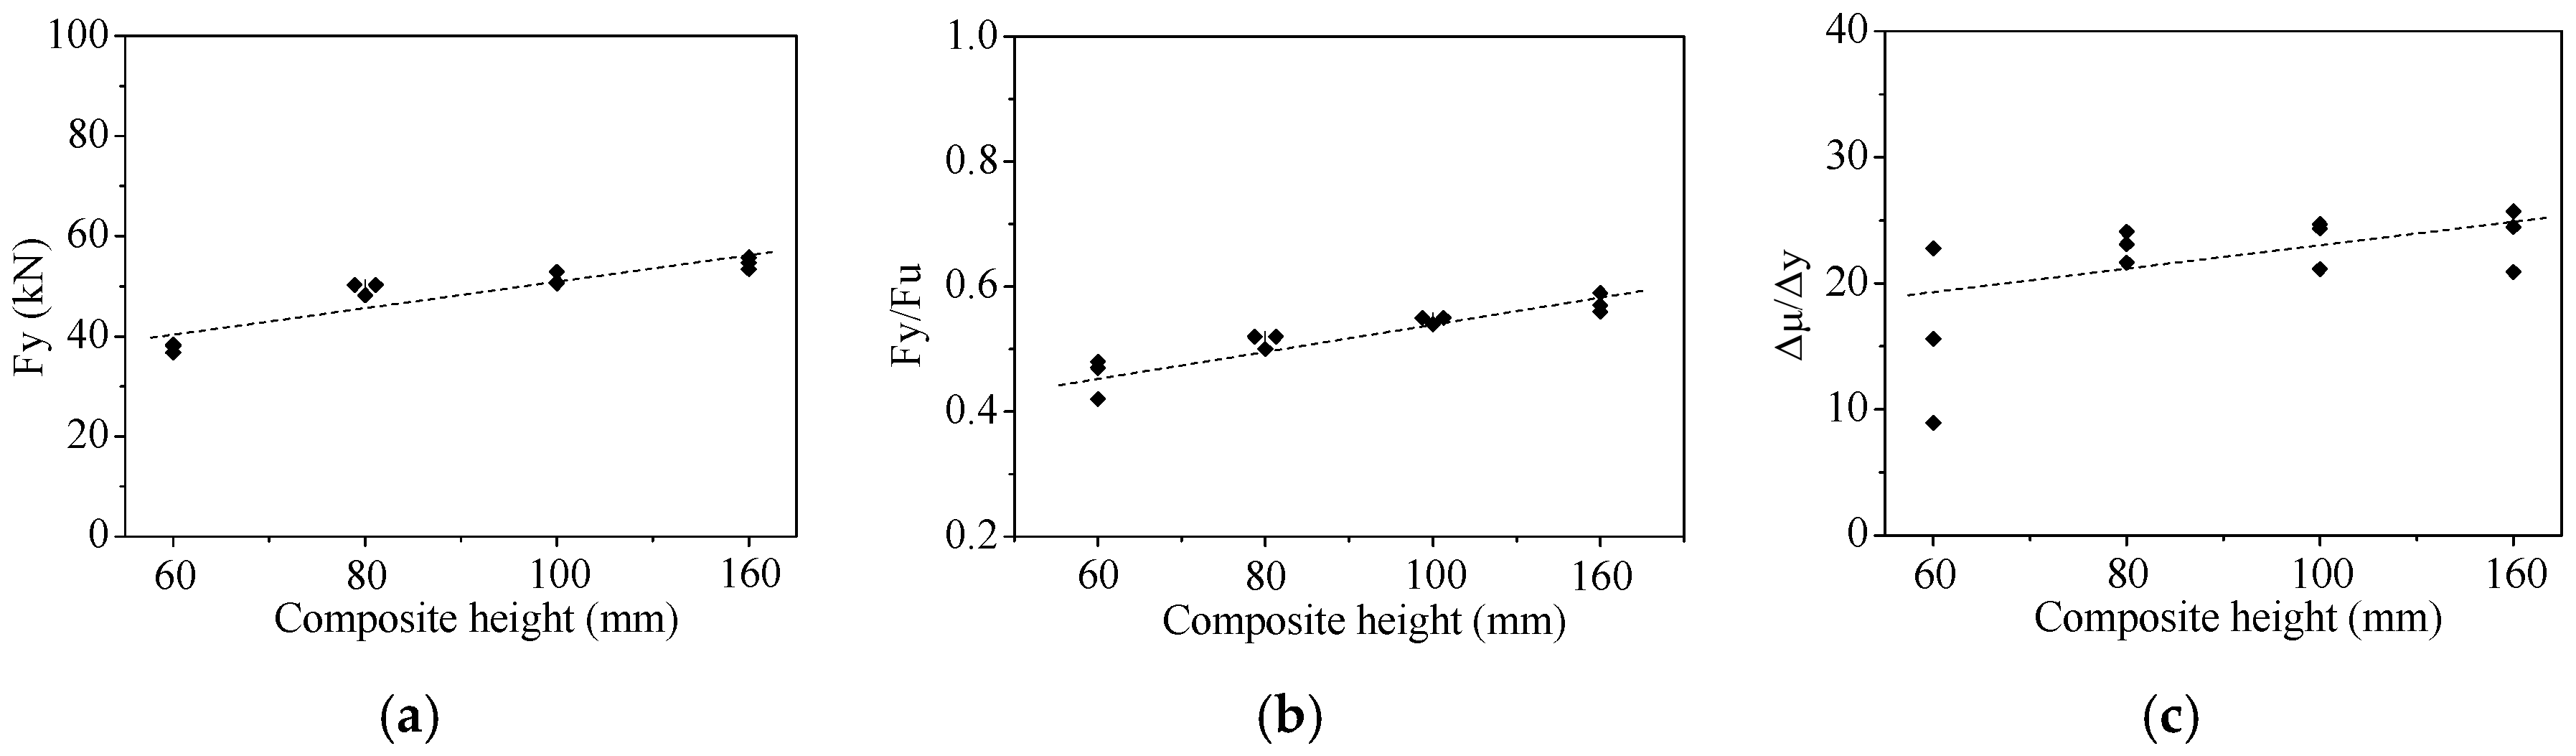
In terms of composite height, four levels were used to evaluate the effects on the bearing performance. The yield load increases from 4% to 31% with a single-step increase (
Figure 7a), and the yield ratio increases 6%–16% per stage (
Figure 7b). The ductility coefficient increases 1%–20% per stage, as can be seen in
Figure 7c. In addition, the cracks was significantly reduced with increasing composite height. Therefore, increasing the composite height could significantly improve the anchoring performance of the concrete to ring rebars, thereby improving the bearing performance.
Compared with the benchmark group A3, the interval arrangement in group B (
Figure 5a) exhibits an 11% decrease in the yield load, and it also results in an 11% decrease in the yield ratio and a 53% increase in the ductility factor. Therefore, the interval arrangement not only decreases the bearing capacity, but also undergoes a greater deformation, that is an unfavorable factor.
3. Model Verification
Numerical analysis was conducted to explore the mechanical mechanism and provide the basic data for bearing capacity model, considering the nonlinearity of materials and geometries; the number of connection units was taken into consideration.
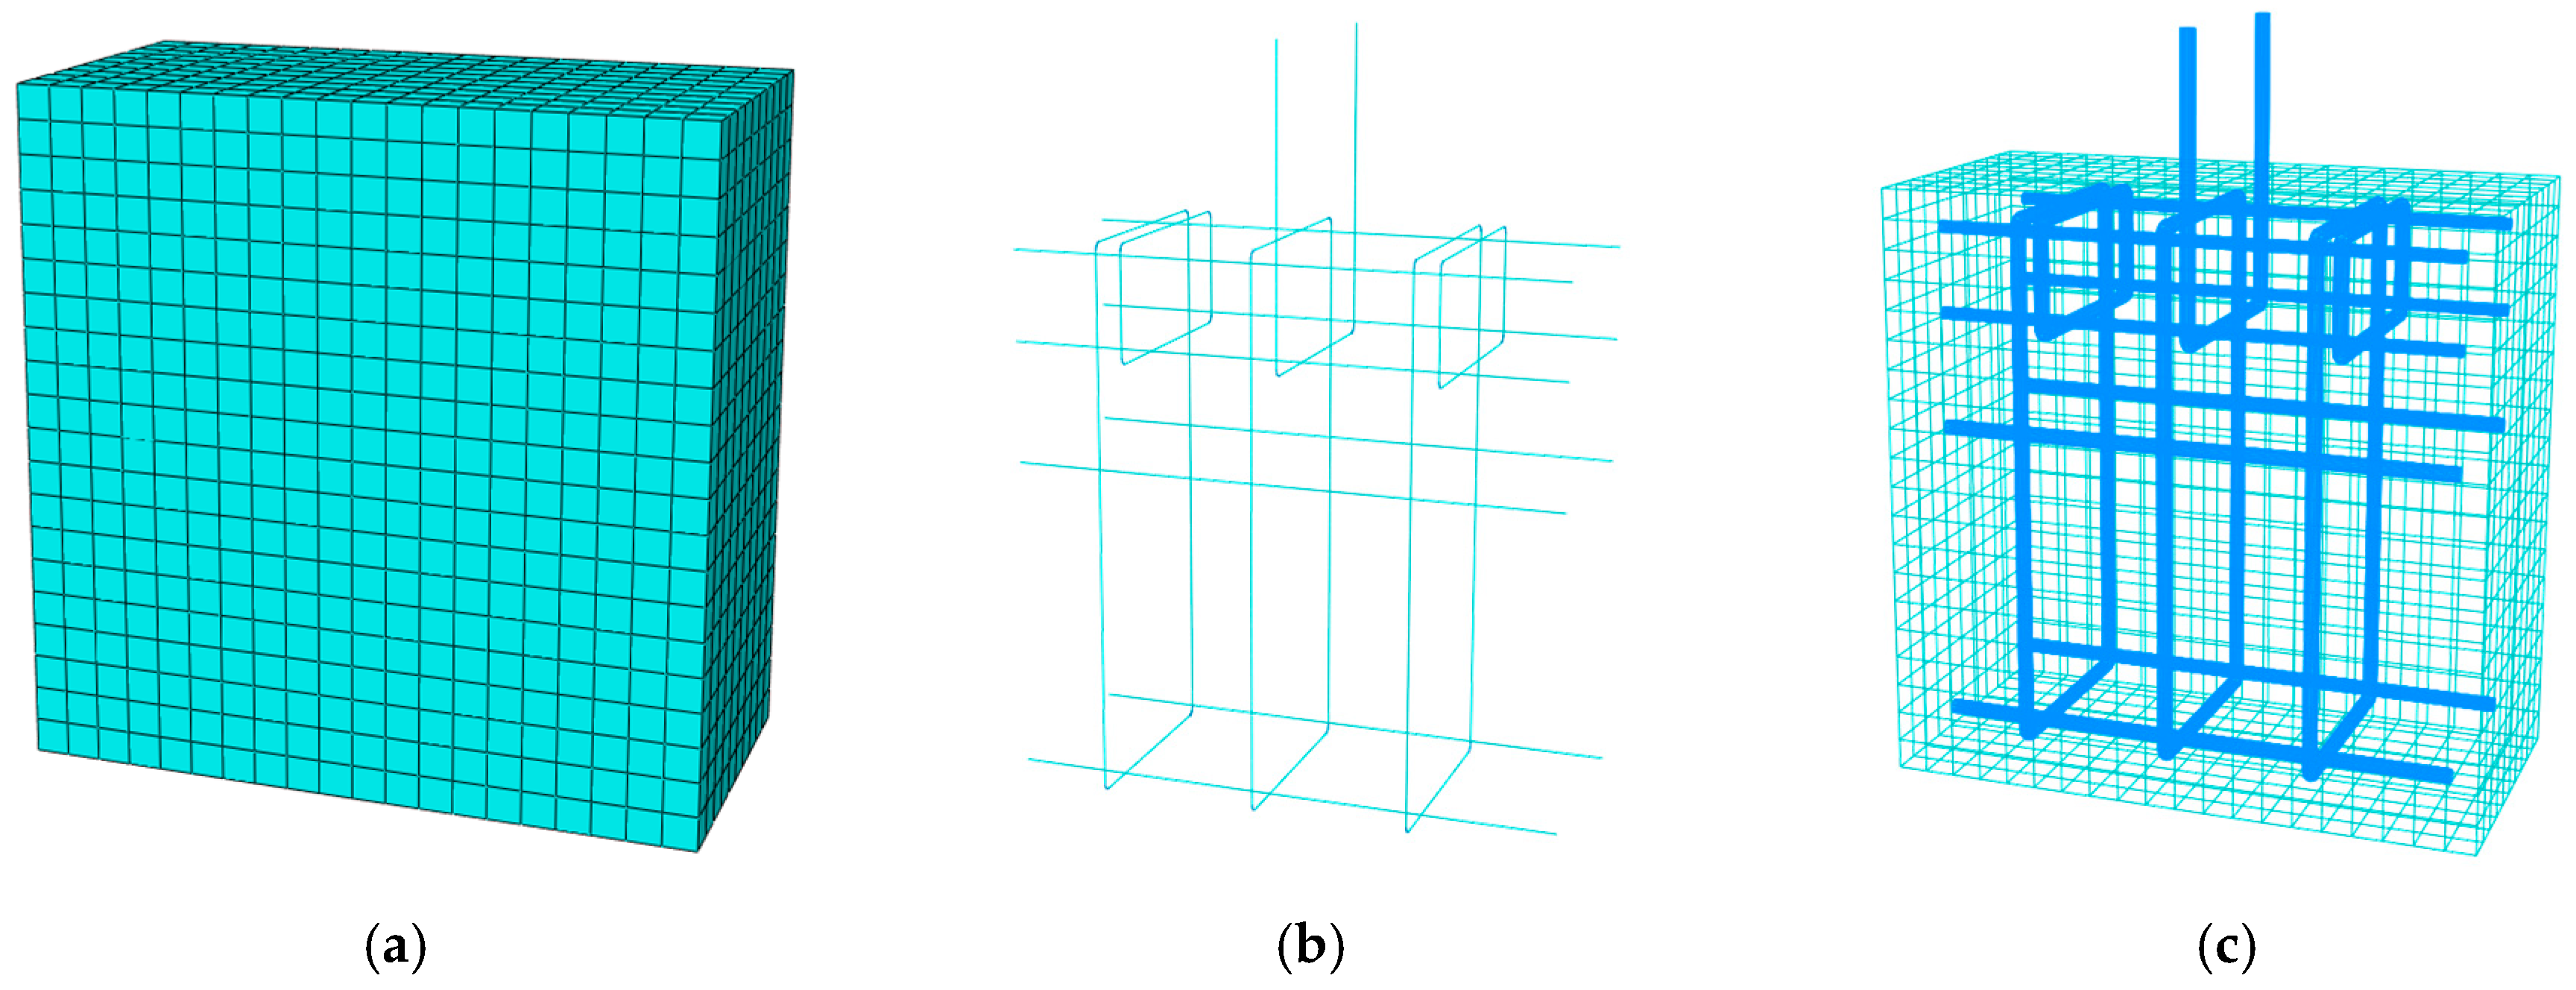
3.1. Numerical Model
A numerical analysis was conducted using the commercial program ABAQUS. A suitable model has the ability to not only accurately simulate the stress process, but also improve the analysis efficiency. To model the concrete and rebar, 8-node reduced integral solid elements (C3D8R) and 2-node linear beam elements were used, respectively. Considering the complexity of the rebar and the dowel effect of the horizontal rebar, a beam element model was selected for the rebar. A bond-slip contact relationship will significantly increase the analytical workload, and can easily cause corner unit distortion without convergence. In addition, the mechanical mechanism of the rebar is the focus of this study. Therefore, the ideal co-node embedded model was adopted for the contact between the rebar and concrete [
20]; the boundary condition was consistent with the tests. Considering the efficiency and precision, a grid size of 20 mm was adopted for the concrete. To improve the analysis accuracy for the rebar, the grid size was 10 mm. The numerical model is shown in
Figure 8.
The nonlinearity of the materials and geometry was taken into consideration. The elastoplastic damage constitutive relation could better reflect its nonlinear behaviour. The Concrete Damaged Plasticity material was used for the concrete [
21], while the steel material model was implemented using the user material subroutine [
22]. The standard calculation in static analysis was applied, and the load was cumulatively applied at loading intervals of 1 kN until failure of the test piece.
3.2. Strain Analysis
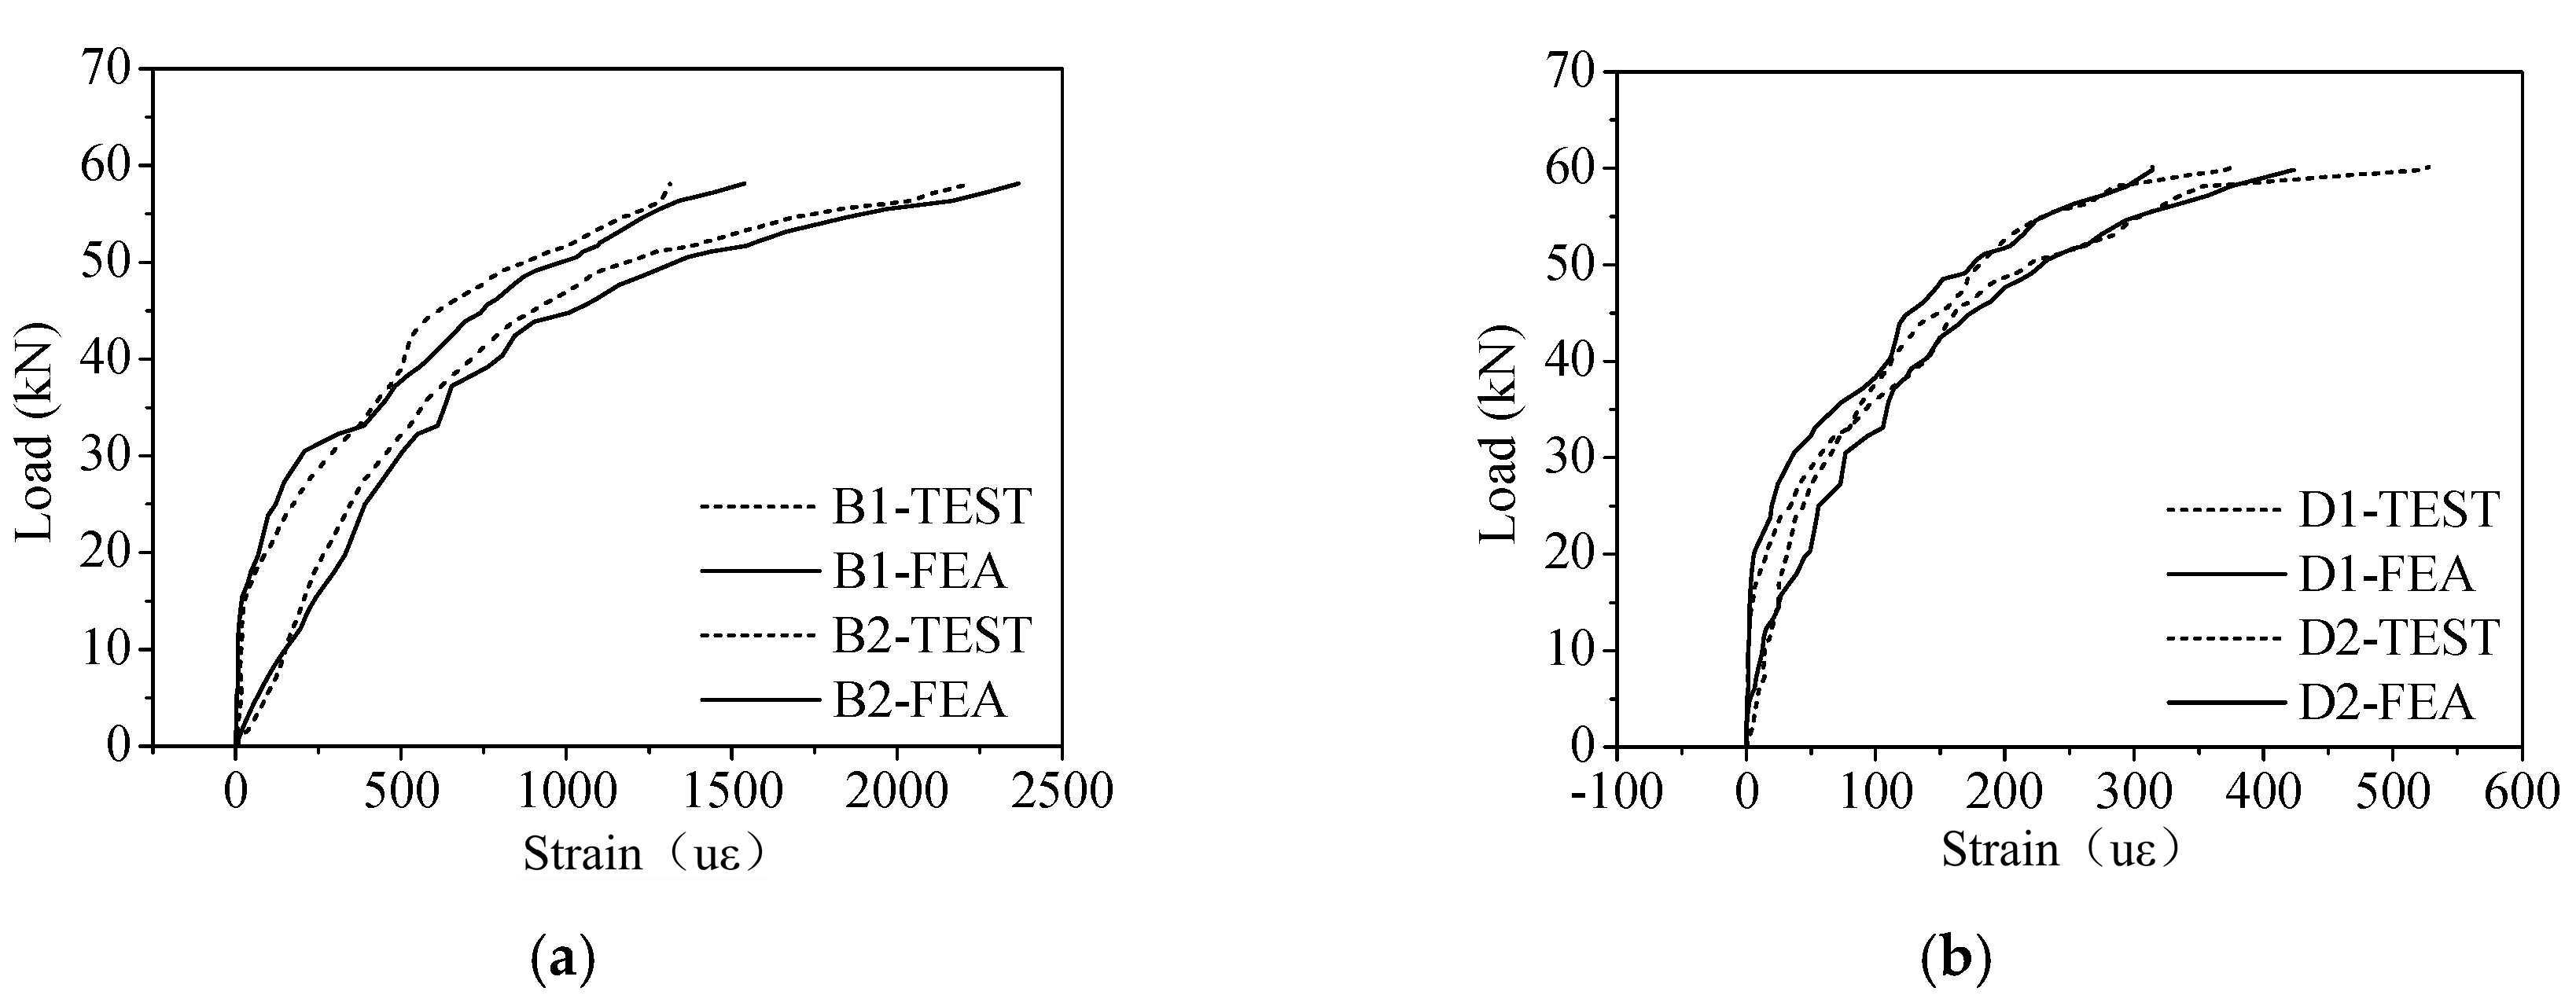
To validate the numerical model, the load applied to the rebars was distributed based on the proportion of strain A in the test, and the experimental data was compared to the numerical analysis results. The inner and lower parts were analyzed comprehensively, and the strain–load curves at positions B and D were compared, as shown in
Figure 9. The curves show that the numerical model results are in good agreement with the experimental results, and thus the model can be applied for mechanism analysis as well as further research.
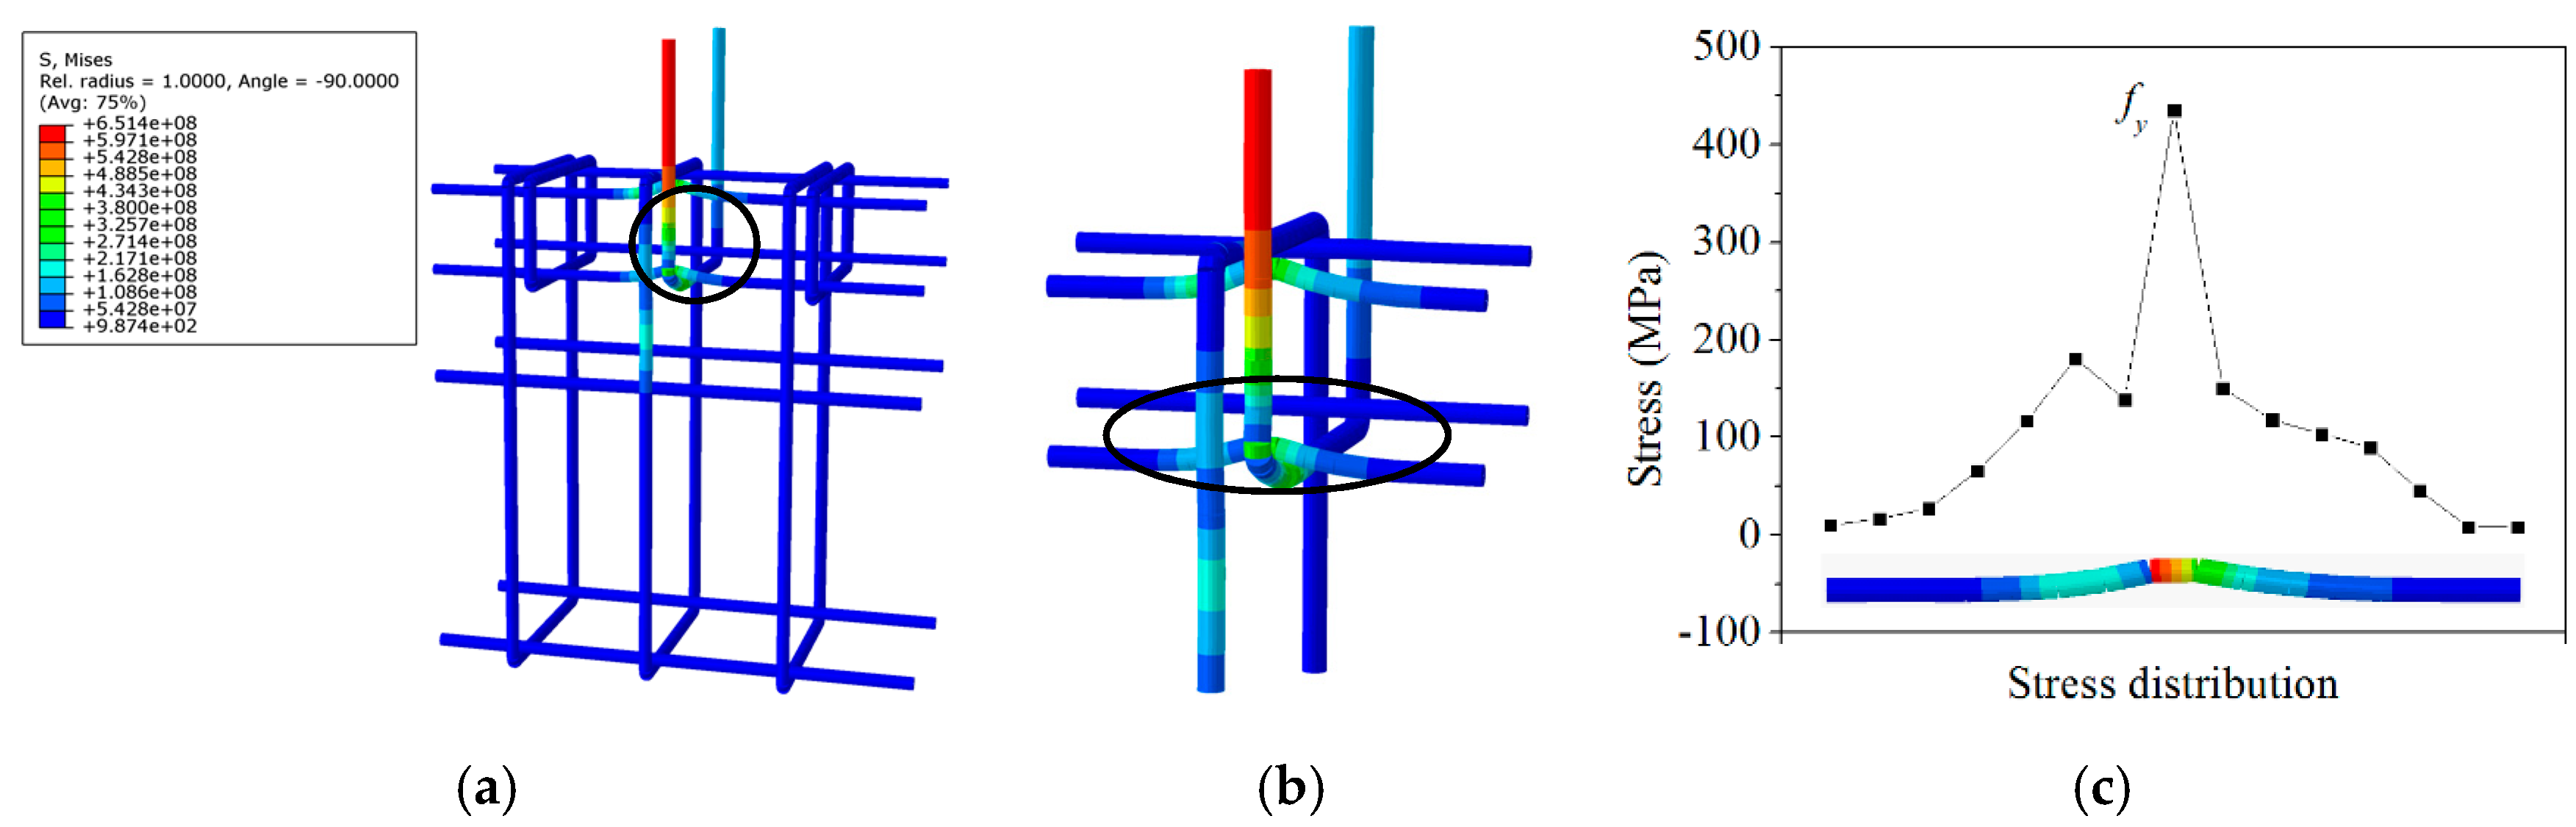
For further evaluation, a greater yield strength was only defined for the up-ring rebar. The load was 67.24 kN when the down horizontal rebar yielded (
Figure 10a); the test value was 63.04 kN, and thus the numerical results were 6.66% greater than the test results. A partial diagram is shown in
Figure 10b, and the stress distribution is presented in
Figure 10c, which reflects the dowel action; a deformation is observed consistent with the experimental observations. Thus, the model not only reflects the internal mechanical behaviour, but also reflects the combination of the anchoring and dowel effects. Therefore, it can be used for further research.
3.3. Effect of the Number of Connection Units on the Results
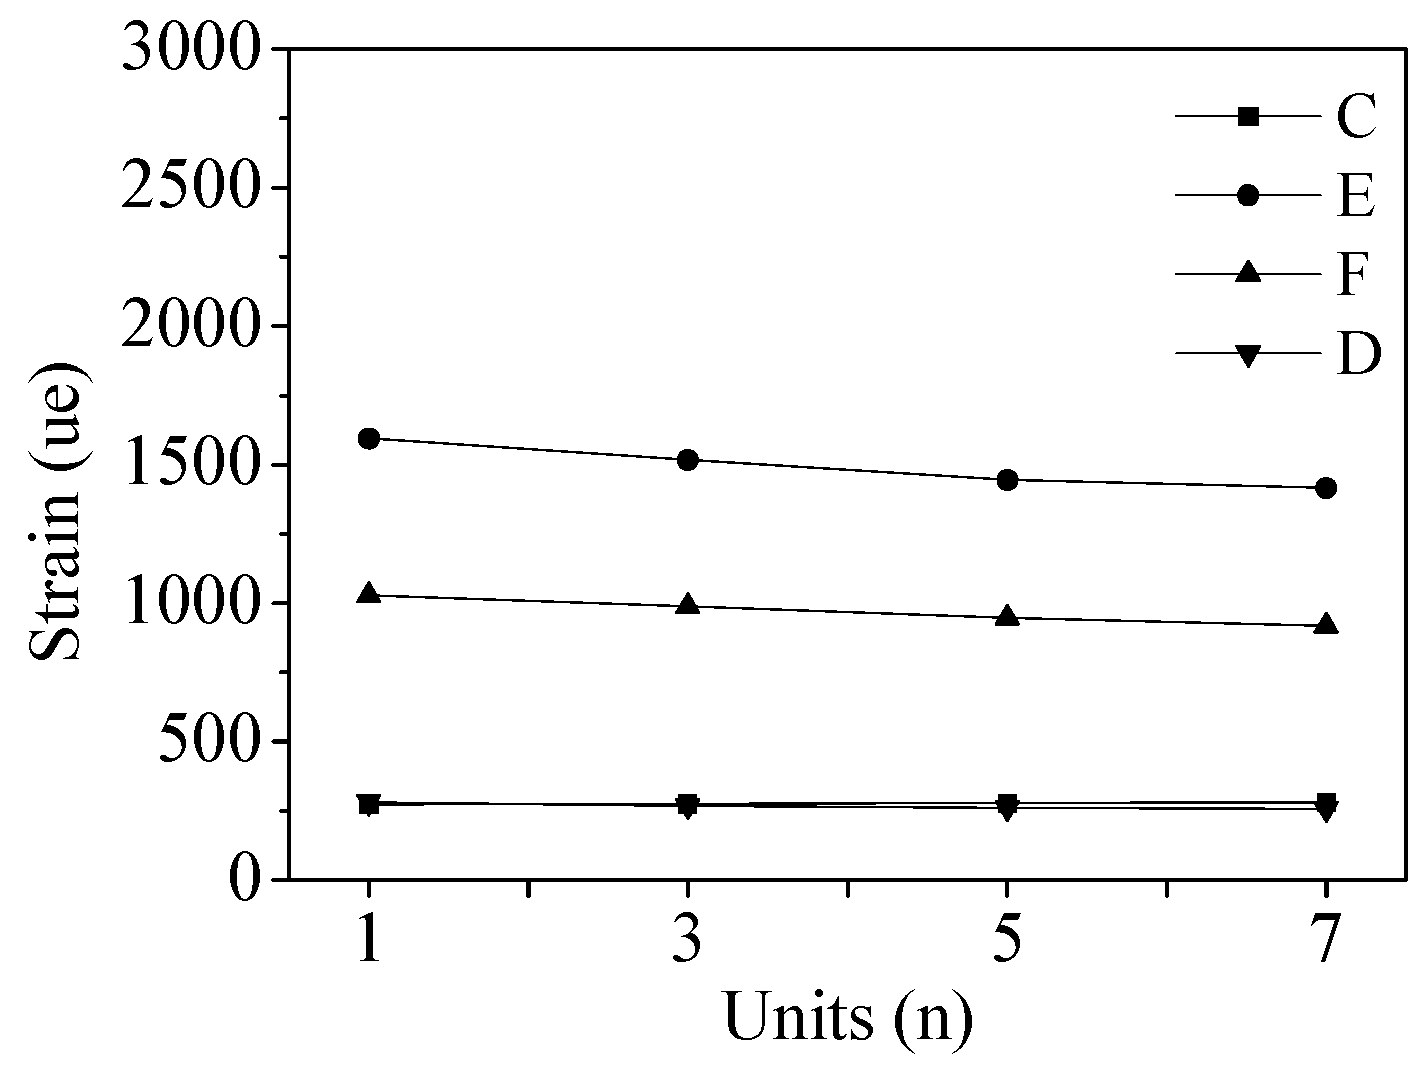
Models composed of 3, 5, 7, and 9 units were established to analyze the effect on the results, and the result for the intermediate unit in each specimen was reported. The strain values at positions C, E, F, and D when the up-ring rebar yielded are illustrated in
Figure 11. The strain curves for positions C and D were almost unaffected, while the strain curves at positions E and G decreased as the number of ring units increased, until gradually stabilising after the model consisted of at least five units. Considering the accuracy and efficiency, the model with five units is selected.
4. Bearing Capacity Model
Obviously, the rebar fracture is an ideal failure mode. The experimental and numerical results served to reveal the mechanical mechanism and the bearing capacity consisted of the anchoring effect of the ring rebar and the dowel action of the horizontal rebar. A bearing capacity model was proposed and could predict bearing capacity well.
4.1. Basic Bearing Capacity Model
Drawing on existing research, a ring rebar can be symmetrically separated, and the bearing capacity could be calculated according to the calculation method for bent rebar. The schematic diagram for the bent rebar is shown in
Figure 12. The bond stress,
τu, can be calculated with Equation (1), and the bearing capacity can then be calculated [
15].
Equation (1) is a stiffness equation expressed in the form of strength, where the first term represents the bonding effect of the straight anchor segment, lv, and the second term represents the effect of the rear anchor segment, lh, on the bonding performance of the straight anchor segment. When lh ≥ 7d, the displacement–load curves continues to rise after the bending point and anchoring is safe and reliable.
The ability of the horizontal rebar to bear the shear force is called the dowel action. At the splicing interface of the prefabricated structure, the horizontal rebar serves to resist and transfer the axial load of the ring rebar, and the dowel action is the only transmission mechanism for the shear force [
23,
24]. Research has shown that the crack pattern of the horizontal rebar is mainly manifested by the combined failure modes of the generated shear forces and tensile forces. Accurately predicting the bearing capacity is of great significance for ensuring the safety of the joints. Li and Rasmussen [
25,
26] investigated the role of the horizontal rebar and proposed a mathematical model considering the effect of damage that could accurately predict the bearing capacity. The model is applied under the condition of no splicing interface, as shown in Equations (2)–(5); the mechanical diagram was shown in
Figure 13.
In the bearing capacity model, Du was the basic calculation model, and Ddamage was the attenuation of bearing capacity of the horizontal rebar caused by local comprehensive damage of concrete. X was the material factor. Finally, Dc, the modified model was obtained.
4.2. Parametric Study
Five factors were considered for the parametric analysis based on the models of the anchoring and dowel actions, as listed in
Table 3. Rebar fracture was observed in all models, and the load,
fy-R, was recorded when the ring rebar yielded and the horizontal rebar was still in the elastic phase. In bearing capacity analysis, only the yield strength of the ring rebar was increased to yield the horizontal rebar, and the corresponding load,
fy-HR, was recorded. The ratio of
fy-HR/
fy-R was used to evaluate the capacity reserve and results are summarised in
Table 4.
In group L1–L4, the horizontal rebar diameter is 10 mm, and the reserve decreases from 95.13% to −14.24%, at which there is no reserve, as the diameter of the up-ring rebar increases from 8 mm to 14 mm. In group P1–P4, the diameter of the up-ring rebar is 10 mm, and the reserve increases from 29.99% to 69.44% as the diameter of the horizontal rebar increases from 8 mm to 14 mm. In group Q1–Q4, the up-ring rebar is consistent with the horizontal rebar, and the reserve decreases from 110.70% to 24.76% as the diameter increases from 8 mm to 14 mm, demonstrating a high safety reserve. Research has shown that the reserve is low or zero when the diameter of the ring rebar is larger than that of the horizontal rebar. However, the reserve is improved when the diameter of the ring rebar is larger or equal to that of the horizontal rebar. The diameter thus plays a critical role in the bearing capacity, and it is recommended that the diameter of the ring rebar should be consistent with that of the horizontal rebar considering the bearing capacity reserve and economic factors. As the concrete grade increases from C25 to C40 in group M1–M4, the reserve increases from 32.32% to 50.78%. The reserve increases from 16.85% to 74.43% as the composite height increases from 75 mm to 150 mm in group N1–N4. As the width of the ring rebar increases from 125 mm to 200 mm in group O1–O4, the reserve increases from 25.50% to 52.37%. Therefore, the connection is safe and reliable with an improved reserve under a reasonable design.
Based on the parametric analysis and bearing capacity reserve analysis, some suggestions are proposed: the diameter of the horizontal rebar should be consistent with that of the ring rebar; at least two rows of the horizontal rebar should be arranged at the corner of the closed area; the composite height and the width of the ring rebar should be at least 100 mm and 125 mm, respectively. The concrete grade should be better than C25, and the concrete grade of the connection area should be one level higher than that of the components.
In-depth analysis were conducted based on models that satisfy the above suggested conditions, and the bearing capacity analysis results are summarised in
Table 4. A bearing capacity model was proposed through linear fitting by considering the anchoring and dowel actions comprehensively, as given in
Figure 14 and Equation (6).
By substituting Equations (2)–(5) into (6) and ignoring the small effect of other factors, the bearing capacity model is obtained, as shown in Equation (7).
5. Reliability-Based Anchoring Design
Anchoring limit state equilibrium equation is shown in this paper. On the basis, according to the relevant statistical parameters and the determined reliability indexes of anchoring length and stiffness, the anchorage length of the ring rebar is obtained under various conditions.
5.1. Equilibrium Equation for the Limit State
Anchor failure or rebar fracture may occur when the up-ring rebar is under tension. Under the maximum tension, the minimum anchoring length at which the up-ring rebar reaches the yield strength without anchor failure is called the critical anchor length. The up-ring rebar reaches the yield strength, and anchorage damage occurs simultaneously, which is called the limit state, i.e., the anchoring force is equal to the yield load of the up-ring rebar. The anchorage limit state is shown in
Figure 15.
In the limit state, the ultimate bearing capacity is P, i.e., the anchorage resistance, R, of the rebar can be expressed as Equation (8).
The ultimate pull-out force of the up-ring rebar is Fu, i.e., the effect, S, caused by the up-ring rebar is expressed as Equation (9).
Given that R = S, the equilibrium equation can be expressed as Equation (10).
5.2. Variable Statistics
The statistical parameters of the relevant variables can be obtained through a statistical analysis of the results of a large number of previous experimental studies. In GB 50010-2010 (2010), the coefficient of variation for concrete is given. The calculation method for the concrete tensile strength for the compressive strength of concrete prisms is given by Equation (11). The equation for calculation of the concrete tensile strength gives the relevant statistical parameters for the concrete [
27], as summarised in
Table 5.
The research is consistent with the current codes, using the tensile strength design value,
fy, of the steel. The coefficient of variation,
δ = 0.0641, has been previously determined [
15]. Based on a 95% guarantee rate, the average value of the conditional yield strength,
, is expressed as Equation (12).
The rebar specification is HRB400, and the corresponding design value of the tensile strength is 360 MPa; the average yield strength is 402 MPa according to Equation (12). In component geometry, the relevant parameters are obtained according to the statistical results [
15], as summarised in
Table 6.
The accuracy of the calculation model is defined as Ωp = , i.e., the ratio of the measured values to the calculated values of the regression statistics; the relevant accuracy parameters are obtained. The average measured values for the rebar are μ = 1.058, σ = 0.122, and δ = 0.115.
5.3. Target Reliability Indicator
To utilise the strength of the tensile reinforcement fully, a sufficient anchoring length is required to ensure that no bond failure occurs before the rebar yields. Therefore, the conditions at the anchor limit state are that the stress at the free end of the rebar reaches the maximum value (i.e.,
σs =
ηfy), and the bond between the rebar and the concrete reaches the maximum value (i.e.,
τ =
τu). This is used as a starting point for determining the reliability of the anchoring performance, and the probability is given by Equation (13).
In GB 50068-2001, when structural members experience ductile failure and brittle failure under the second-level safety condition, the design reliability indicators are taken as
β = 3.2 and
β = 3.7, respectively. To ensure that the reliability index of the anchorage performance is higher than the bearing capacity reliability of other component sections, the total reliability index of the anchoring performance design and the corresponding failure probability calculation value are expressed as Equation (14).
For rebar, the force is designed based on the strength, so when the “free end stress of the rebar reaches the maximum value (i.e.,
σs =
ηfy)”, the allowable probability and reliability indicators are based on the standard values, as expressed in Equation (15).
From Equations (14)–(16), the allowable probability and reliability indicators are expressed in Equation (17).
According to Schedule 2 in reference [
28], the reliability index corresponding to
Pf0 is
β01 = 1.57, which is the basis for determining the design value of the anchor length in the anchoring strength problem [
29].
In summary, in the analysis of the anchoring problem, the reliability of the anchor design itself is considered to be
β = 3.20, and the anchoring reliability is higher than the reliability of the section design. Relevant experiments [
15] have shown that rebar with hooks and bends do not substantially fail to anchor until yielding, and thus additional reliability indices are not considered in this anchoring design.
5.4. Reliability Analysis of the Anchor Length
The approximation method is used to analyze the reliability of the limit state of the bearing capacity. S and R are regarded as two comprehensive basic variables obeying a normal distribution.
5.4.1. Characteristic Parameter for the Effect S
The effect
S can be expressed as Equation (18), which is converted from Equation (9).
The average value of S is , with a coefficient of variation of δs = 0.0641.
5.4.2. Characteristic Parameter of the Resistance (R)
The resistance,
R, can be obtained from Equations (8) and (9).
Based on the situation in this study, Equation (19) can be written as follows:
The statistical parameter of a random variable function can be obtained from the known statistical parameters of the random variable, as expressed in Equations (21)–(23).
According to the equation for the anchor bond strength, the resistance,
R, is expressed as Equation (24).
The investigation of the connection reliability is mainly applied to prefabricated shear wall structure systems in this study, and thus, the size of
lh is limited to within a certain range. For the following situations, the shear wall width is 200 mm, rebar specification is HRB400, and concrete grade is C30; then,
lh/
d = 8. The statistical parameter of
R is thus expressed as Equation (25).
5.4.3. Anchor Length
Both the random variables
S and
R obey lognormal distributions, and a reliable index expression could be given by Equation (26).
The calculation equation for the anchor length could be expressed as Equation (27).
The relevant statistical parameters for the concrete tensile strength in
Table 4 and
Table 5 are substituted into Equation (27), the equation with unknown factor
lv/
d is solved, and the approximate value of the anchor length can be obtained. Considering the concrete grade, the vertical anchor length is given in
Table 7. The minimum requirement for the vertical anchoring length of the ring rebar is thus defined.
6. Design Suggestions
As described in the present study, the vertical length of the rebar plays a critical role in the anchoring performance. It can be summarised as 0.6
la based on the results in
Table 7; the curves are shown in
Figure 16. In addition, the width of the ring rebar should satisfy 0.4
la; the bearing capacity increases and the effect gradually decreases as the size increases.
The proposed structural design could ensure the connection performs at its best. The horizontal rebar should be consistent with the ring rebar, and at least two rows of horizontal rebars should be arranged at the corner of the closed area. The ring units should be adjacent to each other within a distance of 25 mm to ensure effective load transmission. The concrete grade should be based on the structural design, and the grade in the connection area should be one level higher than the components to ensure the stiffness requirements are met. All of these recommendations ensure the mechanical properties of the connection are optimal and promote the application of the ring joint.
7. Conclusions
In this study, experimental and numerical analysis were carried out to analyze the bearing capacity and mechanical mechanism. Then, anchor length was determined based on reliability analysis under various conditions. The conclusions are as follow.
Rebar fracture occurred, and a large number of “V”-shaped cracks were observed on the test pieces. Importantly, the horizontal rebar remained in the flexible stage after yielding of the ring rebar, which was an ideal destruction pattern. The results indicated the joint had a better bearing capacity reserve and ductility. Numerical analysis not only reflected the mechanical mechanism of the internal rebars, but could also be used for further research. A bearing capacity model was proposed considering the bond and dowel actions simultaneously, and it could predict the bearing capacity well. The dowel action of the horizontal rebars could improve the bearing capacity and avoid the risk of the ring rebar being pulled out under reasonable deign. The anchor length, lv, was determined based on the reliability analysis, and other structural measures has been proposed, which could guarantee the mechanical properties and reliability of the ring joint.
Author Contributions
All authors participated equally in the design and implementation processes of this manuscript. They all participated in drafting the article or revising it critically for important intellectual content. Final approval of the version to be submitted was given by all authors. Conceptualization, X.Z., F.F. and A.J.; methodology, J.Z. and H.Q.; software, J.Z.; validation, J.Z., X.Z.; formal analysis, J.Z. and X.Z.; investigation, all of the authors; resources, X.Z. and F.F.; data curation, J.Z. and X.Z.; writing—original draft preparation, J.Z. and X.Z.; writing—review and editing, all of the authors; visualization, J.Z.; supervision, F.F. and A.J.; project administration, X.Z.; funding acquisition, X.Z. All authors read and approved the final manuscript.
Funding
This research was funded by the Special Project of National Key Research and Development Plan, grant number No. 2017YFC0703804.
Acknowledgments
The authors gratefully acknowledge the financial support by the Special Project of National Key Research and Development Plan. The help of the China Construction Seventh Engineering Division Corp. Ltd. is sincerely appreciated.
Conflicts of Interest
The authors declare no conflict of interest.
Notation
| Ar | cross-sectional area of the up-ring rebar |
| c | thickness of the concrete cover |
| d | diameter of the rebar |
| dh | diameter of the horizontal rebar |
| fc | compressive strength of concrete |
| ft | design value of the concrete axial tensile strength |
| fy | yield strength of the rebar |
| fy-R | load at yielding of the ring rebar |
| fy-HR | load at yielding of the ring rebar when the strength is increased |
| lh | anchorage length of the rear anchor section of rebar |
| lv | anchorage length of the straight anchor section of rebar |
| P | bearing capacity of the ring joint |
| Rp | calculated resistance |
| R (•) | function of each random variable |
| Xi | random variable in function R (•) |
| X | material coefficient |
| τu | reduced ultimate anchoring strength |
| Ωp | accuracy coefficient of the calculation equation |
References
- Liu, H.T.; Han, Q.; Bai, Y.L.; Xu, C.S. Connection performance of restrained deformed grouted sleeve splice. Adv. Struct. Eng. 2018, 21, 488–499. [Google Scholar] [CrossRef]
- Soudki, K.A.; Rizkalla, S.H.; Leblanc, B. Horizontal connections for precast concrete shear wall subjected to cyclic deformations part 1: Mild steel connections. PCI J. 1995, 40, 78–96. [Google Scholar]
- Soudki, K.A.; Rizkalla, S.H.; Daikiw, R.W. Horizontal connections for precast concrete shear walls subjected to cyclic deformations part 2: Prestressed connections. PCI J. 1995, 40, 82–96. [Google Scholar] [CrossRef]
- Soudki, K.A.; West, J.S.; Rizkalla, S.H.; Blackett, B. Horizontal connections for precast concrete shear wall panels under cyclic shear loading. PCI J. 1996, 41, 64–80. [Google Scholar] [CrossRef]
- Einea, A.; Yamane, T.; Tadros, M.K. Grout-filled pipe splices for precast concrete construction. PCI J. 1995, 98, 82–93. [Google Scholar] [CrossRef]
- Kim, Y.M. A Study of Pipe Splice Sleeves for Use in Precast Beam-Column Connections. Master’s Thesis, University of Texas, Austin, TX, USA, 2000. [Google Scholar]
- Haber, Z.B.; Saiidi, M.S.; Sanders, D.H. Seismic performance of precast columns with mechanically spliced column-footing connections. ACI Struct. J. 2014, 111, 639–650. [Google Scholar] [CrossRef]
- Popa, V.; Papurcu, A.; Cotofana, D.; Pascu, R. Experimental testing on emulative connections for precast columns using grouted corrugated steel sleeves. Bull. Earthq. Eng. 2015, 13, 2429–2447. [Google Scholar] [CrossRef]
- Qian, J.R.; Yang, X.K.; Qin, H. Test on seismic behavior of pre-cast shear walls with various methods of vertical rein-forcement splicing. J. Build. Struct. 2011, 32, 51–59. (In Chinese) [Google Scholar]
- Zhu, Z.F.; Guo, Z.X. Seismic test and analysis of joints of new precast concrete shear wall structures. China Civ. Eng. J. 2012, 45, 69–76. (In Chinese) [Google Scholar]
- Hosseini, S.J.A.; Rahman, A.; Baharuddin, A. Analysis of spiral reinforcement in grouted pipe splice connectors. Gradevinar 2013, 65, 537–546. [Google Scholar]
- Zheng, Y.F.; Guo, Z.X.; Liu, J.B.; Chen, X.N. Performance and confining mechanism of grouted deformed pipe splice under tensile load. Adv. Struct. Eng. 2016, 19, 86–103. [Google Scholar] [CrossRef]
- Zheng, Y.F.; Guo, Z.X.; Guan, D.Z.; Zhang, X. Parametric study on a novel grouted rolling pipe splice for precast concrete construction. Constr. Build. Mater. 2018, 166, 452–463. [Google Scholar] [CrossRef]
- Jiang, H.B.; Zhang, H.S.; Liu, W.Q.; Yan, H.Y. Experimental study on plug-in filling hole for steel bar lapping of precast concrete structure. J. Harbin Inst. Technol. 2011, 43, 18–23. (In Chinese) [Google Scholar]
- Shao, Z.M.; Shen, W.D.; Xu, Y.L. Anchorage reliability and anchoring design of reinforced concrete. J. Build. Struct. 1987, 8, 36–49. (In Chinese) [Google Scholar]
- Liu, Q.W.; Wu, T.; Cheng, R. Experiment research and reliability analysis on granted-filled lap splice. Bull. Chin. Ceram. Soc. 2018, 37, 1324–1331. (In Chinese) [Google Scholar]
- Lu, X.L.; Wang, L.; Wang, D.; Jiang, H.J. An innovative joint connect-ing beam for precast concrete shear wall structures. Struct. Concr. 2016, 17, 972–986. [Google Scholar] [CrossRef]
- Jiao, A.L.; Zhang, P.; Li, Y.H.; Zhi, X.D. Tests on seismic behavior of pre-cast shear walls with annular closed reinforcements. J. Build. Struct. 2015, 36, 103–109. (In Chinese) [Google Scholar]
- Gao, Y.F.; Jiao, A.L.; Zhang, Z.S.; Liu, J.; Zhi, X.D. Tests on out-of-plane bending of precast shear walls with annular closed reinforcements. Build. Struct. 2016, 46, 439–442. (In Chinese) [Google Scholar]
- Amadio, C.; Bedon, C.; Fasan, M.; Pecce, M.R. Refined numerical modelling for the structural assessment of steel-concrete composite beam-to-column joints under seismic loads. Eng. Struct. 2017, 138, 394–409. [Google Scholar]
- Li, J.; Wang, J.Y. Elastoplastic damage constitutive model for concrete based on damage energy release rates, part I: Basic formulations. China Civ. Eng. J. 2005, 38, 14–20. (In Chinese) [Google Scholar]
- Zhi, X.D.; Fan, F.; Shen, S.Z. Application of material damage cumulation in reticulated shells under severe earthquakes. J. Harbin Inst. Technol. 2008, 40, 169–173. (In Chinese) [Google Scholar]
- Nakaki, S.D. An overview of the PRESS five-story precast test building. PCI J. 1999, 44, 26–39. [Google Scholar] [CrossRef]
- Kulkarni, S.A.; Li, B.; Yip, W.K. Finite element analysis of precast hybrid-steel concrete connections under cyclic loading. J. Constr. Steel Res. 2008, 64, 190–201. [Google Scholar] [CrossRef]
- Li, P.F.; An, X.H.; He, S.Q.; Chen, C. Three-dimensional bond model considering the coupled damage effect for dowel action. Mag. Concr. Res. 2017, 69, 728–744. [Google Scholar] [CrossRef]
- Rasmussen, B.H. The carrying capacity of transversely loaded bolts and dowels embedded in concrete. Bygn. Meddelser 1963, 34, 39–55. [Google Scholar]
- Teng, Z.M.; Luo, F.T.; Shi, L.Q. Reinforced Concrete Basic Member; Tsinghua University Press: Beijing, China, 1987. (In Chinese) [Google Scholar]
- Zhao, G.F. Advanced Structural Science of Reinforced Concrete; China machine Press: Beijing, China, 1999. (In Chinese) [Google Scholar]
- Mou, X.G. Experimental Study and Numerical Simulation of Bond Behavior of High-Strength Prestressed Reinforcement. Ph.D. Thesis, Dalian University of Technology, Dalian, China, 2006. (In Chinese). [Google Scholar]
Figure 1.
Schematic diagram of the ring joint connection. (a) Connection diagram; (b) Specimen schematic.
Figure 1.
Schematic diagram of the ring joint connection. (a) Connection diagram; (b) Specimen schematic.
Figure 2.
Test and measuring setup.
Figure 2.
Test and measuring setup.
Figure 4.
Cracks and failure patterns of specimens. (a) The crack and failure mode of A11; (b) The crack and failure mode of A31.
Figure 4.
Cracks and failure patterns of specimens. (a) The crack and failure mode of A11; (b) The crack and failure mode of A31.
Figure 5.
Crack and failure mode of interval arrangement in Group B. (a) Interval arrangement; (b) Crack pattern of B11.
Figure 5.
Crack and failure mode of interval arrangement in Group B. (a) Interval arrangement; (b) Crack pattern of B11.
Figure 6.
Load-displacement curves of specimens. (a) Group A1; (b) Group A2; (c) Group A3; (d) Group A4; (e) Group B1.
Figure 6.
Load-displacement curves of specimens. (a) Group A1; (b) Group A2; (c) Group A3; (d) Group A4; (e) Group B1.
Figure 7.
Results analysis of composite height tests. (a) Yield strength analysis; (b) Yield ratio analysis; (c) Ductility analysis.
Figure 7.
Results analysis of composite height tests. (a) Yield strength analysis; (b) Yield ratio analysis; (c) Ductility analysis.
Figure 8.
The numerical model. (a) Concrete elements; (b) Steel elements; (c) Perspective of whole model.
Figure 8.
The numerical model. (a) Concrete elements; (b) Steel elements; (c) Perspective of whole model.
Figure 9.
Verification of the numerical results for the strain values. (a) Strain curves at B1 and B2; (b) Strain curves at D1 and D2.
Figure 9.
Verification of the numerical results for the strain values. (a) Strain curves at B1 and B2; (b) Strain curves at D1 and D2.
Figure 10.
Stress analysis of the down horizontal rebar in the specimen. (a) Yielding of the horizontal rebar; (b) Partial display; (c) Stress distribution.
Figure 10.
Stress analysis of the down horizontal rebar in the specimen. (a) Yielding of the horizontal rebar; (b) Partial display; (c) Stress distribution.
Figure 11.
Effect of the number of ring units on the strain results.
Figure 11.
Effect of the number of ring units on the strain results.
Figure 12.
Schematic of bent rebar.
Figure 12.
Schematic of bent rebar.
Figure 13.
Mechanical diagram of dowel action.
Figure 13.
Mechanical diagram of dowel action.
Figure 14.
Linear curve of bearing capacity model.
Figure 14.
Linear curve of bearing capacity model.
Figure 15.
Anchorage limit state. (a) Mechanical diagram of the ring rebar; (b) Anchoring curve.
Figure 15.
Anchorage limit state. (a) Mechanical diagram of the ring rebar; (b) Anchoring curve.
Figure 16.
Anchor length curves.
Figure 16.
Anchor length curves.
Table 1.
List of specimens.
Table 1.
List of specimens.
| Group | Composite Height
CH/mm | Horizontal Position
HP | Horizontal Rebar
φ/mm | Horizontal Rebar
φ/mm |
|---|
| A1 | 60 | Adjacent [Figure 1b] | 8 | 10 |
| A2 | 80 | Adjacent | 8 | 10 |
| A3 | 100 | Adjacent | 8 | 10 |
| A4 | 160 | Adjacent | 8 | 10 |
| B1 | 100 | Interval [Figure 5a] | 8 | 10 |
Table 2.
Mechanical properties of steel rebar.
Table 2.
Mechanical properties of steel rebar.
| Diameter (mm) | fy (MPa) | fu (MPa) | εy (με) |
|---|
| 8 | 435.6 | 661.6 | 2178 |
| 10 | 436.5 | 668.7 | 2237 |
Table 3.
List of factors in the bearing capacity analysis.
Table 3.
List of factors in the bearing capacity analysis.
| No. | Factor | Symbol | Uint | Parametric Level |
|---|
| 1 | Rebar diameter | dr | mm | 8 | 10 | 12 | 14 |
| 2 | Concrete grade | C | MPa | C25 | C30 | C35 | C40 |
| 3 | Composite height | CH | mm | 75 | 100 | 125 | 150 |
| 4 | Width of ring unit | Wr | mm | 125 | 150 | 175 | 200 |
| 5 | Horizontal rebar diameter | dh | mm | 8 | 10 | 12 | 14 |
Table 4.
Bearing capacity analysis and model analysis.
Table 4.
Bearing capacity analysis and model analysis.
| No. | Model List | Reserve Analysis | Bearing Capacity Analysis |
|---|
| dr | C | CH | Wr | dh | fy-R | fy-HR | | Fu | Dc | P | |
|---|
| L1 | 8 | C30 | 100 | 150 | 10 | 36.17 | 70.58 | 95.13 | - | - | - | - |
| L2 | 10 | C30 | 100 | 150 | 10 | 56.52 | 76.75 | 35.79 | 70.04 | 15.64 | 77.08 | 0.43 |
| L3 | 12 | C30 | 100 | 150 | 10 | 81.69 | 86.94 | 6.43 | - | - | - | - |
| L4 | 14 | C30 | 100 | 150 | 10 | 110.78 | 95.00 | 14.24 | - | - | - | - |
| M1 | 10 | C25 | 100 | 150 | 10 | 56.52 | 74.79 | 32.32 | 60.70 | 14.29 | 67.14 | −10.23 |
| L2 | 10 | C30 | 100 | 150 | 10 | 56.52 | 76.75 | 35.79 | 70.04 | 15.64 | 77.08 | 0.43 |
| M3 | 10 | C35 | 100 | 150 | 10 | 56.52 | 82.39 | 45.77 | 77.05 | 16.87 | 84.64 | 2.73 |
| M4 | 10 | C40 | 100 | 150 | 10 | 56.52 | 85.22 | 50.78 | 84.05 | 17.79 | 92.06 | 8.02 |
| N1 | 10 | C30 | 75 | 150 | 10 | 56.52 | 75.56 | 33.69 | - | - | - | - |
| L2 | 10 | C30 | 100 | 150 | 10 | 56.52 | 76.75 | 35.79 | 70.04 | 15.64 | 77.08 | 0.43 |
| N3 | 10 | C30 | 125 | 150 | 10 | 56.52 | 88.53 | 56.63 | 83.14 | 15.64 | 90.18 | 1.86 |
| N4 | 10 | C30 | 150 | 150 | 10 | 56.52 | 98.59 | 74.43 | 96.70 | 15.64 | 103.74 | 5.22 |
| O1 | 10 | C30 | 100 | 125 | 10 | 56.52 | 70.93 | 25.50 | 72.82 | 15.64 | 79.86 | 12.58 |
| L2 | 10 | C30 | 100 | 150 | 10 | 56.52 | 76.75 | 35.79 | 70.04 | 15.64 | 77.08 | 0.43 |
| O3 | 10 | C30 | 100 | 175 | 10 | 56.52 | 82.59 | 46.13 | 68.93 | 15.64 | 75.97 | −8.02 |
| O4 | 10 | C30 | 100 | 200 | 10 | 56.52 | 86.12 | 52.37 | 68.84 | 15.64 | 75.88 | −11.89 |
| P1 | 10 | C30 | 100 | 150 | 8 | 56.52 | 73.47 | 29.99 | - | - | - | - |
| L2 | 10 | C30 | 100 | 150 | 10 | 56.52 | 76.75 | 35.79 | 70.04 | 15.64 | 77.08 | 0.43 |
| P3 | 10 | C30 | 100 | 150 | 12 | 56.52 | 86.71 | 53.41 | - | - | - | - |
| P4 | 10 | C30 | 100 | 150 | 14 | 56.52 | 95.77 | 69.44 | - | - | - | - |
| Q1 | 8 | C30 | 100 | 150 | 8 | 33.17 | 69.89 | 110.70 | 56.83 | 10.56 | 61.58 | −11.89 |
| L2 | 10 | C30 | 100 | 150 | 10 | 56.52 | 76.75 | 35.79 | 70.04 | 15.64 | 77.08 | 0.43 |
| Q3 | 12 | C30 | 100 | 150 | 12 | 70.65 | 93.23 | 31.96 | 87.38 | 22.59 | 97.54 | 4.63 |
| Q4 | 14 | C30 | 100 | 150 | 14 | 96.56 | 120.47 | 24.76 | 107.07 | 30.71 | 120.89 | 0.35 |
Table 5.
Statistical parameters of concrete tensile strength.
Table 5.
Statistical parameters of concrete tensile strength.
| Concrete Grade | Symbol | C30 | C35 | C40 |
|---|
| Average value (MPa) | μft | 2.58 | 3.12 | 3.63 |
| Coefficient of variation | δft | 0.172 | 0.156 | 0.149 |
Table 6.
Statistical parameters for the geometric dimensions of structural members.
Table 6.
Statistical parameters for the geometric dimensions of structural members.
| Geometric Size | Symbol | Anchor Length | Cover Layer | Rebar Diameter | Relative Position |
|---|
| Average value | μ | 1.025 | 0.9 | 1 | 1 |
| Coefficient of variation | δ | 0.077 | 0.30 | 0.018 | 0.06 |
Table 7.
Anchorage lengths of the ring joint.
Table 7.
Anchorage lengths of the ring joint.
| Content | Symbol | Analysis Results |
|---|
| Concrete grade | C | C30 | C35 | C40 |
| Straight anchor section | lv | 24d | 19d | 16d |
© 2019 by the authors. Licensee MDPI, Basel, Switzerland. This article is an open access article distributed under the terms and conditions of the Creative Commons Attribution (CC BY) license (http://creativecommons.org/licenses/by/4.0/).


