Review

Contribution of Smart Cities to the Energy Sustainability of the Binomial between City and Country

by
Manuel Villa-Arrieta
1 and
Andreas Sumper
2,*
1
Escola Tècnica Superior d’Enginyeria Industrial de Barcelona (ETSEIB), Universitat Politècnica de Catalunya (UPC), Av. Diagonal, 647, 08028 Barcelona, Spain
2
Centre d’Innovació Tecnològica en Convertidors Estàtics i Accionaments (CITCEA-UPC), Escola Tècnica Superior d’Enginyeria Industrial de Barcelona (ETSEIB), Universitat Politècnica de Catalunya (UPC), Av. Diagonal, 647, Pl. 2, 08028 Barcelona, Spain
*
Author to whom correspondence should be addressed.
Appl. Sci. 2019, 9(16), 3247; https://doi.org/10.3390/app9163247
Submission received: 30 June 2019 / Revised: 3 August 2019 / Accepted: 6 August 2019 / Published: 8 August 2019
(This article belongs to the Special Issue Solar Energy Applications in Houses, Smart Cities and Microgrids)

Abstract

:

Featured Application

This work analyzes the contribution of energy self-sufficiency in cities (smart cities) to energy security and the environmental sustainability of the countries.

Abstract

Cities are at the center of the transition to a decarbonized economy. The high consumption of electricity in these urban areas causes them to be the main focus of greenhouse gas emissions. However, they have a high margin of capacity to increase energy efficiency and local energy generation. Along these lines, the smart urban management model has been proposed as a solution to the unsustainability of cities. Due to the global trend of population concentration in urban areas, cities tend to be representative of the population, energy consumption, and energy sustainability of their countries. Based on this hypothesis, this paper studied the relationship between the smart city model and the concept of energy sustainability. First, the research analyzed the relationship between urban population growth and energy sustainability; and then the self-consumption capacity of photovoltaic electricity of the main cities of the countries classified in the energy sustainability indicator (Energy Trilemma Index 2017) of the World Energy Council was analyzed. According to the results, the scope of action for self-consumption of photovoltaic electricity is broad and cities have the capacity to contribute significantly to the energy sustainability of their countries. Following the approach of other authors, the development of energy sustainability objectives and the installation of smart systems in distribution grids must be aligned with national objectives.

1. Introduction

Covering the current needs of humanity without jeopardizing the coverage of the needs of future generations is the definition established for sustainable development [1]. Thus, the concept of energy sustainability is used to address the coverage of the energy demand of society. However, this process has not been sustainable because the development and economic growth of humanity has been based on the use of energy resources of fossil origin. The transformation of these resources to final energy has had an impact on the emission of greenhouse gases (GHG), the precursors of climate change.
This final energy, mainly in the form of electricity, has been mainly destined to meet the energy demand of the urban population. As seen in Figure 1 (which includes data after the 1973 oil crisis), electricity consumption has a greater correlation with the growth of the urban population than with the growth of the total population. As a further handicap, by 2040 the global demand for energy will have risen by more than a quarter due to the increase of people residing in urban areas in developing economies to 1.7 billion [2]; by 2050, 75% of the population will live in the cities [3].
Because energy consumption is transversal to economic activity, mitigation and adaptation measures towards climate change are marked by a process of the transformation of the current economic model to one decarbonized. This process is called energy transition and is based on increasing energy efficiency, electrification, and the use of renewable energy resources [5]. At the scale of the cities there is talk of urban energy transition (UET) to the use of urban renewable energy resources and the reduction of the energy consumption of buildings [6]. Compared to industry, transport, and other energy end-use consumption sectors (according to the New Policies Scenario of the World Energy Outlook 2018, in 2017 the final energy consumption was 9696 Mtoe and was distributed as follows: 3265 Mtoe in the industry (29.45%), 2794 Mtoe in transport (28.82%), 3047 Mtoe in buildings (31.43%), and 999 Mtoe (10.3%) in other energy end-use consumption sectors), world energy consumption is concentrated in buildings [2]. Thus, the greatest potential for energy saving is in these constructions [6].
In this regard, the strategies of the UET seeks to make the operation of the electrical system more flexible through the empowerment of the consumer in the management of demand and the generation of urban energy through the energy self-consumption in buildings. Making the electrical system more flexible involves an optimal combination of demand and renewable energy generation. However, the main sources of this type of energy, such as solar and wind, are intermittent: Periods of higher renewable generation generally usually occur during periods of lower residential energy demand. Therefore, to take full advantage of these energy sources, it is necessary to implement mechanisms that optimize the operation of the distribution system in cities.
A strategy aimed at addressing competitiveness and confronting the efficiency and limitation of the economic and natural resources of the urban areas is smart city model [7,8]. Although this strategy surfaced during the last decade to address the limitation of energy resources in cities and the inherent production of GHG, today it covers other fields that include the provision of urban services, and governance, knowledge, and behavior of citizens [9]. Technically, smart cities are cities with a high degree of penetration of Information and Communication Technologies (ICT) to create synergies [10] between technological components and economic agents.
Due to the global trend of population concentration in these urban areas, cities tend to be representative of the population, energy consumption, and energy sustainability of their countries. Based on this hypothesis, this paper analyzes the theoretical contribution that the smart city model can have on the energy sustainability of countries. In this context, from theoretical and empirical approaches and with conceptual results, this research seeks to contribute to the study of UET.
In this regard, this paper provides a description of the smart city model and the concept of energy sustainability in Section 2, in order to analyze the common elements between them in Section 3. Finally, in Section 4, the paper analyzes the effect of the concentration of the urban population and the use of solar resources in cities in terms of their countries’ energy sustainability.

2. Concepts Review

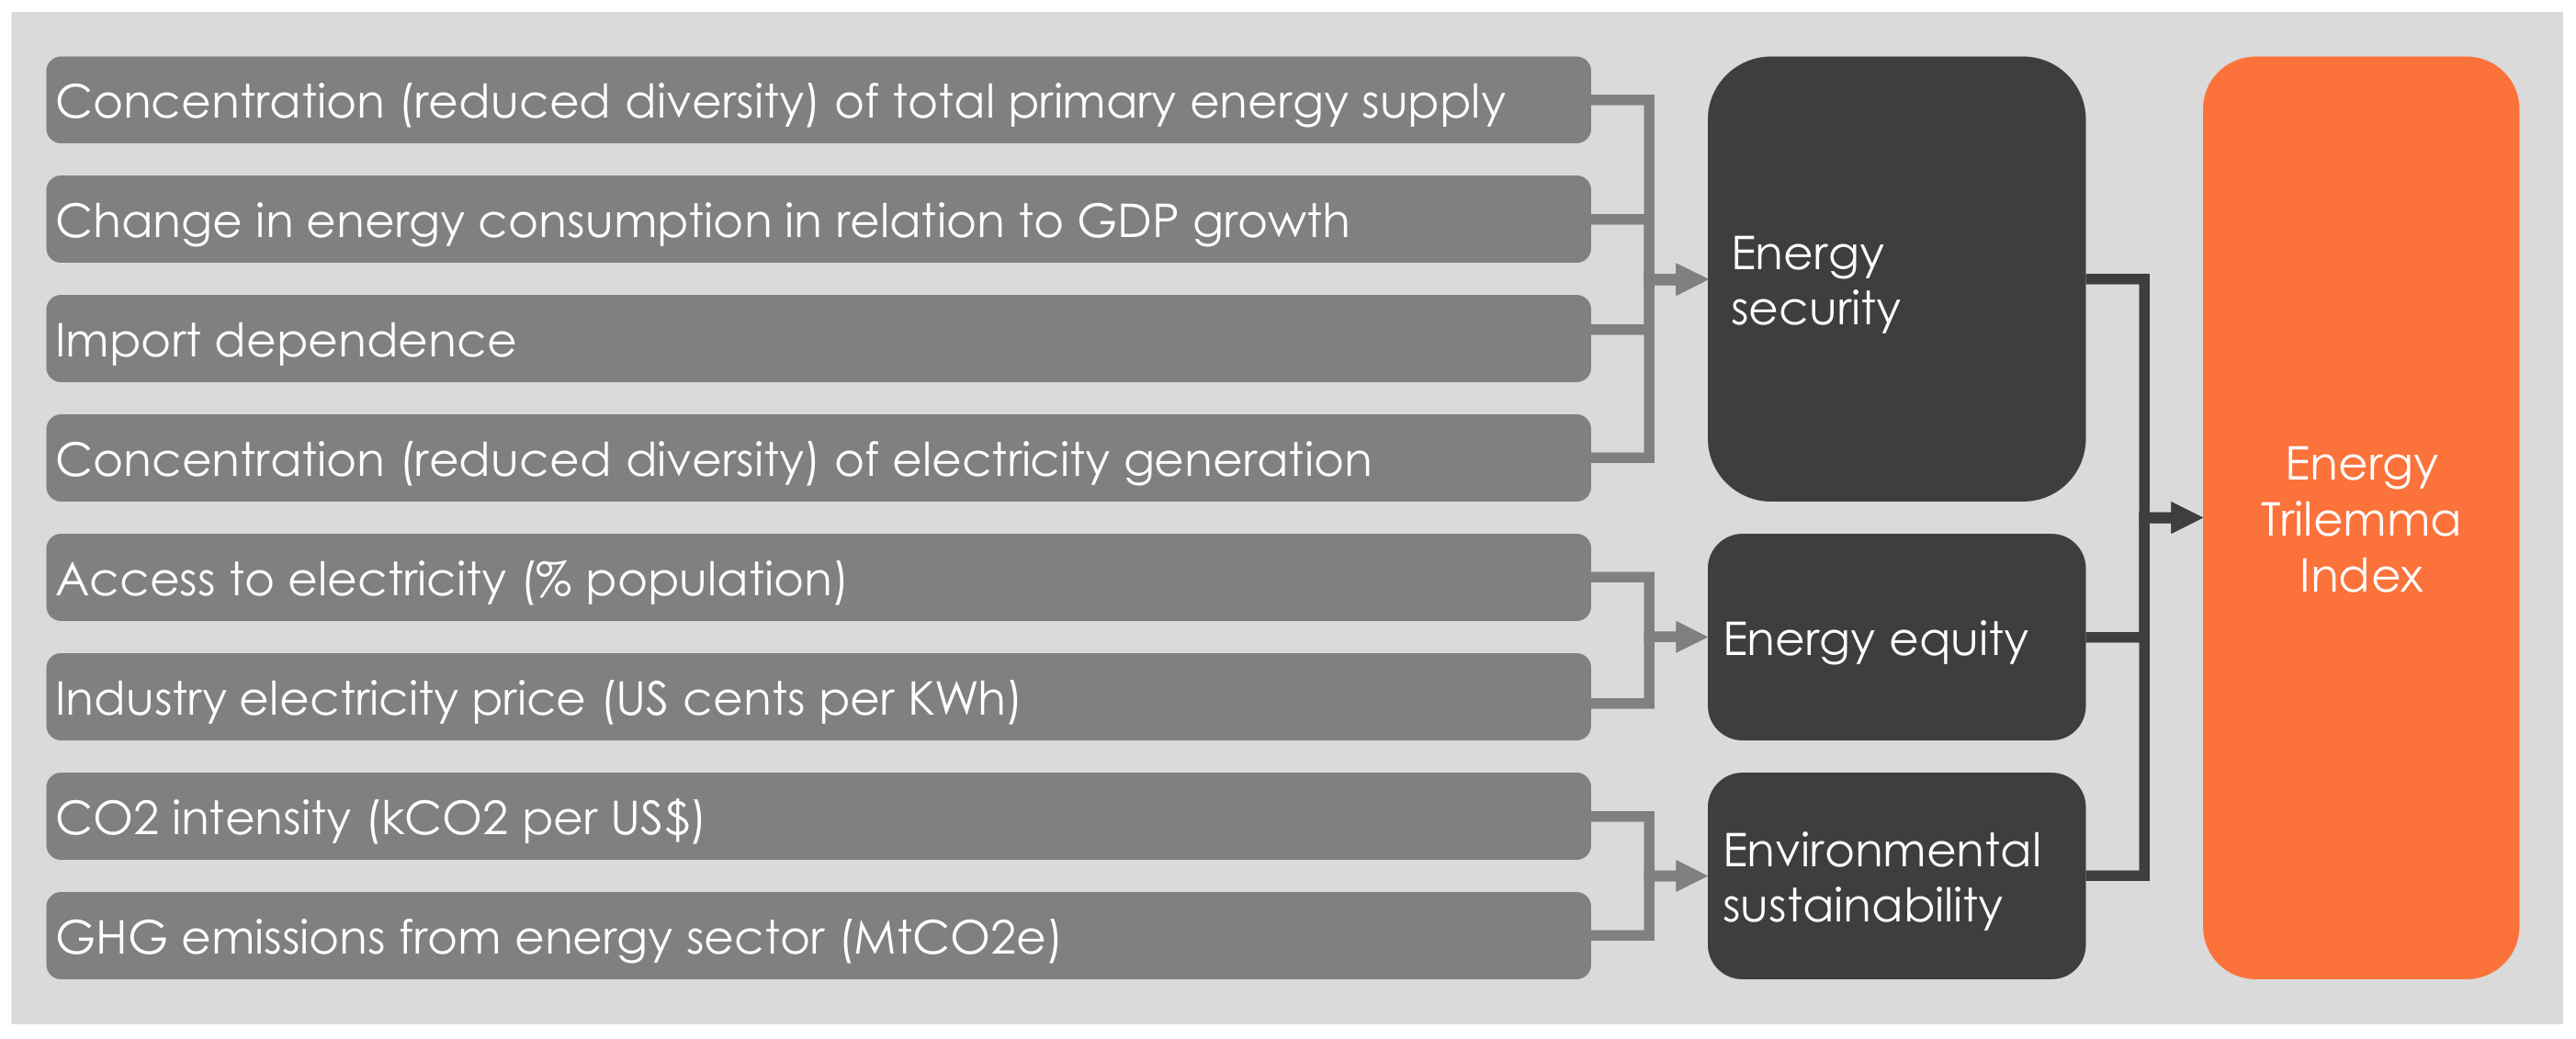
2.1. Energy Sustainability

According to the World Energy Council (WEC), the definition of energy sustainability is based on three core dimensions: energy security, energy equity, and environmental sustainability. Together, they make up a “trilemma” and achieving high performance in all three dimensions entails complex, interwoven links between public and private actors, governments and regulators, economic and social factors, national resources, environmental concerns, and individual behaviors [11]. In order to evaluate the performance of this energy sustainability trilemma for countries, the WEC uses the Energy Trilemma Index.
The index is a complete, rigorous, and widely-recognized indicator for decision-making on energy policy [12]. In its calculation, 75% corresponds to the analysis of the energy performance of the countries, where energy security, energy equity, and environmental sustainability are evaluated. The remaining 25% corresponds to the analysis of contextual performance. Generally speaking, a country is awarded a better rating and position in the ranking when it demonstrates a better energy and contextual performance. From now on, to talk about energy sustainability in this paper, we will only refer to energy performance, and the following acronyms will be used: ETI to talk about the Energy Trilemma Index; ESR to talk about energy security; EQR to talk about energy equity; and EVR to talk about environmental sustainability.
Energy security is the effective management of primary energy supply from domestic and external sources, reliability of energy infrastructure, and ability of energy providers to meet current and future demand; energy equity is the accessibility and affordability of energy supply across the entire population; and environmental sustainability is achievement of supply- and demand-side energy efficiencies and development of energy supply from renewable and other low-carbon sources [11]. The contextual indicators consider the broader circumstances of energy performance, including a country’s ability to provide coherent, predictable and stable policy and regulatory frameworks, initiate R&D and innovation, and attract investment [12].
ETI studies 125 countries according to region and their gross domestic product per capita (group GDP or Group-Roman_number). The regions are Europe (E), Sub-Saharan Africa (Sub-Saharan, S), Asia (A), Latin America and the Caribbean (LAC, L), the Middle East (MENA, M), and North Africa (North-America, N). The GDP is divided into Group-I (more than 33,500 USD), Group-II (between 14,300 and 33,500 USD), Group-III (between 6000 and 14,300 USD), and Group-IV (less than 6000 USD). In the context of this paper, the results in 2017 of this index were organized in Figure 2. Group-I does not contain any countries form the LAC or Sub-Saharan regions and Group-IV does not contain countries in MENA, North America. Group-II is the only group with has countries from all six regions of the study.
The ETI also has an interactive tool, the pathway calculator, that can be used to determine what is necessary to improve the ranking position and understand the impact of policymaking on achieving a sustainable energy future [13]. Figure 3 presents the indicators of this virtual tool. According to this tool, basically a country obtains a better energy sustainability by diversifying its mix of primary energy sources, diversifying its mix of electricity generation, reducing energy imports, and reducing its CO2 and other GHG emissions.

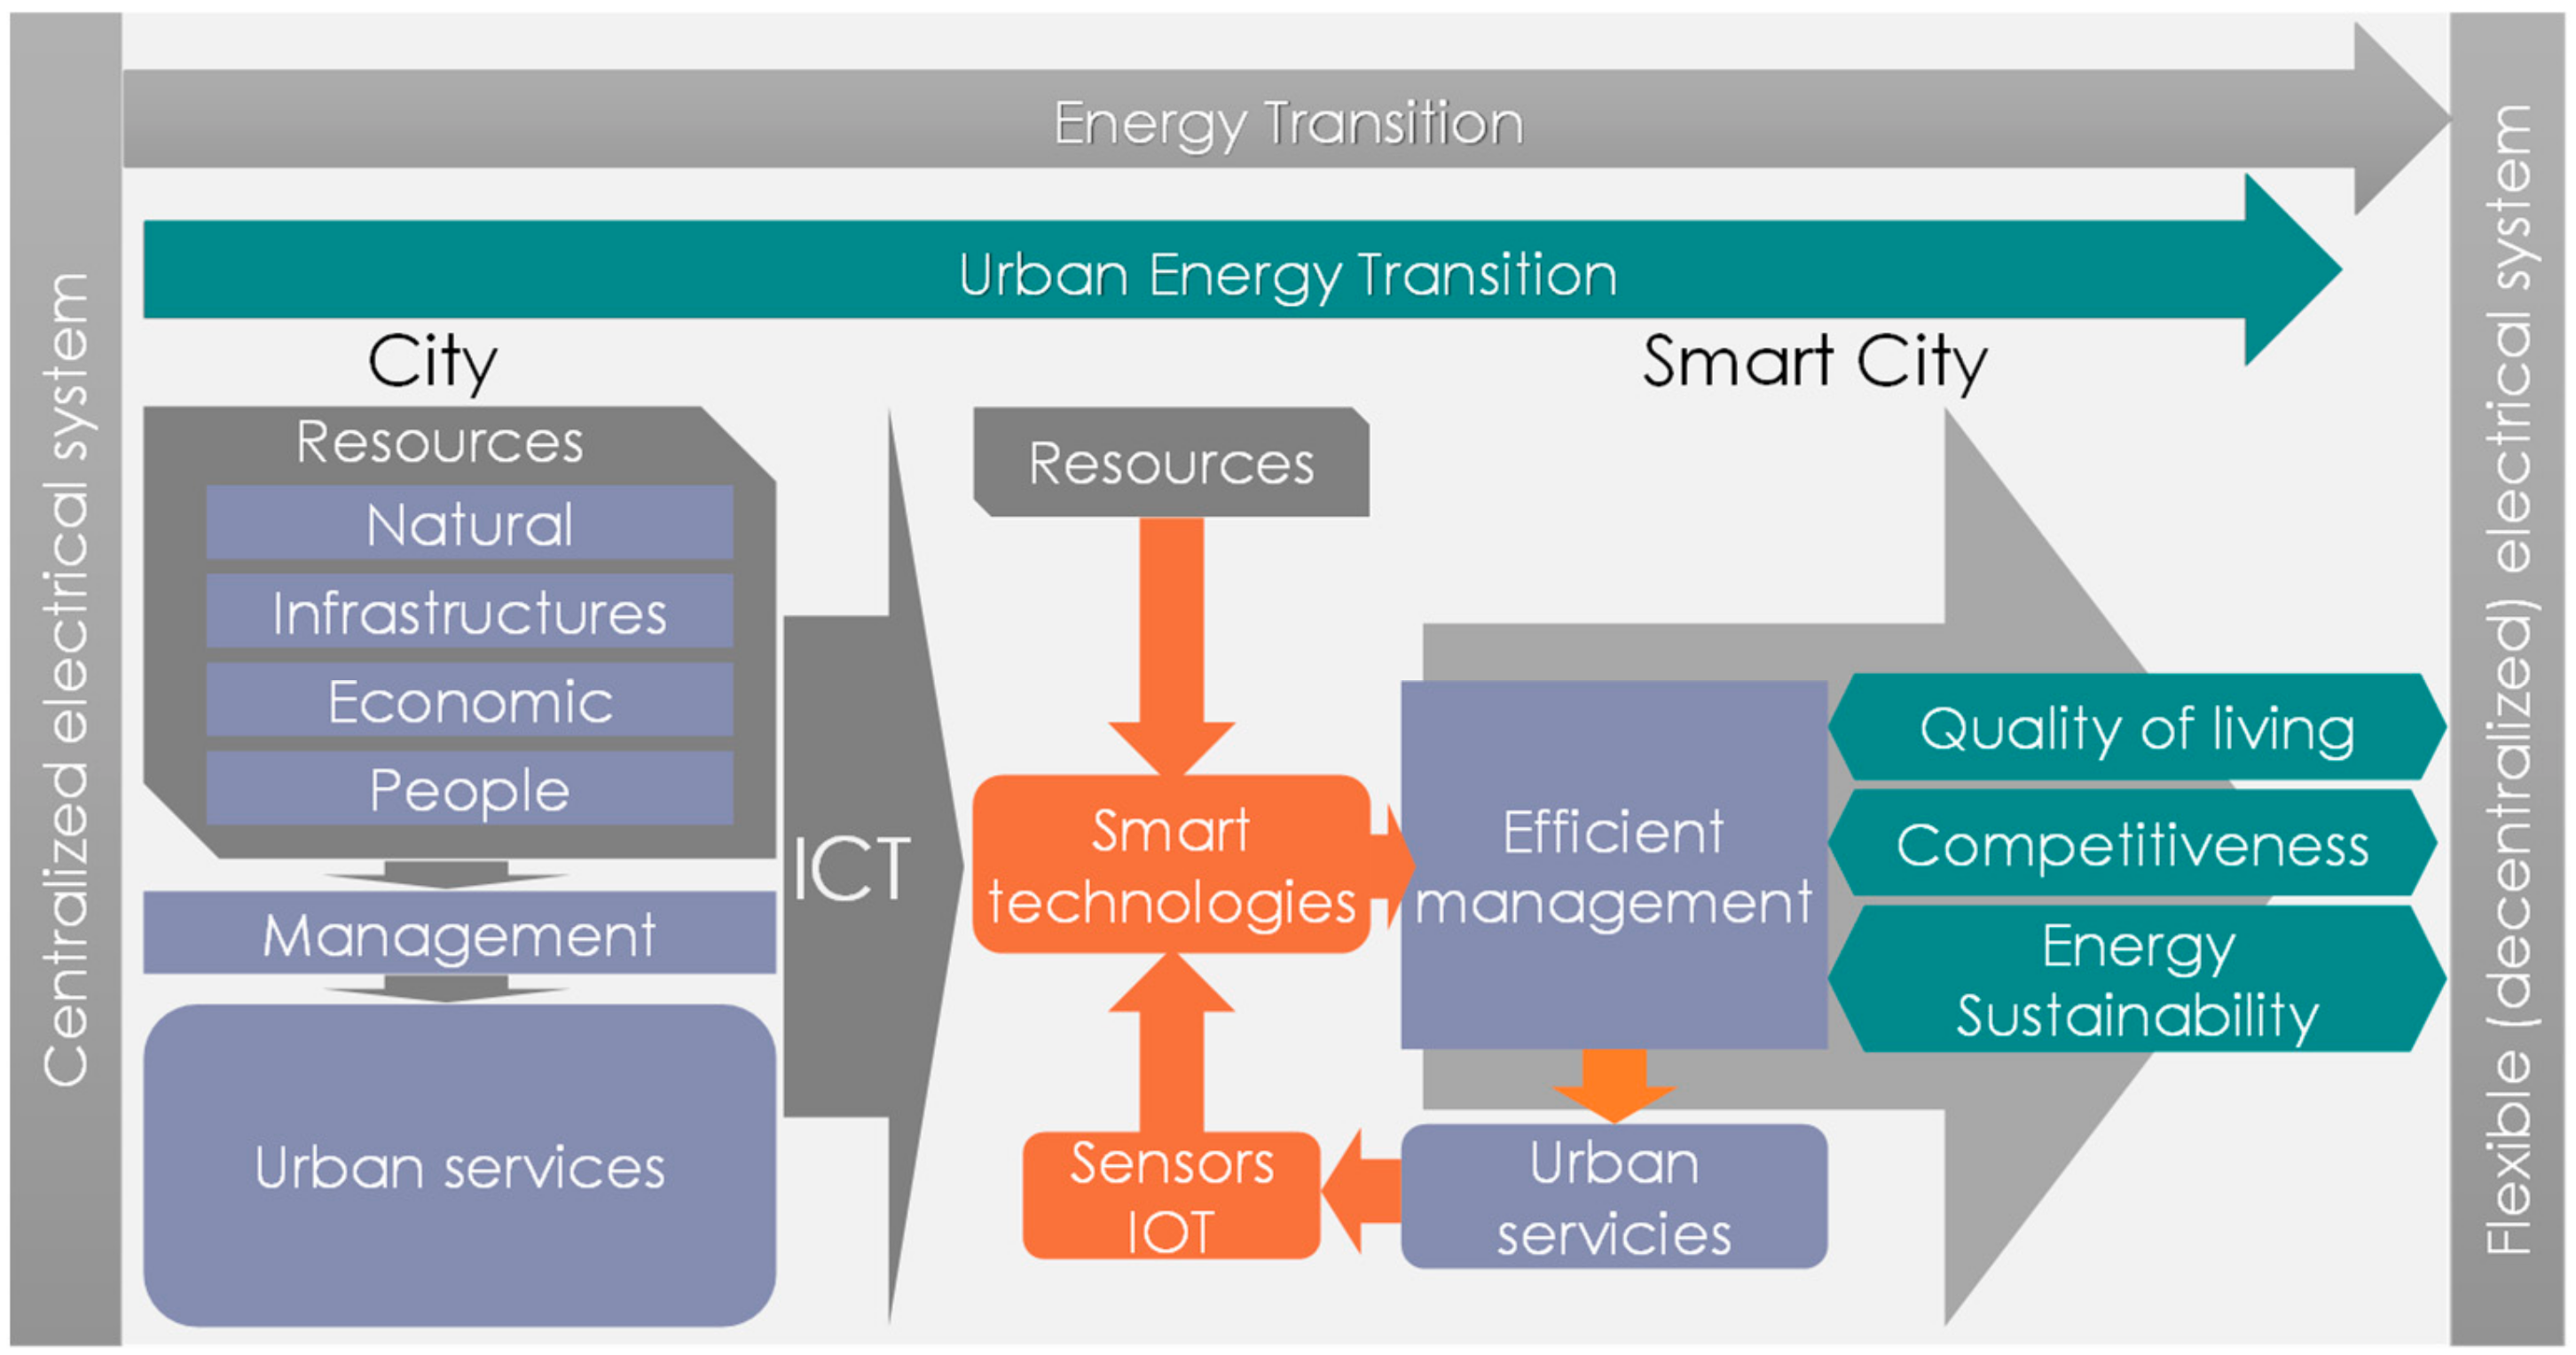
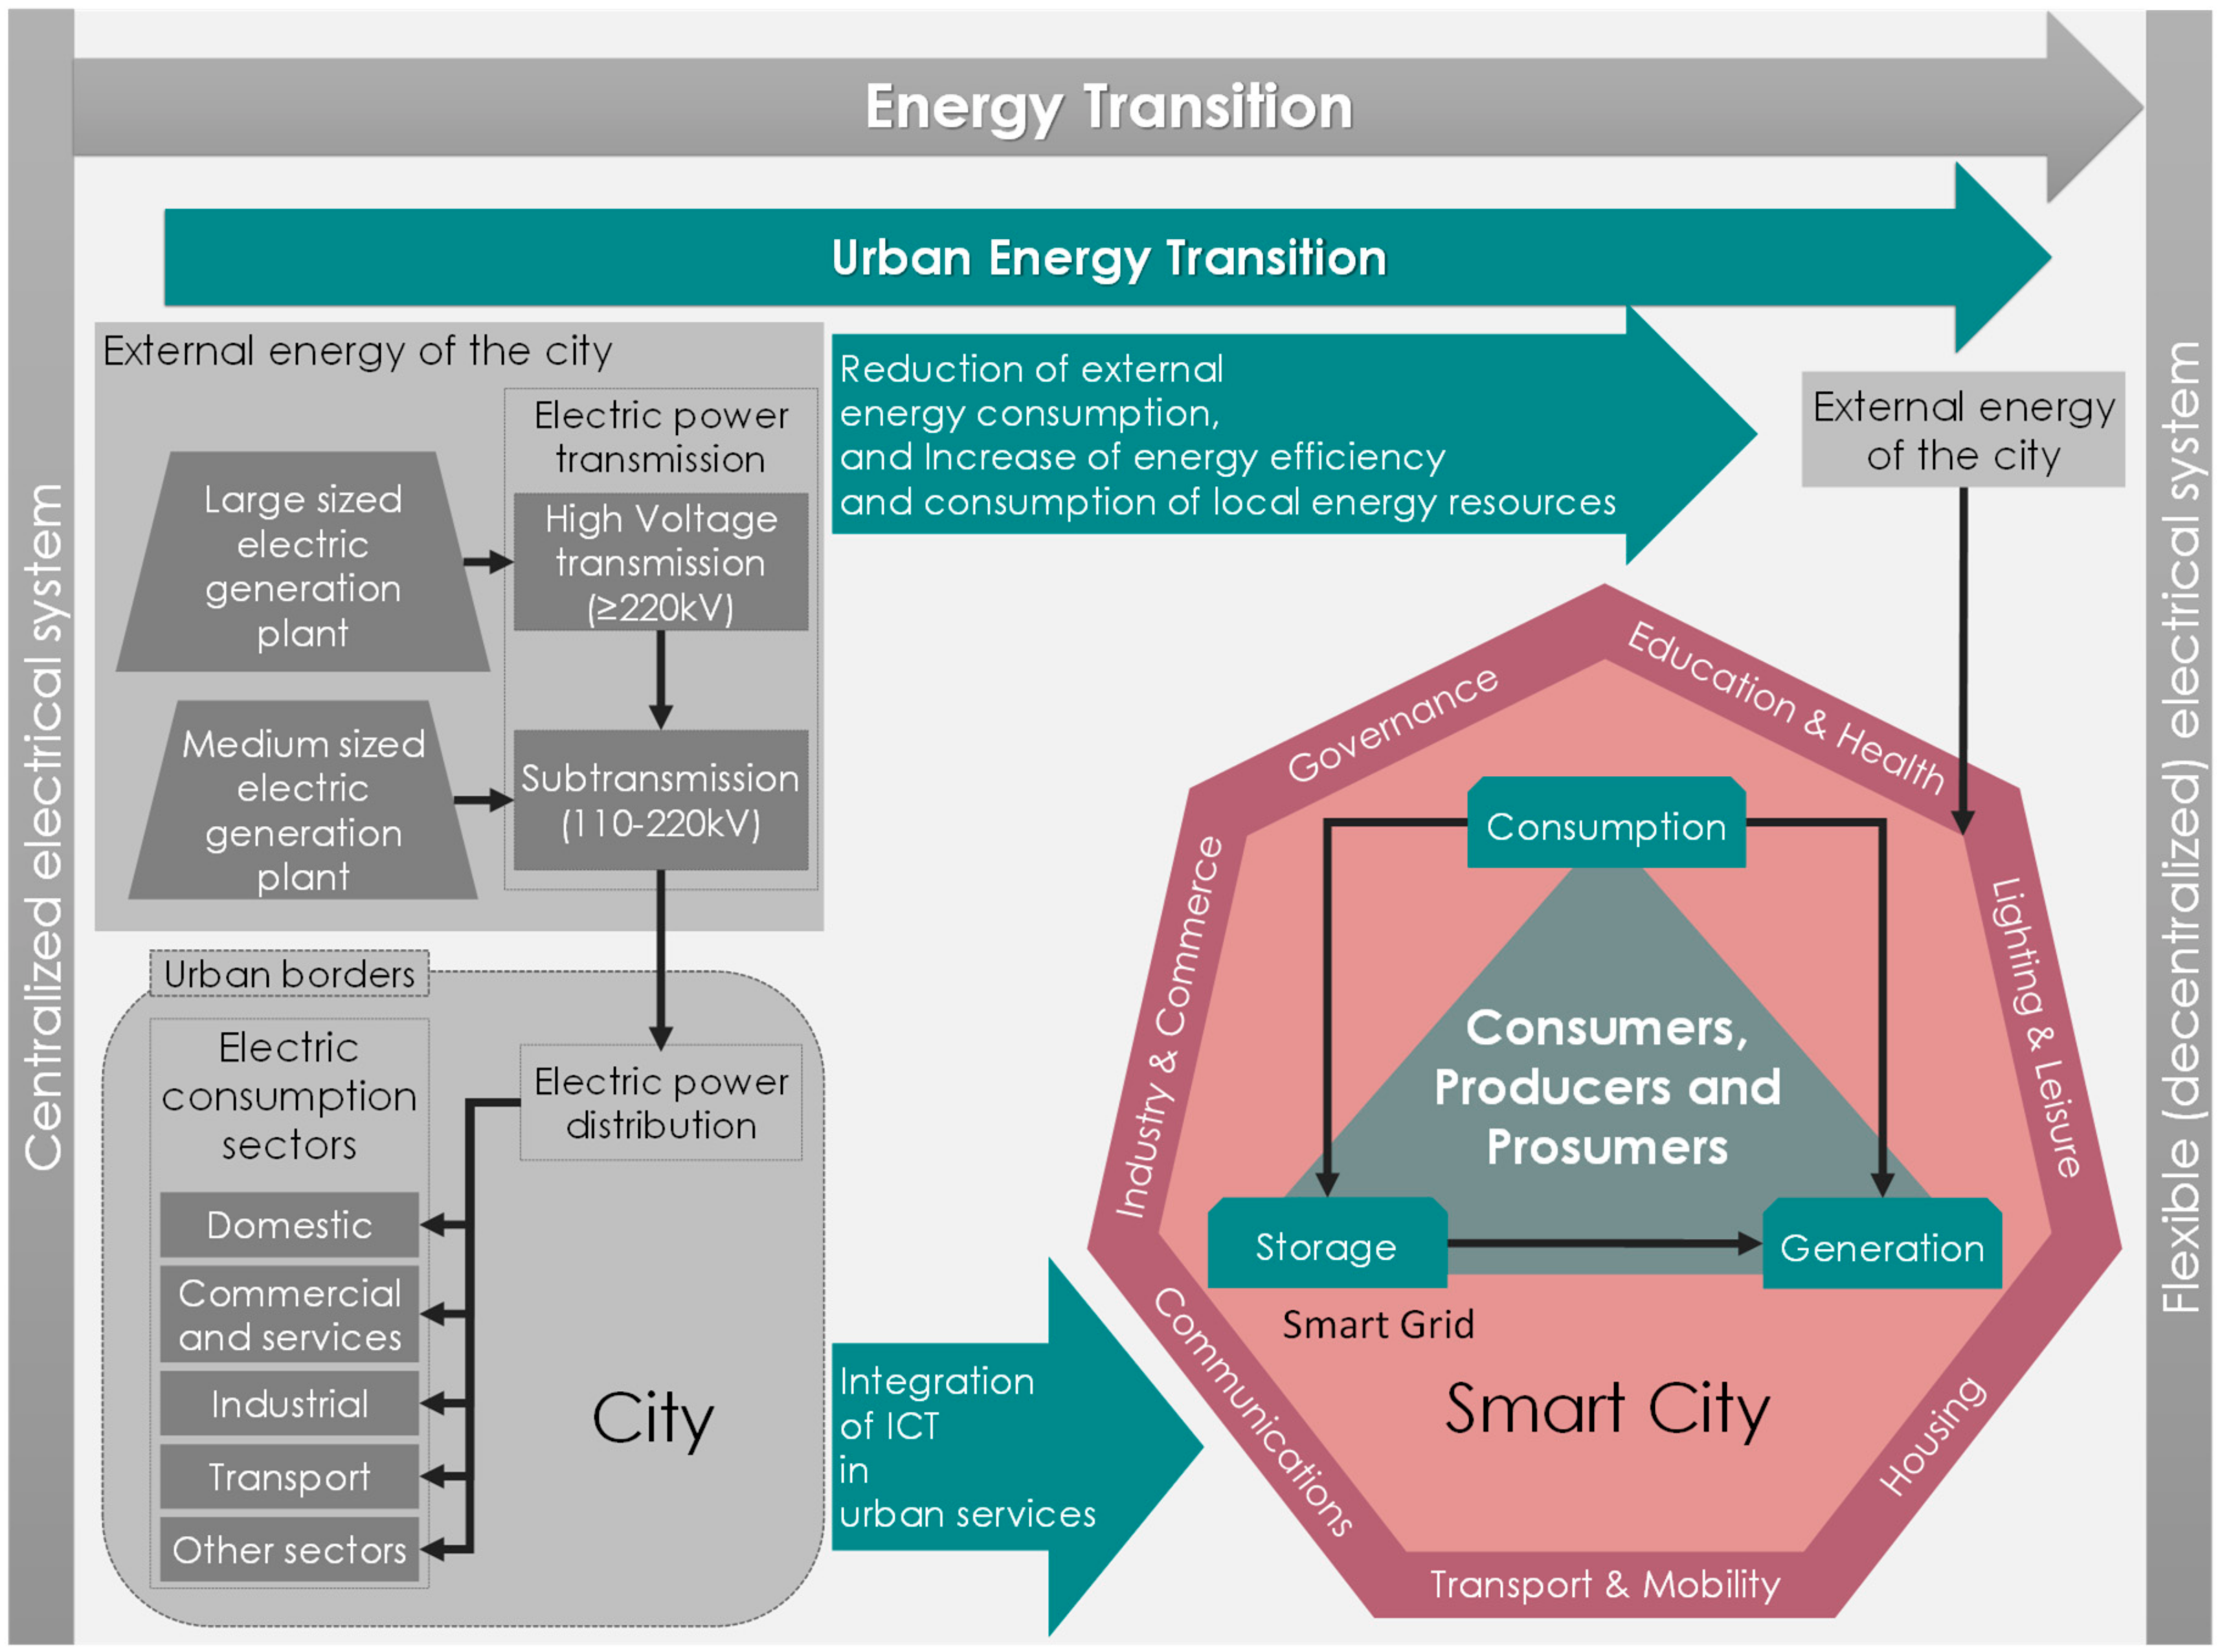
2.2. Smart City Model

The SMART criterion emerged in the 1980s and is an acronym of the objectives of a business management proposal: specific, measurable, achievable, relevant, time-bound [14]. Later these criteria became a concept which was applied to different disciplines of study, with the intention of improving results in terms of increased efficiency in resource management by coordinating information between different systems. From an organizational point of view, information control in cities would allow cross-communication between the actors involved in the management of cities and citizens [15]. Thus, through the advancement of ICT, the coordination of information between systems improves the SMART management approach towards its application in more complex systems such as cities [16,17,18,19,20].
From an integral and holistic point of view, the smart city concept brings together a series of strategic proposals, which seeks for the development and future growth of cities in order to make them competitive, sustainable, and able to offer a high quality of life to urban population [21,22,23]. With the control of information, the crux of these management proposals is to find out the modus operandi of the demand for urban services in order to efficiently manage the resources available: natural resources (energy, water, air), infrastructures, economic resources, people, and knowledge.
Since the early 1990s, the smart city concept has been a subject of study (a search for the term “smart city” in the Web of Science (WOS) and Scopus return the first references to it in 1991 [24] and 1997 [25]). From this time until the middle of the current decade, various authors have published their views on the definition without reaching an agreement about the scope of this concept [21,26,27,28]. Even so, the definitions presented included proposals for the working taxonomy of this type of city, such as in [26], evaluation and classification methodologies as in [29,30], planning in [31], suggestions for strategies to successfully implement the smart model in cities in [28,32,33], and in the case of [34], a reference initiative for this purpose, in this case it was Barcelona. These publications also included methods to integrate technological devices into the services that are to be provided in cities, such as [35].
Working with the same concept, to date, the study of the smart city concept has been done by international (the European Union’s approach to the smart city concept considers energy sustainability to be a priority on the basis of the main energy resource being energy efficiency [36,37], and the conception, development, and integration of urban energy production and use. Its objective is to improve efficiency as well as reduce energy consumption and the emission of GHG [38]) organizations [22] and tech companies [39], companies in the financial sector [40], as well as centers for economic, financial, technological, and social studies. The large number of parties involved in the defining of the smart city concept shows the magnitude of its importance in the future of cities and its ability to catch the attention of the different parties involved in urban growth and development. The ultimate aim of these parties is to work on two closely related aspects of contemporary cities: quality of life and competitiveness [41]. In being competitive, cities seek to attract greater investments and offer a higher level of quality of life to its inhabitants, and they will be able to get the best out of human capabilities, thus in turn making them increasingly competitive [38].
To reach these goals, the working sectors of smart cities can be classified into “hard” and “soft” domains, depending on the importance of ICT systems operating within them [26]. According to this classification, the Hard domain includes the sectors in which ICT help to configure cities at a technical level. These are energy grids; public lighting; natural resources and water management; waste management; environment; transport, mobility, and logistics; office and residential buildings; healthcare and public security. As for the Soft domains, the presence of ICT is limited since they are sectors that do not necessarily require real-time information, processing, and integration. These sectors include education and culture, social inclusion and welfare, public administration and (e-)government and economy.
The inclusion of ICT in the systems and technological elements makes them smart technologies [42], and examples of these are sensors, electric meters, and other elements interconnected via the Internet under the concept of the Internet of Things (IOT) [43,44]. These technologies allow interoperability between components that capture and demand signals and provide a continuous response to service management. In this sense, since the energy service is a transversal element in the efficient provision of the services of cities, the smart cities are found within the framework of the urban energy transition. Figure 4 summarizes this approach in the sense that the integration of ICT in cities allows the application of smart technologies to provide the services demanded by the urban population with the aim of improving the city’s quality of life, competitiveness, and sustainability.
It should be noted that other authors pose different positions or approaches to study. Authors such as [45,46] go one step further and consider the potential of smart technologies as a solution to the problems of environmental unsustainability, which is determined by the size of the carbon footprint and the environmental and energy impact that these technologies will cause during the improvement of other processes. In addition, according to [47], cities can be made sustainable without the use of smart ICT, and smart technologies can be used in cities without contributing to sustainable development; and, these technologies can also be used for sustainable development in locations other than cities.
The energy dimension of smart cities is called the smart energy system. Technically, this is a system in which the technological elements of the energy system and the economic agents of the market (consumers, producers, system and market operators, etc.) are combined to identify synergies between them in order to achieve an optimal solution for each individual sector as well as for the overall energy system [10]. Through these synergies, the smart energy systems can reduce the primary energy consumption of cities and cover the remaining demand by taking advantage of the local renewable energy resources, depending on the climatic characteristics of each city and the profitability of the energy vectors [48].
As seen above, the increase in efficiency (however, work on finding a way to increase efficiency is not new for the electricity sector, and, as a result of an industrial process, the electric sector has always been looking for increased efficiency in order to avoid economic losses) is an objective of the flexibilization of the electricity supply value chain through empowering consumers in power generation and management of demand [49]. The main technological components of a flexible electrical system are smart meters, storage systems, distributed generation (DG) systems and smart grids in order to link all of these components together.
Smart grids are electrical distribution grids that, by integrating ICT into their operation, allow for the bidirectional flow between the other technological components of a smart energy system, and the intercommunication between the economic agents of the electric markets, such as consumers, producers, and the system operator [50,51].
Energy transition to an electricity supply without CO2 emissions depends on the deployment of smart grids [52]. These networks are essential for achieving energy security, affordable energy, and climate change mitigation—the three elements of the “energy trilemma” of energy sustainability [53]. The deployment of smart grids has had different objectives in the main economic regions (for the countries of the European Union (and the regulatory proposal “clean energy for all Europeans”), the United States, and Canada, the main drivers in the development of smart grids have been decarbonization and energy efficiency. For Japan and Korea, it has been the “green economy growth agenda”. For emerging countries, it has been the rapid growth of their infrastructure [53]) of the world [54]. However, the technical benefits of smart grids will require specific regulation for new electricity market conditions with the entry of new players and incentives for investment in transmission grids [55].
Compared to traditional electricity grids, smart grids allow for the limits of penetration of renewable energies to be exceeded, and grant greater efficiency based on operational control and reliability [56,57]. smart grids ensure an economically efficient and sustainable power system with low losses but high levels of quality, security, of supply and safety [58,59]. The points that are interconnected via the smart grids have double or triple functionality: buildings, lighting systems, and vehicles go from simply consuming energy to being able to generate, store, and export it, thus providing support to the intermittent nature of renewable energies [60]. In this way, smart grids adapt the holistic concept of a smart city in terms of flexibility through smart meters and electrical generation in buildings.
Smart meters are electricity meters that replace traditional electromechanical meters. In front of these, the smart meters measure for the flows of electrical energy imported and/or exported to the grid at time intervals of less than an hour [61]. They also allow the consumer to view this information in real-time via telemetry and obtain new services such as demand side management [62]. This mechanism allows the consumer to respond (demand side response, DSR) to the energy information feedback and non-linear pricing schemes that the market offers. The objective is for the consumer to modify their energy consumption and receive economic benefits in return, while the system benefits in the management of electricity generation. Three of the responses that the consumer can give to these signals are the peak clipping, which is the reduction of the consumption in the peak periods; load shifting, which is the change of the consumption of the peak periods to the off-peak periods; and strategic conservation, which is the change in consumption patterns that reduce energy consumption [63].

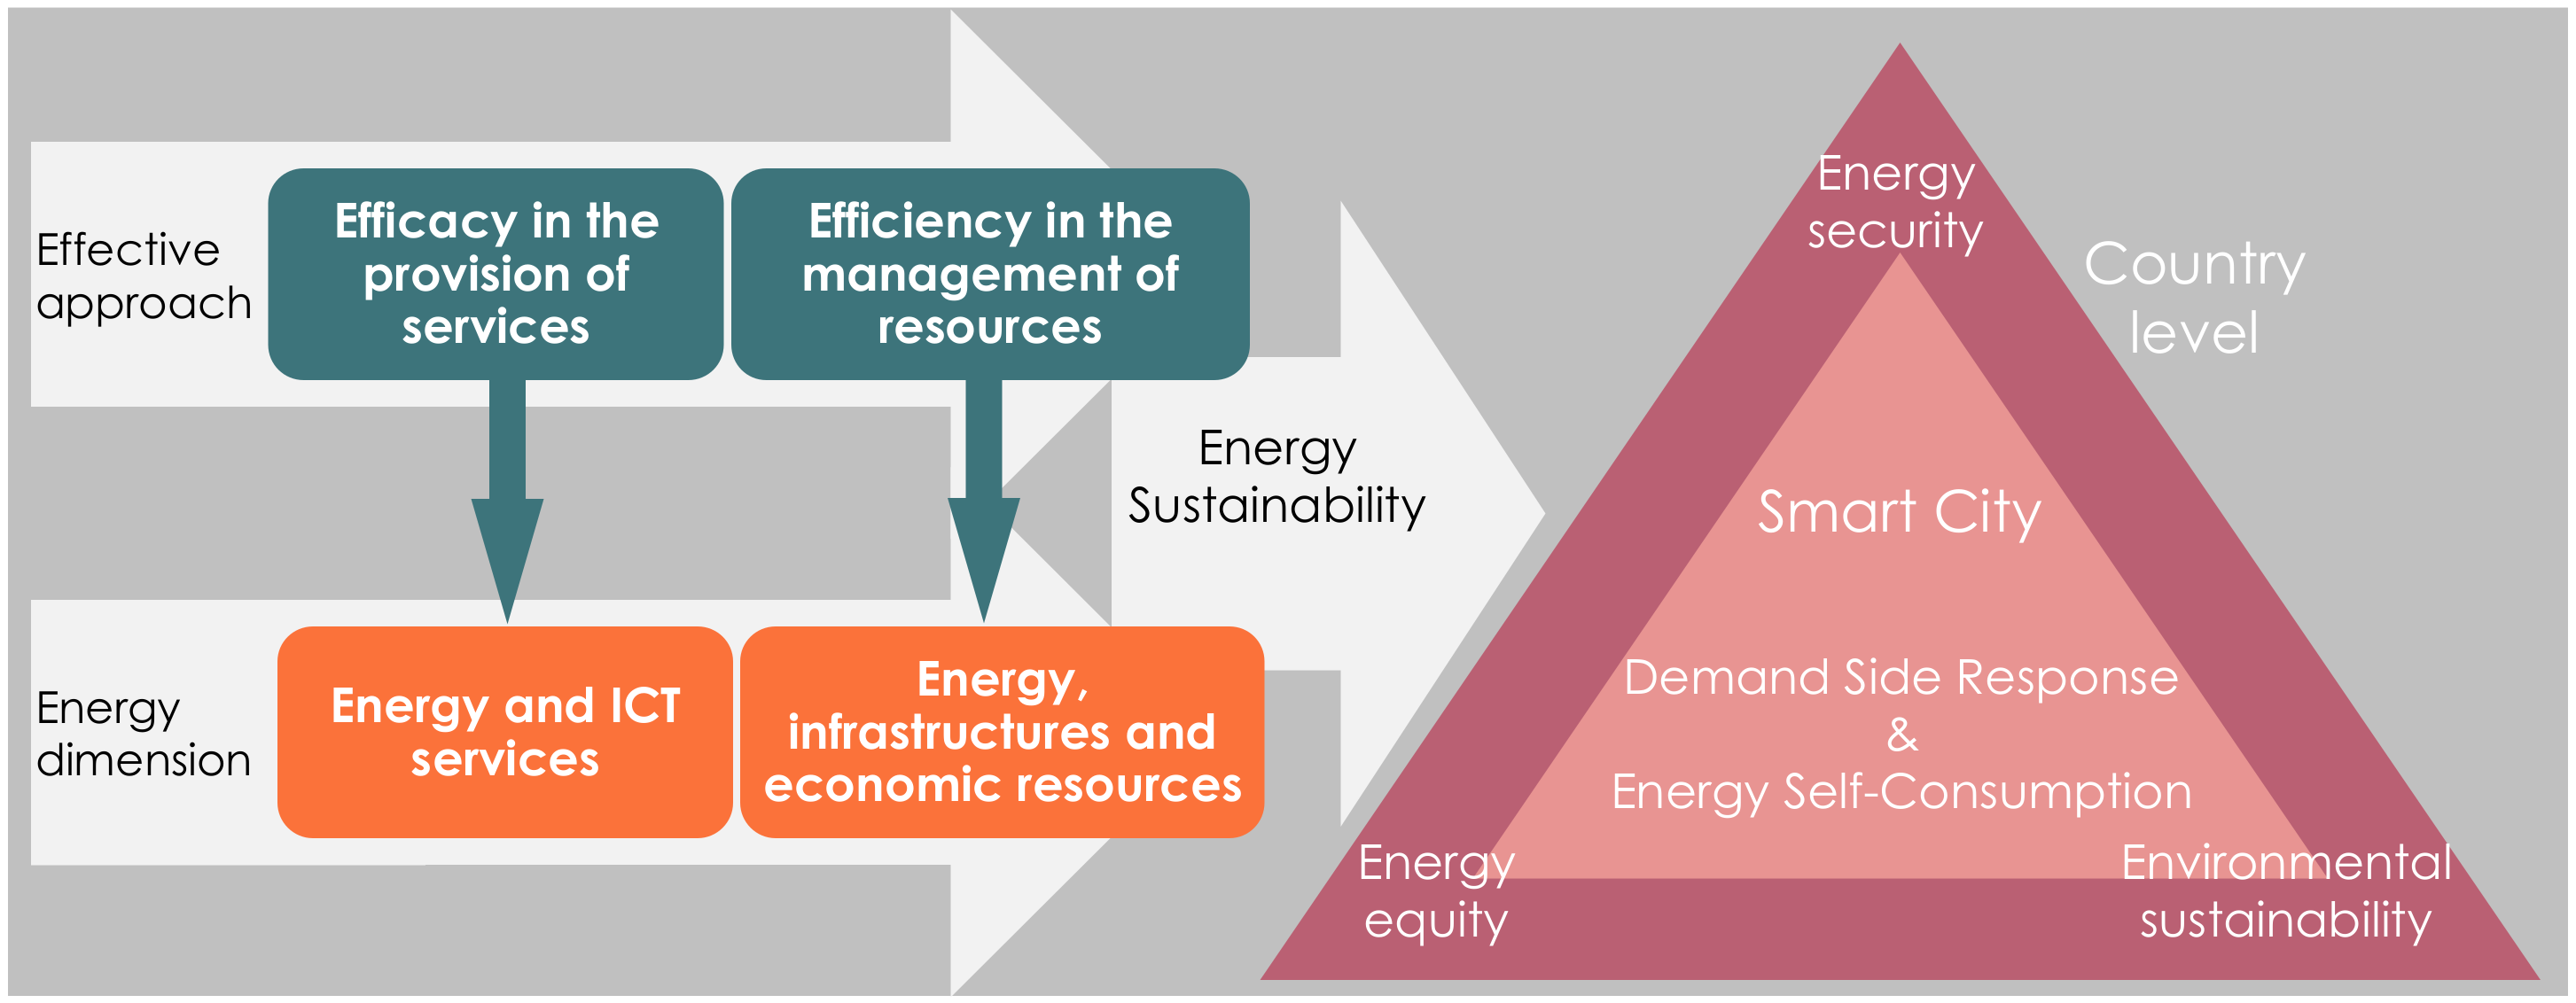
3. Smart city Strategy to Energy Sustainability

This section reviews the shared aspects of energy sustainability and the smart city urban management strategy arising from the analyses above.
The energy transition in cities seeks to change the current model of centralized generation, which is dependent on the consumption of external energy resources, to a distributed one. In this new distributed system, the smart energy systems make the electricity supply more flexible, increasing the efficiency of the distribution value chain, allowing for the integration of renewable energies into the grid and empowering the consumer in the management of demand. Figure 5 shows the process of decentralization of the electrical system within the smart city urban management model.
DG can be defined as electric power generation within distribution grids on the customer side of the network [64]. Through this type of generation, it is possible to take advantage of the renewable energy resources in cities. This improves the system efficiency by reducing the losses incurred by the electric transport grid. On-site generation is based on energy self-consumption under the “zero energy” concept, which is a determining factor in the management of energy resources in smart cities.
When applying this concept to the level of buildings, the idea of “zero energy buildings” emerges. These buildings could provide significant and sustainable reductions and help to realize more energy efficient buildings and cities [65]. As shown in Figure 6, the Zero Energy concept is made up of three parts, which are divided based on the balance between demand and the “credits” obtained from energy self-consumption. Nearly zero energy is when demand is low but even so it exceeds self-consumption. Net zero energy occurs when demand equals self-consumption. Plus zero energy is the result of local generation exceeding the demand and the energy can be stored or exported to the grid, depending on market conditions or distribution grid techniques. The advancement of Zero Energy Buildings and ICT in buildings creates smart buildings: Residential buildings, offices, commercial, or industrial buildings and smart homes (homes with a high level of comfort which are technologically and architecturally integrated into their surroundings—also called Green buildings [66]) [67].
With the presence of smart meters connecting each point of consumption and generation to the smart grid, “zero energy buildings” (Nearly (nZEB), Net (NZEB), and Plus (PZEB)) can share electricity to other DG systems in communities or cities. Therefore, referring back to Figure 6 and taking the “zero energy concept” to a community (building or city) level, it is possible to consider the idea of Nearly Zero Energy Communities/Cities (nZEC); that is to say urban systems made up of “zero energy buildings” and other systems of generation in which, based on the consumption of locally-generated (endogenous) energy, the consumption of external (exogenous) energy is reduced.
From the smart technological development in the distribution grids, new services emerge which will help to increase the energy efficiency of the system by means of the economic incentive to new market agents. Regarding the consumer, although the DSR is a strategy dating from before the development of smart technologies, with smart meters the consumer can manage electric demand in real-time. Similarly, from Zero Energy Buildings, the consumer can become a prosumer of electric energy by adding their surplus energy to the grid and receiving an economic benefit in return. On the other hand, through the advance of distributed generation, PV, and small wind energy have a large margin for growth. This means that energy producers can take advantage of urban spaces or rooftops to generate electricity near consumers. Likewise, demand aggregator comes into play. This is an agent that can bring together the interests of consumers, prosumers and small producers of electrical power to offer services to the system operator [68].
The smart city urban management strategy aims to contribute to the energy sustainability of the planet [6]. However, achieving this objective depends on the progress of DG and; therefore, depends on the investments made in nZEB/NZEB/PZEB towards nZEC [69]. In this sense, the evaluation of investment projects of this type of buildings, and cities, covers the analysis of a wide variety of technical, financial, and economic conditions of the markets [70]. Thus, the advance of generation systems that take advantage of renewable energy resources in cities will produce a whole range of changes for the electricity system, among which are the loss of value of existing infrastructure and the operation of the energy sector [71].
The exploration of the smart city concept indicates that this model or city strategy is presented as the urban management solution that has effectiveness as the aim. Combining ”efficacy” and “efficiency”, the operation of the smart city energy system seeks:
  • Guarantee the efficacy of the energy service in cities, based on the safety and quality of the electricity supply (meaning no interruptions in service) in order to provide services (mobility, lighting, heating, cooling, health, etc.) as demanded by the urban population.
  • Manage efficiently the resources needed to provide the energy service to the city: energy resources, economic resources, and the existing infrastructures.
Energy technologies have always focused on efficacy. However, with the superposition of the SMART and ICT criteria, the electric power system gains efficiency to obtain economic and environmental benefits. Figure 7 presents a summary of the results of the analysis of the relationship between effective provision of the energy service and the achievement of the objectives cities and countries have in terms of energy sustainability.

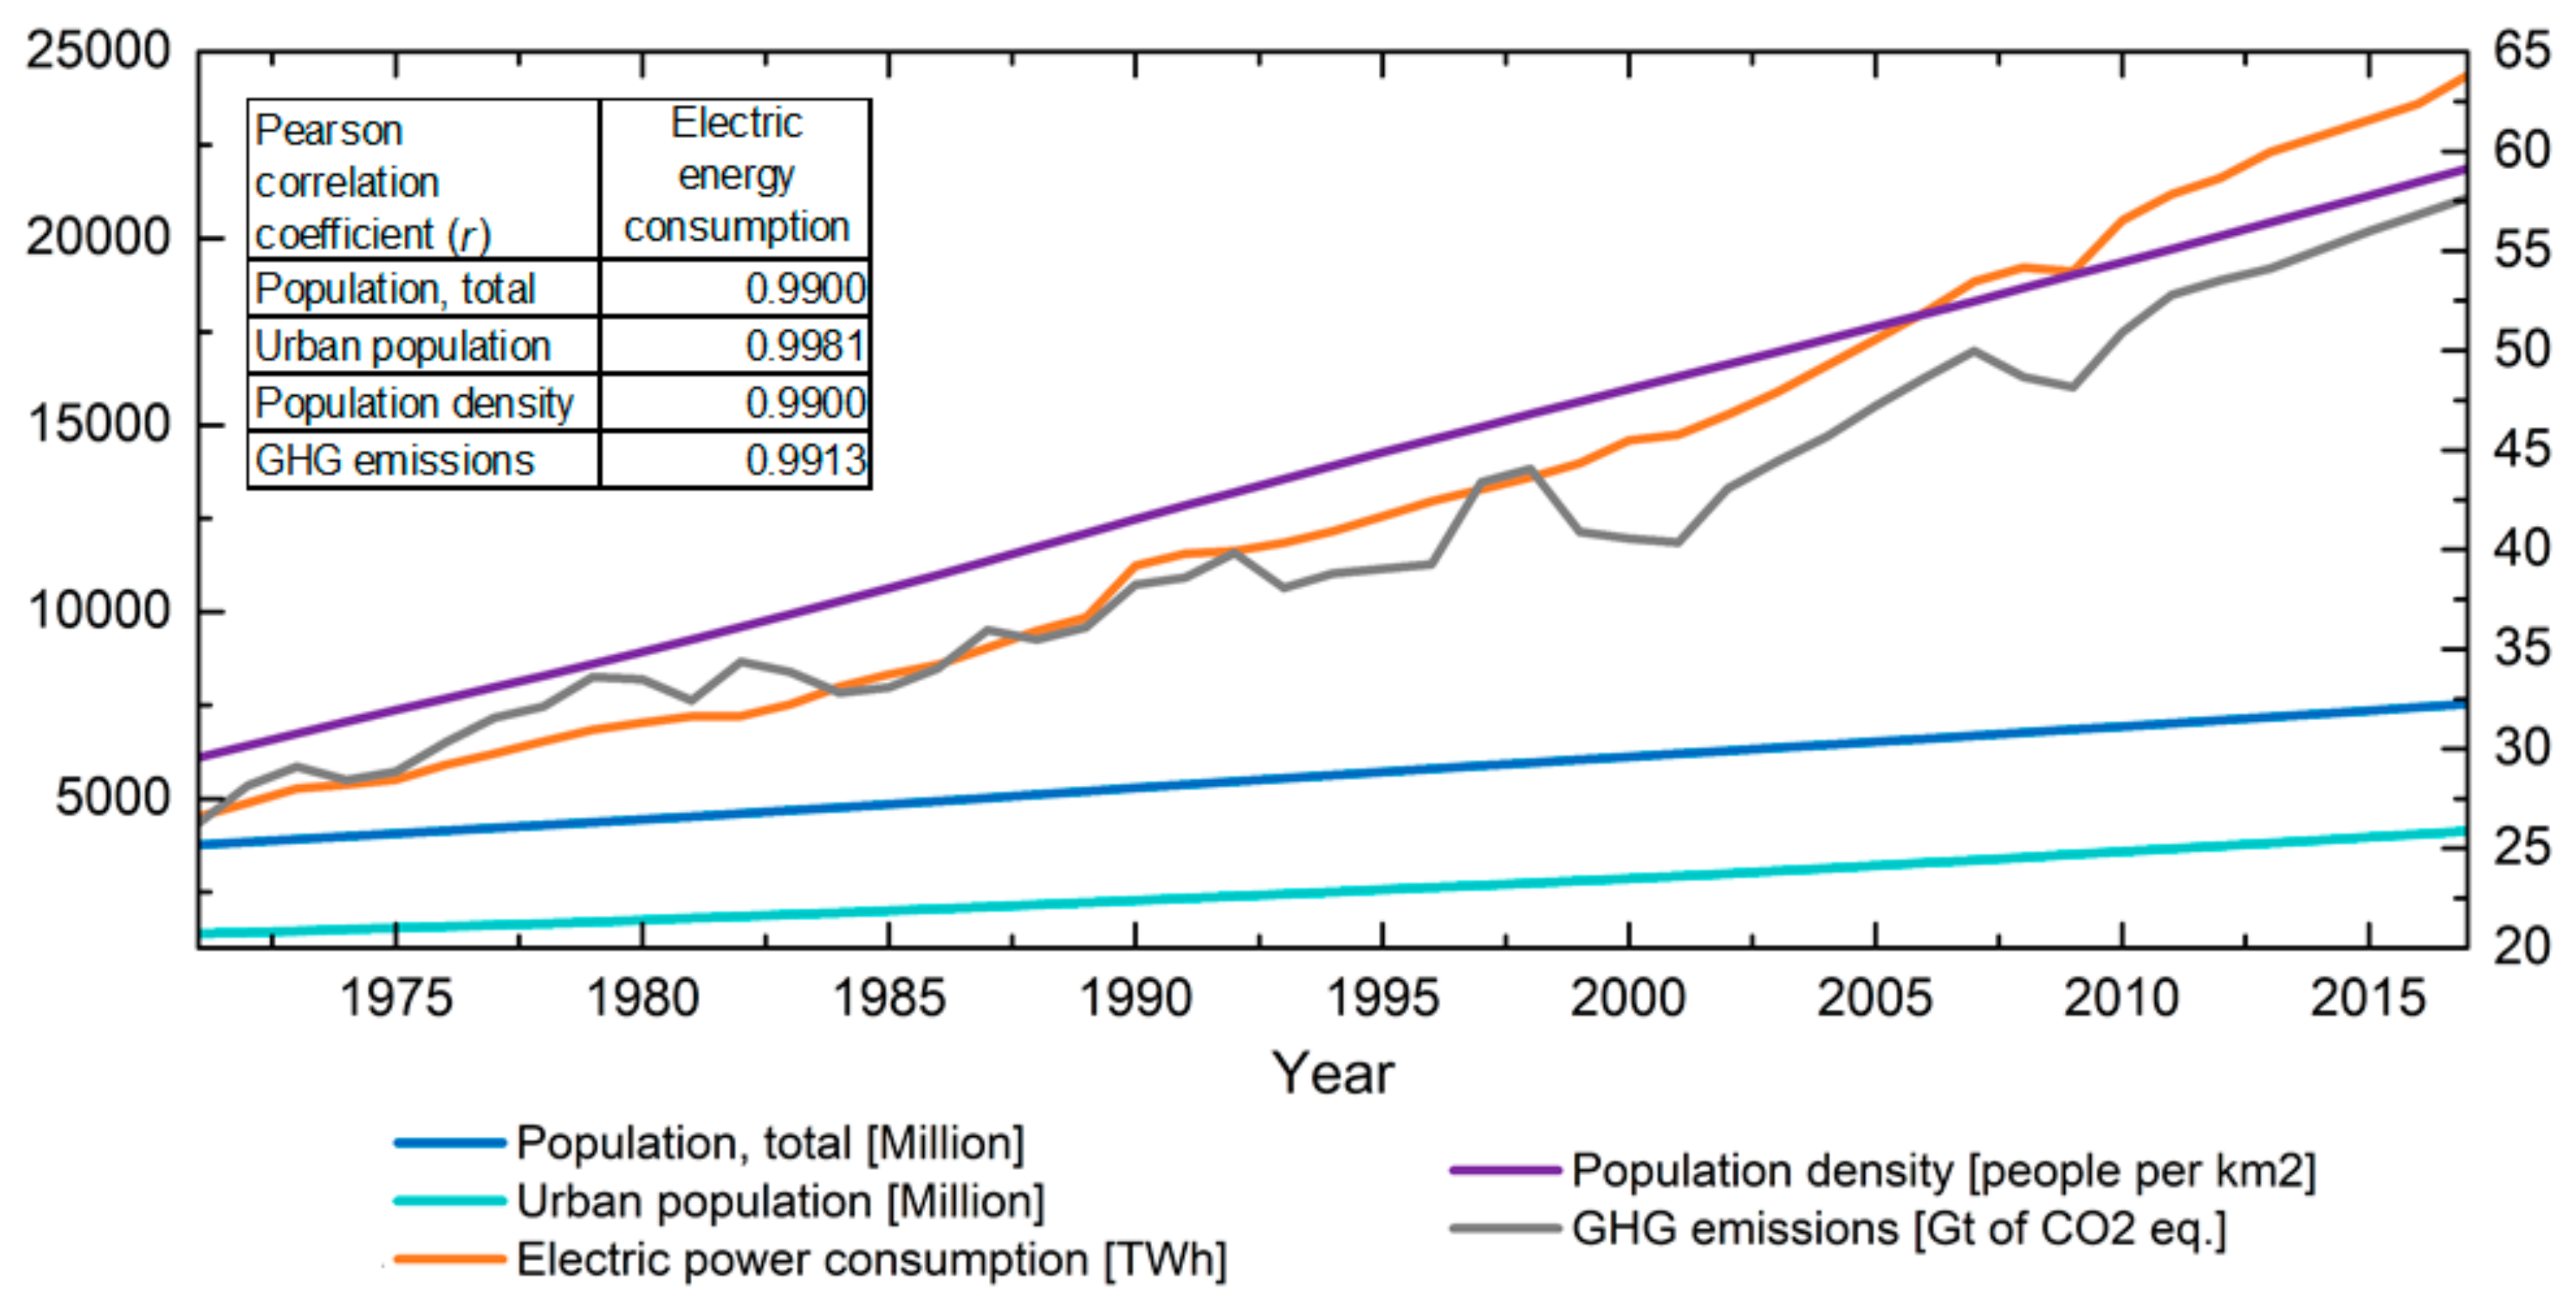
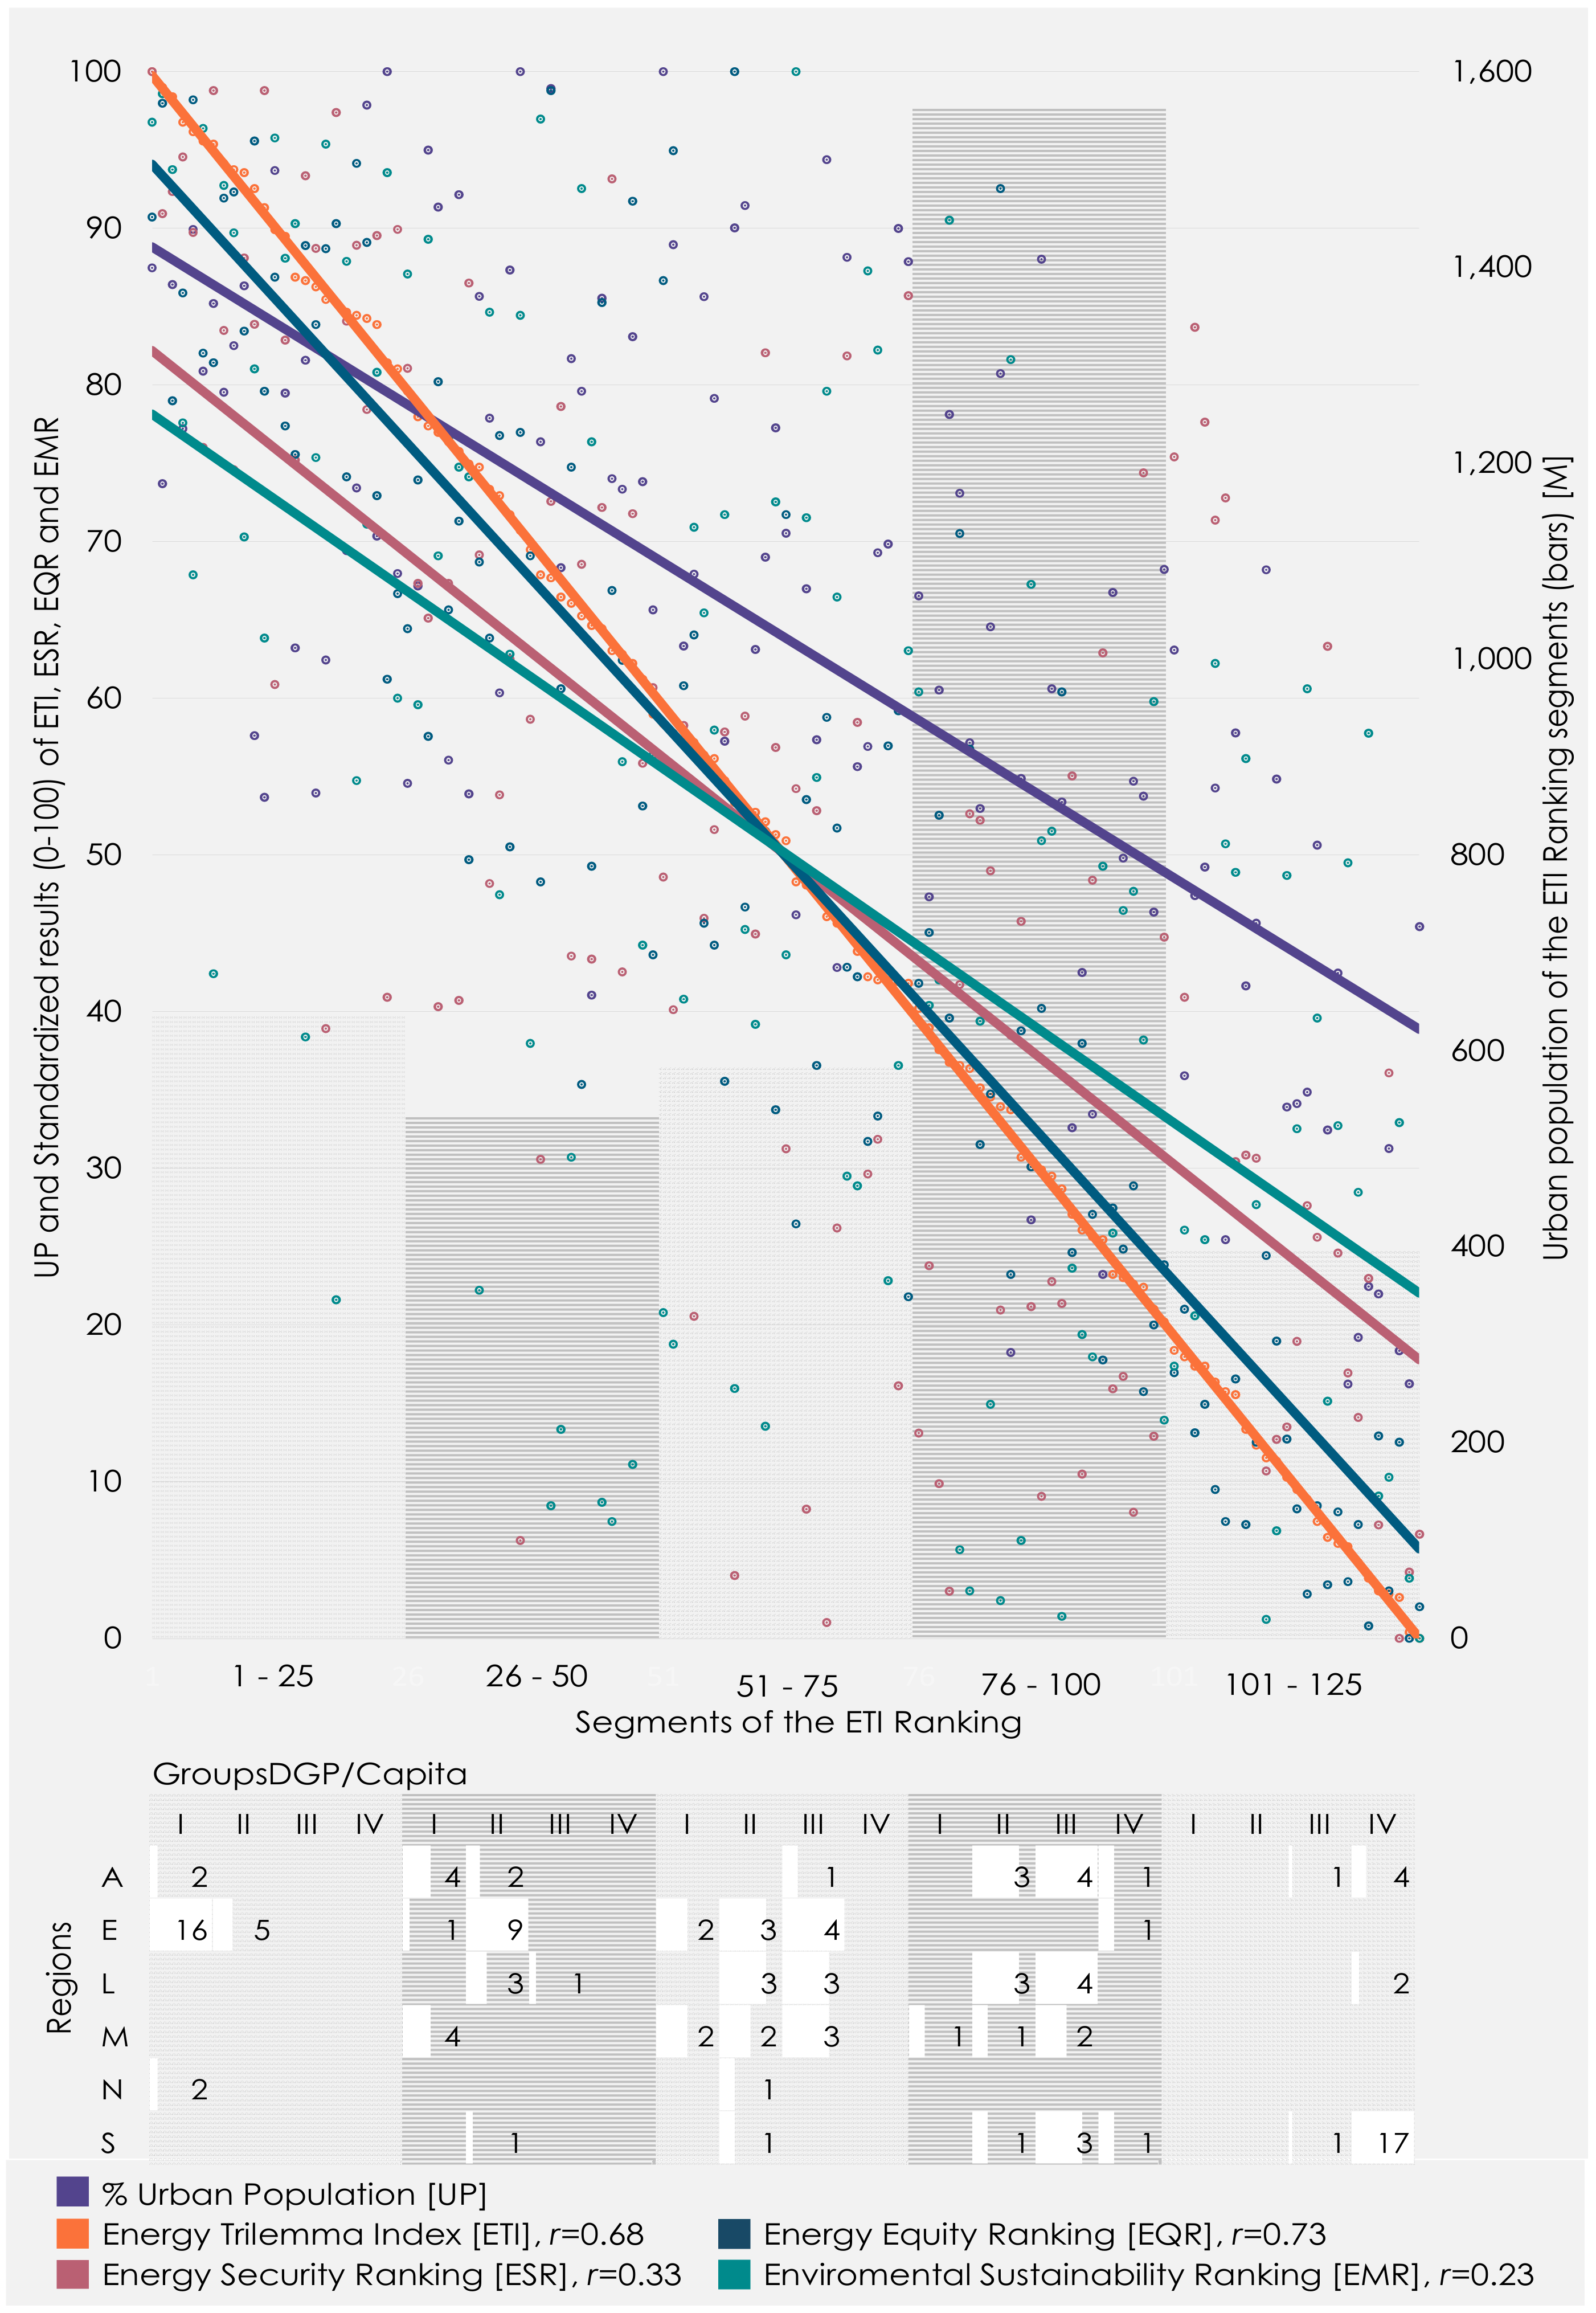
4. Urban Population and Urban PV Generation vs. Energy Sustainability

Because of the urban population increase, cities and countries are closely related. Thus, the relationship between an urban resource management model that aims to contribute to the countries’ energy sustainability has been previously described. In this sense, in this part of the paper the relationship between urban population and energy sustainability is analyzed based on empirical data. Based on this, the capacity of local electricity generation that cities have to cover the growing electricity demand, and the effect that this could have on the energy sustainability of the countries, is subsequently analyzed.

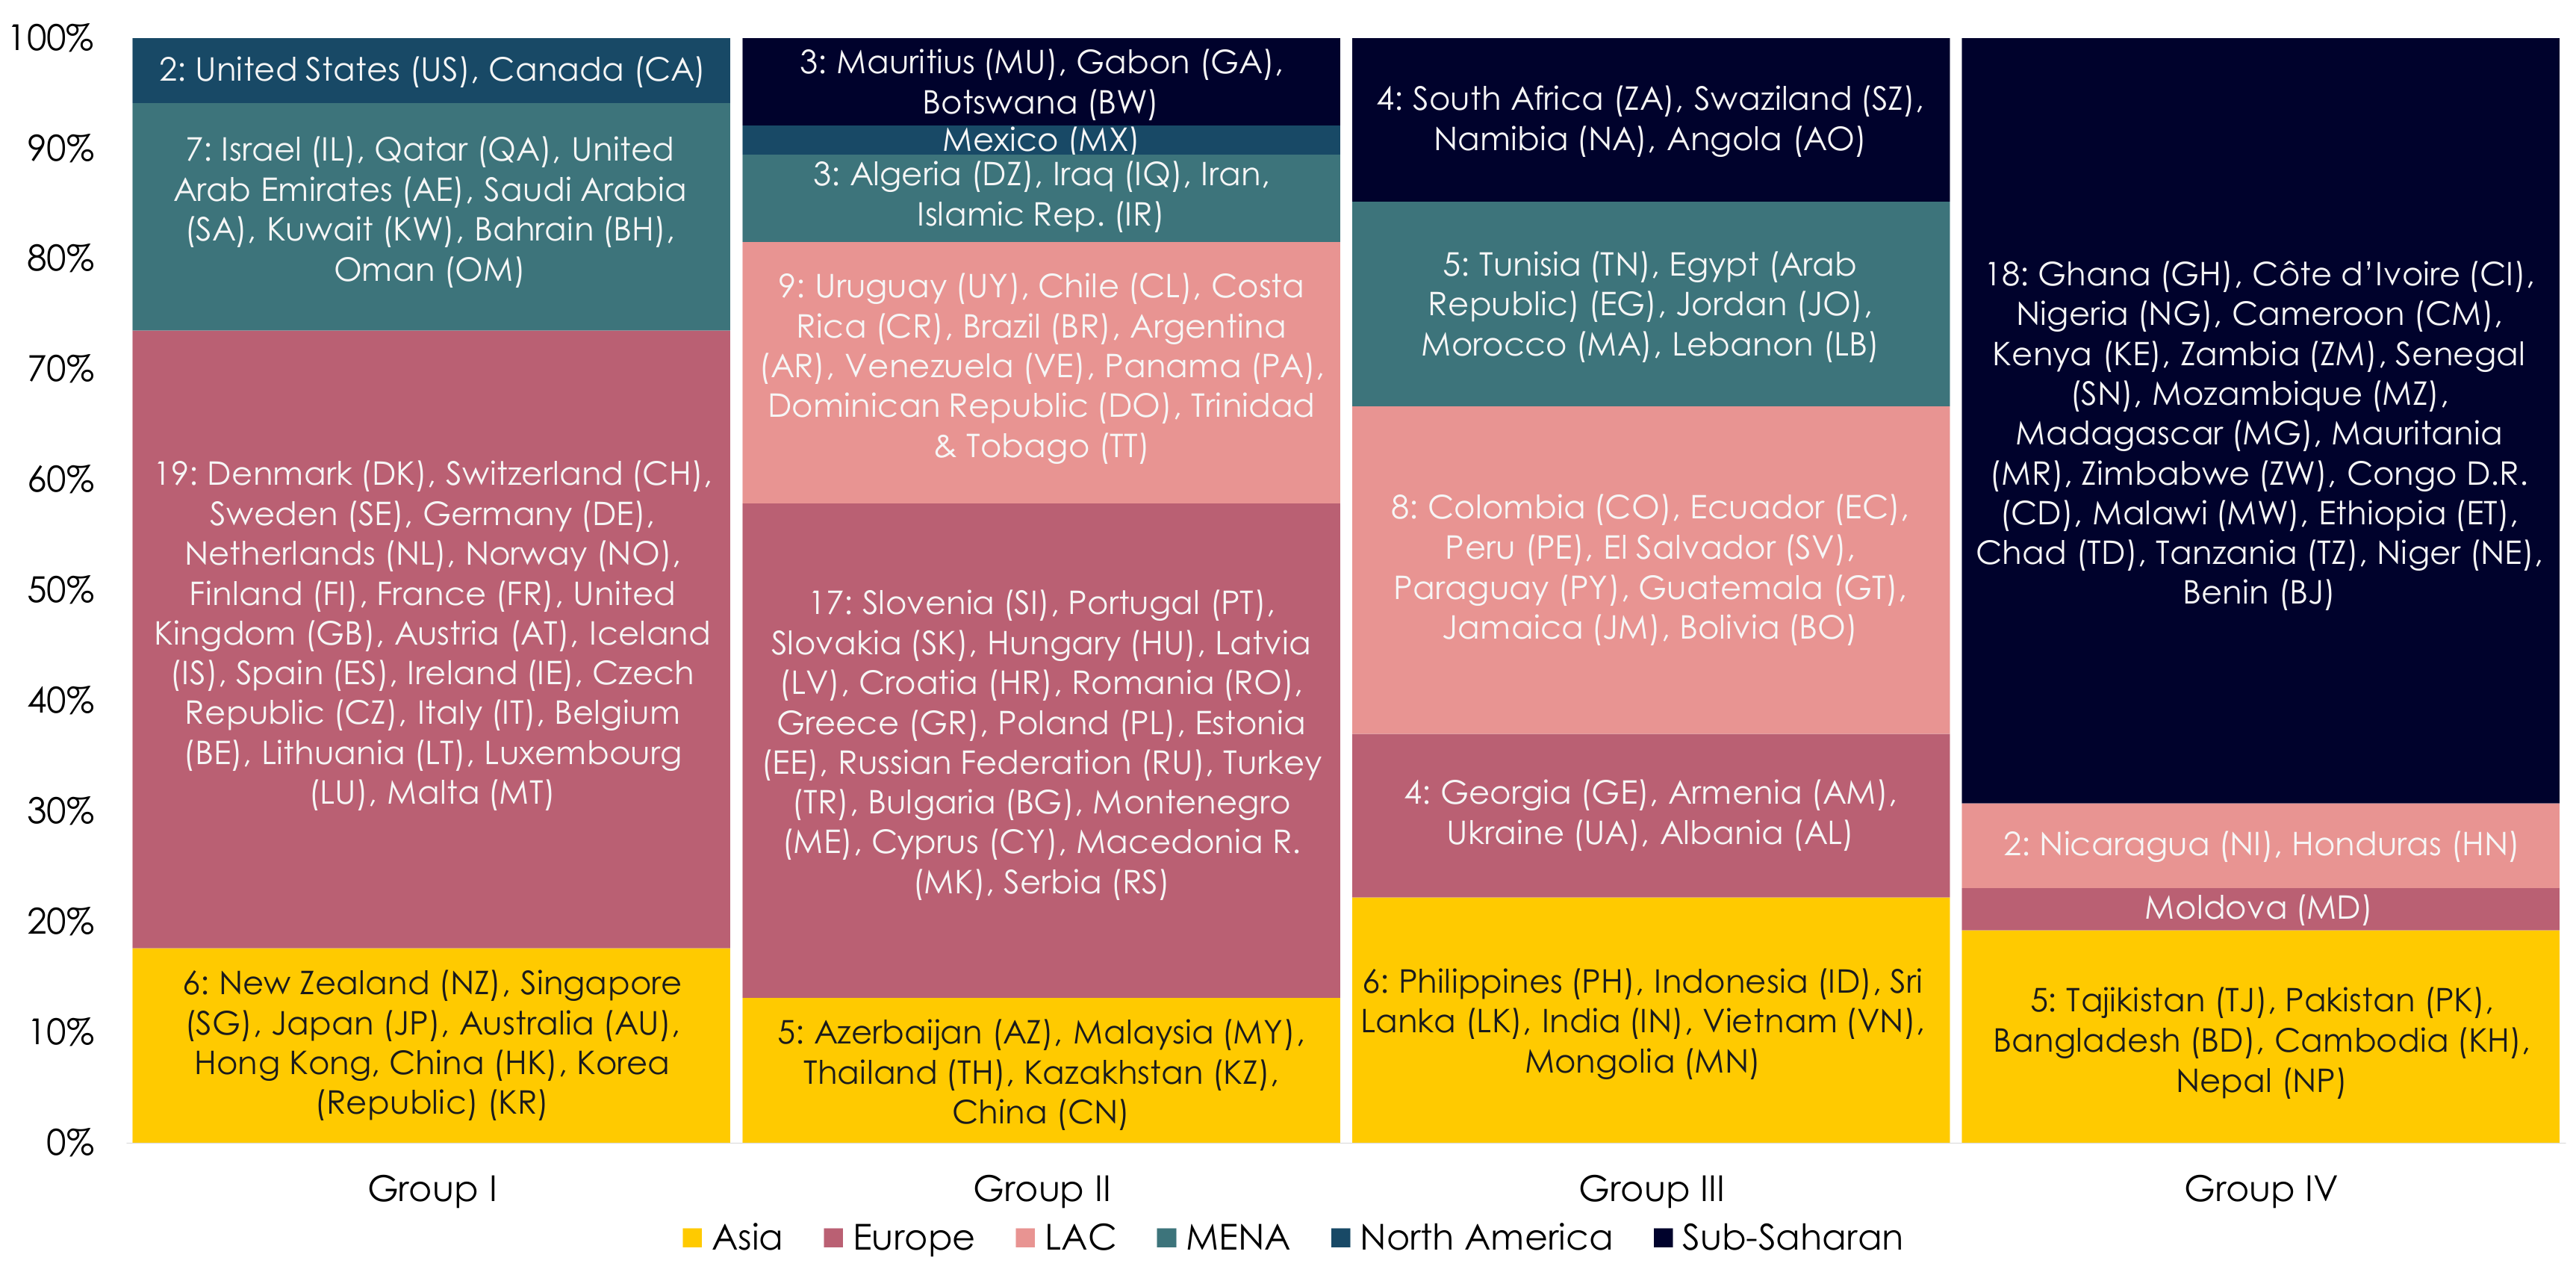
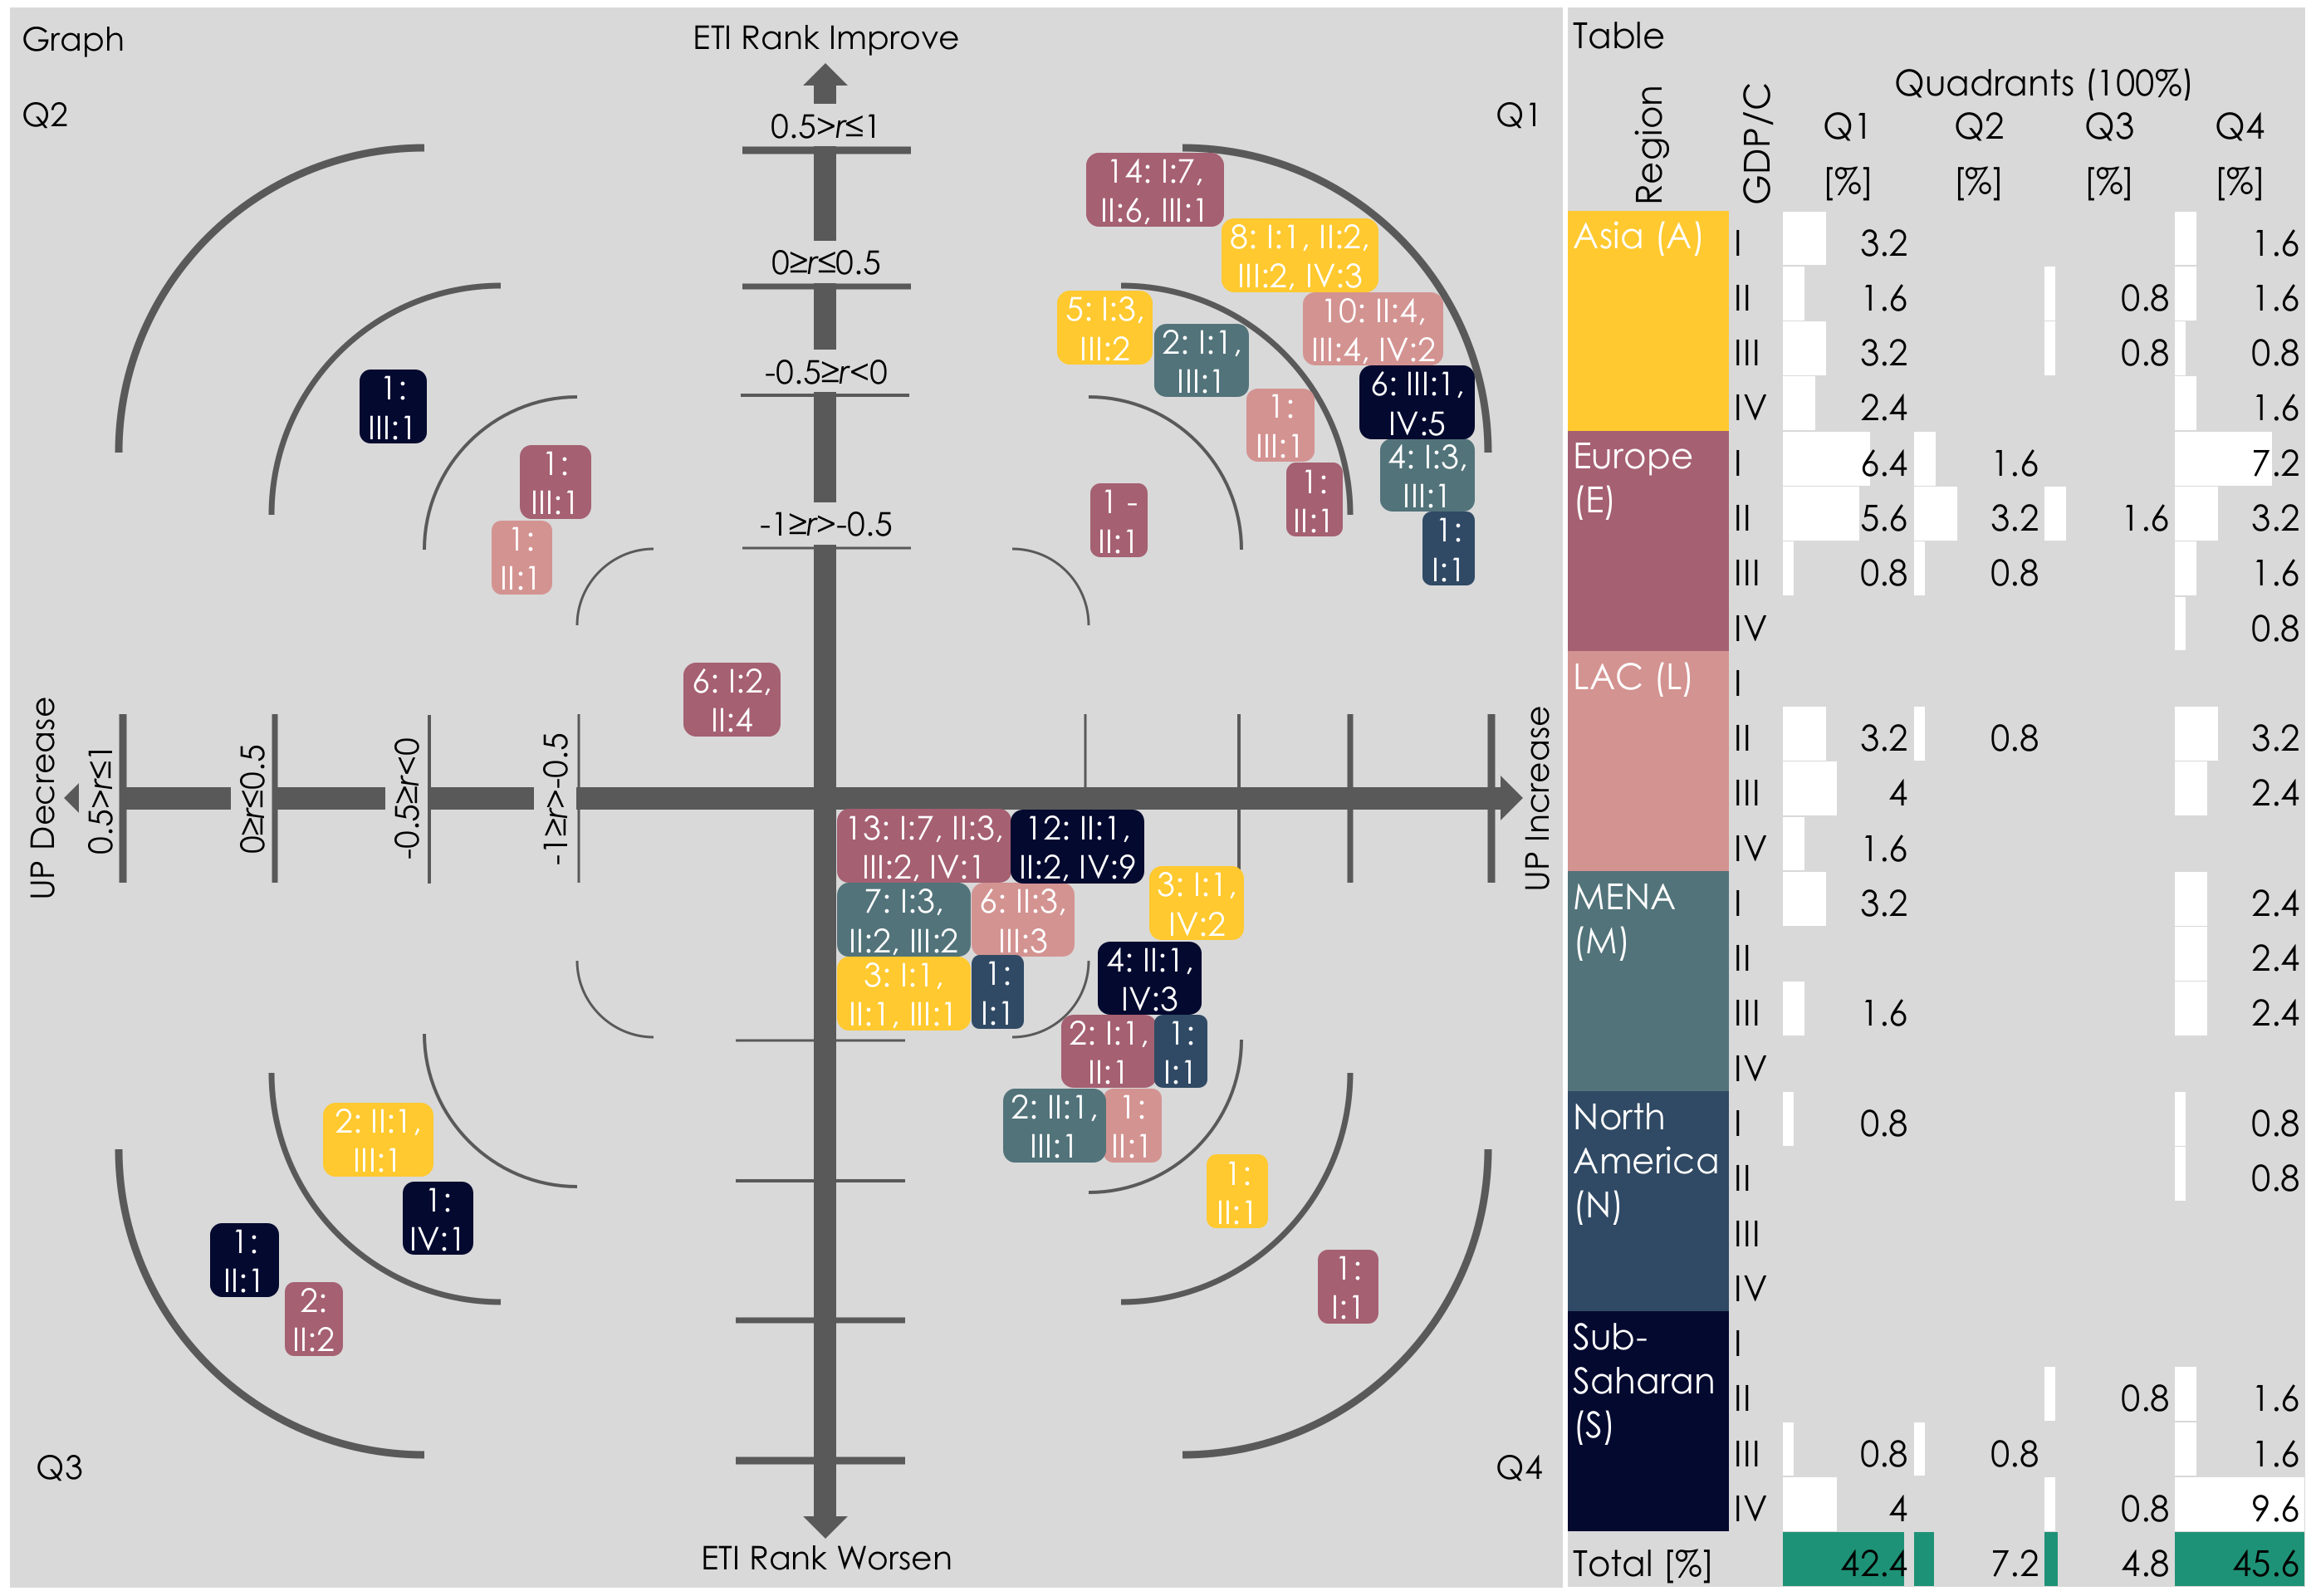
4.1. Energy Trilemma Index and Urban Population in the Period 2014–2017

Using the results of the ETI during the period 2014–2017, and data from the United Nations [3] on the percentage of urban population, Figure 8 was constructed to analyze the relationship between these two variables. The positions one to 125 of the ETI ranking, organized into five segments of 25 countries, run along the horizontal axis. The vertical axis on the left shows the percentage of population concentration (UP) and the results of ETI standardized between 0–100, while the vertical axis on the right shows the urban population of the five segments. The results obtained are described below.
There is a positive correlation between the best results in energy sustainability and the UP of the 125 countries classified in the ETI 2017, as well as with each of its three pillars: From greatest to least, this correlation (r) between the UP and EQR, ETI, ESR, and EMR is 0.73, 0.68, 0.33, and 0.23, respectively. The first three of the five country segments (positions 1–75) on average have an UP of above 73% (segments one to three, respectively: 77.4%, 75.86%, and 73.16%). Despite the fourth segment (positions 76–100) having an average UP of 54.17%, it has the highest urban population value (1.56 billion) of all segments and it is almost the sum of the first three segments. As for the fifth segment (positions 101–125), it has the lowest average UP (38.53%) and the lowest value of urban population.
The first 25 countries in the ETI ranking are rich countries in Europe with the highest %UP, over 75%, and the final segment is mostly made up of countries of the Group-IV and have an %UP of below 25%. The second segment is made up of countries from the groups Groups-GDP II and III of Europe, Asia, and MENA. The third segment has a more balanced distribution between countries in Europe, LAC, and MENA of the Groups-GDP I, II, and III. In the fourth segment, the largest in urban population, it is made up of Asian, LAC, and countries of the sub-Saharan region. Most of the latter are found in the fifth segment.
To analyze these results in depth, Figure 9 was constructed, which shows the variation of the 125 countries in their ranking positions and the percentage of urban population (%UP) from 2014 to 2017. This variation is plotted in the four quadrants of a Cartesian axis, in which the horizontal axis represents the UP (growth in the positive axis and decrease in the negative) and the vertical axis represents the variation of the position in the ETI ranking (the higher positions on the positive axis and a lower position on the negative). Each of these four axes is divided into segments of positive correlations (0.5 > r ≤ 1 and 0 ≥ r ≤ 0.5) and negative correlations (−0.5 ≥ r < 0 and −1 ≥ r > −0.5). The table on the right shows the percentage of countries in each quadrant in relation to the total number of countries, distributed in each region and Group-GDP.
In 110 of these countries, the urban population percentage increases and, of these, 48% move higher up in the ETI and the remaining 52% go down. There is a large number of countries (57) in the fourth quadrant (Q4) that go down in the ETI rankings but increase their UP; 42 of these countries have a negative correlation between −1 and −0.5 (mainly countries from the regions of Europe and Sub-Saharan), which places them close to the first quadrant (Q1). This quadrant is in second position by number of countries (53), which have gone up in the ETI rankings as well as UP; 43 of these countries have a positive correlation between 0.5 and 1. The European countries of Group-GDP I and II are primarily found in this quadrant. In the second quadrant (Q2), there are nine countries that move up the ETI but their UP decreases. In the third quadrant (Q3), there are six countries that go down in the ETI and have a reduction in UP.
According to these results, in specific terms there is no clear indication that the increase in urban population percentage has a causative effect on the ETI ranking and therefore better energy sustainability. However, 43 countries which do move up in the ranking do so with a high positive correlation (Q1). Furthermore, most of the countries that move down in the ranking do so with a high negative correlation (Q4). This suggests that these countries are close to being in Q1. This indicates that there is a link between a higher ranking in the ETI and the increase of UP.
In conclusion, the concentration of the urban population of a country influences its energy sustainability. The countries with the highest concentration of urban population have a better position in the ETI ranking, and the variation to a better position goes hand in hand with the increase in the percentage of urban population. This implies that the countries respond to their energy sustainability from the management of the energy requirements of their cities.

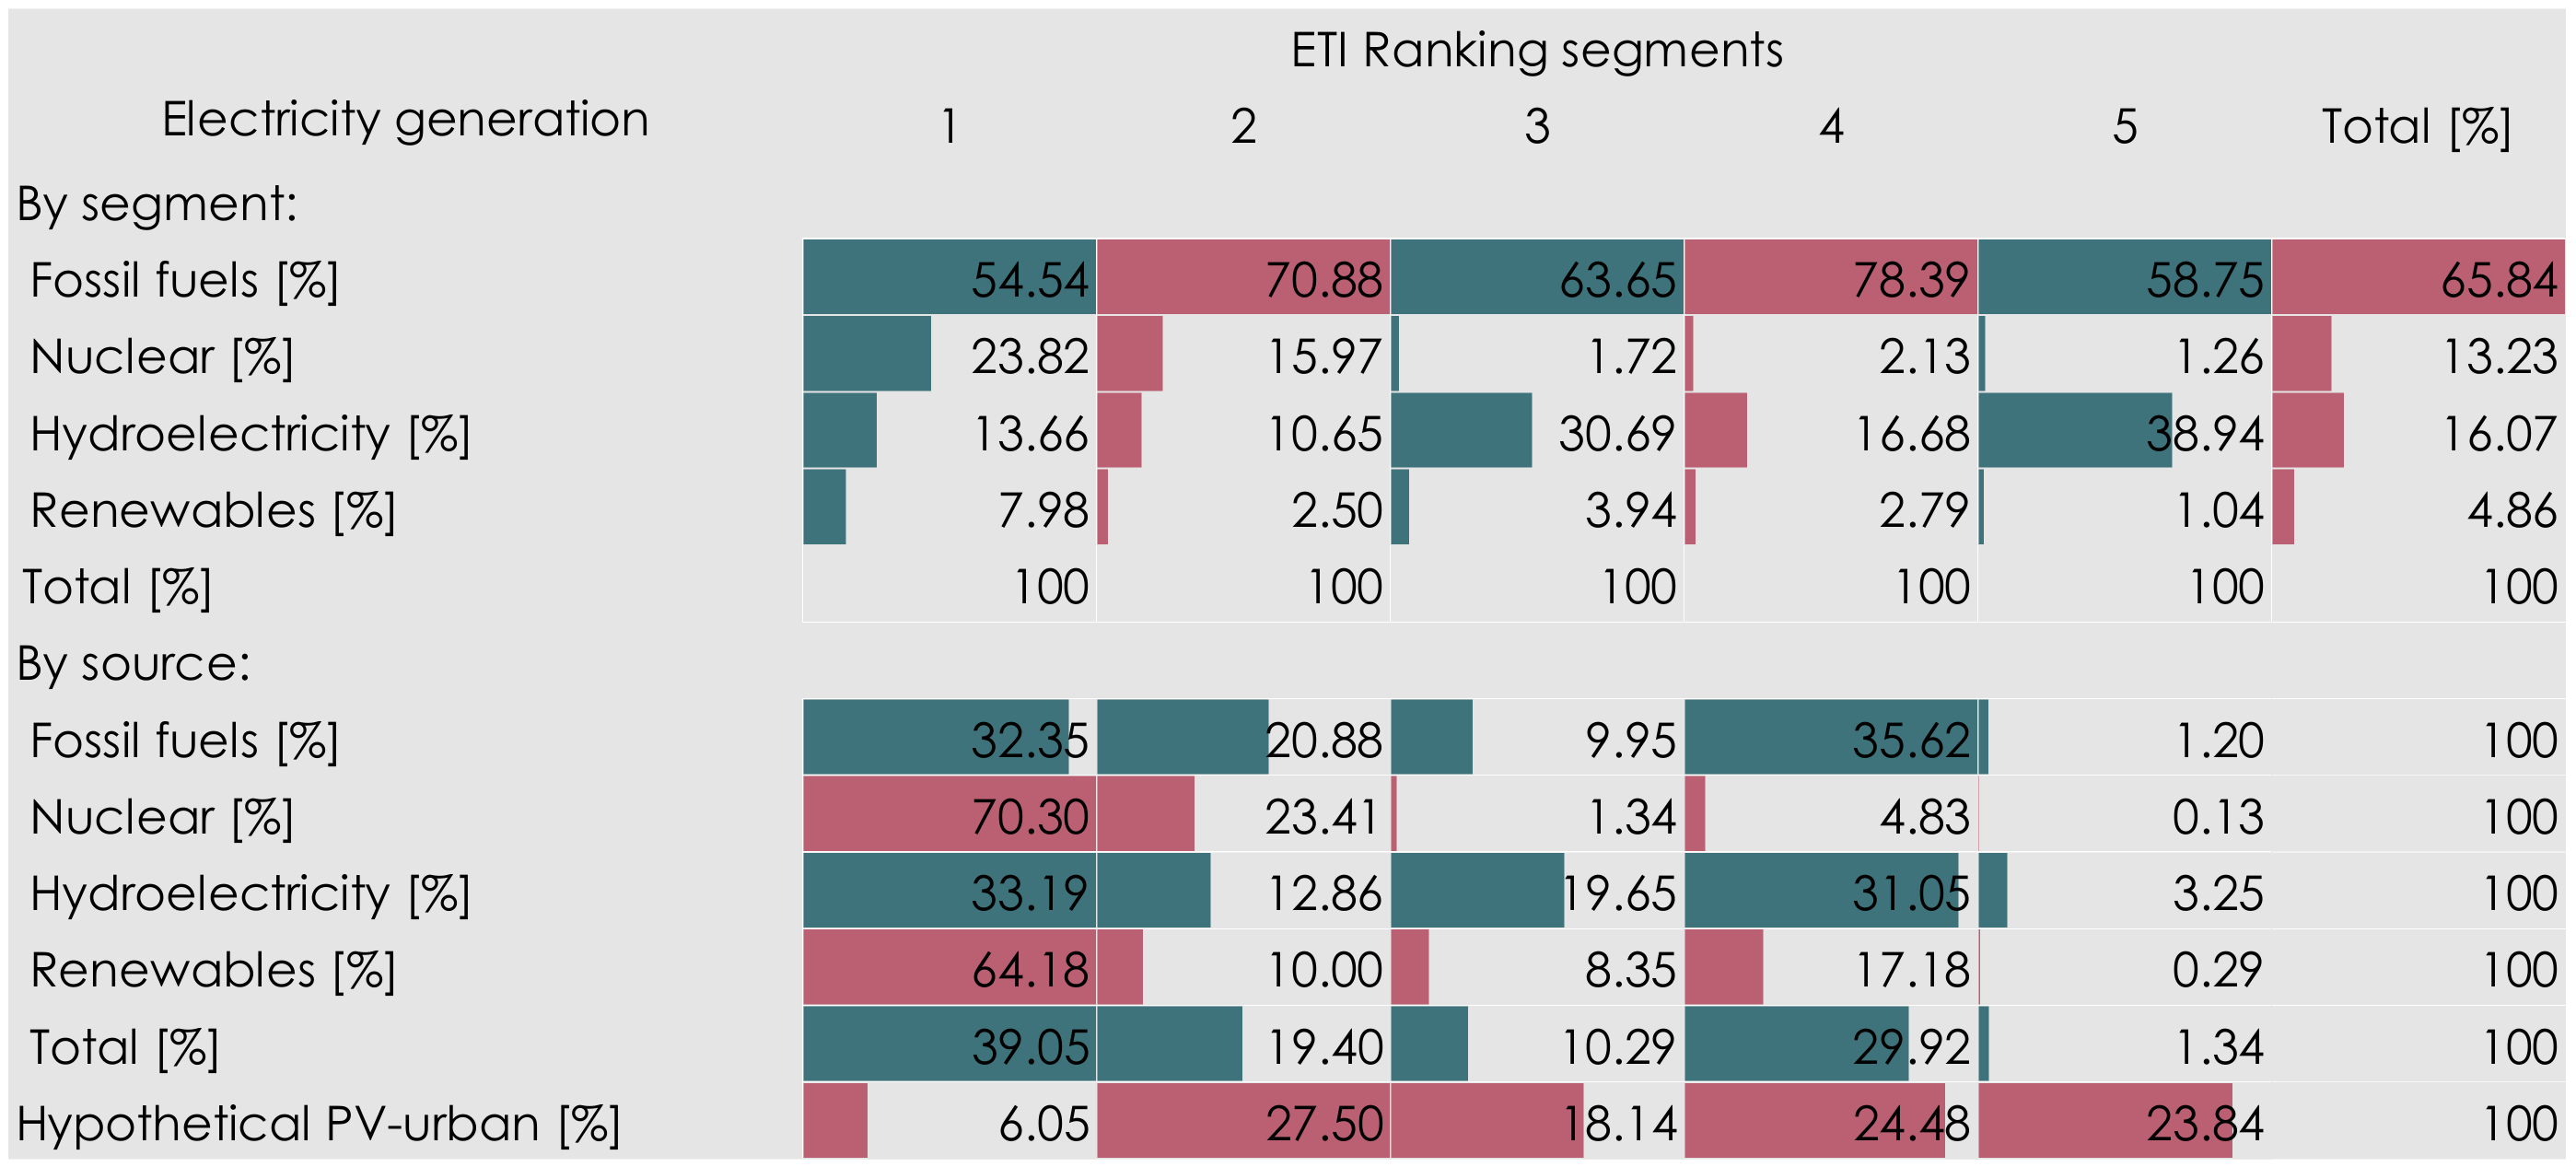
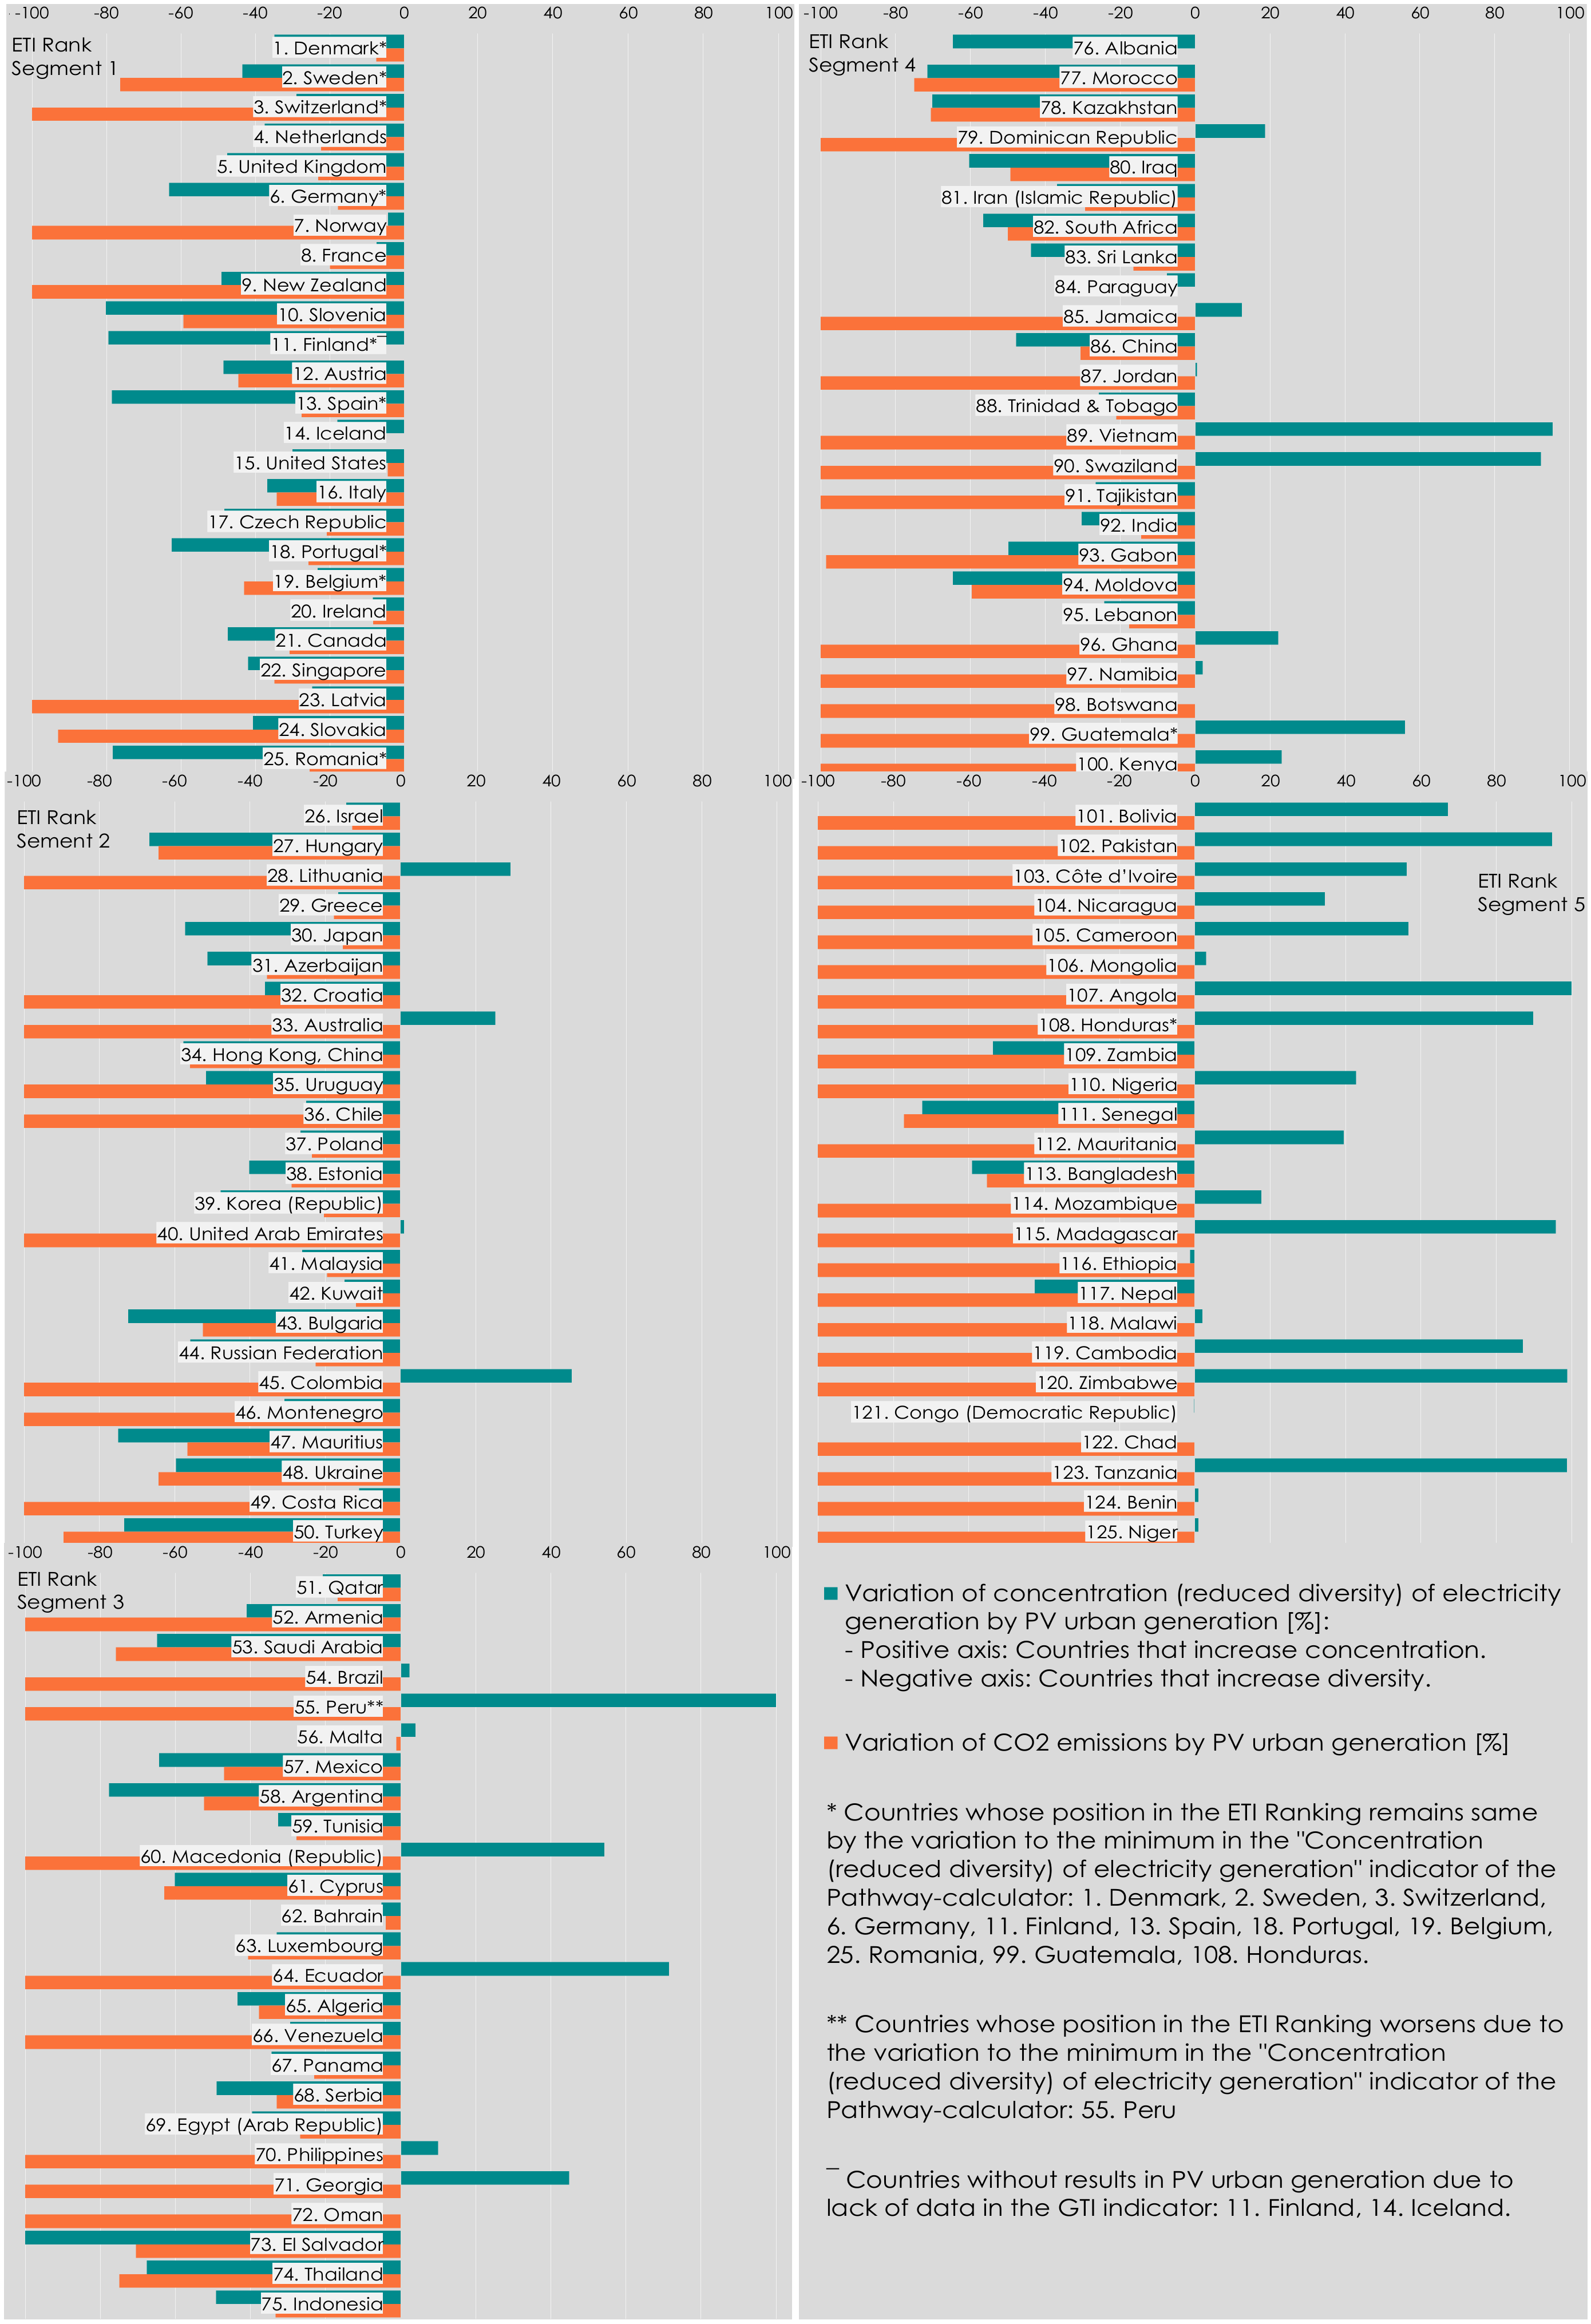
4.2. Photovoltaic Generation in Cities and ETI 2017

As mentioned above, cities are at the center of the energy transition due to their high electricity consumption and the high energy saving capacity of buildings. Additionally, given the uniformity of the distribution of the solar resource on a global scale [75], cities have the capacity to generate electricity near the same consumption points. By deploying PV systems in urbanized areas, cities can cover part of their electricity demand and contribute to the use of local energy resources in their countries. Thus, PV generation is the main technology to move towards the energy sustainability of cities.
PV is the fastest growing renewable energy technology in the last decade. Its generation capacity has grown from 2026 MW in 2009 to 480,357 MW in 2018 [76]. [77] estimates that by 2023 this growth path will double, with a significant acceleration in the growth of distributed generation. Beyond the environmental benefits and energy independence of many regions, the deployment of PV technology could generate EUR 6.67 billion gross value added to Europe and 9 million jobs to 2050 worldwide [78].
The use of solar energy in cities is an objective already underway ([79] reports the commitment of 100 cities in the United States to cover 100% of their energy consumed with renewable energies. [80] reports the same objective for cities of the United Kingdom. [81,82] study the feasibility of this possibility for the entire planet). On a voluntary basis, 65 cities from 56 countries in the world have reported, in 2018 to the CDP (CDP is a not-for-profit charity that runs a disclosure system on environmental data [83]) organization, their objectives for the use of renewable energies to be met in the next 30 years. Thirty-one of these cities include the use of solar energy, and 21 aim to reach 100%.
Based on the great importance of PV generation in the energy transition, this section presents an analysis of the urban PV generation contribution to the energy sustainability of the ETI 2017 countries. The specific objective was to study the effect of the increase of this generation in the indicators “concentration (reduced diversity) of electricity generation”, “concentration (reduced diversity) of total PE supply” (PE, primary energy), “import dependence”, and “GHG emissions from energy sector” of the pathway calculator (WEC).
The hypothesis followed for this analysis is that the use of the urban PV would allow these countries to obtain a better energy sustainability. Before addressing the description of the calculation and analysis procedure followed, the results obtained in the manipulation of the four pathway calculator indicators from which this hypothesis was raised are described below. Table 1 shows these results.
Reducing the concentration of electricity generation would allow 113 of the 125 countries to obtain a better position in the ETI and; therefore, better energy sustainability. The reduction of the concentration in the total supply of primary energy would allow 106 countries to obtain a better position in the ranking. The reduction of the dependence on energy imports would also allow the 125 countries to obtain a better position in the ranking (only Denmark would retain the same position as in the other three indicators, because this country already has the number 1 position in the ETI ranking). For the last, the reduction of GHG emissions in the energy sector would allow all these countries to obtain a better position in the ranking.
The empirical procedure followed to calculate the contribution of the urban PV generation to the sustainability of countries was the following. First we sought to calculate the PV generation capacity of the rooftops of the cities (one or two) most representative of the ETI 2017 countries; subsequently, the amount of energy that this solar generation replaced fossil fuel, nuclear, and hydroelectric generation was calculated, in that order, and increasing the country’s renewable generation without increasing the balance of its electric mix. Subsequently, between the generation values obtained from each source within the electric mix, the Herfindahl and Hirschman index (HHI) (the HHI is defined as the sum of the squares of the market shares of the firms/sectors/resources, wherein the market shares are expressed as fractions. The result is proportional to the average market share and weighted by market share. Increases in the HHI generally indicate a decrease in competition and an increase of market power, whereas decreases indicate the opposite) was calculated in order to obtain the concentration of the generation. Finally, the results in this index were normalized between 0 and 100 to compare them with the values published for each country in the 2017.
The cities (variable “city” in Equations (1)–(3)) of each country were selected based on their population and economic representation, using world development indicators of the World Bank Group [4]. Data on the PV generation capacity of the rooftops of the cities of the world are not available, so to supplement this information in the calculations, the usable area of the rooftops of the city of Barcelona (BCN) was used as a reference. To be able to analyze the useable rooftop area of each of the selected cities, the ratio 0.0512 was used (see Equation (3)). This is the ratio between the usable rooftop area of Barcelona, a figure obtained from the map of Barcelona’s renewable resources map [84,85], and the area of the city. The solar generation capacity data for each of the selected cities were obtained from the global tilted irradiation (GTI) from the Global Solar Atlas of the World Bank Group [86], using a figure of 16% efficiency [87] to calculate the PV generation (see Equation (2)). The equations calculations are the following:
P V _ U r b a n _ G e n e r a t i o n Country = C i t y P V _ G e n e r a t i o n C i t y ,
P V _ G e n e r a t i o n City = µ × G T I C i t y × R o o f t o p _ A r e a C i t y ,
R o o f t o p _ A r e a City = A r e a C i t y × R o o f t o p _ A r e a B C N / A r e a B C N .
As a result of this selection of countries and cities, 183 cities were identified from 123 countries (Finland and Iceland were not included because there were no results for them in the GTI indicator): Sixty-seven of these countries were represented by means of one city and 59 with two cities. Data from the International Energy Statistics of the U.S. Energy Information Administration (EIA) [88] were used to calculate the distribution of the electricity generation mix of the study countries. In addition, in the calculation of CO2 emissions, emission factors calculated by [89] (based on data from the International Energy Agency, IEA) were used.
Figure 10 presents the distribution of the electricity generation mix and the hypothetical urban PV generation of each segment of the ETI ranking countries. According to these results, in each segment, generation with fossil fuels has a major presence and the first segment has the lowest hypothetical urban PV generation.
The 125 ETI 2017 countries would vary, on average, in the concentration (reduced diversity) of electricity generation by −15.94% due to the hypothetical increase in their urban PV generation. This would have an impact on the reduction of 56.31% of the power electric generation from fossil fuels, and consequently on the reduction of 64% of the CO2 emissions of these countries. According to these results and based on the hypothesis, the urban PV generation of these countries would allow them to improve their energy sustainability (excluding from this conclusion the countries that worsen their position by the variation to the minimum in the four indicators used of the pathway calculator).
Additionally, the use of the local solar resource would allow these countries to improve their sustainability due to the reduction of the dependence on energy imports. Although the diversity (towards concentration) of the primary energy supply would be reduced in some countries, the increase in consumption of renewable resources would allow them to reduce CO2 emissions.
Table 2 summarizes the averages of the results obtained, and Figure 11 presents graphically the results of each segment of countries in the ranking. As indicated in this table, the first segment of the ranking shows the lowest variation of fossil-based electricity generation (−30.93%) and the fifth segment the largest variation (−91.41%): The first segment is occupied by countries with 32.35% of the fossil generation, on the other hand the fifth segment only represents 1.2% of this generation; this indicates that in this segment PV generation has a broader scope to replace fossil-based electricity.
The results of the variation in the concentration of electricity generation divide the countries into two groups: A first group of countries that increases the diversity of their electricity generation and a second group of countries that concentrate it.
Countries that diversify their electricity generation (green columns with negative results in Figure 11): A total of 87 countries that, on average, vary the concentration of electricity generation by −42.44%. This means that the initial concentration value of electricity generation decreases due to the increase in PV generation. Within these countries are the 25 countries with the best energy sustainability in the ETI ranking, and with a variation in the concentration of electricity generation (−42.49%) above the total average. On the contrary, the last segment of the ranking is made up of only seven countries and with the lowest value in the variation of the concentration of electricity generation (−32.7%).
Countries which reduce the diversity of their electricity generation (green columns with positive results in Figure 11): This group is made up of 38 countries that on average focus their electricity generation on one single source by 97.57%. This group is comprised of countries in the last segment of the ranking. The diversity of its generation is concentrated in generation from renewable resources, mostly from hydroelectric energy. Although in terms of the energy security ranking, this low level of diversity leads to a lower position in the ETI, the concentration of generation from renewable resources would lead to a reduction in the emissions of GHG and; therefore, a higher position in the environmental sustainability ranking.

5. Conclusions

The central axis of this research was the cities: The swarm of urbanization where the population tends to represent the population of the countries lives. Therefore, the energy consumption of cities tends to represent the energy consumption of countries and; therefore, their energy sustainability. On this hypothesis, this paper had three specific objectives: (i) To analyze the relationship between the smart urban management strategy and energy sustainability; (ii) to analyze the relationship between the urban population increase and the energy sustainability of countries (using the Energy Trilemma Index (ETI) 2014–2017 of the World Energy Council); and (iii) to analyze the theoretical self-consumption capacity of PV electricity that cities have to cover the energy demand of the growing population, within the framework of its effect on energy sustainability (using the indicators of the ETI 2017).
The methodology of this research was based on an extensive review of the published literature on the smart city and energy sustainability concepts, and on the use of the results of the ETI for the years 2014–2017 to know a quantitative result of the energy sustainability of countries. Given the results at the country level of this index, and as a contribution to the study of urban energy transition, the research in this paper proposes the analysis of energy sustainability based on the study of the scalability of energy saving and self-consumption from cities.
In conclusion, countries respond to their energy sustainability from the management of the energy requirements of their cities. However, in the face of the increase in the urban population and with the objective of moving towards the decarbonization of their economies, countries can optimize the operation of their urban electric systems through the smart city urban management model. The benefits of applying this strategy also include improving the competitiveness of cities, which leads to economic growth and the development of society.
The main relevant advance of the energy sector in the coming years will be the empowerment of the consumer. Making the electric sector more flexible with the aim of increasing the system’s energy efficiency and the penetration of renewable energies relies on the consumer and more specifically the residential sector. One of the major nuclei of energy consumption, and; therefore, party responsible for GHG emissions, is the building. However, it is one of the areas where there is the greatest potential for increasing energy efficiency.
Urban PV generation would have a direct effect on improving the energy sustainability of countries. It would reduce energy dependence, allow for diversifying the mix of electricity generation, and reduce CO2 emissions in the energy sector. Analyzing the three pillars of the ETI has made it possible to identify this effect. Additionally, through this technology, cities have the capacity to respond to the electrical requirements demanded by the growing population. With this, the energy policy of the countries, and mainly those of the countries dependent on external energy resources, should consider the power generation capacity of their cities to avoid increasing the importation of energy. In this sense, although energy security would be affected by the concentration of electric generation in renewable local resources, with a high variability and a difficult prediction, the improvement in environmental issues would be notable. To counteract the imbalance of energy security, smart technologies in cities would allow the management of resources and demand to be optimized.
The inclusion of smart technologies will allow for the integration of the parties involved in the management of the cities, in order to find the balance between the pillars of energy sustainability: energy security, energy equity, and environmental sustainability. Additionally, the smart city model includes a series of elements that will make it possible to provide the energy service citizens require as well as efficiently manage the resources needed to provide them. Specifically, the deployment of smart meters in households and the energy self-consumption of buildings and cities are two key strategies to be able to increase energy saving and efficiency and make the most of the local renewable energy resources.
The energy transition to the decarbonization of the economy through the decentralization of energy systems depends on three main elements of cities: the availability of local renewable energy resources, consumer energy consumption patterns, and regulatory and market characteristics favorable for investment in distributed generation systems. Thus, due to its effect on countries’ energy sustainability, the management of current infrastructure and the management of investments in smart distribution systems depends on the national objectives of each economic region in the world.

Author Contributions

Conceptualization M.V.-A. and A.S.; methodology, M.V.-A.; investigation, M.V.-A.; writing—original draft preparation, M.V.-A.; writing—review and editing, M.V.-A. and A.S.

Funding

This research received no external funding.

Conflicts of Interest

The authors declare no conflict of interest.

References

  1. World Commission on Environment and Development. Report of the World Commission on Environment and Development: Our Common Future (The Brundtland Report). Med. Confl. Surviv. 1987, 4, 300. [Google Scholar] [CrossRef]
  2. IEA (International Energy Agency). World Energy Outlook-2018; OECD/IEA: Paris, France, 2018. [Google Scholar]
  3. United Nations: Department of Social and Economic Affairs. World Population Prospects: The 2012 Revision, Key Findings and Advance Tables; Working Paper No. ESA/P/WP.227; United Nations: New York, NY, USA, 2013. [Google Scholar]
  4. World Bank. World Development Indicators Data Catalog. Available online: https://datacatalog.worldbank.org/dataset/world-development-indicators (accessed on 21 June 2019).
  5. European Climate Foundation. Roadmap 2050: A Practical Guide to a Prosperous, Low-Carbon Europe 2010:3. Available online: https://www.roadmap2050.eu/attachments/files/Roadmap2050-AllData-MinimalSize.pdf (accessed on 21 June 2019).
  6. IRENA Renewable Energy in Cities, International Renewable Energy Agency, Abu Dhabi. Available online: www.irena.org/publications (accessed on 21 June 2019).
  7. IDC; Anteverti. Hoja de Ruta Para la Smart City. Available online: http://www.ctecno.cat/wp-content/uploads/2012/03/Hoja-de-Ruta-Smart-Cities-def..pdf (accessed on 21 June 2019).
  8. Angelidou, M. Smart city policies: A spatial approach. Cities 2014, 41, S3–S11. [Google Scholar] [CrossRef]
  9. Espinoza-Arias, P.; Poveda-Villalón, M.; García-Castro, R.; Corcho, O. Ontological Representation of Smart City Data: From Devices to Cities. Appl. Sci. 2018, 9, 32. [Google Scholar] [CrossRef]
  10. Lund, H.; Østergaard, P.A.; Connolly, D.; Mathiesen, B.V. Smart energy and smart energy systems. Energy 2017, 137, 556–565. [Google Scholar] [CrossRef]
  11. World Energy Council (WEC) and Oliver Wyman. Energy Trilemma Index 2013. Available online: https://www.worldenergy.org/wp-content/uploads/2013/09/2013-Energy-Sustainability-Index-VOL-2.pdf (accessed on 21 June 2019).
  12. World Energy Council (WEC) and Oliver Wyman. Energy Trilemma Index 2017. Available online: https://www.worldenergy.org/wp-content/uploads/2017/11/Energy-Trilemma-Index-2017-Report.pdf (accessed on 21 June 2019).
  13. World Energy Council (WEC) and Oliver Wyman. Pathway Calculator. 2017. Available online: https://trilemma.worldenergy.org/#!/pathway-calculator (accessed on 28 May 2019).
  14. Doran, G.T. There’s a S.M.A.R.T. way to write management’s goals and objectives. Manag. Rev. 1981, 70, 35–36. [Google Scholar]
  15. Lee, J.; Lee, H. Developing and validating a citizen-centric typology for smart city services. Gov. Inf. Q. 2014, 31, S93–S105. [Google Scholar] [CrossRef]
  16. Caragliu, A.; Del Bo, C.; Nijkamp, P. Smart Cities in Europe. J. Urban Technol. 2011, 18, 65–82. [Google Scholar] [CrossRef]
  17. Oliviera Fernandes, E.; Meeus, L.; Leal, V.; Azevedo, I.; Delarue, E.; Glachant, J.-M. Smart Cities Initiative: How to Foster a Quick Transition Towards Local Sustainable Energy Systems; European University Institute: Firenze, Italy, 2011. [Google Scholar]
  18. Batty, M.; Axhausen, K.W.; Giannotti, F.; Pozdnoukhov a Bazzani a Wachowicz, M.; Ouzounis, G.; Portugali, Y. Smart cities of the future. Eur. Phys. J. Spec. Top 2012, 214, 481–518. [Google Scholar] [CrossRef] [Green Version]
  19. Kramers, A.; Höjer, M.; Lövehagen, N.; Wangel, J. Smart sustainable cities—Exploring {ICT} solutions for reduced energy use in cities. Environ. Model. Softw. 2014, 56, 52–62. [Google Scholar] [CrossRef]
  20. Caragliu, A.; DBo, C.; Kourtit, K.; Nijkamp, P. Smart Cities; Elsevier: Amsterdam, The Netherlands, 2015. [Google Scholar] [CrossRef]
  21. Gonz, L. El Papel De Las Normas en Las Ciudades Inteligentes. 2014. Available online: https://www.esmartcity.es/biblioteca/informe-el-papel-de-las-normas-en-las-ciudades-inteligentes (accessed on 21 June 2019).
  22. Manville, C.; Cochrane, G.; Cave, J.; Millard, J.; Pederson, J.K.; Thaarup, R.K.; Liebe, A.; Wissner, M.; Massink, R.; Kotterink, B. Mapping Smart Cities in the EU; European Parliament: Brussels, Belgium, 2014; Volume 200. [Google Scholar] [CrossRef]
  23. Achaerandio, R.; Galloti, G.; Curto, J.; Bigliani, R.; Maldonado, F. Análisis de las Ciudades Inteligentes en España. 2011. Available online: https://www.esmartcity.es/biblioteca/analisis-de-idc-de-las-ciudades-inteligentes-en-espana (accessed on 21 June 2019).
  24. Drohojowska, H. San Francisco Style, Art-Deco Elements Inform a Smart City Residence + Interior-Design by Arnold, Val. Archit. Dig. 1991, 48, 114–121. [Google Scholar]
  25. Shetty, V. A tale of smart cities. Commun. Int. 1997, 24, 16–18. [Google Scholar]
  26. Neirotti, P.; De Marco, A.; Cagliano, A.C.; Mangano, G.; Scorrano, F. Current trends in Smart City initiatives: Some stylised facts. Cities 2014, 38, 25–36. [Google Scholar] [CrossRef] [Green Version]
  27. Albino, V.; Berardi, U.; Dangelico, R.M. Smart Cities: Definitions, Dimensions, Performance, and Initiatives. J. Urban Technol. 2015, 22, 3–21. [Google Scholar] [CrossRef]
  28. Angelidou, M. Smart cities: A conjuncture of four forces. Cities 2015, 47, 95–106. [Google Scholar] [CrossRef]
  29. Studies, M. Smart Cities Ranking of European Medium-Sized Cities; Vienna University of Technology: Vienna, Austria, 2007; Volume 16, pp. 13–18. [Google Scholar]
  30. Lazaroiu, G.C.; Roscia, M. Definition methodology for the smart cities model. Energy 2012, 47, 326–332. [Google Scholar] [CrossRef]
  31. Mattoni, B.; Gugliermetti, F.; Bisegna, F. A multilevel method to assess and design the renovation and integration of Smart Cities. Sustain. Cities Soc. 2015, 15, 105–119. [Google Scholar] [CrossRef]
  32. Ben Letaifa, S. How to strategize smart cities: Revealing the SMART model. J. Bus. Res. 2015, 68, 1414–1419. [Google Scholar] [CrossRef]
  33. Lee, J.H.; Hancock, M.G.; Hu, M.-C. Towards an effective framework for building smart cities: Lessons from Seoul and San Francisco. Technol. Forecast. Soc. Chang. 2013, 89, 80–99. [Google Scholar] [CrossRef]
  34. Bakici, T.; Almirall, E.; Wareham, J. A Smart City Initiative: The Case of Barcelona. J. Knowl. Econ. 2013, 4, 135–148. [Google Scholar] [CrossRef]
  35. Lee, J.H.; Phaal, R.; Lee, S.-H. An integrated service-device-technology roadmap for smart city development. Technol. Forecast. Soc. Chang. 2013, 80, 286–306. [Google Scholar] [CrossRef]
  36. European Commission. A Resource-Efficient Europe—Flagship Initiative Under the Europe 2020 Strategy; European Commission: Brussels, Belgium, 2011. [Google Scholar]
  37. European Commission. Smart Cities and Communities—European Innovation Partnership; European Commission: Brussels, Belgium, 2012. [Google Scholar]
  38. Ametic. Smart Cities 2013. Available online: https://www.hr.com/en/communities/2012-quality-of-living-worldwide-city-rankings-%E2%80%93-m_haderw3e.html (accessed on 21 June 2019).
  39. Harrison, C.; Donnelly, I.A. A Theory of Smart Cities. In Proceedings of the 55th Annual Meeting of the International Society for the Systems Sciences, Houcheng, UK, 17–22 July 2011. [Google Scholar]
  40. Sanchez, L.; Muñoz, L.; Galache, J.A.; Sotres, P.; Santana, J.R.; Gutierrez, V.; Ramdhany, R.; Gluhak, A.; Krco, S.; Theodoridis, E.; et al. SmartSantander: IoT experimentation over a smart city testbed. Comput. Netw. 2014, 61, 217–238. [Google Scholar] [CrossRef] [Green Version]
  41. Mercer. 2012 Quality Of Living Worldwide City Rankings: Survey; International HR Adviser: Sutton, UK, 2012; pp. 33–36. [Google Scholar]
  42. Paroutis, S.; Bennett, M.; Heracleous, L. A strategic view on smart city technology: The case of IBM Smarter Cities during a recession. Technol. Forecast. Soc. Chang. 2013, 89, 262–272. [Google Scholar] [CrossRef]
  43. Talari, S.; Shafie-Khah, M.; Siano, P.; Loia, V.; Tommasetti, A.; Catalão, J.P.S. A review of smart cities based on the internet of things concept. Energies 2017, 10, 421. [Google Scholar] [CrossRef]
  44. Mahapatra, C.; Moharana, A.K.; Leung, V.C.M. Energy management in smart cities based on internet of things: Peak demand reduction and energy savings. Sensors 2017, 17, 2812. [Google Scholar] [CrossRef] [PubMed]
  45. Hilty, L.M.; Aebischer, B.; Rizzoli, A.E. Modeling and evaluating the sustainability of smart solutions. Environ. Model. Softw. 2014, 56, 1–5. [Google Scholar] [CrossRef] [Green Version]
  46. European Commission. Energy Technologies and Innovation; European Commission: Brussels, Belgium, 2013. [Google Scholar]
  47. Höjer, M.; Wangel, J. Smart Sustainable Cities Definition and Challenges. ICT Innov. Sustain. 2014, 333–349. [Google Scholar] [CrossRef]
  48. Lund, H.; Werner, S.; Wiltshire, R.; Svendsen, S.; Thorsen, J.E.; Hvelplund, F.; Mathiesen, B.V. 4th Generation District Heating (4GDH): Integrating smart thermal grids into future sustainable energy systems. Energy 2014, 68, 1–11. [Google Scholar] [CrossRef]
  49. IRENA. Power System Flexibility for the Energy Transition, International Renewable Energy Agency, Abu Dhabi. 2018. Available online: www.irena.org/publications (accessed on 21 June 2019).
  50. Siano, P. Demand response and smart grids—A survey. Renew. Sustain. Energy Rev. 2014, 30, 461–478. [Google Scholar] [CrossRef]
  51. Yuan, J.; Shen, J.; Pan, L.; Zhao, C.; Kang, J. Smart grids in China. Renew. Sustain. Energy Rev. 2014, 37, 896–906. [Google Scholar] [CrossRef]
  52. Solomon, B.D.; Krishna, K. The coming sustainable energy transition: History, strategies, and outlook. Energy Policy 2011, 39, 7422–7431. [Google Scholar] [CrossRef]
  53. World Energy Council (WEC). Smart Grids: Best Practice Fundamentals for a Modern Energy System; WEC: London, UK, 2012; ISBN 9780946121175. Available online: https://www.worldenergy.org/wp-content/uploads/2012/10/PUB_Smart_grids_best_practice_fundamentals_for_a_modern_energy_system_2012_WEC.pdf (accessed on 21 June 2019).
  54. Dada, J.O. Towards understanding the benefits and challenges of Smart/Micro-Grid for electricity supply system in Nigeria. Renew. Sustain. Energy Rev. 2014, 38, 1003–1014. [Google Scholar] [CrossRef]
  55. Clastres, C. Smart grids: Another step towards competition, energy security and climate change objectives. Energy Policy 2011, 39, 5399–5408. [Google Scholar] [CrossRef] [Green Version]
  56. Lund, P.D.; Mikkola, J.; Ypyä, J. Smart energy system design for large clean power schemes in urban areas. J. Clean. Prod. 2014, 103, 437–445. [Google Scholar] [CrossRef]
  57. Ruiz-Romero, S.; Colmenar-Santos, A.; Mur-Pérez, F.; López-Rey, Á. Integration of distributed generation in the power distribution network: The need for smart grid control systems, communication and equipment for a smart city—Use cases. Renew. Sustain. Energy Rev. 2014, 38, 223–234. [Google Scholar] [CrossRef]
  58. Gaiser, K.; Stroeve, P. The impact of scheduling appliances and rate structure on bill savings for net-zero energy communities: Application to West Village. Appl. Energy 2014, 113, 1586–1595. [Google Scholar] [CrossRef] [Green Version]
  59. Ellabban, O.; Abu-Rub, H. Smart grid customers’ acceptance and engagement: An overview. Renew. Sustain. Energy Rev. 2016, 65, 1285–1298. [Google Scholar] [CrossRef]
  60. Mwasilu, F.; Justo, J.J.; Kim, E.-K.; Do, T.D.; Jung, J.-W. Electric vehicles and smart grid interaction: A review on vehicle to grid and renewable energy sources integration. Renew. Sustain. Energy Rev. 2014, 34, 501–516. [Google Scholar] [CrossRef]
  61. Uribe-Pérez, N.; Hernández, L.; de la Vega, D.; Angulo, I. State of the Art and Trends Review of Smart Metering in Electricity Grids. Appl. Sci. 2016, 6, 68. [Google Scholar] [CrossRef]
  62. Goulden, M.; Bedwell, B.; Rennick-Egglestone, S.; Rodden, T.; Spence, A. Smart grids, smart users? the role of the user in demand side management. Energy Res. Soc. Sci. 2014, 2, 21–29. [Google Scholar] [CrossRef]
  63. Eid, C.; Koliou, E.; Valles, M.; Reneses, J.; Hakvoort, R. Time-based pricing and electricity demand response: Existing barriers and next steps. Util. Policy 2016, 40, 15–25. [Google Scholar] [CrossRef] [Green Version]
  64. Ackermann, T.; Andersson, G.; Söder, L. Distributed generation: A definition. Electr. Power Syst. Res. 2001, 57, 195–204. [Google Scholar] [CrossRef]
  65. Chen, J.; Jain, R.K.; Taylor, J.E. Block Configuration Modeling: A novel simulation model to emulate building occupant peer networks and their impact on building energy consumption. Appl. Energy 2013, 105, 358–368. [Google Scholar] [CrossRef]
  66. GhaffarianHoseini, A.; Dahlan, N.D.; Berardi, U.; GhaffarianHoseini, A.; Makaremi, N.; GhaffarianHoseini, M. Sustainable energy performances of green buildings: A review of current theories, implementations and challenges. Renew. Sustain. Energy Rev. 2013, 25, 1–17. [Google Scholar] [CrossRef]
  67. GhaffarianHoseini, A.; Dahlan, N.D.; Berardi, U.; GhaffarianHoseini, A.; Makaremi, N. The essence of future smart houses: From embedding {ICT} to adapting to sustainability principles. Renew. Sustain. Energy Rev. 2013, 24, 593–607. [Google Scholar] [CrossRef]
  68. IRENA. Innovation Landscape: Aggregators, International Renewable Energy Agency, Abu Dhabi. 2019. Available online: www.irena.org/publications (accessed on 21 June 2019).
  69. Villa-Arrieta, M.; Sumper, A. Economic evaluation of Nearly Zero Energy Cities. Appl. Energy 2019, 237, 404–416. [Google Scholar] [CrossRef]
  70. Villa-Arrieta, M.; Sumper, A. A model for an economic evaluation of energy systems using TRNSYS. Appl. Energy 2018, 215, 765–777. [Google Scholar] [CrossRef]
  71. OECD/IEA; IRENA. Perspectives for the Energy Transition: Investment Needs for a Low-Carbon Energy System, Abu Dhabi. 2019. Available online: www.irena.org/publications (accessed on 21 June 2019).
  72. World Energy Council (WEC) and Oliver Wyman. Energy Trilemma Index 2014. Available online: https://www.worldenergy.org/publications/2014/world-energy-trilemma-2014-time-to-get-real-the-myths-and-realities-of-financing-energy-systems/ (accessed on 21 June 2019).
  73. World Energy Council (WEC) and Oliver Wyman. Energy Trilemma Index 2015. Available online: https://www.worldenergy.org/publications/2015/2015-energy-trilemma-index-benchmarking-the-sustainability-of-national-energy-systems-2/ (accessed on 21 June 2019).
  74. World Energy Council (WEC) and Oliver Wyman. Energy Trilemma Index 2016. Available online: https://www.worldenergy.org/publications/2016/2016-energy-trilemma-index-benchmarking-the-sustainability-of-national-energy-systems/ (accessed on 21 June 2019).
  75. Check, R.; Space-based, P.S.; Percent, K.; Shingles, E. The Future of Solar Energy; MIT Energy Initiative: Cambridge, MA, USA, 2015; pp. 3–6. [Google Scholar]
  76. IRENA. Renewable Energy Capacity Statistics 2019, International Renewable Energy Agency, Abu Dhabi. 2019. Available online: www.irena.org/publications (accessed on 21 June 2019).
  77. International Energy Agency (IEA). Renewables 2018. Market Analysis and Forecast from 2018 to 2023. 2019. Available online: https://www.iea.org/renewables2018/power/ (accessed on 13 June 2019).
  78. International Renewable Energy Agency. Renewable Energy Benefits Leveraging Local Capacity for Solar Pv, Abu Dhabi. 2019. Available online: www.irena.org/publications (accessed on 21 June 2019).
  79. 100 US Cities Are Committed to 100 Percent Clean, Renewable Energy|Sierra Club 2018. Available online: https://www.sierraclub.org/press-releases/2019/03/100-us-cities-are-committed-100-percent-clean-renewable-energy (accessed on 12 June 2019).
  80. UK100 2019. Available online: https://www.uk100.org/ (accessed on 12 June 2019).
  81. Ram, M.; Dmitrii, B.; Arman, A.; Solomon, O.; Ashish, G.; Michael, C.; Christian, B. Global Energy System Based on 100% Renewable Energy Power Sector; Lappeenranta University of Technology and Energy Watch Group: Lappeenranta, Finland; Berlin, Germany, 2017. [Google Scholar]
  82. Couture, T.D.; Leidreiter, A. How to Achieve 100% Renewable Energy; The World Future Council: Hamburg, Germany, 2014. [Google Scholar]
  83. CDP. Home—CDP 2019. Available online: https://www.cdp.net/en (accessed on 19 June 2019).
  84. Agencia de Energía de Barcelona. ¿Cuánta Energía Puedes Generar? 2016. Available online: http://energia.barcelona/es/cuanta-energia-puedes-generar (accessed on 20 March 2018).
  85. Agencia de Energía de Barcelona. Mapa de Recursos d ’ Energia Renovable de Barcelona. 2016. Available online: http://energia.barcelona/ca/quanta-energia-pots-generar (accessed on 20 March 2018).
  86. ESMAP; SOLARGIS; WB; IFC. Global Solar Atlas. Glob Sol Atlas 2019:1. Available online: https://globalsolaratlas.info/?c=32.651516,51.678658,11&s=32.65139,51.67917&m=sg:ghi (accessed on 22 May 2019).
  87. (ISE) FI for SES. Photovoltaics Report; Fraunhofer ISE: Freiburg, Germany, 2016. [Google Scholar]
  88. U.S. Energy Information Administration. International Energy Statistics n.d. Available online: https://www.eia.gov/beta/international/data/browser/#/?c=4100000002000060000000000000g000200000000000000001&vs=INTL.44-1-AFRC-QBTU.A&vo=0&v=H&start=1980&end=2016 (accessed on 21 June 2019).
  89. Ecometrica. Electricity-specific emission factors for grid electricity. Ecometrica 2011, 1–22. [Google Scholar] [CrossRef]
Figure 1. Correlation between urban population and electric energy consumption. Source: Created by authors using data from [4].
Applsci 09 03247 g001
Figure 2. Distribution of the 125 countries of the ETI (Energy Trilemma Index) 2017 by regions and GDP groups per capita. Notes: Regions are divided (greatest to least presence) into Europe with 41 countries (32.8%), Sub-Saharan 25 (29%), Asia 22 (17.6%), LAC 19 (15.2%), MENA 15 (12%) and North-America 3 (2.4%). The GDP groups are divided as: Group-I has 34 countries (27.2%), Group-II has 38 (30.4%), Group-III has 27 (21.6%), and Group-IV has 26 (20.8%). Source: Created by authors using data from [12].
Applsci 09 03247 g002
Figure 3. Structure of the indicators of the pathway calculator of the WEC (World Energy Council). Source: Created by authors using data from [13].
Applsci 09 03247 g003
Figure 4. Integration of ICT (Information and Communication Technologies) in urban management towards smart cities in the framework of the Urban Energy Transition.
Applsci 09 03247 g004
Figure 5. Decentralization of the power electric system within the smart city urban management model.
Applsci 09 03247 g005
Figure 6. Zero energy concept in buildings and cities.
Applsci 09 03247 g006
Figure 7. Effectiveness of the energy dimension of smart cities to achieve energy sustainability in urban areas and countries.
Applsci 09 03247 g007
Figure 8. Correlation between the percentage of urban population and the ETI during the period 2014–2017. Source: Created by authors using data from [3,12,71,72,73,74].
Applsci 09 03247 g008
Figure 9. Variation of the 125 countries in the ETI ranking and the percentage of urban population (%UP) from 2014 to 2017. Source: Created by authors using data from [3,12,71,72,73,74].
Applsci 09 03247 g009
Figure 10. Share of the electricity generation mix and share with urban PV (Photovoltaic) generation by ETI ranking segments 2017. Note: Renewables—biomass and waste, geothermal, solar, tide, and wave electricity, and wind.
Applsci 09 03247 g010
Figure 11. Variation in the concentration of electricity generation due to the increase in urban PV generation in the ETI 2017 countries.
Applsci 09 03247 g011
Table 1. Results obtained in indicators of the pathway calculator (WEC). Source: Created by authors using data from [8].
Variation to the MinimumVariation to the Maximum
IndicatorETI Ranking SegmentWorstSameBestN/AWorstSameBestN/A
Concentration (reduced diversity) of electricity generation (0–100) *1–250916025000
26–500025020500
51–751 *024017800
76–1000124019600
101–1250124016900
Total1111130972800
Concentration (reduced diversity) of total PE supply (0–100) **1–250619025000
26–500322025000
51–751 *123023110
76–1000123121301
101–1250219418304
Total1131065112715
Import dependence (1–100)1–250124023110
26–500025022300
51–750025021220
76–1000025022210
101–1250025021400
Total0112401091240
GHG emissions from energy sector (MtCO2e) (0–10,000) ***1–250718025000
26–500222123101
51–750025024010
76–1002 **022123011
101–1250120417404
Total2101076112526
* Results of the variation to the minimum: Eleven countries would maintain the same position (Denmark, Sweden, Switzerland, Germany, Finland, Spain, Portugal, Belgium, Romania, Guatemala, Honduras), and only Peru would fall in the ranking. ** Results of the variation to the minimum: Thirteen countries (Benin, Denmark, Dominican Republic, Greece, Kuwait, Lithuania, Netherlands, Niger, Romania, Slovakia, Sweden, Switzerland, and Venezuela) would maintain the same position, and only Peru would fall in the ranking. *** Results of the variation to the minimum: Two countries (Dominican Republic and Iraq) would obtain a lower position, and 10 countries would maintain the same position (Denmark, Greece, Hungary, Netherlands, Niger, Portugal, Romania, Sweden, Switzerland, and United Kingdom).
Table 2. Average results of the effect of the diversification of the electric generation with urban PV generation in the ETI 2017 countries.
ETI Ranking Segments
Total12345
Number of countries analyzed1252525252525
Average concentration (reduced diversity) of electricity generation (0–100)66.4144.9265.4071.7676.7673.20
After the urban PV generation (0–100)55.1628.2344.9855.5361.3785.71
Average variation−15.94−42.49−32.33−20.91−14.2930.32
Number of countries that have diversity electricity generation87252118167
Average variation of concentration (reduced diversity) [%]−42.44−42.49−43.30−45.08−42.51−32.70
Number of countries that concentrate electricity generation38047918
Average variation of concentration (reduced diversity) [%]44.730.0025.2541.2535.9054.83
Average variation of the consumption of fossil fuels [%]−56.31−30.93−50.24−51.08−57.88−91.41
Average variation in CO2 emission [%]−64.00−40.72−59.62−61.09−65.29−93.29

