1. Introduction
For providers outside the U.S. and North American borders it is reasonably important to understand the market for original equipment manufacturers (OEMs), asset owners, and component and service providers. The Renewable Energy industry is a hot topic and will remain with steep level of growth of development despite the doubts fuelled by the change in U.S. political leadership [
1,
2]. The wholesale price of electricity generated is by far the cheapest for onshore wind turbine. In the recent years, companies with upgraded solution or repair services showed a rapid growth in popularity. In the Wind Energy industry, there is still a poor level of knowledge sharing mostly due to the competition between OEMs and the protection of Intellectual Property. A published case study focusing on a technology challenge specific to an OEM can have a negative effect on the market for new wind turbine sales. On the other hand, it has to be recognized that these studies are helping to optimize costs, hence drive down the Levelized Cost of Energy (LCOE) for wind energy, which leads to larger investments [
3].
The Onshore Wind Industry could be separated in four separate clusters regarding engineering challenges: (a) manufacturing, (b) wind site setup, (c) wind site operation, and (d) end of life. The activities are organized around these topics. In events organized by American Wind Energy Association (AWEA) the four stages are grouped into two main categories. One of them is focusing on manufacturing, selling and installing new turbines and everything that come in need for project management, sourcing, and logistics [
4].
The other cluster focuses on operation, maintenance, and safety. In this section, turbines that are already online, as well as operations, are in focus. This part of the lifecycle also functions as a test for all the components whether they perform as it was supposed to. If not, there is an immediate engineering need to address the issues with the requirement to stay feasible in the wind turbine operational life cycle [
5] and scheduling optimization [
6]. Even though some of the turbines have reached the end of the life cycle, there is still no major focus from the industry to optimize this part of the business [
7]. In the wind site operation cycle there are ongoing challenges which call for solution or process optimization in order to lower the costs and/or risks. There are many different wind site owners are using the same or similar turbines, hence once a good case practice is identified it can be deployed very easily. The motivation is common for all renewables, keep lowering the LCOE [
8,
9,
10].
In the U.S. Wind Turbine market, as a rule of thumb, the owner signs for 5 years with the OEM to provide operation and maintenance services. After this period, the owner of the turbine can decide if they would like to extend the contract and continue to use the OEM’s services or take the risk and operate and maintain the turbines on their own. Besides these two options, there are several hybrid setups, including independent service providers (ISPs) and authorized service providers (ASPs); it all comes down how much risks will be taken in house. In the cost optimization process, it is good practice to focus on the greater costs, then gradually move down on the list, and deal with the smaller items. As a comparison, a new gearbox for a 2 MW turbine is ca.
$200,000 [
11]. For this price, 23 turbines could get new pitch cylinders.
The target group for this work includes the hydraulic pitch cylinder component manufacturer, the North American Wind Energy Advisory of the Danish Trade Council, and the Asset owner of the turbines, which were used as a case study. The main contributions of the proposed work are as follows.
A thorough investigation of the selected wind turbines and all error messages
The severity of the economic loss due to the pitch mechanism failure was thoroughly studied, estimating downtime in wind farms.
For the first time, the correlation with real-time pricing was revealed—based on real life data—that the loss in wasted resources on the long-term could be enormous.
The remainder of this paper includes the main problem statement, methods, and theory section; the presentation of the Southern District of Texas; the economic analysis, which estimates the long-term impact; and the conclusions section.
2. Main Problem Statement, Methods, and Theory Review
A well-known cliché in the wind industry that you can determine whether the pitch control mechanism is electric or hydraulic by looking at the rotors; if they are covered with black oil it is a hydraulic system. Even though that wind turbines are the flagships of the renewable energy these are some hiccups, which are not environmentally friendly. Hydraulic cylinders are calculated to leak, and in fact 5% of the total system volume annually (including maintenance procedures) is normal. The objective of a wind turbine owner is to keep the wind turbine running. Hence, it is very important to minimize the downtime due to maintenance and repairs [
12,
13]. In the long-term, it is crucial to determine what is the most economical strategy to avoid short cuts, which can end up being a big expense, risking the business model of the electricity-generating wind turbine.
The procedures followed throughout this research paper is based on the Peffers et al. [
14] and Kuechler & Vaishnavi [
15] models. This process model bares resemblance to the Define–Measure–Analyze–Improve–Control (DMAIC) model found within the Six Sigma methodology (
Figure 1) [
16].
The scope of this work is illustrated through a structural representation in
Table 1 below.
These new generation wind turbines variate their rotor speed to adopt various wind conditions by adjusting the blades which are mounted on the rotor hub. The Pitch control system allows the rotor blade alignment between 0° and 90° angles. The mechanism can be either electric or hydraulic. In the hydraulic type of pitch system, the cylinder creates a rotating motion with a hinged setup. The hydraulic cylinders used in these turbines are custom made for each of the turbines [
19]. For a long lifetime of the cylinder special seals are designed. The seals are classified as ‘wet seals’ and allow a small amount of leakage for the proper operation. It is determined by the OEM what will be classified as normal leakage.
When annually testing the primary seal conditions, the allowed max leakage is 20 mL/min. After one-year operation the maximum allowed amount is 500 mL/min. The maximum allowed external leakage to the hub is 300 mL/year but it is advised to be completely avoided [
20,
21].
This system has been designed with a purpose to monitor the progress of the leakage. The overall goal is to keep all the hydraulic oil inside the system. If the seals are wearing out, the “jar” will be filled with oil and the turbine will immediately shut down. To return to generation mode, it requires further action by the control center remotely or by the wind technician locally. If the tank is full, it has to be manually drained by the technician in order to switch back on the turbine.
3. The Case of the Southern District of Texas
In the U.S. there are few hundred of the type of wind turbines we examine in this paper all installed in the years 2011–2012. Most of the times after 5 years, the owners of the turbines are finished with the OEM service contract and switch to self-operation and maintenance. The investigated parks are shown on
Figure 2 in A and B sites.
A financial advisor and asset management company, Lazard, creates a report every year about the history, current status, and the future trends of the energy price in the U.S. market. A decade ago, renewable energy prices, such as wind and solar energy, were higher than the conventional energy production methods. Solar and wind price dropped 86% and 67%, respectively. Since 2011, the onshore wind energy has the lowest LCOE [
22]. The forecast shows further decrease for both solar and wind LCOE [
23]. By 2020, the average cost of wind is projected to go below
$40 and by 2050 below
$30. These numbers are very important to be kept in mind when planning with long-term OPEX and potential life-time expansion of the wind turbines.
The study was based on extensive data acquisition via Supervisory Control and Data Acquisition (SCADA). These types of systems have a network of electronic measuring devices, sensors, switches, etc. The setup of the systems allows the controlling processes to be executed both locally and remotely. Furthermore, its purpose is to support data analytics, generate alarms and transmit them to different specified locations. [
24]. A system is normally a mix of a device which collects the data from the Programmable Logic Controller (PLC) of the Turbine’s controlling unit, a central host unit which collets all the transmitted data and a number of monitoring and controlling software (can be standard or custom).
3.1. SCADA Data Analysis
The SCADA system for site B reports all the predefined information. In this work the focus was on the data which provide information about hydraulic leakage failures from the pitch cylinders which causes the turbines to shut down. Two sets of data have been provided in a form of excel sheet:
Data Report 1: this report includes a 4-month period, between 1 January 2018 and 30 April 2018. In this document, all the types of error codes were listed for all more than hundred turbines from the site.
Data Report 2: this report was a whole year report, starting from 1 January 2017 and ending on 31 December 2017. The document includes only three selected turbines, which showed outstanding results with the total number of failures within the period of the first report. In this second data report, only one type of code is available, which shows the hydraulic failure.
The relevant date headers are
Turbine ID
Time From
Duration
Event code
Event text
Low kWh
In order to calculate the value of the lost kWh during the production, the market value of the electricity has to be investigated. The price fluctuates many times during the day. ERCOT makes it possible to publicly access to the Selling Point Price (SPP). This online database is refreshed every 15 min. The wind site B is connected to the interconnected electrical system managed by Electric Reliability Council of Texas (ERCOT) [
25]. ERCOT facilitates the markets, provides timely information relevant to the operation of the markets and ensures transmission systems reliability. Furthermore, process outage and Network Model requests and coordinates transmission system planning. Location Marginal Pricing (LMP) is the cost to serve the next increment of Load at an Electrical Bus. At the Day Ahead Market (DAM) LMPs and Settlement Point Prices are calculated every hour, however in the Real-Time operations LMPs are calculated every 5 min and Settlement Point Prices (SPP) are calculated every 15 min. There are three types of Settlement Points: Resource nodes, Load Zones and Hubs. An electrical bus and the resources define the resource node. Here the resource’s measured output is settled. A group of Electrical buses makes a Load zone. There are four competitive load zones and four regional Hubs, North, South, West, and Houston. The last SPP type is a Hub. Each Hub is a group of Hub buses (345 kV).
In Texas, the installed wind capacity is 22,799 MW. Texas has a diverse portfolio. The mix has wind, gas, coal, nuclear and combine sum of 1% by solar, hydro and biomass. The total annual supply in 2017 was 358 TWh. Wind Energy provided 17.4% of this value. ERCOT is providing different type of data sets, which are available for the public on the ERCOT’s homepage. The Hub Prices for the southern Texas were collected for the period, which were relevant for the SCADA data report 1 and report 2. The 2017 data were available for every 15 min. To reduce the amount of data the 4 × 15 periods were averaged and consolidated into hourly price information.
The Process is relevant for the study to identify the root cause of the problem and obtain a clear picture of the ‘As-is’ situation. A series of tools will be used to determine the root cause. Once the problem is identified, solutions are created to meet the customer demands. The main question to be answered is: “How to optimize the hydraulic systems processes in to lower the global costs”. The SCADA data were analyzed from the wind farm B in southern Texas. Initially the dataset for the whole turbine part with all the codes were requested. However, the size of the data was so big, that the exporting procedure would occupy their server for more than a day. This had to be avoided in order to keep the wind site running. To reduce the data exporting time constraint were defined. In the first data export, a 4-month period was investigated with all the turbines and error messages. In this dataset the following two types of codes were important:
Longer periods than 1 min could mean that the sensor is still triggered. A nice example is shown in
Table 2 with the duration of 00:03:07. Based on the interviews information, the service technician can be at the turbine within 5–45 min. Out of the 112 turbines, there are 24 which had a fail code with leaking cylinder (Event 216). This means 21% of the site is affected with this problem. The rest of the turbines did not generate any 216 event code in this 4-month period. The 216 Event code only registers if the level of leakage triggers the sensor. In the case of Event Code 220, the technicians are manually pausing the turbines.
Historically, the total of 216 type events provided 5% of the total electricity production loss. Another 32% was caused by the above-mentioned maintenance work carried out by the technicians. In the list of error messages there are no visible patterns or relations between the 216 and 220 codes, hence it cannot be used for further maintenance cost conclusion. The 220-event code is also used for other kind of work as well. Even tough multiple maintenance procedure can be carried out during a single 220 event, the interview with the technician resulted that fixing a 216 failure separately take 30–45 min of technician work.
The total lost energy amount due to 216 events within 4-month period (2018Q1) was approx. 260 MWh. The amount of failures is not evenly distributed between the 24 wind turbines (the exact distribution is shown in
Figure 3). It is listed in the chart how many times the error appeared, how long was it registered and what was the lost energy production for this period. Due to the different strength of the wind and the variety of durations of the events, the results are quite different. In the second data report from the SCADA system, turbines B13, C01, and C13 are listed (marked with yellow on
Figure 3). Worth to mention that in this chart, E10 does not stand out with its lost kWh, however it is very close to C01 with the time spent on 216 code.
3.2. Market Price
The average day ahead market price (dam_spp) for ERCOT in 2017 was $21 and the real time market (rtm_spp) price $35. The simple way of calculation for the economic loss would be to use these values. However, due to the high price variation it would be essential to analyze whether the high price peaks had any effect on the final result. In the following section, the article will look into the variable market prices. The realistic historical economic loss was determined on the 216 type of failure codes. In the public database, the SPP for the Node for our investigated wind site is available. The B site node is located in the South Hub. The available data and current price was $31.72.
The historic data were not available for the prices for all nodes. Such historical data are only available (for the public) for the past 14 days. After the investigation of the database, it was clear, that the prices were not greater than 5%. Hence, it was concluded that using the prices for the South Texas Hub was reliable. In
Figure 4, the SPP value is shown for the last 16 months. One of the extreme peaks is from 17 January 2018 7:00 am, where the price skyrocketed at
$1579. Historic low temperatures hit Texas in those days and heavy energy demands skyrocketed the prices during breakfast time. The electricity generation prices can have such peaks when a forecasting has an error and the demand is far from meeting the supply. Both the hardware and the software technology are getting better and ERCOT is claiming to be better in forecasting as well. With more accurate forecasting there will be less price fluctuation on the market.
4. Economic Analysis and Detailed Turbine Overview
In order to realize the economic loss on each of the turbine, the current price of the wind energy has to be used. The timestamp of the 216-event code and the SPP prices for the South Texas Hub were linked. Since the time format of the event time stamps and the price of the energy were not in the same format a simplification was required.
Each of the ‘Time From’ has been “floored” to an even hour and the ‘Time To’ value were rounded to the nearest hour; an example show in
Table 3. Then the average price in calculated for the duration.
The economic loss,
EL, for an event was calculated by Equation (1):
where
Ap is the Average Price, and
H the Hours of Duration.
In the first round the results have been only calculated based on the first data report. This allowed to have an estimate data from the period of 2018Q1. For a comprehensive calculation, all 112 turbines were included. The result showed that in the first 4-month period of 2018 the total loss of the production from all the wind turbines at the site was totaled at
$5400 (
Table 4). Based on the 2018Q1 values, further projections can be made. Based on the assumption that the current conditions will remain, the total 2018 loss will be
$21,588.
For 2017, the selected three turbines can be calculated based on the available value for the 216 events. If we compare the results with the 2018 projected values all of them shows growth B13′ and ‘C13′ shows a significant growth, however ‘C01′ is only 3% more expensive to be forecasted in 2018 comparing to 2017 (
Table 5). By the economic loss broken down into quarters in 2017, it is visible that the events are not homogeneously distributed. There is no visible relation between the turbines.
The total loss on these three turbines are within $2000 range with a 15% deviation. To seek for patterns in the next sections, each of the above mentioned three turbines is separately investigated.
4.1. Detailed Investigation of the Three Wind Turbines
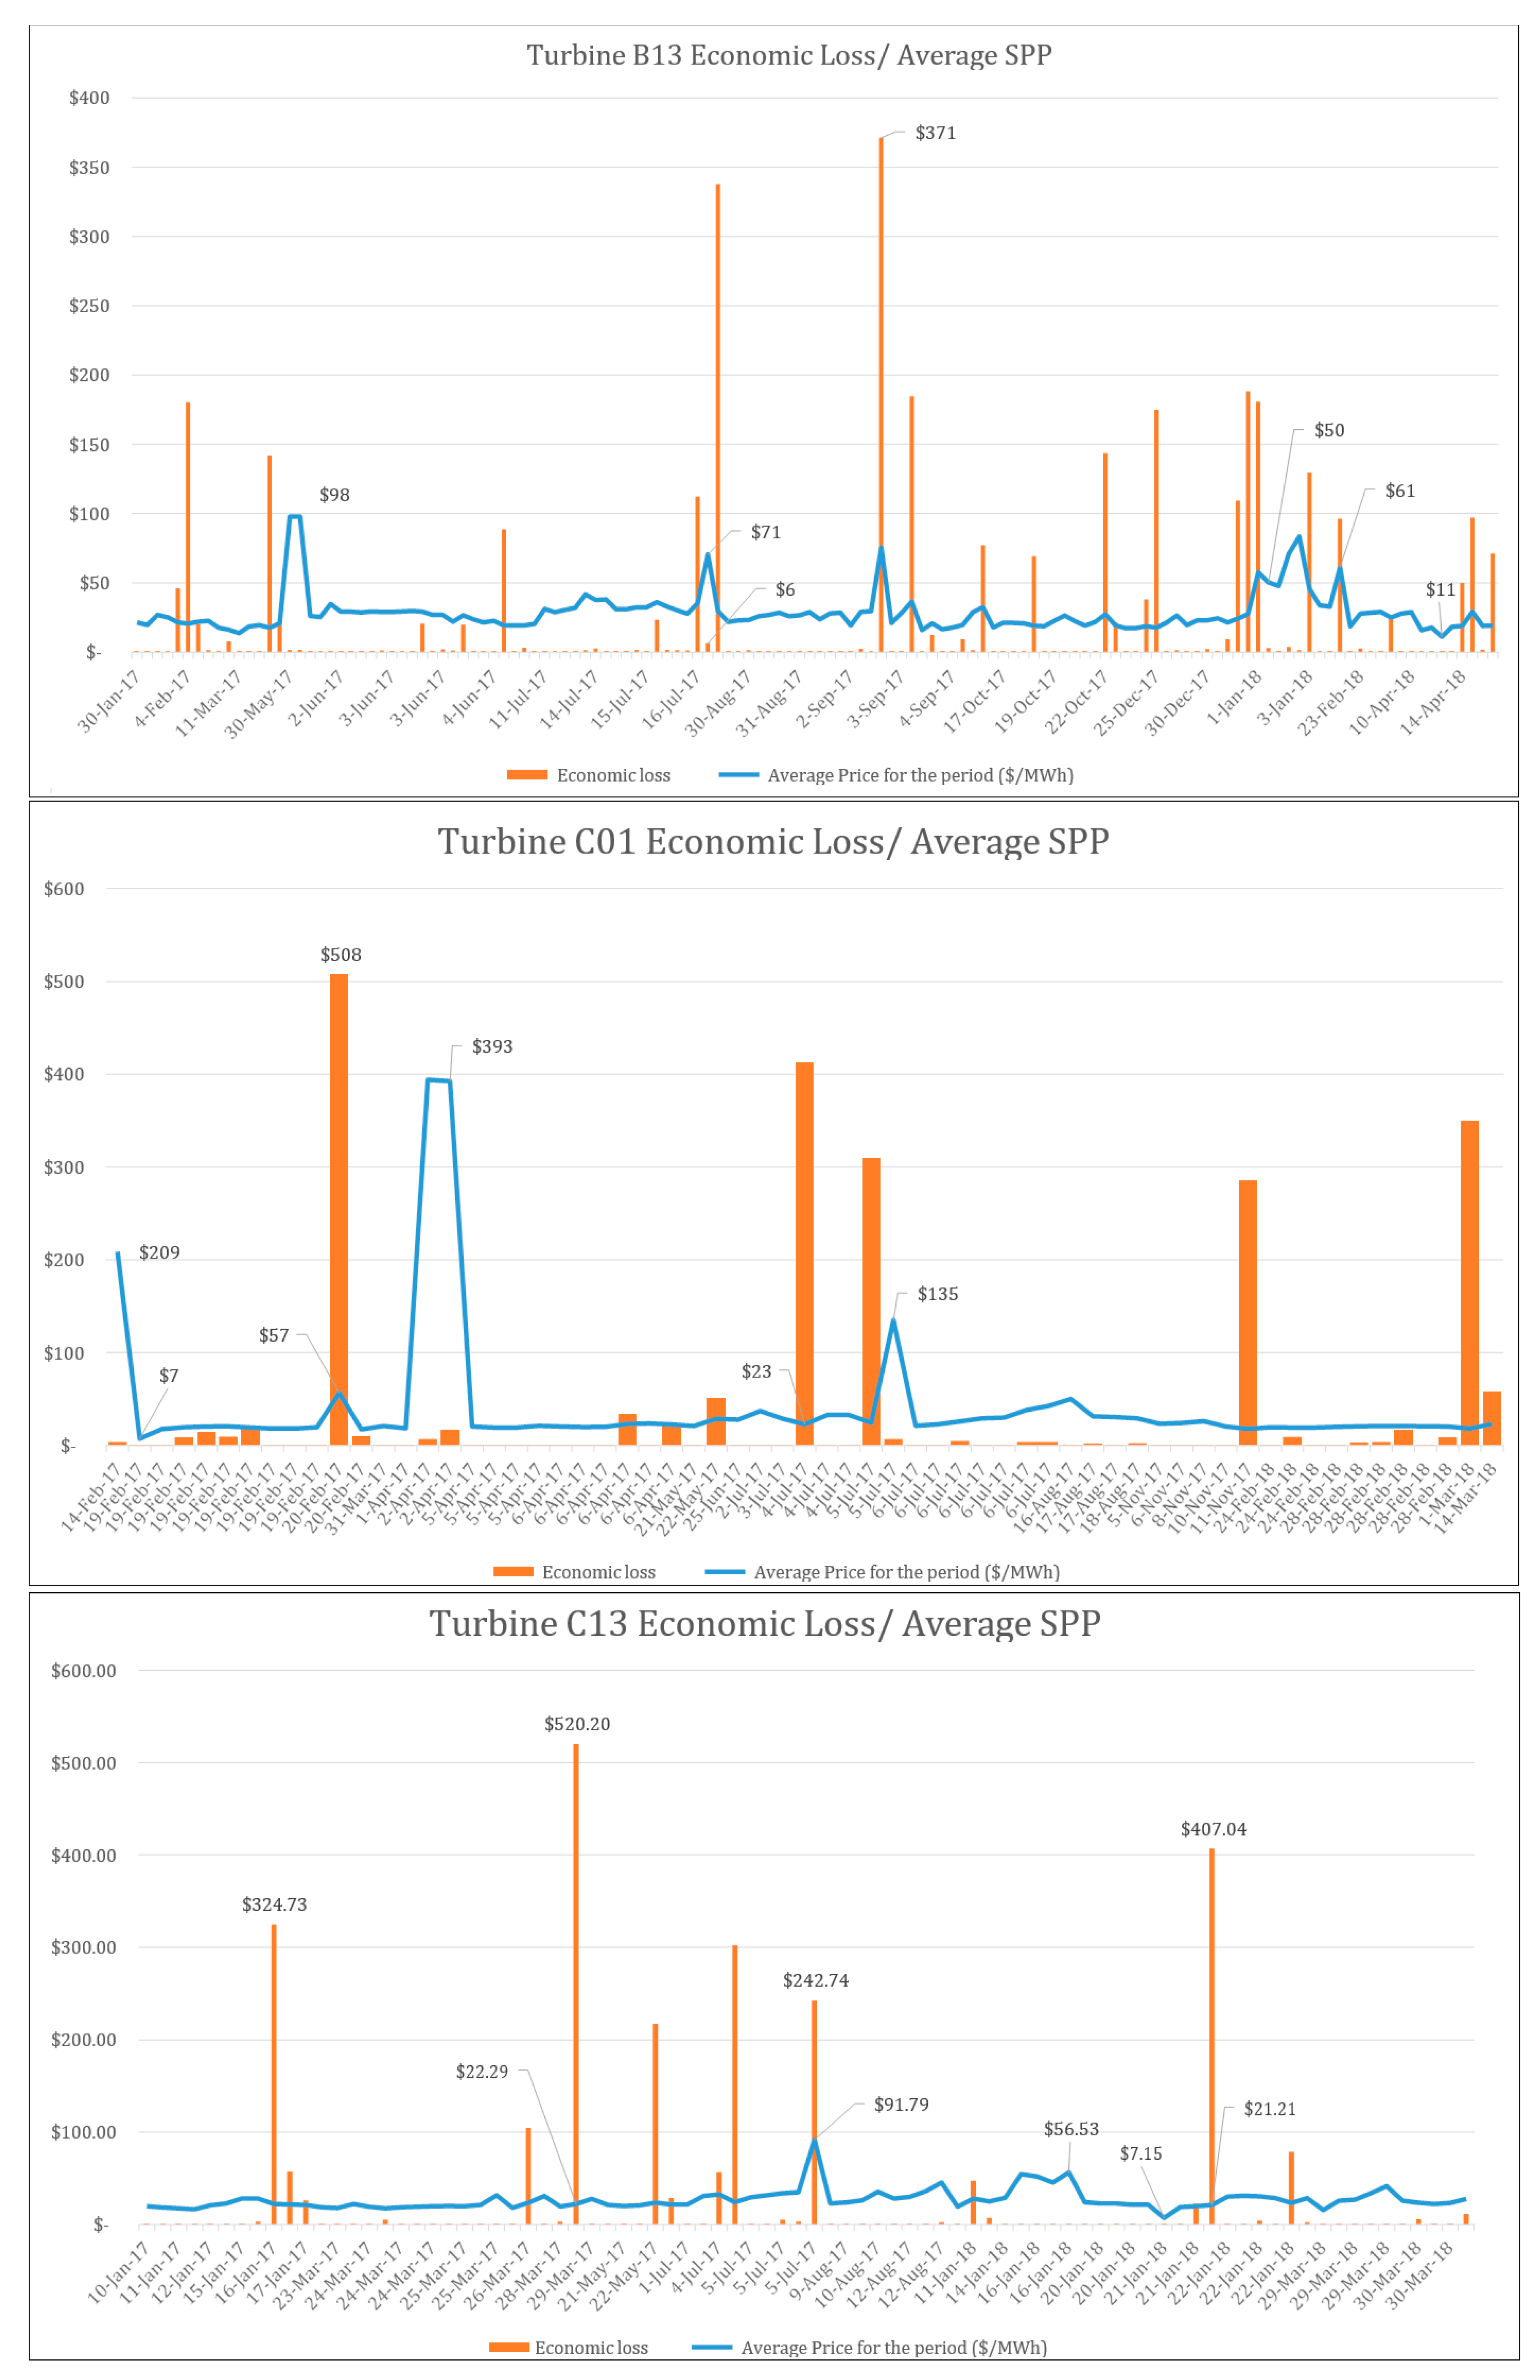
For a 15-month investigated period the total generated economic loss on the event 216 for B13 was
$3168. In this period the SPP had a high of
$98 and a low of
$11. It is important to note that not all the SPPs are visible in
Figure 5; only the average value that have an overlap with the 216 events. The first detailed chart in
Figure 5 for the B13 turbine shows the relation between the wholesale market price of the electricity and the realized economic loss. The loss is registered at the end of the timestamp of the failure event. The highest value of the single loss is at
$371. The average SPP for this period was
$76. This price value is 2.8× times larger than the average wholesale price for wind. For this turbine there are only three registered events with significant higher electricity sale price (
$71,
$50, and
$61) that contributed to a higher amount of economic loss. Other high peaks have only short registered event which no or barely recognizable outcome.
Figure 6 shows the operational times for Turbine C01, B13, and C13. This Gant-Chart type of graph shows each operational period as an event. Originally, the graph was created to show times when the turbines were not operational due to the 216-failure code; however, due to the relative small event length comparing to the full time span, the markers were hard to see. The long lines are representing the length each period where each turbine was operating without 216-failure code. It must be noted that this does not mean that the turbine was failure free or have other failure codes present. For B13, in the period of 1 January 2017–16 April 2018 there were nine long uninterrupted periods. It is typical that there are many short operation periods between the long durations. For example, there is only one occurrence for a single short period between Event #13 and #15.
For C01, for the 15-month investigated period the total generated economic loss on the event 216 was
$2203. In the detailed chart for the economic loss and the price (
Figure 5) there was only event which has been impacted by the high market price. During event, the electricity price was
$57 which resulted a total loss of
$508. The other failures have not been impacted by market peaks (
$209,
$393, and
$135). The detailed chart about operation hours (
Figure 6) shows 11 longer failure free periods. Between the longer periods there are normally very short operational periods recorded.
For C13, for the 15-month investigated period the total generated economic loss on the event 216 for C01 was
$2525. On the detailed figure for the market price and the economic loss there is only one error event registered which has been registered with higher than average price. Market price was
$91.79 which is 3 times the monthly average price for Texas. The other events were realized at average price rate. The operation hour graph shows (
Figure 6) nine longer uninterrupted periods. #51 and #52 have no short interval in between.
In general, it can be concluded that out of the three closely monitored turbines none of them were impacted by significantly lower SPP price than the market average. On the other hand, there were 2–4 events in the 15-month period where a longer registered event was impacted by a 2–3 market price multiplier. The investigation justified that the detailed analysis was necessary to capture the real economic loss.
4.2. Problem Progression and Statistical Control
To determine the cause of the variation, preliminary analysis of the data has to be done. Using the Run charts from the Six Sigma toolbox, it is assumed that the data are from a reliable process [
26]. The selected three turbines are from the top 5 list of those with the highest share of lost produced electricity. There are two graphical representations of the available dataset. The operational day counter charts showing the original dataset. In the creation process for the second chart, a Pareto analysis has been used to separate the vital data from the trivial many. The individual Pareto chart are shown for each turbine. The operational days, which are longer than one day, will be in focus.
For B13 turbine, it is visible (
Figure 7) that the dataset shows values, which can be grouped into two categories. In the first category, values are converging to 0 and in the second category the values are falling in the range of 30 to 70. To recognize the vital data, Pareto analysis has been done on the dataset. The figure shows that 50% of the values are within the 0 to 1 range. Based on the previous data analysis and the interviews with the wind site supervisors and the technicians, operational days shorter than 1 day will be neglected. The third chart in the row of
Figure 7 for the three wind turbines has been created with this criterion applied. After visual investigation of the graph, it can be stated that the process is not in statistical control for the total period and it was definitely influenced by one or more special causes. Half or longer operation periods (longer than 20 days) are followed by a short event and the other half have two consecutive long periods.
For the C01 turbine (
Figure 7, second column), similar to above data processing method have been carried out. The values are not that extreme as for B13, but still can be grouped into two categories, values ranging from 0 to 20 and values from 30 to 105. The Pareto analysis applied for this data set shows that 25% of the value are in the 0 to 1 data range. At this turbine, it can also be stated that there is no statistical control for the total period and it was definitely influenced by one or more special causes. There are also maximum two consecutive long periods following each other.
For the C13 turbine (
Figure 7, third column), the data points here can be grouped in to two categories visually: 0–5 days and 35–100 days. The Pareto analysis shows that 50% of the values are in the 0–2 days range. In order to compare the three turbine operation performances, the 0–1 valued have been filtered. With maximum 2 consecutive long periods, there are no recognizable patterns showing by the values.
In general, it can be concluded that all the three turbines fail free operational days and are influenced by a single or multiple causation and therefore, interviews were needed for data validation.
4.3. Cost of Maintenance
On top of the economic loss due to the downtime of the turbines, there were contributors which have to be included, such as the cost of maintenance. In the SCADA event codes, the 220 is activated when the technician shuts down the turbine manually to perform the repair other repairs. However, these events were not counted as it cannot be clearly distinguished which of these 220 events were also in relation with the 216 types of maintenance. Based on the interview with the site technicians, if the failure has appeared for more than 5 min it was most likely to be fixed by a technician. The required technician will be counted from the event appearance. In real life, this can take couple of minutes before it is communicated to the technicians on site. After the code is cleared, an extra average of 12 min will be added to give time to finish the work. The following calculation—shown by Equation (2)—will be used to add extra cost required by the technicians.
where
TTc is the Total Technician Cost,
TLc is the Technician Labor Costs and
T the time, which is estimated as the sum of 216 duration if higher than 10 min plus the time of the event multiplied by a factor of 0.2.
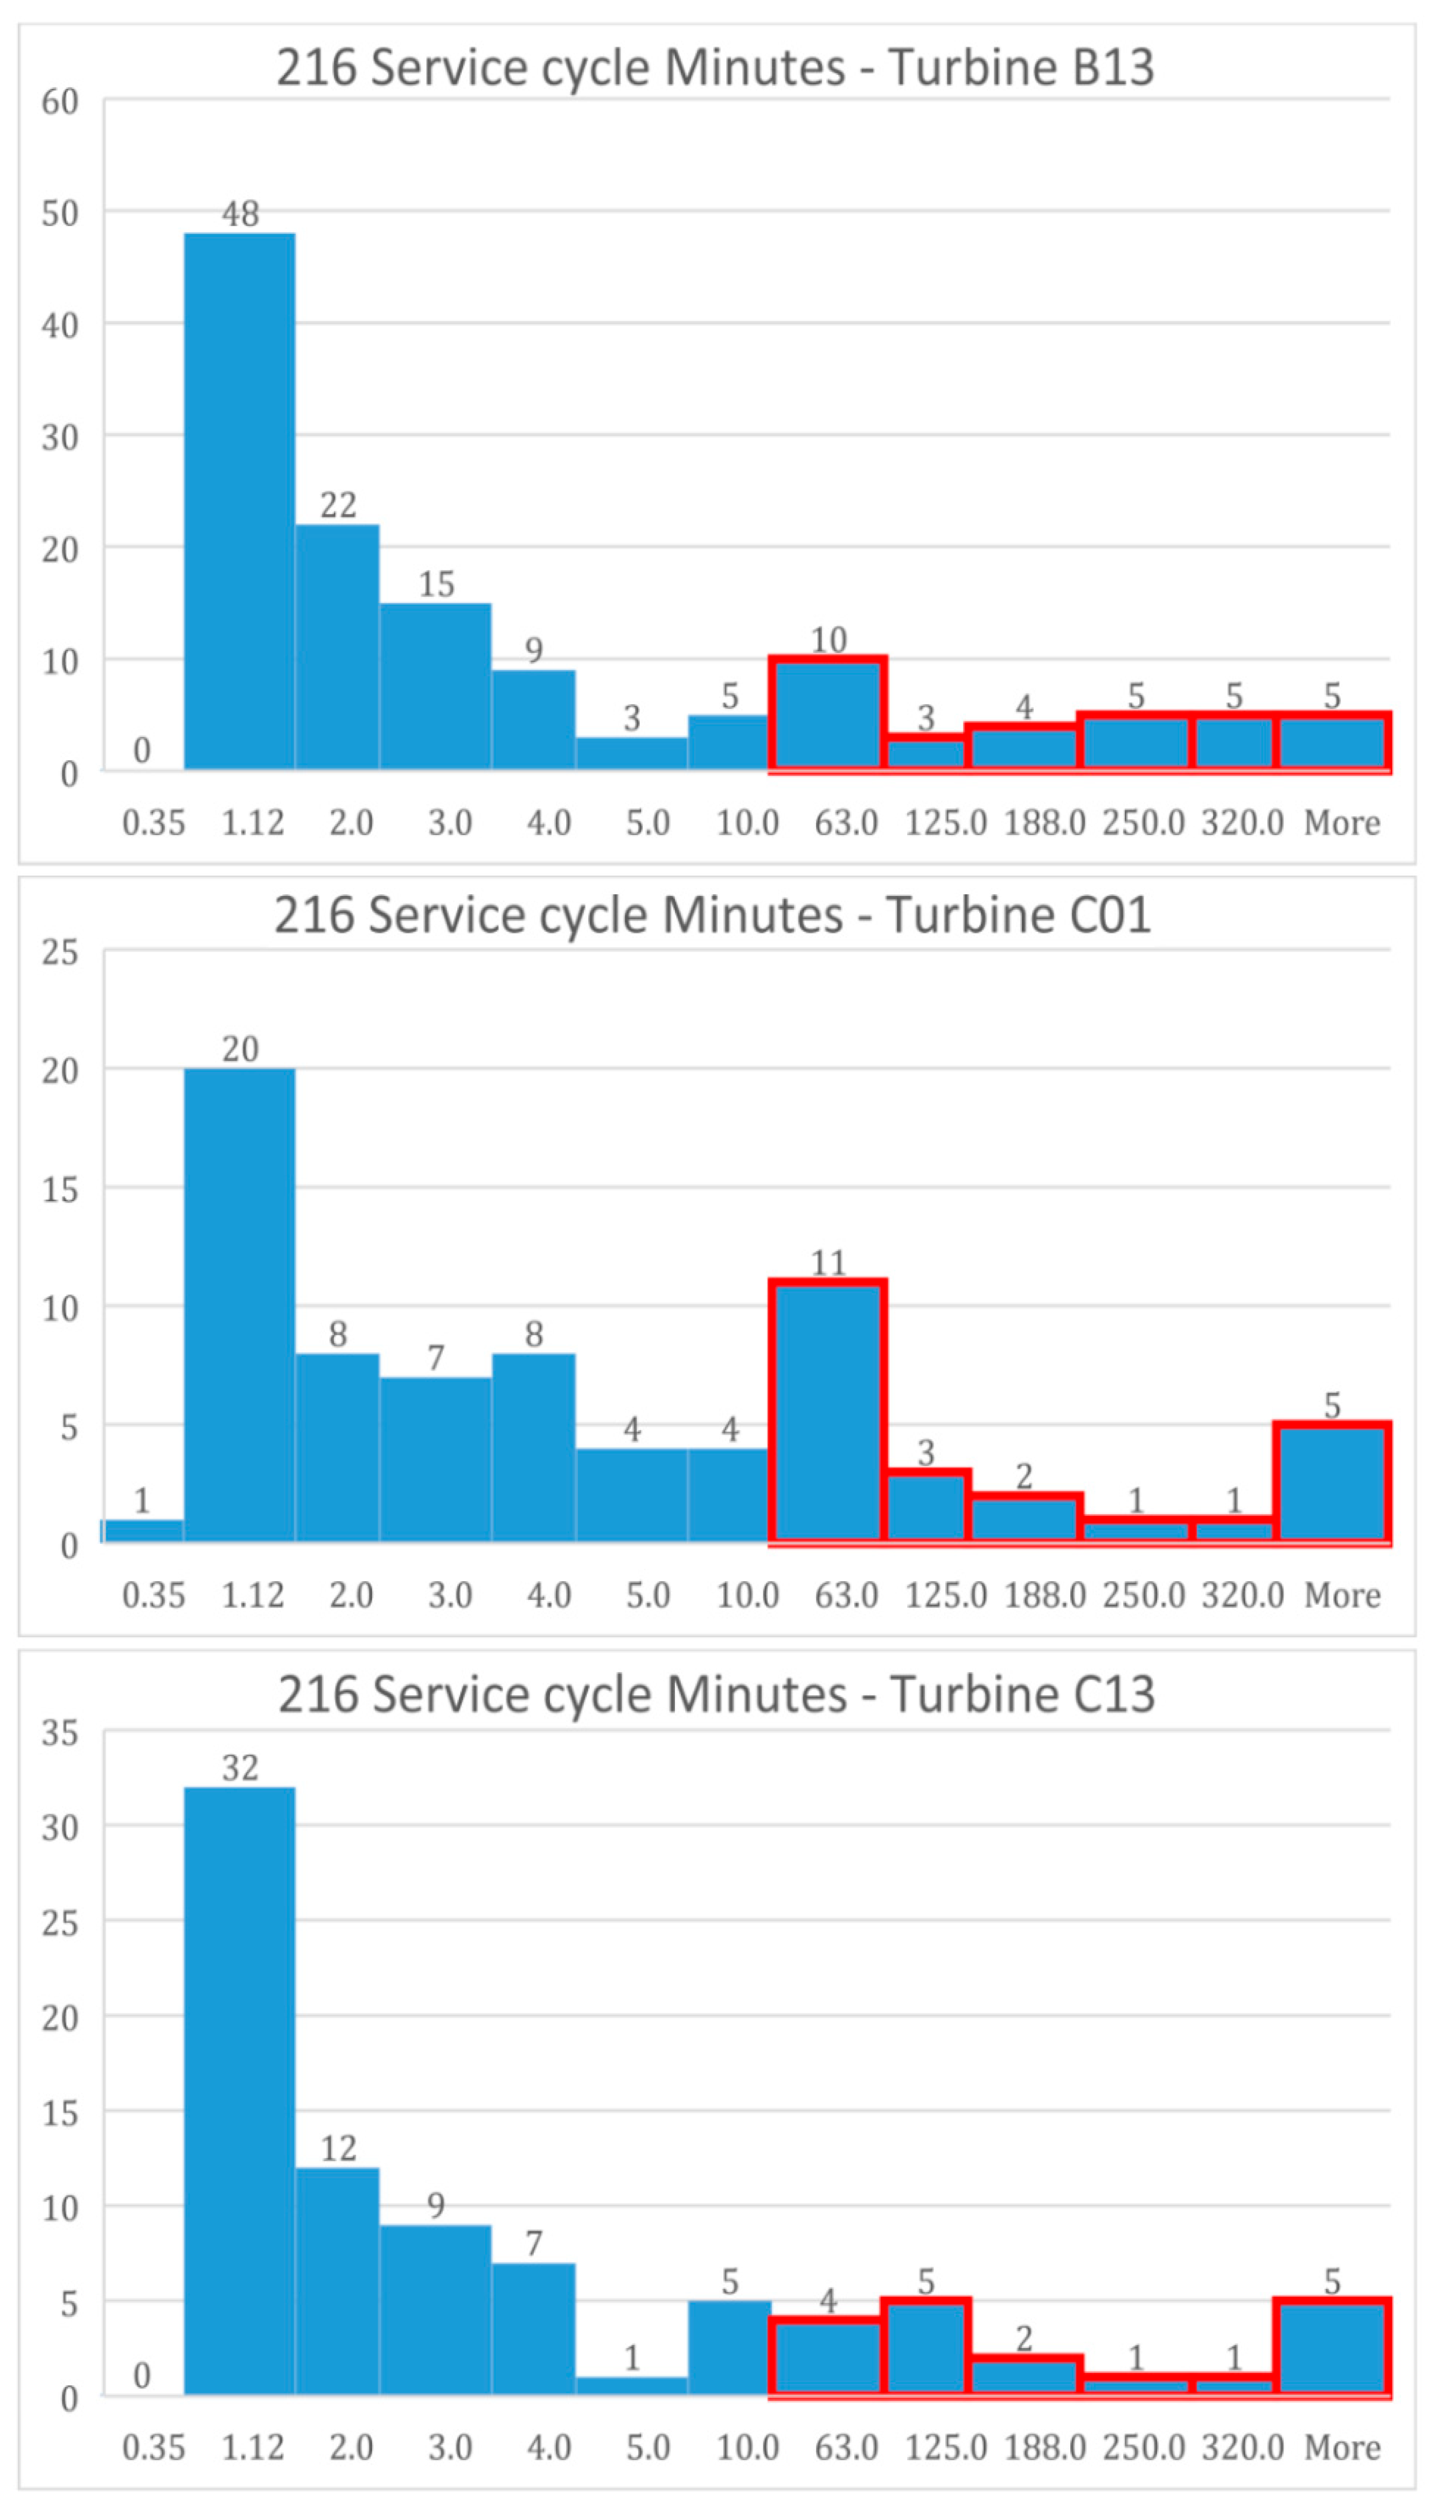
In B13, there were 134 events in total and 32 of them were fixed by a technician. In C01, there were 75 events and 23 have been fixed by a technician and in C13, there were 84 events and there were 18 taken care by a technician (
Figure 8). For these works, additional labor cost will be added. The additional technician cost value for B13 Turbine was
$3425 for the total investigated period, for C01 Turbine was
$2745, and for C13
$3110 (
Table 6).
In the summary (
Table 6), the total 15 months of loss can be seen. From
Table 5 it was visible that the amount of losses are not consistent for each quarter, hence the value would not be precise for long-term forecasting (10/20 years) and should be only used with caution for mid-term (5 years) (
Table 7).
Since it has been estimated the forecast for 60 months and we usually know that a wind farm lifespan is 20 to 25 years, it can be easily calculated that the total cost only for the selected wind turbines could reach at the high costs for the wind turbine owners. This, at a global scale could influence the market and a reinvestment of the saved amounts could boost the American wind turbine industry.
5. Conclusions
The purpose of this project was to detect the severity of the economic loss due to the failure of the pitch mechanism in wind turbines and investigate the possible solutions. This work has identified that the real economic loss due to the downtime can be only captured if the market price is closely investigated. There were several events when the wholesale price was 5× higher than the average monthly value. This number supports the case of reducing the amount of downtime to a minimum caused by hydraulic leak failure.
The analysis was focused on three wind turbines of the wind farm. It was proven that the forecasted loss only for these three wind turbines could reach up to approximately $86,000, meaning that in 20–25 years which is the life expectancy of a wind farm, the total cost could end up as $340,000–430,000. Therefore, for a wind farm owner with more than 100 wind turbines in a wind farm the total cost could reach levels of $1,000,000 or more.
Reinvesting this amount to the American wind industry using solutions such as up-tower repairs or retrofitting solutions could increase further savings. What is crucial is developing a relationship between the user and the component supplier. This amount could be invested there in order to establish a long-term viability of the specific repair industry. The most effective developments and product upgrades can be done if the information about the product and processes are directly communicated from the source. Working with refurbishment or component replacement there is a better possibility to establish a close relationship and accurately address possible malfunctions.
Using the up-tower repair solution, the return of investment can be reduced for such turbines that have the same severity in failures, however it is unclear how much time could be saved. Further research could focus on acquiring data for longer periods (years) for multiple farms in different geographical regions, associating all the downtimes with the loss and based on machine learning forecasting accurately the expected damage and possibilities on savings.
Author Contributions
Conceptualization, G.K.; methodology, G.X.; validation, G.X. and G.K. investigation, G.K.; data curation, G.K.; writing—original draft preparation, G.K.; writing—review and editing, G.X.; visualization, G.X. and G.K.; supervision, G.X.
Funding
This research received no external funding.
Acknowledgments
This study was carried out in collaboration with Lind Jensen Machinery Inc., and therefore great thanks go to all the employees that have been involved in this study. The authors would also like to thank the utility and data provider company E.ON for their collaboration.
Conflicts of Interest
The authors declare no conflicts of interest.
References
- Obama, B. The irreversible momentum of clean energy: Private-sector efforts help drive decoupling of emissions and economic growth. Science 2017, 355, 126–129. [Google Scholar] [CrossRef] [PubMed]
- Ogunrinde, O.; Shittu, E.; Dhanda, K.K. Investing in renewable energy: Reconciling regional policy with renewable energy growth. IEEE Eng. Manag. Rev. 2018, 46, 103–111. [Google Scholar] [CrossRef]
- Xydis, G. A Techno-economic and Spatial Analysis for the Optimal Planning of Wind Energy in Kythira Island, Greece. Int. J. Prod. Econ. 2013, 146, 440–452. [Google Scholar] [CrossRef]
- AWEA. AWEA Windpower. 2019. Available online: https://www.windpowerexpo.org/ (accessed on 29 January 2019).
- Smarsly, K.; Hartmann, D.; Law, K.H. A computational framework for life-cycle management of wind turbines incorporating structural health monitoring. Struct. Health Monit. 2013, 12, 359–376. [Google Scholar] [CrossRef]
- Ju, L.; Li, P.; Tan, Q.; Wang, L.; Tan, Z.; Wang, W.; Qu, J. A Multi-Objective Scheduling Optimization Model for a Multi-Energy Complementary System Considering Different Operation Strategies. Appl. Sci. 2018, 8, 2293. [Google Scholar] [CrossRef]
- Koroneos, C.J.; Nanaki, E.A.; Xydis, G.A. Sustainability Indicators for the Use of resources—The Exergy Approach. Sustainability 2012, 4, 1867–1878. [Google Scholar] [CrossRef]
- Qi, Y.; Hou, P.; Yang, L.; Yang, G. Simultaneous Optimisation of Cable Connection Schemes and Capacity for Offshore Wind Farms via a Modified Bat Algorithm. Appl. Sci. 2019, 9, 265. [Google Scholar] [CrossRef]
- Huang, C.M.; Chen, S.J.; Yang, S.P.; Huang, Y.C.; Chen, P.Y. Capacity optimisation for an SAMS considering LCOE and reliability objectives. IET Renew Power Gen. 2018, 12, 787–796. [Google Scholar] [CrossRef]
- Kästel, P.; Gilroy-Scott, B. Economics of pooling small local electricity prosumers—LCOE & self-consumption. Renew. Sustain. Energy Rev. 2015, 51, 718–729. [Google Scholar]
- Advanced Monitoring Technologies. How Can the Gearbox Condition Affect the Useful Life of a Wind Turbine? 2019. Available online: https://blog.atten2.com/en/how-can-the-gearbox-condition-affect-the-useful-life-of-a-wind-turbine (accessed on 20 January 2019).
- Ma, K.; Zhu, J.; Soltani, M.; Hajizadeh, A.; Chen, Z. Optimal Power Dispatch of an Offshore Wind Farm under Generator Fault. Appl. Sci. 2019, 9, 1184. [Google Scholar] [CrossRef]
- Arts, J.; Basten, R. Design of multi-component periodic maintenance programs with single-component models. IISE Trans. 2018, 50, 606–615. [Google Scholar] [CrossRef]
- Peffers, K.; Tuunanen, T.; Rothenberger, M.A.; Chatterjee, S. A Design Science Research Methodology for Information Systems Research. J. Manag. Inf. Syst. 2007, 24, 45–77. [Google Scholar] [CrossRef]
- Kuechler, W.; Vaishnavi, V. A Framework for Theory Development in Design Science Research: Multiple Perspectives. J. Assoc. Inf. Syst. 2012, 13, 395–423. [Google Scholar] [CrossRef]
- Gijo, E.V.; Sarkar, A. Application of Six Sigma to improve the quality of the road for wind turbine installation. TQM J. 2013, 25, 244–258. [Google Scholar] [CrossRef]
- Saaka, A.; Sidon, C.; Blake, B.F.P. Laddering: A ‘How to Do It’ Manual—With a Note of Caution; Cleveland State University: Cleveland, OH, USA, 2004. [Google Scholar]
- Dresch, A.; Lacerda, D.P.; Miguel, P.A.C. A distinctive analysis of case study, action research and design science research. Rev. Bras. Gest. Neg. 2015, 17, 1116–1133. [Google Scholar] [CrossRef]
- Cheng, D.; Deng, S.; Lu, X. Research of hydraulic variable pitch control of the wind turbine based on PID. Acad. J. Manuf. Eng. 2016, 14, 6–11. [Google Scholar]
- Choux, M.; Tyapin, I.; Hovland, G. Leakage-detection in blade pitch control systems for wind turbines. In Proceedings of the Annual Reliability and Maintainability Symposium, Reno, NV, USA, 23–26 January 2012. [Google Scholar]
- Liniger, J.; Pedersen, H.C.; Soltani, M. Risk-based comparative study of fluid power pitch concepts. In Proceedings of the ASME/BATH 2017 Symposium on Fluid Power and Motion Control, FPMC, Sarasota, FL, USA, 16–19 October 2017. [Google Scholar]
- Lazard. Levelized Cost of Energy. 2017. Available online: https://www.lazard.com/perspective/levelized-cost-of-energy-2017/ (accessed on 5 May 2018).
- Energy Innovation: Policy and Technology LLC. Renewable Electricity Levelized Cost of Energy Already Cheaper Than Fossil Fuels, and Prices Keep Plunging. 2018. Available online: http://energyinnovation.org/2018/01/22/renewable-energy-levelized-cost-of-energy-already-cheaper-than-fossil-fuels-and-prices-keep-plunging/ (accessed on 5 May 2018).
- Puromäki, T. Data Validation in Scada System, Vaasa: University of Applied Sciences. 2010. Available online: https://www.theseus.fi/bitstream/handle/10024/17033/Opinnaytetyo_Puromaki_Toni.pdf?sequence=1&isAllowed=y (accessed on 2 March 2019).
- ERCOT. Market Prices. 2018. Available online: http://www.ercot.com/mktinfo/prices (accessed on 24 May 2018).
- Pyzdek, T. The Six Sigma Handbook. In the Complete Guide for Greenbelts, Blackbelts, and Managers at All Levels, Revised and Expanded Edition McGraw-Hill; McGraw-Hill: New York, NY, USA, 2003. [Google Scholar]
© 2019 by the authors. Licensee MDPI, Basel, Switzerland. This article is an open access article distributed under the terms and conditions of the Creative Commons Attribution (CC BY) license (http://creativecommons.org/licenses/by/4.0/).


