Article

Particle Swarm Optimization Algorithm-Extreme Learning Machine (PSO-ELM) Model for Predicting Resilient Modulus of Stabilized Aggregate Bases

1
Department of Civil and Environmental Engineering, Incheon National University, Incheon 22012, Korea
2
Incheon Disaster Prevention Research Center, Incheon National University, Incheon 22012, Korea
3
Public Works and Civil Engineering Department, Mansoura University, Mansoura 35516, Egypt
4
Department of Civil Engineering, National institute of Technology Patna, Patna 800005, India
5
Department of Computer Science and Engineering, National institute of Technology Patna, Patna 800005, India
*
Author to whom correspondence should be addressed.
Appl. Sci. 2019, 9(16), 3221; https://doi.org/10.3390/app9163221
Submission received: 15 July 2019 / Revised: 31 July 2019 / Accepted: 5 August 2019 / Published: 7 August 2019
(This article belongs to the Special Issue Meta-heuristic Algorithms in Engineering)

Abstract

:
Stabilized base/subbase materials provide more structural support and durability to both flexible and rigid pavements than conventional base/subbase materials. For the design of stabilized base/subbase layers in flexible pavements, good performance in terms of resilient modulus (Mr) under wet-dry cycle conditions is required. This study focuses on the development of a Particle Swarm Optimization-based Extreme Learning Machine (PSO-ELM) to predict the performance of stabilized aggregate bases subjected to wet-dry cycles. Furthermore, the performance of the developed PSO-ELM model was compared with the Particle Swarm Optimization-based Artificial Neural Network (PSO-ANN) and Kernel ELM (KELM). The results showed that the PSO-ELM model significantly yielded higher prediction accuracy in terms of the Root Mean Square Error (RMSE), the Mean Absolute Error (MAE), and the coefficient of determination (r2) compared with the other two investigated models, PSO-ANN and KELM. The PSO-ELM was unique in that the predicted Mr values generally yielded the same distribution and trend as the observed Mr data.

1. Introduction

Stabilized base or subbase materials are a mixture of aggregates, water, and cementitious materials and/or emulsified asphalt. The use of stabilized materials in the construction of bases can reduce the occurrence of failure-related cracking (i.e., fatigue cracking at the bottom of the asphalt layer) owing to the relative higher stiffness of these materials compared with conventional materials [1]. However, cracks (i.e., reflective cracks) that occur in the asphalt layer are usually due to a source of cracking that may be present in a stabilized base layer. The proper design and construction of a stabilized base layer can last through asphalt maintenance and/or asphalt overlays, or a stabilized subbase layer can be used instead underneath a conventional base layer [2].
Stabilized materials should be sound and durable enough to resist the traffic load and changes in climate; in particular, Wet–Dry (W-D) and freeze–thaw effects [3]. According to the Mechanistic-Empirical Pavement Design Guide, among other factors, W-D and freeze–thaw cycles are important parameters that degrade the base/subbase materials and may contribute to premature failure of pavements [4]. There is a significant correlation between the W-D and freeze–thaw conditions in terms of durability and the resilient modulus (Mr) or equivalent elastic modulus, which measures the performance of base materials in a pavement structure [4,5,6,7]. Mr values can be measured in the laboratory in accordance with the AASHTO T307 [8] or predicted by soft computing models [3,9]. A number of studies, e.g., Khoury et al. [10] and Solanki and Zaman [7], have been conducted to measure the influence of W-D cycles on the resilient modulus of stabilized base materials in the laboratory. They found that the addition of cementitious additive to base materials increased the durability of the stabilized specimens against W-D cycles, and hence increased the resilient modulus. On the other hand, Khoury [1] and Khoury and Zaman [11] recommended a regression model for predicting the Mr of stabilized base aggregates based on the number of W-D cycles, ratio of oxide compounds in the cementitious materials (CSAFR), physical properties of the mixture, and stress levels. This model is described as Mr = f (W-D, CSAFR, DMR,   σ 3 , σ d ), where CSAFR is the amount of free lime, silica, alumina and ferric oxide compounds in the cementitious materials, DMR is the ratio of maximum dry density to the optimum moisture content, and the attributes, σ 3 and σ d are the confining pressure and the deviator stress, respectively. Maalouf et al. [4] used Support Vector Regression (SVR) to model the Mr of stabilized base aggregates subjected to W-D cycles, and they found that the SVR prediction model outperformed the regression and least square methods.
Recently, highly advanced learning algorithms were introduced for the modeling of engineering applications. Among these methods, Artificial Neural Network (ANN), the Particle Swarm Optimization algorithm (PSO), and the Extreme Learning Machine (ELM) are highly common methods utilized in designing prediction models. ANN has been widely used to predict the Mr values for pavement materials. For instance, Ghanizadeh and Rahrovan [12] utilized the ANN to predict the Mr for stabilized base aggregates, which were compared with those of the SVR model. They concluded that the ANN was superior to the SVR model for predicting the Mr values of stabilized bases. Arisha [13] used ANN to model the Mr values of recycled concrete aggregates for the construction of bases and subbases. They found that the ANN model could be used to predict an accurate Mr for recycled materials. Zaman et al. [14] found that the ANN model was able to correlate Mr with routine properties and stress states for subgrade soils. More studies using ANN to predict Mr for other pavement applications can be found in [15,16,17,18]. In addition, similar applications for ANN in predicting concrete strength and the mechanical properties of materials can be found in [19,20]. However, when using a gradient-based approach during the learning process of single hidden layer feed-forward neural networks (i.e., ANN/ELM), the network may fall into local minima, thus necessitating a long training time and some terminating criteria [21]. Therefore, an evolutionary algorithm may be used to find an approximate global solution for better network prediction and to maintain good generalization capability for the network.
Although PSO and ELM have been found to be powerful methods in modeling different engineering applications [22,23], very few studies have been conducted on modeling Mr in pavement applications. Pal and Deswal [24] used and evaluated ELM for predicting Mr for subgrade soils, and concluded that high correlation in terms of coefficient of determination, r2 (0.991), could be observed between the measured and predicted values of Mr. In addition, the Kernel ELM (KELM) approach performed well in predicting the Mr of subgrade soils as compared to the sigmoid ELM and SVR approaches. Ghanizadeh and Amlashi [25] used hybrid algorithms, ANN, Support Vector Machine (SVM), and hybrid adaptive neuro-fuzzy inference system methods with PSO algorithm for the Mr prediction of fine-grained soils. They found that the PSO-ANN was superior to the other methods for Mr prediction.
This research study aims to develop and design a hybrid algorithm (PSO-ELM) for predicting Mr of stabilized base aggregates subjected to W-D cycles based on the Mr data presented in Maalouf et al. [4]. Furthermore, the developed PSO-ELM was compared with other methods, such as PSO-ANN and KELM. The performance of these models was statistically assessed and validated for predicting the Mr of stabilized base aggregates based on the data presented in Maalouf et al. [4]. The following sections present the background of the developed methods, the data and performance evaluation criterion, and the results and discussion of the models’ performance.

2. Research Data and Methods

2.1. Description of Used Data and Variables

Khoury [1] and Khoury and Zaman [11] used cementitious materials to stabilize four base aggregates—Meridian limestone with 97% of CaCO3, Richard Spur limestone with 87% of CaCO3, Sawyer sandstone with 94% of SiO2, and Rhyolite—which were subjected to W-D cycles, and then tested for Mr. Mr samples were cured for 28 days in a control room after compaction at optimum moisture content and maximum dry density. Then, cured samples were subjected to 8, 16, and 30 W-D cycles. More details for test stress states and data are presented in [1,4,10,11].
Khoury [1] and Khoury and Zaman [11] developed a regression model (Mr = f (W-D, CSAFR, DMR,   σ 3 , σ d )) that correlated the resilient modulus Mr with five parameters: W-D, CSAFR, DMR, σ 3 and σ d . The sensitivity of the input variables for predicting Mr was studied by Maalouf et al. [4]. They used least square (LS) and SVR methods to study the effectiveness of the input variables at predicting Mr. Based on their results, the five input variables improved the predicted values of Mr significantly, given that the values of r2 for the LS and SVR methods were 0.69 and 0.97, respectively, while the r2 values for predicting Mr using only three or four input variables were within the range of 0.65~0.68 and 0.90~0.96 for the LS and SVR methods, respectively. Thus, five input variables (W-D, CSAFR, DMR, σ 3 and σ d ) were adopted in this study. These input variables, and Mr as the output variable, were employed to design the PSO-ELM model and to compare it with the PSO-ANN and KELM models.
A total of 704 experimentally conducted Mr tests were used, and these were divided into training (70%) and testing (30%) datasets, as presented in the Supplementary Materials. Table 1 shows the statistical evaluation of the training and testing stages. In Table 1, the terms mean, median, min, max, SD, SK and KU indicate the mean, median, minimum, maximum, standard deviation, skewness, and kurtosis coefficients, respectively. It can be seen from the table that for the whole dataset, the minimum and maximum of W-D were 0 and 30 cycles, respectively. The minimum and maximum of the ratio of oxide compounds in the cementitious materials (CSAFR) were 0.11 and 0.51%, respectively. The minimum and maximum of the ratio of maximum dry density to the optimum moister content (DMR) were 2.34 and 4.63% kN/m3. The maximum and minimum values of σ 3 and σ d for the whole dataset were 138, and 0.00 kPa; and 277 and 69 kPa, respectively. In addition, the correlation coefficient between the input variables and Mr was calculated. The correlation between Mr and W-D was −0.29, and between Mr and CSAFR was 0.46. Moreover, the correlations between Mr and DMR, σ 3 , and   σ d were 0.71, 0.08, and 0.14, respectively. In summary, inverse correlation was yielded with W-D, whereas high correlation was observed with DMR. Mr had the greatest kurtosis and positive skewness. All data were skewed distributions, and were not normal distributions, since they had considerably high skewness values.

2.2. Theoretical Backgrounds and Model Development

2.2.1. PSO

Particle swarm optimization (PSO) is defined as a stochastic optimization technique introduced and developed by Eberhart and Kennedy [26]. The general description and application of this method are presented in [27,28,29]. A summary of this method can be presented in six steps as follows [28,30]:
Step 1: a population of random potential solution is designed as a searching space. Suppose D and N are the dimensions of the searching space and the number of particles, respectively. Each potential solution is assigned a random “position” ( x i k ) and “velocity” ( ν i k ) of the ith particle at iteration k. These particles are then “flown” through the search space of potential solutions as follows:
v i k ( t + 1 ) = w v i k ( t ) + c 1 . r a n d ( ) ( p i k ( t ) x i k ( t ) ) + c 2 . r a n d ( ) ( g i k ( t ) x i k ( t ) )
x i k ( t + 1 ) = x i k ( t ) + v i k ( t + 1 )   1 i N ,   1 k D
where w represents the iteration weight; c1 and c2 stand for the different acceleration coefficients. “rand ()” denotes a constant value in the interval [0, 1] and is set randomly. p i k and g i k are the best position of the ith particle in the search stage, and the global best position found in the population, respectively.
Step 2: Evaluate the fitness of each particle in the swarm. Step 3: For every iteration, compare each particle’s fitness with its previous best obtained fitness ( p i k ). If the current value is better than p i k , then set p i k to be equal to the current value and the p i k location to be equal to the current location in the d-dimensional space. Step 4: Compare the p i k of particles with each other and update the swarm global best location with the greatest fitness ( g i k ). Step 5: The velocity of each particle is changed (accelerated) towards its p i k and g i k . This acceleration is weighted by a random term. A new position in the solution space is calculated for each particle by adding the new velocity value to each component of the particle’s position vector. Step 6: Repeat steps (2)–(5) until convergence is reached based on the desired criteria. The rudimentary structure of the PSO algorithm is shown in Algorithm 1.
Algorithm 1: The PSO algorithm for optimization problem of d-dimensional decision variables.
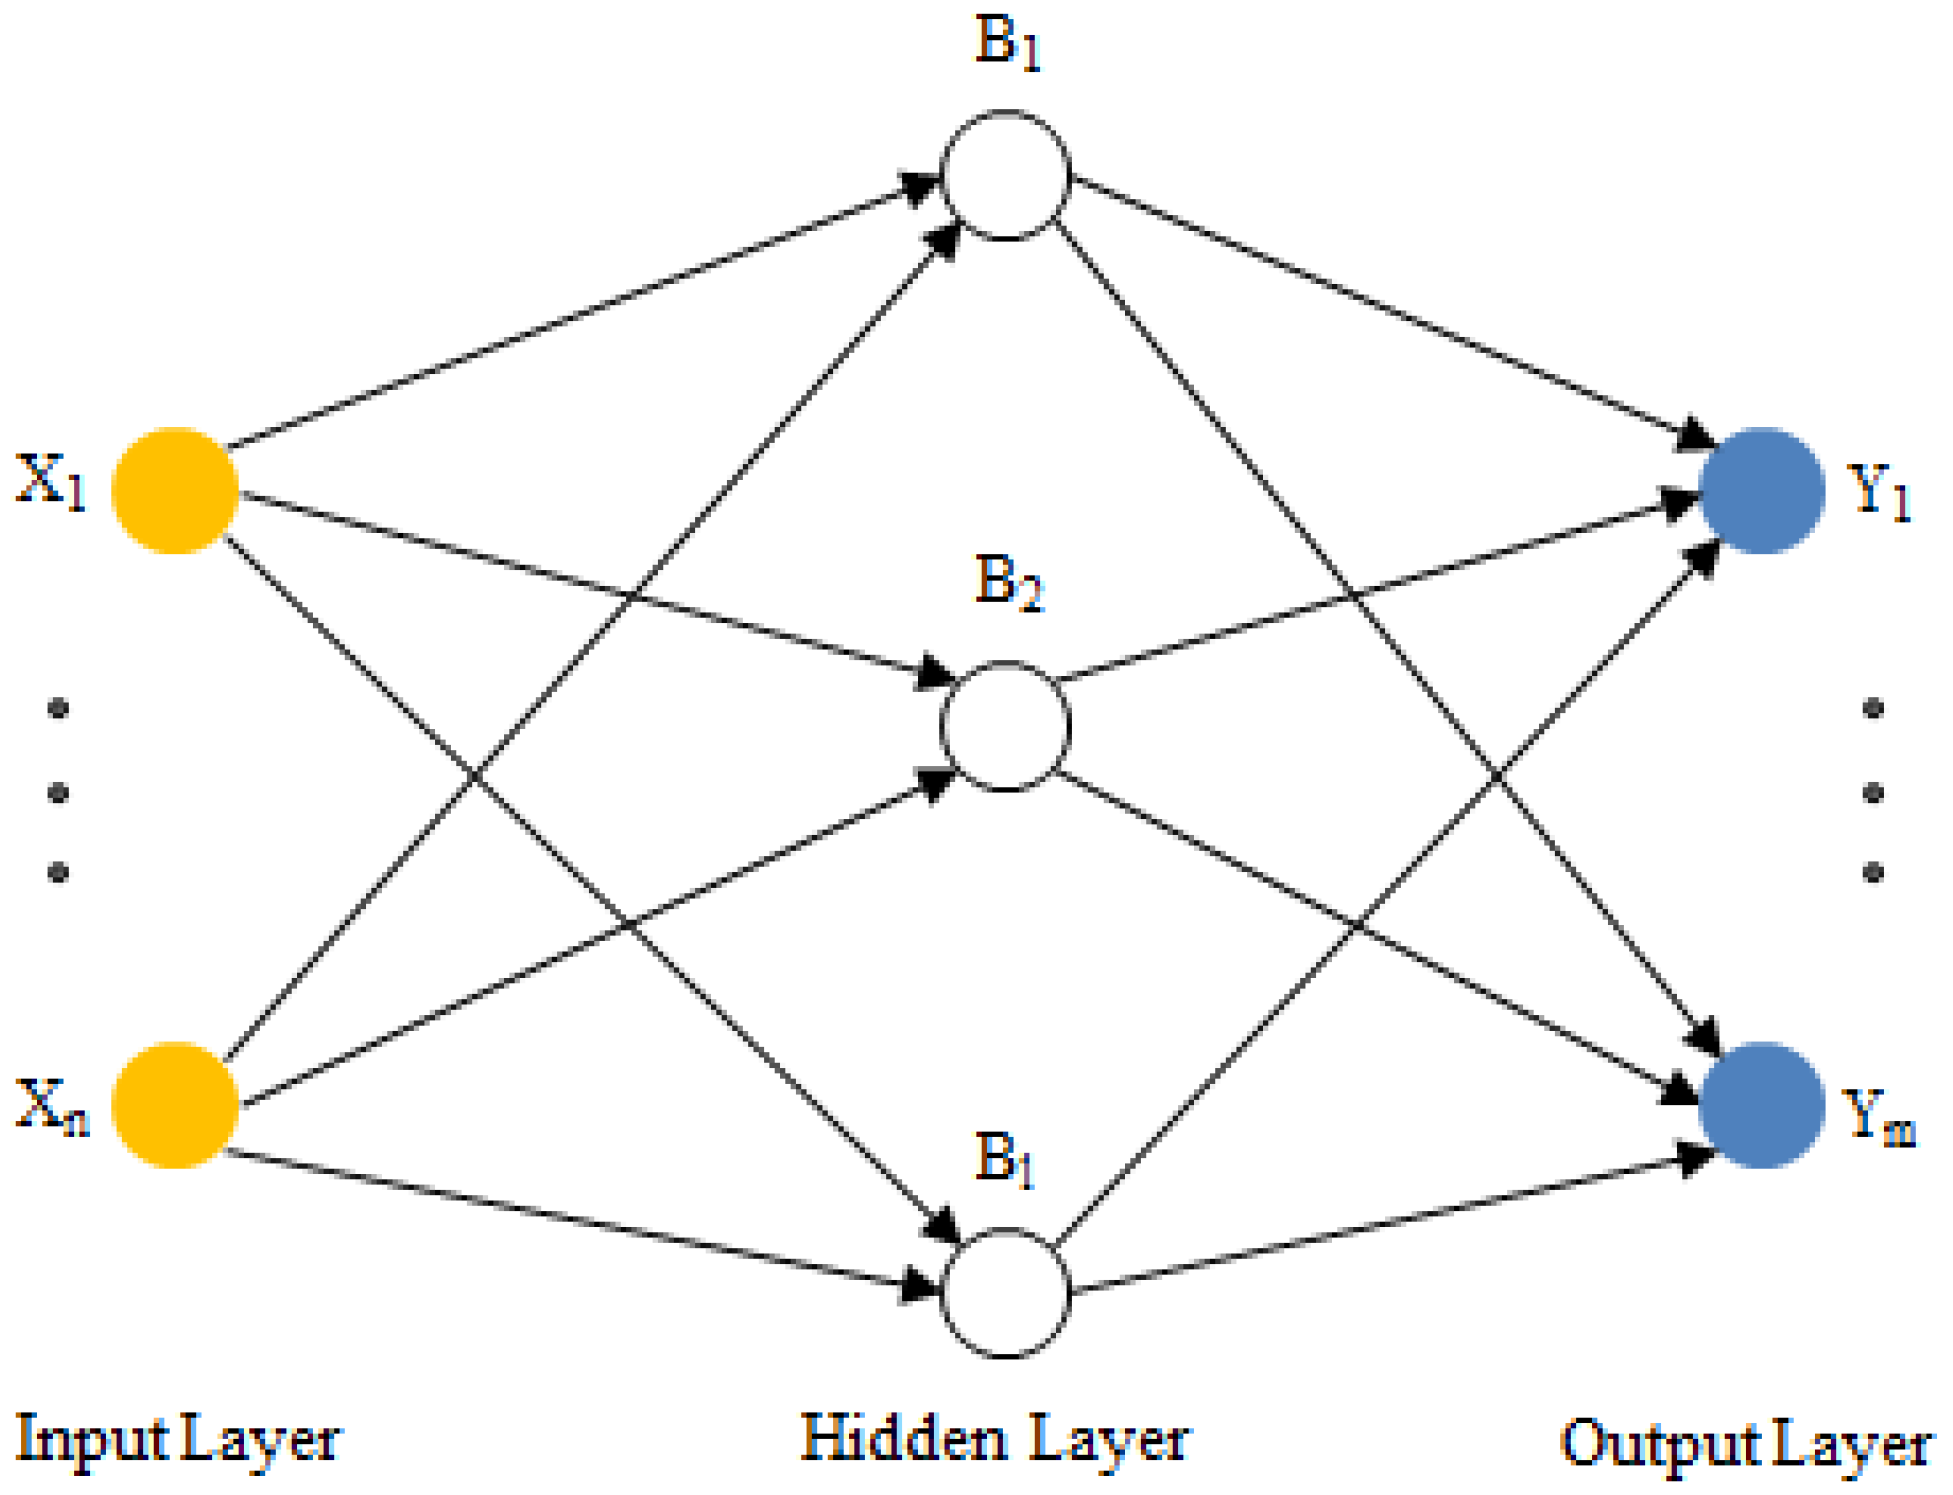
  • Initialize P number of particles with some random position;
  • Evaluate the fitness function of particles;
  • gbest = global best solution;
  • For l = 1 to maximum number of iterations do
  • For j = 1 to Pdo
  •   Update the velocity and position for the jth particle using Equations (1) and (2), respectively;
  •   Evaluate the fitness function of jth particle;
  •   Update the personal best (pbest) of jth particle;
  •   Update the gbest;
  •   Keep gbest as the best problem solution;
  • End for
  • End for

2.2.2. ANN

ANNs are successfully utilized to predict different cases in pavement applications [13,15,31,32]. Their capability to recognize complex nonlinear performances among input and output datasets can be considered to be their key benefit. Detailed and in-depth state-of-the-art reports on the concepts, theory and civil engineering applications of ANN can be found in [31,32,33,34]. In general, ANN possesses three layers: input, hidden, and output. The hidden layer includes neurons linked between the input and output layers by nonlinear or linear transfer functions. The weighted input from a previous layer is received and treated by each hidden layer node, whose output is then delivered to the nodes in the following layers (hidden/output) through a transfer function. In this study, the PSO was used to optimize the network weights and biases. The data were typically scaled to lie in a fixed range of 0 to 1, as the hidden layer activation function was a sigmoid. Determination of a suitable architecture for a neural network for a definite problem is an imperative factor, as the network topology affects directly the complexity of the computations. Figure 1 shows a single hidden layer of ANN.

2.2.3. ELM

An Extreme Learning Machine (ELM) can be described as a least square-based single hidden layer feed-forward neural network (SLFN) for both classification and regression problems [24]. Huang et al. [35] replaced the hidden layer with large number of nodes with a kernel function in the design of an ELM. Pal and Deswal [24] and Huang et al. [35] both proposed techniques, and the following is a summary of those methods:
ELM for training data, N, hidden neurons, H, and activation function f(x) can be represented as follows:
e j = i = 1 H α i f ( w i , c i , x j )   j = 1 N
where w i and α i are the weight vectors of the connecting inputs–hidden layers (input weights), and hidden–outputs layers, respectively. xj represents the input variables. Ci is the hidden bias of the ith hidden neuron, and e j is the output from ELM for the data points, j. The input weights are randomly generated and are based on a continuous probability distribution [24].
The output weights are calculated using a linear equation (Equation (4)), which can be simplified as follows:
β = A Y
where A is the output matrix of the hidden layer (Equation (5)), A represents the Moore-Penrose generalized inverse of A, and Y represents the target values of ELM. Equation (4) can be rewritten in a compact form as A α = Y , where A is the hidden layer output matrix of the neural network, and Y is the output variable vectors. The three matrices in the compact form can be presented as follows:
A = [ h ( x 1 ) : h ( x N ) ] = [ f ( w 1 , c 1 , x 1 ) .. f ( w H , c H , x 1 ) : .. : f ( w 1 , c 1 , x j ) .. f ( w H , c H , x j ) ] ,       α = [ α 1 T : α H T ] ,   a n d   Y = [ y 1 T : y N T ]
where h ( x ) is the hidden layer feature mapping.
The output of the ELM algorithm is mainly based on matrix A. In the case of using the traditional solution, the neural network is used in the hidden layer, and matrix A can be solved using gradient-based algorithm optimization as presented in [24]. Otherwise, the kernel function ( k ( x i , x j ) ) is used to solve the ELM, and feature mapping can be used to calculate the kernel matrix as follows [5,24,35]:
k ( x i , x j ) = h ( x i ) . h ( x j )
In this study, KELM was applied to study the effect of the kernel on the Mr prediction, and ELM was integrated with PSO to design a new model for Mr prediction of stabilized base aggregates. The ELM has a faster learning rate, better generalization ability, and better predictive performance than traditional neural connections. Basic ELM randomly produces the values of input weights and hidden biases, and determines the weights of the output layer using the Moore-Penrose generalized inverse method [36,37]. Figure 2 shows the SLFN with a number of input layer neurons ‘n’, a number of hidden layer neurons, and a number of output layer neurons ‘m’. For example, if the training dataset is {Xi, Yi}, then the input dataset is Xi = [Xi1, Xi2, …, Xin], and the output dataset is Yi = [Yi1, Yi2, …, Yim] and i = 1, 2, …, n. m is the number of training samples.

2.2.4. Hybridization (PSO-ANN, PSO-ELM)

Huang et al. [38] showed a theory-based proof of the ability of ELM to perform as a universal approximator and can use several activation functions. ELM is extensively applied in the prediction task due to its fast learning capability, and adequate generalization performance [39,40]. The combination of ELM with other techniques can enhance the generalization ability of ELM [41,42,43]. Some researchers have successfully used nature-inspired algorithms to optimize ELM. Mohapatra et al. [44] developed hybrid combination of cuckoo search and ELM to classify medical data. Satapathy et al. [45] utilized a firefly algorithm to optimize ELM and to be applied in the stability analysis of photovoltaic interactive microgrid. The whale optimization algorithm was used to optimize ELM and was utilized for aging degree evaluation of insulated gate bipolar transistor [46]. The experimental results showed that optimized ELM gave good prediction accuracy compared to singleton ELM.
Generally, due to the stochastic initialization of the network input weights and hidden biases in the basic ELM, ELM solution models can easily fall into local minima [36]. Therefore, this research paper utilized PSO to optimize the parameter set (input weights and hidden biases) of ELM to achieve better learning ability of ELM. According to literature studies, PSO with a combination of ELM models has been considered and developed in many areas with high reliability [47,48,49]; however, they have still not been considered and prepared for predicting Mr values. The development of the hybrid PSO-ELM was used to design a prediction model for Mr, which was compared with the hybrid PSO-ANN [23] and KELM [22] to assess the performance of the designed model. Algorithm 2 describes the PSO-ELM model process. In PSO-ANN, all the parameters of the single hidden layer of ANN (input weights, hidden biases, hidden-output weights, and output neuron bias) were tuned using PSO.
Algorithm 2: The algorithmic flow of PSO-ELM.
  • Obtain the training and testing dataset
  • Begin ELM train
  •  Set ELM parameters
  •  Set mean square error (MSE) as a fitness function
  •  Initialize PSO population (P)
  •  Calculate the fitness value of each candidate solution
  •  S=global best solution
  • For it = 1 to maximum iteration number do
  •   For i = 1 to P do
  •    Update the velocity and position of the ith particle
  •    Evaluate the fitness of the ith particle
  •    Update personal best solution of the ith particle
  •    S=current global best solution
  •   End for
  • End for
  • End
  • Obtain the optimal input weights and hidden biases of hidden layer neurons using S
  • ELM test

2.2.5. Model Development and Performance Assessment

The training dataset contains five input neurons as predictors. Initially, the ELM model was configured by the matrix of input weights and hidden biases. The output weight matrix was calculated from the input weights and biases using the basic ELM algorithm. Since the performance of the ELM is based on the number of neurons in the hidden layer and number of training epoch, a trial was conducted with 100 epochs between the number of hidden units in the single hidden layer versus the Root Mean Square Error (RMSE) to determine the best number of hidden neurons. The final structure of the developed optimized ELM model was obtained as 5 input neurons, 150 hidden neurons, and output neurons based on the number of training samples. The PSO algorithm was used to find the optimal values of the input weights matrix (5 × 150) and bias matrix (150 × m) based on the minimal RMSE value. The number of decision variables for the PSO population was determined from the ELM learning parameters, which was set as 900 (5 × 150 + 150). These learning parameters were optimized during the training phase to obtain the optimal input weights and hidden biases. The PSO is influenced by its intrinsic parameters, such as the number of populations, acceleration coefficients, and inertia weight. After some initial trials, the swarm size was set as 30, C1 = 1, C2 = 2, and inertia weight = 0.9 for both PSO-ELM and PSO-ANN. In addition, the KELM (RBF-ELM) model was trained using the radial basis function (RBF) as the activation function, in which users do not need to know the number of hidden units, and the hidden layer feature mapping is not required to be known by the user [50].
Maalouf et al. [4] evaluated the normalized and non-normalized data for predicting Mr, and they found that the SVR model outperformed the LS method for the normalized data. Herein, the whole dataset was initially normalized and back transformed to obtain original values after prediction. T normalization of the data ( C n ) can be performed using the following equation:
C n = ( C C m i n ) ( C m a x C m i n )
where C, C m a x , and C m i n represent the data value, maximum of used data, and minimum of used data, respectively.
To assess the model performance of the developed models, goodness of fit statistics such as r2, RMSE, and mean absolute error (MAE) were used. The corresponding fitness indices were represented by Equations (8)–(10).
r 2 = ( i = 1 l ( M r E i M r E ¯ i ) ( M r O i M r O ¯ i ) i = 1 l ( M r E i M r E ¯ i ) 2 i = 1 n ( M r O i M r O ¯ i ) 2 ) 2
R M S E = i = 1 l ( M r E i M r O i ) 2 l
M A E = 1 l i = 1 l | M r O i + M r E i |
where M r E i denotes the i t h predicted resilient moduli of stabilized base aggregates; M r O i represents the i t h observed resilient moduli of stabilized base aggregates; M r E ¯ i is the average of the predicted resilient moduli of the stabilized base aggregates; M r O ¯ i is the average of the observed resilient moduli of the stabilized base aggregates; and l is the number of observations.

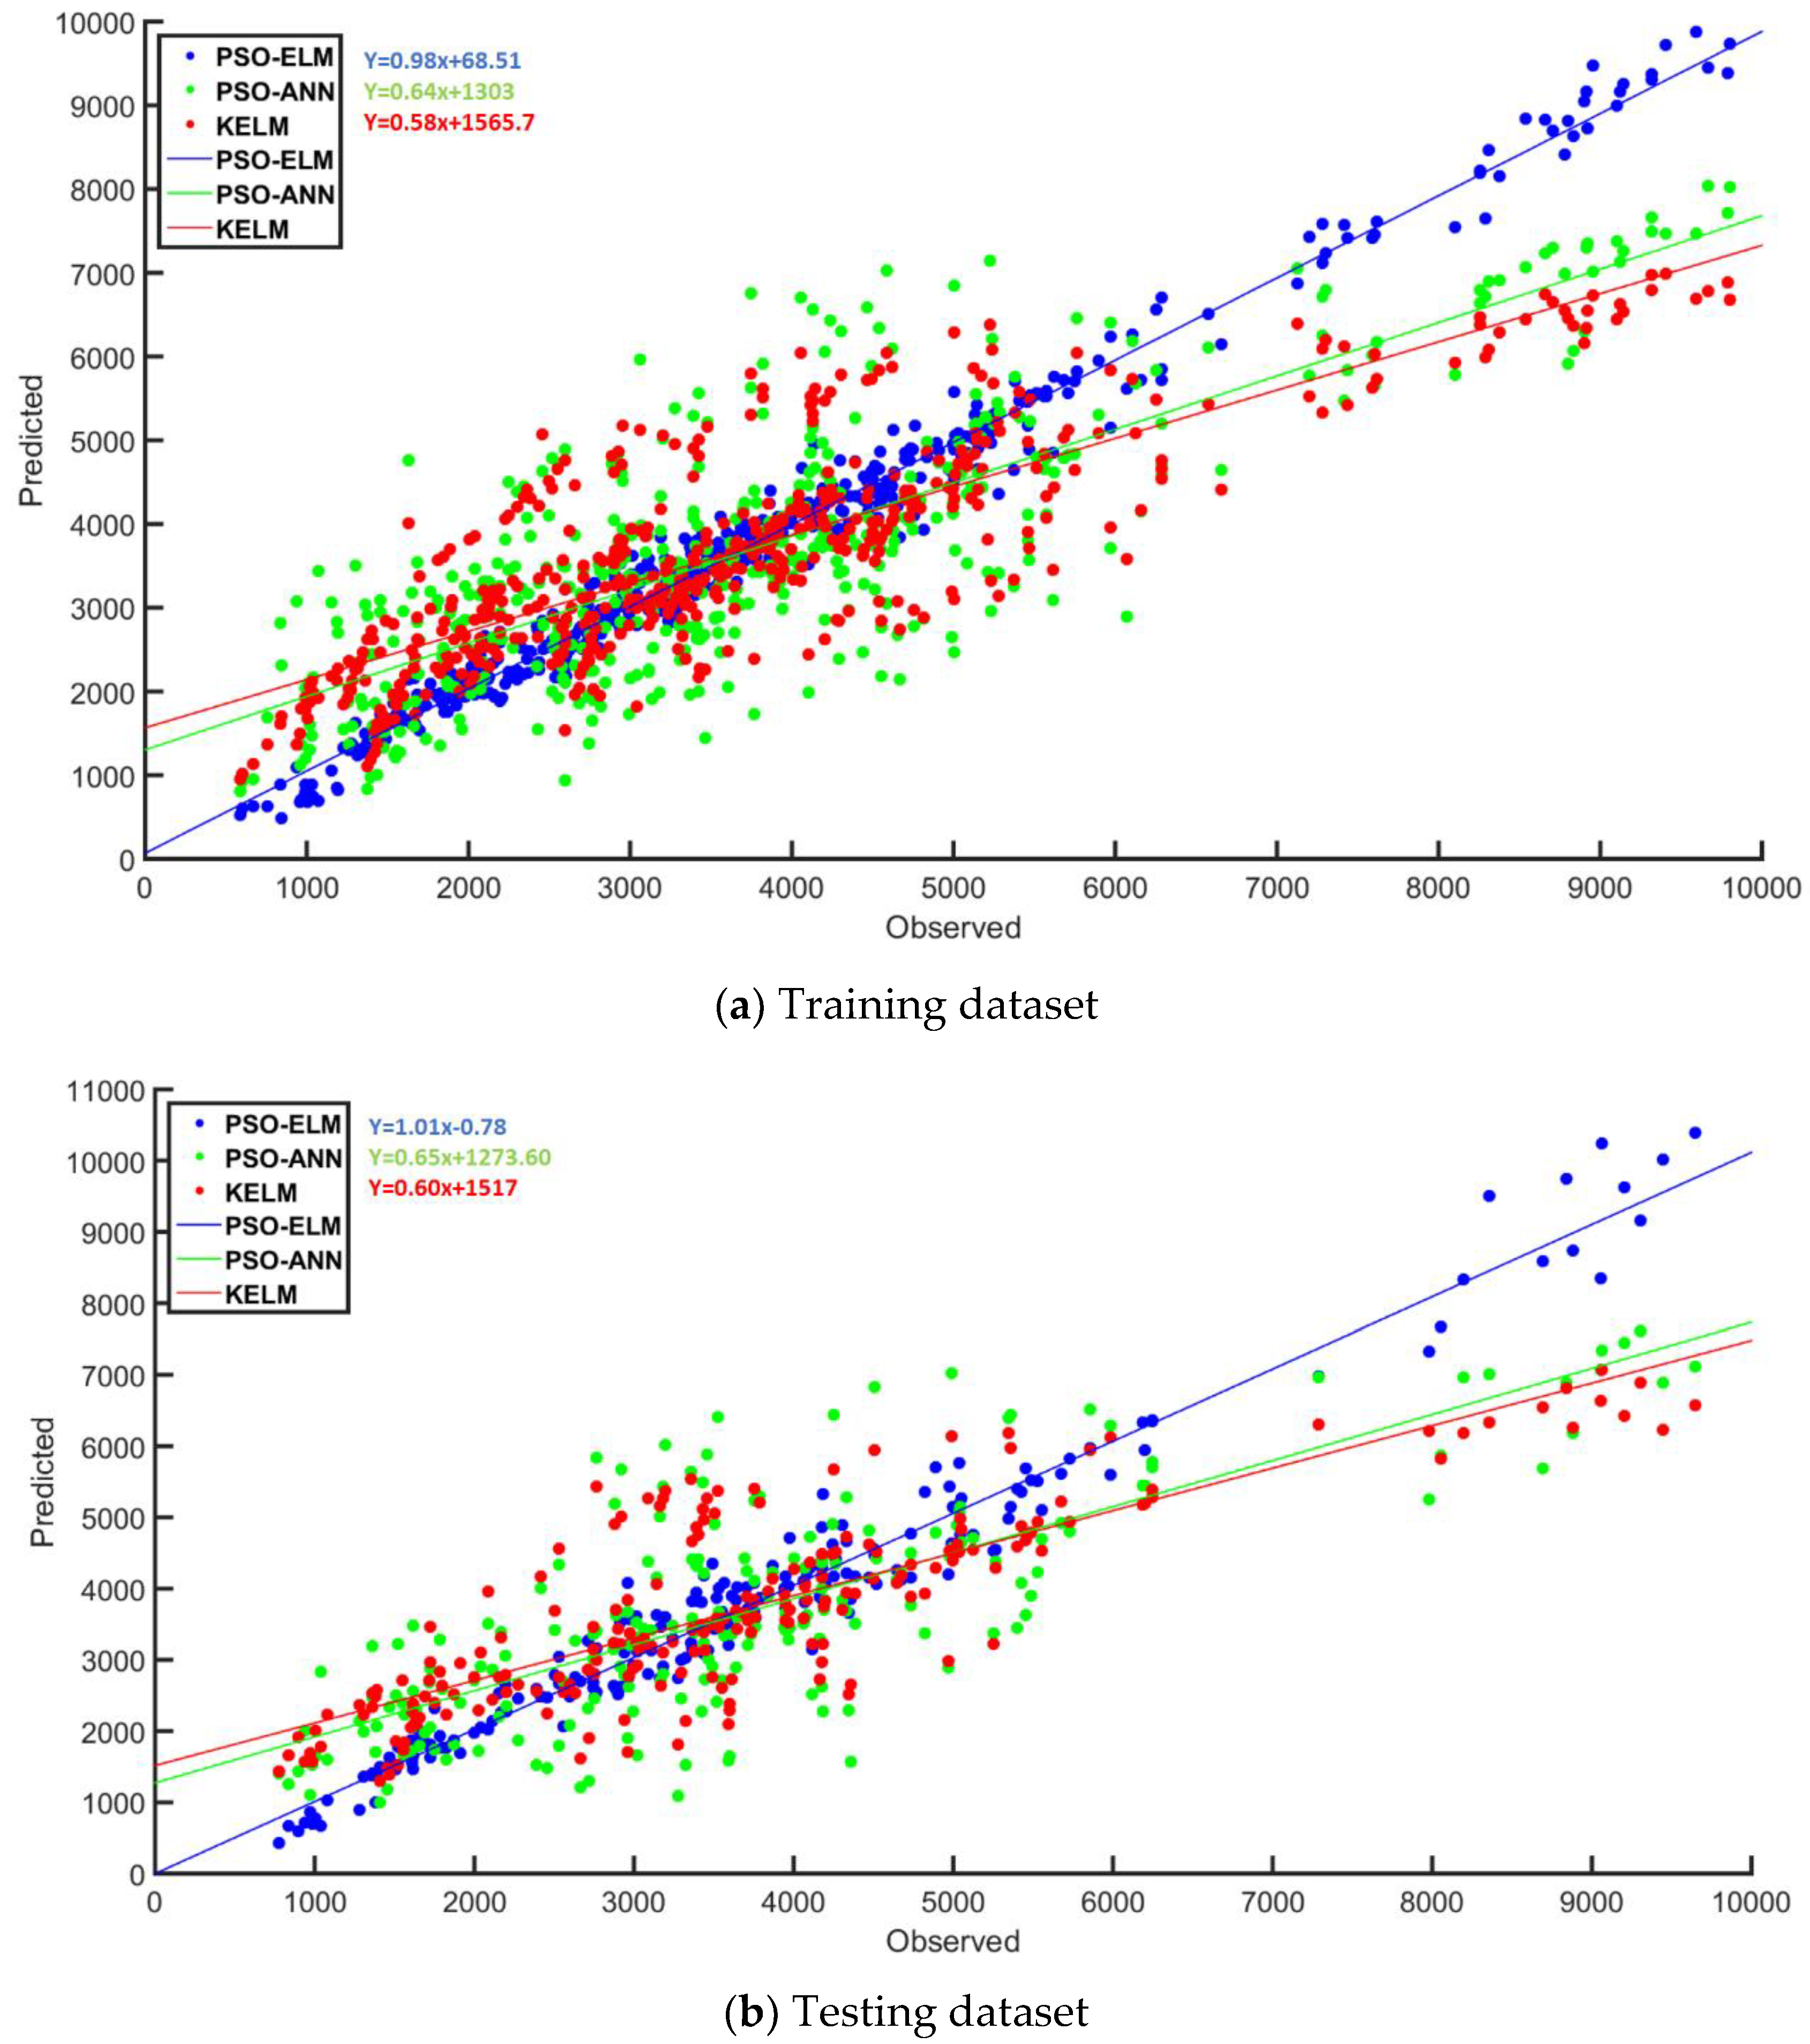
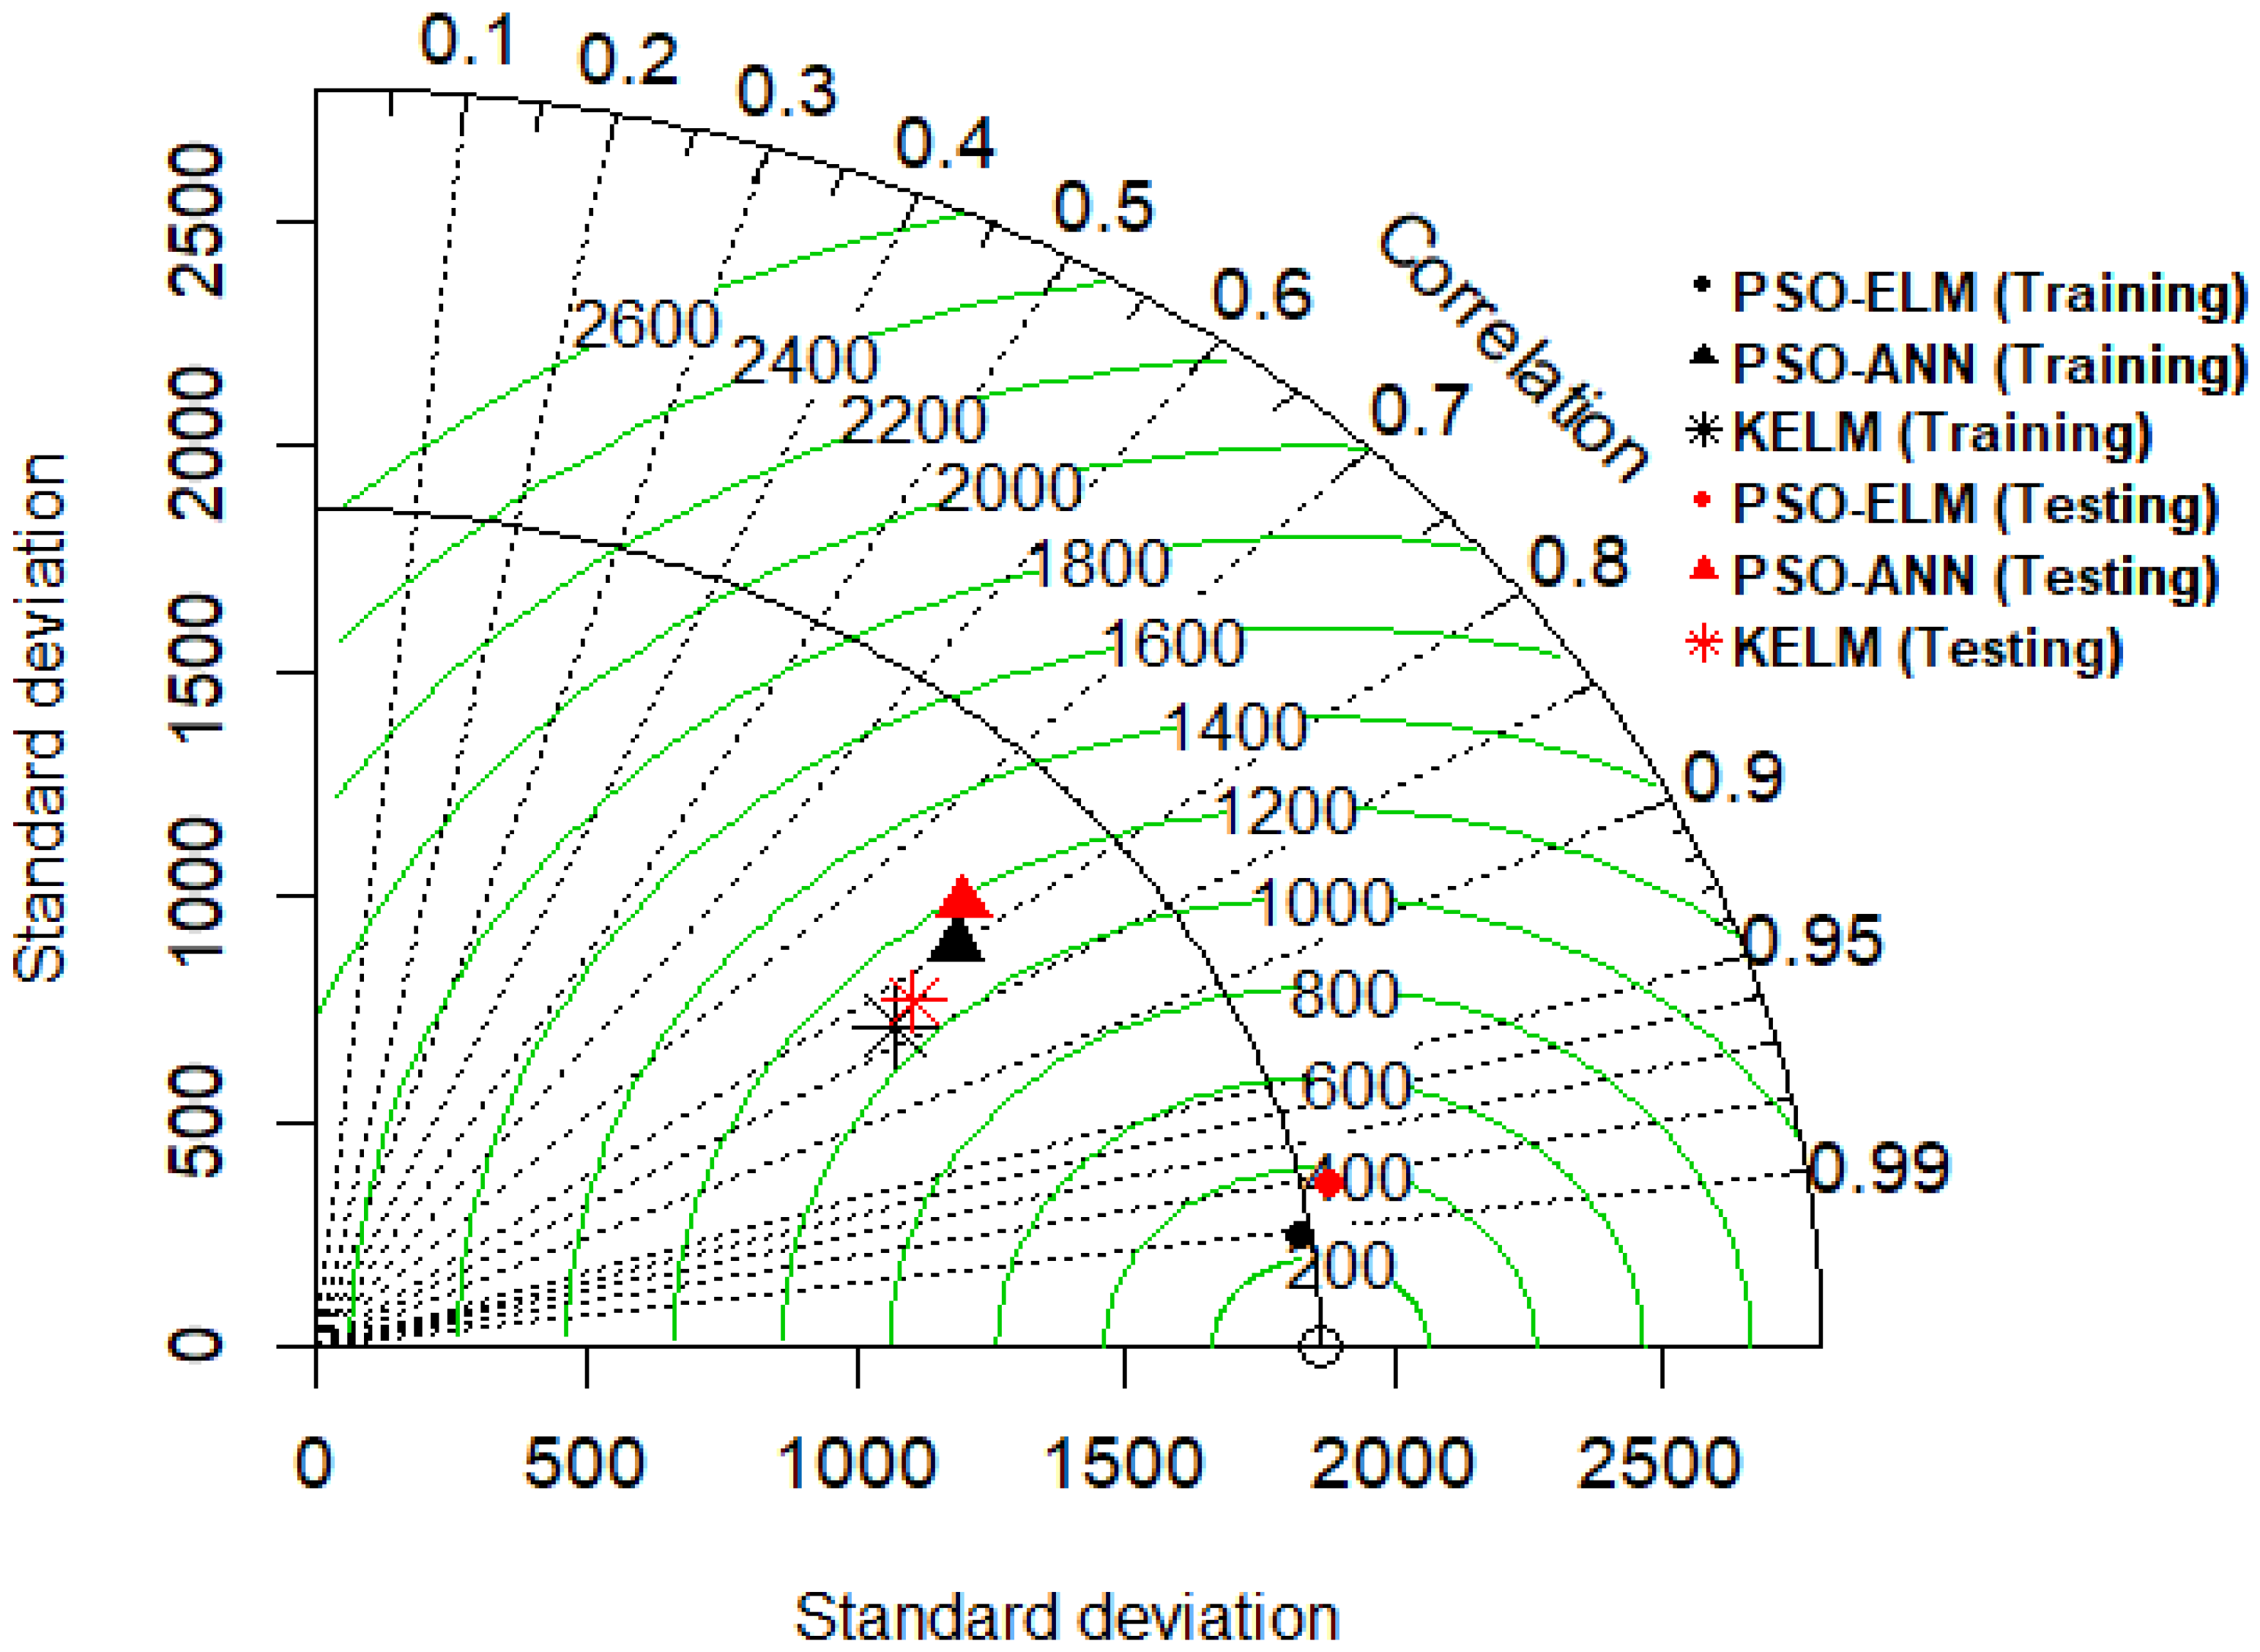
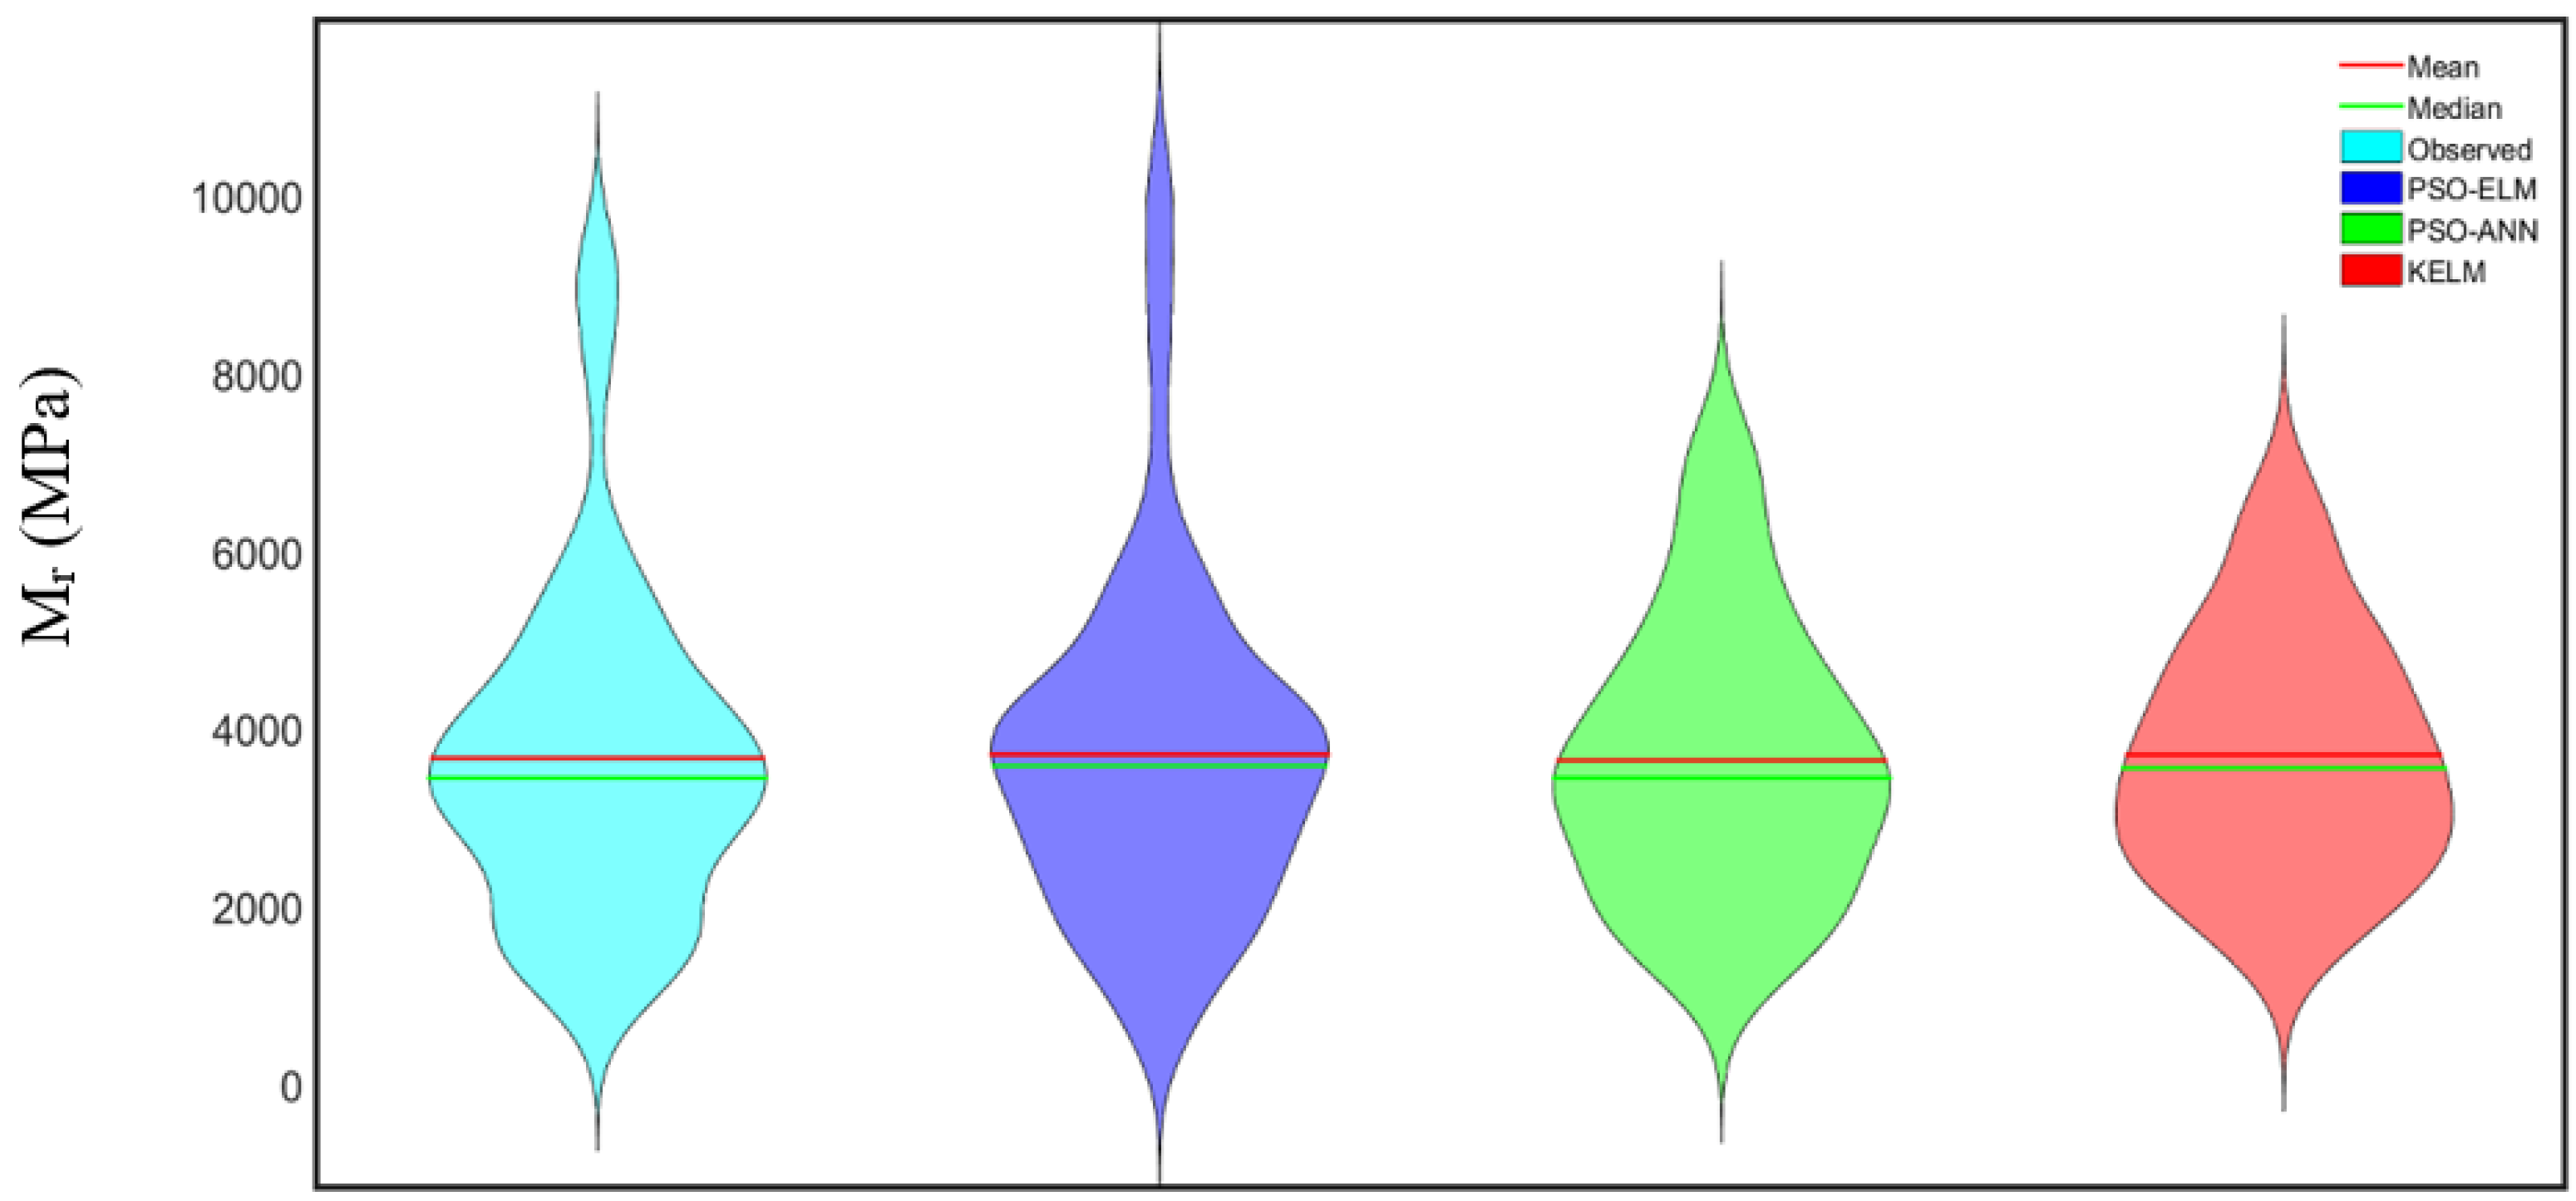
3. Results and Discussion

To check the performance of the developed PSO-ELM model, two well-known soft computing models (PSO-ANN, and KELM) were also tested for comparison and performance validation. Table 2 shows the goodness of fit measures of the investigated three models. It is evident from the table that the PSO-ELM model was superior in prediction accuracy to the other two models, PSO-ANN and KELM. During the training phase, the highest r2 was observed for PSO-ELM (r2 = 0.981) followed by KELM (r2 = 0.693) and PSO-ANN (r2 = 0.64). Meanwhile, during the testing phase, the prediction accuracy was slightly lower than that obtained during training phase for all of the investigated models. In terms of RMSE, a lower value of RMSE was observed for PSO-ELM (RMSE = 369.592) when compared to KELM (RMSE = 1075.378) and PSO-ANN (RMSE = 1184.155).
Figure 3 shows the relationship between the observed and predicted resilient moduli for the investigated three models. The slopes of linear fitting of the PSO-ELM model were 0.98 and 1.01 for the training and testing stages, respectively. Comparison between the linear fitting slopes of the investigated three models shows that the slope of the linear fitting of data for the PSO-ELM model was closer to unity than that of the other models, indicating lower bias. It is evident from both Table 2 and Figure 3 that the PSO-ELM model showed the best fit of the Mr data along the equality line among the three models during both the training (Figure 3a) and testing (Figure 3b) phases. In addition, in order to study the influence of input variables on predicting Mr values, four different models with changing input variables were built and studied in the training stage, as presented in Table 3. Little significant effect was observed on the prediction of Mr as a result of changing the input variables, indicating that all input variables could be considered when modelling Mr. The influence of correlation between Mr and input variables depends on the variation in the used data, test protocol stress states, material type, and sample preparation and conditioning.
For better representation, a mathematical graphical Taylor diagram was also plotted, as seen in Figure 4, using R software [51]. It evaluates the degree of correspondence between the observed and predicted Mr values in terms of the r2, standard deviation, and RMSE in a single plot [52]. From Figure 4, it can be seen that the developed model (PSO-ELM) had the highest prediction accuracy by a significant margin, when compared with the other investigated models. Furthermore, a new generation violin plot was also drawn, as can be seen in Figure 5, in order to understand the model prediction distribution behavior or variation over the predicted Mr data. This violin plot is a hybrid of a box plot and a kernel density plot, which shows the multimodal distribution and peaks in the data. The figure contains the violin plot of the observed and predicted Mr values of the three investigated models during the testing phase. It is obvious that the PSO-ELM model is the model with the best distribution and harmonization of predicted Mr values to observed Mr data, when compared with the other two investigated models (PSO-ANN and KELM). The Mr values predicted by these models are concentrated more towards the mean and median of the dataset. This analysis indicates that the PSO-ELM model has good generalization capability for the Mr prediction of stabilized base aggregates under W-D cycles. Therefore, based on the above analysis, it can be concluded that the PSO-ELM model can be used as a reliable soft computing technique for predicting precise Mr values for the used Mr data.

4. Concluding Remarks

This study developed a new reliable advanced soft computing technique, PSO-ELM, for the prediction of Mr values for stabilized base aggregates under W-D conditioning. Two other computing models, PSO-ANN and KELM, were also investigated in this research to validate and assess the performance of the developed PSO-ELM model. Based on the goodness of fit criteria, the PSO-ELM model is highly suitable for implementation in predicting the Mr values of stabilized base aggregates subjected to W-D cycles. Moreover, the PSO-ELM showed the highest prediction accuracy, having r2 of 0.96 in the testing phase, with lower bias and higher precision than the other two models investigated, PSO-ANN and KELM. Moreover, the PSO-ELM model was the only model whose predicted Mr values agreed generally with the observed Mr values. Finally, based on the range of the tested data, the PSO-ELM can be used as a new reliable soft computing technique for predicting Mr values. A larger dataset is further required in order to validate the model performance using a cross-validation (i.e., 3-fold or 5-fold) procedure considering the computational complexity and time process.

Supplementary Materials

The following are available online at https://www.mdpi.com/2076-3417/9/16/3221/s1, Table S1: Training data; Table S2: Test dataset.

Author Contributions

M.R.K. and D.K. conceived and designed the research; M.R.K., D.K., A.R.G., and B.R. performed the computational implementation of the models and contributed with analyses; M.R.K., D.K., A.R.G. and B.R. wrote the paper, and M.R.K., D.K., P.S., A.R.G, J.W.H., X.J., and B.R. reviewed and revised the manuscript.

Funding

This research was supported by a grant (18TBIP-C144315-01) from Technology Business Innovation Program (TBIP) Program funded by Ministry of Land, Infrastructure and Transport of Korean government. This work was also supported by Research Assistance Program (2019) in the Incheon National University.

Acknowledgments

The authors would like to thank the Editors and reviewers for their instructive comments on the paper.

Conflicts of Interest

The authors declare no conflicts of interest.

References

  1. Khoury, N.N. Durability of Cementitiously Stabilized Aggregate Bases for Pavement Application. Ph.D. Thesis, University of Oklahoma, Norman, OK, USA, 2005. [Google Scholar]
  2. Halsted, G.E. Minimizing reflective cracking in cement-stabilized pavement bases. In Proceedings of the 2010 Annual Conference of the Transportation Association of Canada, Halifax, NS, Canada, 26–29 September 2010. [Google Scholar]
  3. AASHTO. Mechanistic-Empirical Pavement Design Guide: A Manual of Practice; American Association of Highways and Transportation Officials: Washington, DC, USA, 2008. [Google Scholar]
  4. Maalouf, M.; Khoury, N.; Laguros, J.G.; Kumin, H. Support vector regression to predict the performance of stabilized aggregate bases subject to wet–dry cycles. Int. J. Numer. Anal. Methods Geomech. 2012, 36, 675–696. [Google Scholar] [CrossRef]
  5. Naji, K. Resilient modulus–moisture content relationships for pavement engineering applications. Int. J. Pavement Eng. 2018, 19, 651–660. [Google Scholar] [CrossRef]
  6. Mousa, R.; Gabr, A.; Arab, M.; Azam, A.; El-Badawy, S. Resilient modulus for unbound granular materials and subgrade soils in Egypt. In Proceedings of the International Conference on Advances in Sustainable Construction Materials & Civil. Engineering Systems, Sharjah, UAE, 18–20 April 2017; p. 06009. [Google Scholar] [CrossRef]
  7. Solanki, P.; Zaman, M. Effect of wet-dry cycling on the mechanical properties of stabilized subgrade soils. In Proceedings of the Geo-Congress 2014, Atlanta, GA, USA, 23–26 February 2014; pp. 3625–3634. [Google Scholar]
  8. AASHTO T-307. Standard Method of Test for Determining the Resilient Modulus of Soil and Aggregate Materials; AASHTO: Washington, DC, USA, 2017. [Google Scholar]
  9. Arisha, A.; Gabr, A.; El-badawy, S.; Shwally, S. Performance evaluation of construction and demolition waste materials for pavement construction in Egypt. J. Mater. Civ. Eng. 2018, 30, 04017270. [Google Scholar] [CrossRef]
  10. Khoury, N.; Zaman, M.; Laguros, J. Behavior of stabilized aggregate bases subjected to cyclic loading and wet-dry cycles. In Proceedings of the Geo-Frontiers Congress 2005, Austin, TX, USA, 24–26 January 2005. [Google Scholar] [CrossRef]
  11. Khoury, N.; Zaman, M.M. Durability of stabilized base courses subjected to wet-dry cycles. Int. J. Pavement Eng. 2007, 8, 265–276. [Google Scholar] [CrossRef]
  12. Reza, A.; Rahrovan, M. Application of artifitial neural network to predict the resilient modulus of stabilized base subjected to wet dry cycles. Comput. Mater. Civ. Eng. 2016, 1, 37–47. [Google Scholar]
  13. Arisha, A. Evaluation of Recycled Clay Masonry Blends in Pavement Construction. Master’s Thesis, Public Works Engineering Department, Mansoura University, Mansoura, Egypt, 2017. [Google Scholar]
  14. Zaman, M.; Solanki, P.; Ebrahimi, A.; White, L. Neural network modeling of resilient modulus using routine subgrade soil properties. Int. J. Geomech. 2010, 10, 1–12. [Google Scholar] [CrossRef]
  15. Kim, S.; Yang, J.; Jeong, J. Prediction of subgrade resilient modulus using artificial neural network. KSCE J. Civ. Eng. 2014, 18, 1372–1379. [Google Scholar] [CrossRef]
  16. Nazzal, M.D.; Tatari, O. Evaluating the use of neural networks and genetic algorithms for prediction of subgrade resilient modulus. Int. J. Pavement Eng. 2013, 14, 364–373. [Google Scholar] [CrossRef]
  17. Hanittinan, W. Resilient modulus prediction using neural network algorithms. Ph.D. Thesis, The Ohio State University, Columbus, OH, USA, 2007. [Google Scholar]
  18. Kaloop, M.; Gabr, A.; El-Badawy, S.; Arisha, A.; Shwally, S.; Hu, J. Predicting resilient modulus of recycled concrete and clay masonry blends for pavement applications using soft computing techniques. Front. Struct. Civ. Eng. 2019, in press. [Google Scholar] [CrossRef]
  19. Asteris, P.G.; Roussis, P.C.; Douvika, M.G. Feed-forward neural network prediction of the mechanical properties of sandcrete materials. Sensors 2017, 17, 1344. [Google Scholar] [CrossRef]
  20. Asteris, P.G.; Kolovos, K.G. Self-compacting concrete strength prediction using surrogate models. Neural Comput. Appl. 2019, 31, 409–424. [Google Scholar] [CrossRef]
  21. Chau, K. A review on the integration of artificial intelligence into coastal modeling. J. Environ. Manag. 2006, 80, 47–57. [Google Scholar] [CrossRef] [Green Version]
  22. Mohammadi, K.; Shamshirband, S.; Yee, P.L.; Petković, D.; Zamani, M.; Ch, S. Predicting the wind power density based upon extreme learning machine. Energy 2015, 86, 232–239. [Google Scholar] [CrossRef]
  23. Kiranyaz, S.; Pulkkinen, J.; Gabbouj, M. Multi-dimensional particle swarm optimization in dynamic environments. Expert Syst. Appl. 2011, 38, 2212–2223. [Google Scholar] [CrossRef]
  24. Pal, M.; Deswal, S. Extreme learning machine based modeling of resilient modulus of subgrade soils. Geotech. Geol. Eng. 2014, 32, 287–296. [Google Scholar] [CrossRef]
  25. Ghanizadeh, A.R.; Amlashi, A.T. Prediction of fine-grained soils resilient modulus using hybrid ANN-PSO, SVM-PSO and ANFIS-PSO methods. J. Transp. Eng. 2018, 9, 159–182. [Google Scholar]
  26. Eberhart, R.; Kennedy, J. A new optimizer using particle swarm theory. In Proceedings of the Sixth International Symposium on Micro Machine and Human Science, Nagoya, Japan, 4–6 October 1995; pp. 39–43. [Google Scholar]
  27. Wilson, P.; Mantooth, H.A. Model-based optimization techniques. In Model-Based Engineering for Complex Electronic Systems; Elsevier: Waltham, MA, USA, 2013; Chapter 10; pp. 347–367. [Google Scholar] [CrossRef]
  28. Sharaf, A.M.; El-Gammal, A.A.A. Novel AI-Based Soft Computing Applications in Motor Drives, 4th ed.; Elsevier Inc.: Amsterdam, The Netherlands, 2011. [Google Scholar]
  29. Han, F.; Yao, H.F.; Ling, Q.H. An improved evolutionary extreme learning machine based on particle swarm optimization. Neurocomputing 2013, 116, 87–93. [Google Scholar] [CrossRef]
  30. Guo, H.; Li, B.; Li, W.; Qiao, F.; Rong, X.; Li, Y. Local coupled extreme learning machine based on particle swarm optimization. Algorithms 2018, 11, 174. [Google Scholar] [CrossRef]
  31. Shafabakhsh, G.H.; Talebsafa, M. Artificial neural network modeling (ANN) for predicting rutting performance of nano-modified hot-mix asphalt mixtures containing steel slag aggregates. Constr. Build. Mater. 2015, 85, 136–143. [Google Scholar] [CrossRef]
  32. Yan, K.; You, L. Investigation of complex modulus of asphalt mastic by artificial neural networks. Indian J. Eng. Mater. Sci. 2014, 21, 445–450. [Google Scholar]
  33. Adeli, H. Neural networks in civil engineering: 1989–2000. Comput. Aided Civ. Infrastruct. Eng. 2001, 16, 126–142. [Google Scholar] [CrossRef]
  34. Asteris, P.G.; Kolovos, K.G.; Douvika, M.G.; Roinos, K. Prediction of self-compacting concrete strength using artificial neural networks. Eur. J. Environ. Civ. Eng. 2016, 20 (Suppl. 1), s102–s122. [Google Scholar] [CrossRef]
  35. Huang, G.B.; Zhou, H.; Ding, X.; Zhang, R. Extreme learning machine for regression and multiclass classification. IEEE Trans. Syst. Man. Cybern. Part B 2012, 42, 513–529. [Google Scholar] [CrossRef]
  36. Cao, J.; Lin, Z.; Huang, G.B. Self-adaptive evolutionary extreme learning machine. Neural Process. Lett. 2012, 36, 285–305. [Google Scholar] [CrossRef]
  37. Huang, G.B.; Zhu, Q.Y.; Siew, C.K. Extreme learning machine: Theory and applications. Neurocomputing 2006, 70, 489–501. [Google Scholar] [CrossRef]
  38. Huang, G.B.; Chen, L.; Siew, C.K. Universal approximation using incremental constructive feedforward networks with random hidden nodes. IEEE Trans. Neural Netw. 2006, 17, 879–892. [Google Scholar] [CrossRef]
  39. Cui, D.; Bin Huang, G.; Liu, T. ELM based smile detection using Distance Vector. Pattern Recognit. 2018, 79, 356–369. [Google Scholar] [CrossRef]
  40. Karami, H.; Karimi, S.; Bonakdari, H.; Shamshirband, S. Predicting discharge coefficient of triangular labyrinth weir using extreme learning machine, artificial neural network and genetic programming. Neural Comput. Appl. 2018, 29, 983–989. [Google Scholar] [CrossRef]
  41. Khosravi, V.; Ardejani, F.D.; Yousefi, S.; Aryafar, A. Monitoring soil lead and zinc contents via combination of spectroscopy with extreme learning machine and other data mining methods. Geoderma 2018, 123, 694–705. [Google Scholar] [CrossRef]
  42. Liu, H.; Mi, X.; Li, Y. An experimental investigation of three new hybrid wind speed forecasting models using multi-decomposing strategy and ELM algorithm. Renew. Energy 2018, 123, 694–705. [Google Scholar] [CrossRef]
  43. Zhu, H.; Tsang, E.C.C.; Zhu, J. Training an extreme learning machine by localized generalization error model. Soft Comput. 2018, 22, 3477–3485. [Google Scholar] [CrossRef]
  44. Mohapatra, P.; Chakravarty, S.; Dash, P.K. An improved cuckoo search based extreme learning machine for medical data classification. Swarm Evol. Comput. 2015, 24, 25–49. [Google Scholar] [CrossRef]
  45. Satapathy, P.; Dhar, S.; Dash, P.K. An evolutionary online sequential extreme learning machine for maximum power point tracking and control in multi-photovoltaic microgrid system. Renew. Energy Focus 2017, 21, 33–53. [Google Scholar] [CrossRef]
  46. Li, L.L.; Sun, J.; Tseng, M.L.; Li, Z.G. Extreme learning machine optimized by whale optimization algorithm using insulated gate bipolar transistor module aging degree evaluation. Expert Syst. Appl. 2019, 127, 58–67. [Google Scholar] [CrossRef]
  47. Liu, D.; Li, G.; Fu, Q.; Li, M.; Liu, C.; Faiz, M.A.; Khan, M.I.; Li, T.; Cui, S. Application of particle swarm optimization and extreme learning machine forecasting models for regional groundwater depth using nonlinear prediction models as preprocessor. J. Hydrol. Eng. 2018, 23, 04018052. [Google Scholar] [CrossRef]
  48. Chen, S.; Shang, Y.; Wu, M. Application of PSO-ELM in electronic system fault diagnosis. In Proceedings of the 2016 IEEE International Conference on Prognostics and Health Management (ICPHM), Ottawa, ON, Canada, 20–22 June 2016. [Google Scholar] [CrossRef]
  49. Sun, W.; Duan, M. Analysis and forecasting of the carbon price in China’s regional carbon markets based on fast ensemble empirical mode decomposition, phase space reconstruction, and an improved extreme learning machine. Energies 2019, 12, 277. [Google Scholar] [CrossRef]
  50. Huang, G.B.; Wang, D.H.; Lan, Y. Extreme learning machines: A survey. Int. J. Mach. Learn. Cybern. 2011, 2, 107–122. [Google Scholar] [CrossRef]
  51. Lemon, J.; Bolker, B.; Oom, S.; Klein, E.; Rowlingson, B.; Wickham, H.; Tyagi, A.; Eterradossi, O.; Grothendieck, G.; Toews, M.; et al. Package Plotrix: Various Plotting Functions. R Package Version 3.7–6. 2019. Available online: https://rdrr.io/cran/plotrix/ (accessed on 21 June 2019).
  52. Taylor, K.E. Summarizing multiple aspects of model performance in a single diagram. J. Geophys. Res. 2001, 106, 7183–7192. [Google Scholar] [CrossRef]
Figure 1. A single layer architecture of ANN.
Applsci 09 03221 g001
Figure 2. Single hidden layer feed-forward neural network called ELM.
Applsci 09 03221 g002
Figure 3. Scatter plot of the three investigated models: (a) training, (b) testing.
Applsci 09 03221 g003
Figure 4. Statistical Taylor diagram for comparative study of the three investigated models during training and testing phases.
Applsci 09 03221 g004
Figure 5. Violin testing plot for the three investigated models.
Applsci 09 03221 g005
Table 1. Statistical evaluation of training and testing datasets.
DatasetVariableMeanMedianMin.Max.SDSKKU
TrainingW-D12.578.000.0030.0011.19−1.130.49
CSAFR0.250.130.110.510.18−1.470.73
DMR3.263.372.344.630.71−0.940.39
σ369.3569.000.00138.0049.60−1.34−0.02
σd173.50208.0069.00277.0078.73−1.40−0.02
Mr3690.883422.00585.009803.001862.061.421.12
TestingW-D13.3216.000.0030.0011.10−1.190.35
CSAFR0.260.130.110.510.19−1.670.58
DMR3.283.372.344.630.73−1.070.34
σ371.9469.000.00138.0047.16−1.22−0.04
σd167.89138.0069.00277.0075.06−1.260.11
Mr3668.123443.00773.009644.001861.161.651.15
Table 2. Performance measures for the investigated models.
Modelr2RMSEMAE
PSO-ANN (Train)0.6401117.367881.90
PSO-ANN (Test)0.5971184.155929.18
KELM (Train)0.6921064.782804.90
KELM (Test)0.6741075.378815.94
PSO-ELM (Train)0.981253.439191.66
PSO-ELM (Test)0.963369.592280.00
Table 3. Input variable effect on the PSO-ELM model.
ModelInput Variablesr2RMSEMAE
1W-D, CSAFR, DMR, σ 3 and σ d 0.981253.439191.66
2W-D, CSAFR, DMR and σ 3 0.948415.554299.43
3W-D, CSAFR, DMR and σ d 0.973304.451204.98
4W-D, CSAFR and DMR0.921521.08378.71

