Featured Application
An economical and practical demand response system is implemented based on multi communication with the ability to undertake multi-time-scale electricity control tasks.
Abstract
Demand response (DR) is widely accepted as a feasible and potential solution to improve the operation of the power system. In this paper, an economical and practical DR system architecture based on internet and Internet of things (IoT) communication technologies is discussed to achieve wide-area DR control without using an expensive metering infrastructure. Multi agents are introduced with respective control strategies to implement multi-time-scale control in a power system. In order to support quick DR strategies, a novel smart terminal design for the proposed DR system is described with functions of local parameter detection and action. The practicality of the proposed system was validated on a developed hardware-in-loop co-simulation platform.
1. Introduction
The rapid increase of the scale of the power system, coupled with concerns about an energy crisis and environmental pollution, spurred the progressive application of new-generation and transmission elements, such as cross-regional ultra-high-voltage (UHV) transmission, concentrated or distributed renewable generating, electricity markets, and so on. In order to maintain the reliability and security of power system operation, control resources on the demand side are expected to make more important contributions to power system control. Therefore, demand response (DR) is absorbing more and more attention from researchers and utilities around the world [1,2].
The traditional DR system tends to be based on the advanced metering infrastructure (AMI) with good performances in accuracy, stability, and speed on load control, benefiting from the highly universal and centralized architecture and control strategies [2,3,4]. This routine is suitable in a modern and automated power system environment with adequate budget for construction and maintenance cost. However, for developing countries, there are two significant limitations of this routine: (1) considerable expense is expected to achieve DR through this routine, as massive updates and adjustments need to be applied in the communication infrastructure and physical infrastructure [3]; (2) loads are supposed to be well aggregated in the form of smarting buildings, central air conditioning, etc., which are accessible to DR appliances [2]. Unfortunately, the loads in developing countries are mostly heterogeneous and non-zoned with weak central management. Therefore, the purpose of our work is to find a justifiable approach to resolve the conflicts between the operation demands and economy constraints, while fully utilizing the existing communication facilities and attracting social funds, to establish a bidirectional, evolution-accessible, and highly adaptable DR system proven to be valuable and practicable [4,5].
Given that broadband internet connections already exist in fundamental power facilities and appreciable households in most countries, some researches followed an internet-based control approach to satisfy DR task requirements [4,5,6,7]. However, there are some limitations in these researches: (1) the coverage of the internet-based system is limited by internet access points (APs); (2) the system is mainly optimized for customer requirements, while there is a lack of consideration of the influences on the grid [6,7]. In this paper, the physical equilibrium of the grid is considered in the system architecture and control strategies to ensure system practicality.
Internet of things (IoT) technologies are expected to address the shortage of internet coverage. IoT retains the management ability of massive device access, with significantly lower power consumption and plug-and-play function [8,9,10]. Reference [8] reviewed the prospects and challenges of IoT in power system appliances, and concluded that the efficiency, reliability, flexibility, security, and sustainability of power systems could be highly improved by applying IoT. However, previous studies about IoT in power systems mainly concentrated on theorical or device-level problems, and the achievements and effectiveness were mainly limited to micro-grids [4,9,10].
This paper addresses these gaps by providing a multi-communication-based DR system integrating IoT and existing internet connections into a power system, to provide a lower implementation budget and operating energy cost. In addition, the multi-scale and multi-target characteristics of grids and customer tasks are considered through the deployment of agents and corresponding strategies. Specifically, a local check-and-action strategy is described in detail as a case of the proposed DR system providing short-time control for power system regulation. All the elements involved were implemented, including a smart terminal which could support the deployment and operation of the DR system. The practicality of the work of this paper was also verified in a laboratory environment.
This paper is organized as follows: Section 2 presents the overall architecture of the multi-communication DR system. The system roles and technical routes on the grid side and the customer side are discussed separately. The hardware design of the smart terminal developed for the DR system is described in Section 3. The scope of the proposed system is discussed in Section 4. In Section 5, a hardware-in-loop co-simulation platform is developed to test the performance and influence of the proposed DR system on the power system. Finally, Section 6 concludes the paper.
2. Architecture of the Multi-Communication-Based DR System
The framework of the proposed multi-communication-based DR system is shown in Figure 1. This system could provide a wide-scale load aggregation service via IoT and existing internet connections. With appropriate strategies, this system can undertake time- and target-varying tasks.
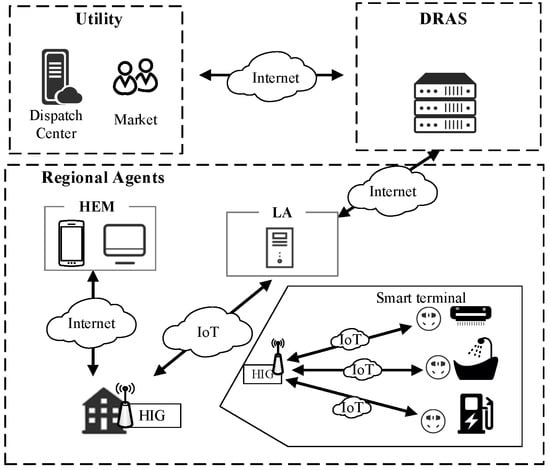
Figure 1.
The framework of the multi-communication demand response (DR) system.
To develop the proposed DR system, the following elements should be introduced into the existing power system:
(a) Grid side—electric utility platform (UP) and demand response automatic server (DRAS)
Electric utilities are the sponsors, owners, and benefit providers of the DR business. Therefore, the purpose of the UP is to call available DR resources to assist with grid control tasks. The monitoring and control scope of UP could be extended and restrained to the load aggregators (LAs), in order to ensure enough information with respect to the privacy of customers.
DRAS is the central block of the DR system and acts as a bridge between the grid side and the customer side. On the grid side, DRAS provides the DR operating environment and functions to the UP by virtualizing DR resources. On the customer side, DRAS acts as the dispatcher, responsible for receiving real-time data from LAs and organizing corresponding LAs to complete DR tasks.
(b) Customer side—multi-level agents, including load aggregators (LAs) and a home energy management system (HEMS)
LAs provide a lower-level load aggregator function which could be seen as the implementation of DRAS near the customer side. Functions like data storage and resource organizing are also needed in LAs though simpler. Moreover, it comes with additional features to facilitate automation. The load operating data uploaded by LAs to the DRAS must be processed to retain only critical and holistic information. This measure is not only requested to protect local privacy, but also beneficial for decreasing the pressure on DRAS about data receiving, storing, managing, and processing. It should be noted that LAs can be divided into more levels according to the system scale.
The HEMS has a similar function to LA, while the management scale is narrowed in a building or a home. Unlike the implementation of DRAS and LA needing professional servers, HEMS can be realized through an embedded processor and small local storage or cloud storage, which can be integrated with other functions in the body of a home intelligent gateway (HIG). Specially, the HEMS needs to respond to the instructions from both upper agents and customers, which acts like a smart manager for the latter.
(c) Terminal—a novel DR smart terminal
The smart terminals should be connected to the actual loads directly to collect or control their states. A novel DR smart terminal is also studied in this paper to support the functions of the proposed DR system, such as load aggregating, remote control, and quick DR tasks.
The rest of this section describes the technologies and designs applied to the UP, DRAS, and agents, which enables the proposed system to undertake tasks with diverse characteristics simultaneously. Details about the design of the smart terminal are provided in Section 3.
2.1. Design for Grid-Side Architecture and Functions
The architecture of the grid side is shown in Figure 2.
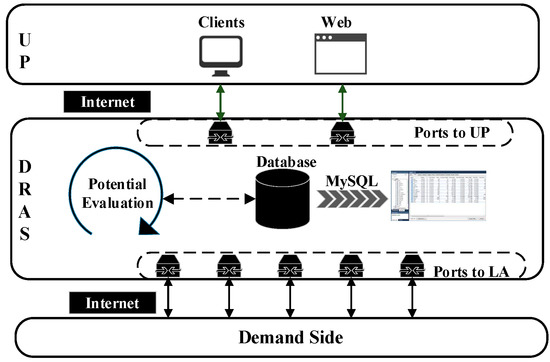
Figure 2.
The architecture of the grid side.
As mentioned before, the UP is the interface of electric utilities for the DR system. In the design of the proposed DR system, the functions and environment provided by the DRAS are accessed through internet communication, although, on many occasions, DRAS is included in the utilities. This is because (1) there are diverse departments in a utility with diverse requirements and safety levels, while the access through communication are more easily to manage; (2) the implementation platforms can be diverse languages and platforms, as long as network connectivity is included. This measure is expected to make the system more versatile on occasions where the electricity markets are operating.
Due to the central role of DRAS, the technologies and strategies applied to it need to be highly stable and generic. In order to satisfy the requirements for multi-LA and multi-UP connections, multiple communication interfaces are necessary, which are mature in the present internet applications. Considering mass data and instruction transformation, only fiber communication connections could retain the pressure. Therefore, the communication methods linked with DRAS are mostly based on internet in the wired form, which represents the main cost in the communication part of this system.
In addition to the choice of communication methods, another important function of DRAS and big LAs needed is the potential assessment of DR resources, which is the base of load aggregation and multi-task parallel operation. As for the functions shown in Figure 3, DRAS needs to assess and record the resources occupied by each DR task, preventing the resource tasks from exceeding the system limit. In the meantime, adjusting DR potential with real-time operation data is also required by the DRAS. The strategies of DR potential assessment in this work refer to our previous work [11].
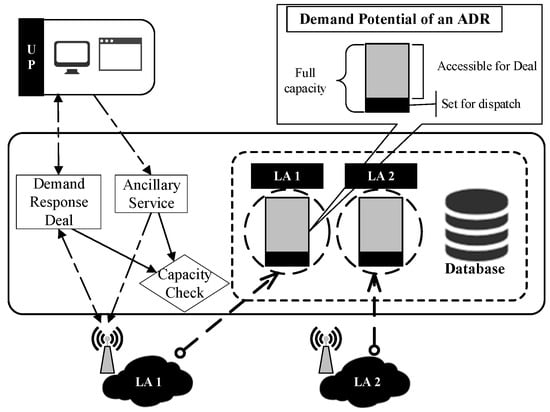
Figure 3.
Diagram of potential assessment of demand response automatic server (DRAS).
As Figure 3 shows, DR services provided by the proposed DR system are divided into two categories according to time scale and strategy mechanism. The first one is traditional DR, including peak clipping, congestion control, and economy optimization. The tasks belonging to this category are characterized by a long time scale with unstrict demands and no mandatory demands, which are often applied with market trading mechanisms. The other one is quick DR, acting as a spinning reserve for emergency accidents like frequency modulation and renewable energy accommodation, named “ancillary services” in OpenADR [12]. In contrast to the former, the tasks in this one are characterized by a short time scale, requiring deterministic response behaviors which should be settled in a day-ahead schedule. In the present implementation, each LA is asked to contribute a certain share as a quick DR reserve, and the others are left to participate in other DR mechanisms.
In terms of specific technology, the DRAS is accommodated on a Linux server at present, with MySQL chosen as the database implementation. A dedicated internet communication architecture is necessary for stable and secure communications between the DRAS and UP, DRAS, and main LAs.
2.2. Design for Customer Side Architecture and Functions
The architecture of the customer side is shown in Figure 4. As mentioned in the overview description about the system before, the regional agents are divided into two categories: LA and HEMS, where the former is like a slimmed DRAS, and the latter manages the physical loads directly.
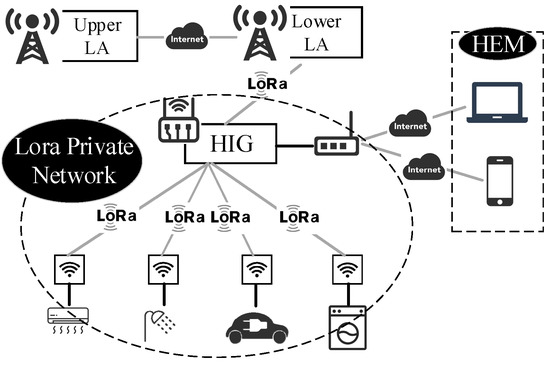
Figure 4.
The architecture of the customer side.
In the future scenario of the proposed DR system, LAs and HEMSs could be also developed by third-party organizations to fully spur the influences of market arrangements. The messages sent to LAs from upper blocks can be holistic quantities, electricity prices, or incentives. The specific DR task distribution mechanisms are decided by the corresponding LA. For LAs, there could be many layers, where the lower layer LAs manage HEMs, and distribution work will enter the last procedure (the strategies of load action to meet requirements), which was studied by many researchers [13].
As for the selection of communication method, public internet connections are suggested to be applied among LAs to ensure a high data transmission rate. Because lower LAs that are not linked to DRAS are likely be settled by a third party, which means they are newcomers to original power system blocks, spreading a more dedicated wired communication line may not be justifiable and economical. Hence, it is a better choice to use public internet connections built by telecommunication suppliers.
For the implementation of HEMSs, embedded devices combined with IoT gateways form the main body of the HIG. Connections can be more flexible since better solutions for mass terminal access and large-scale wireless transmission are provided by IoT technologies. The difficulties related to terminal identification, communication congestion, system investment, and energy cost in internet applications could be highly overcome by IoT communication methods. Lora was chosen in the implementation, the performance of which was verified in many cases [14]. In addition, the HIG needs to have internet connection ability, where a Wi-Fi chip is integrated to communicate with the HEMS monitor platform, which is achieved via internet cloud services.
3. Design of Smart Terminal Supporting the Proposed DR System
In order to enable household loads to be incorporated into the proposed DR system conveniently, a plug-and-play smart terminal in the form of a socket was designed. This section mainly describes the key features and hardware design.
The key features considered in the design of the smart plug are presented in Figure 5a, which correspond to the basic response requirements of the proposed DR system. These requirements and functions are concluded as follows:
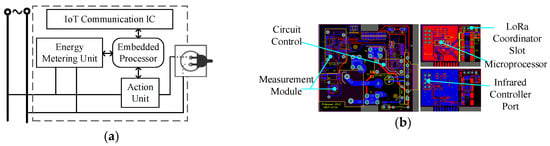
Figure 5.
Smart terminal for the proposed DR system: (a) schematic of key blocks and functions in the smart terminal; (b) circuit diagram of its implementation.
- IoT communication ability. This is the key feature to implement remote monitoring and control.
- Parameter acquisition. The real-time acquisition of the underlying load operation status is the basis for potential assessment, load aggregation, DR decisions, and so on.
- Expansible load control ability. In addition to a circuit switch, other control blocks like an infrared block are allowed to be added to the smart terminal.
As for the programs running on the smart terminal, there need to be functions for local parameter checks and action, in addition to ordinary functions. This is because IoT transmission rates are far slower than utilities expect during urgent periods, which means direct load control is not practical for quick DR tasks. A feasible approach to prevent the influence of delay is completing control locally, which is followed in this paper. The utility should distribute quick DR response requirements, which may be in the form of frequency or voltage thresholds, through LAs to the HIG, and finally to smart terminals. Then, the smart terminals will automatically act when the parameters collected exceed the threshold. A more detailed description is provided in Section 5.2.1.
The chip choices for the smart terminal were as follows: stm32f0 was chosen as the processor of the smart terminal with the corresponding Lora terminal communication chip for the Lora HIG. A professional energy metering chip was also applied in the design with the concern of local fault detection and action. A relay was taken as the switch device coupled with zero-voltage and zero-current switching, allowing the terminal to maintain 10-kW loads.
4. Scope of Proposed DR System Application
The purpose of our work was to implement an economical and practical DR system; thus, it was necessary to consider the requirements of diverse types of DR programs. The main characteristics of DR programs are highlighted in Table 1 [1]. The main concerns for the system design are requirements regarding computation, communication, and control. Therefore, the scope of the proposed DR system application was determined through the analysis of these DR requirements.

Table 1.
Comparison for demand response (DR) programs.
(a) Computation requirements
Computation exists in procedures like data processing and decision-making. The DRAS and multi-agents are regulated from existing computation infrastructures in traditional power systems, and open to updates of software and hardware. Therefore, the proposed system has enough ability to undertake computation tasks with no geography or facility limitations. Whether the programs in Table 1 belong to dispatchable or non-dispatchable rules, the DR system proposed can provide centralized and decentralized computation capacities.
(b) Communication and control requirements
In practical operation cases, whether the programs work well highly depends on the performance of the system in communication and control, and the tolerance for communication and control failure and latency is different among programs [15]. As Table 1 shows, for price-based programs like time of use (ToU), critical-peak pricing (CPP), and real-time pricing (RTP), time tolerance is relaxed to allow bi-directional trades to be executed. Furthermore, periodical and practicable behaviors are easy to optimize and valuable for communication resources.
For incentive-based programs, the situation is different. Some incentive-based programs like direct load control (DLC) and emergencies operate at one direction mode and happen casually, as required by the power system safety. For the use of public communication connections and third-party agents in the proposed method, the communication requirements for these programs cannot be satisfied.
To compensate for the communication shortcomings, a “local check-and-action” method is proposed and integrated into the design of the system, involving potential assessment and terminal operation strategies which are described in Section 2 and Section 3. Meanwhile, the DR programs designed for spinning reserves or emergencies should be adjusted to satisfy a decentralized local action mode. This method was validated to be practical in the case study.
5. Case Study
The main contribution of our work is proposing an economical multi-communication-based DR implementation method including both system structure and strategies. However, the practicality of the proposed system and its strategy were not demonstrated in the previous discussion and, thus, are checked through actual environment tests and simulations in this section.
The practicality of the proposed system structure and its strategies are expected to perform in two aspects: (1) providing a basic operation environment for traditional DR tasks such as system operation status perception and remote control; (2) possessing quick DR abilities based on a “local detection and action” strategy. Therefore, the verification was divided into two parts: functional verification and strategic verification. The functional verification reflects the practical operation ability of the proposed system, and the strategical verification checks the effects of the proposed system structure and strategies introduced to the power system. For the latter verification, a hardware-in-loop co-simulation platform was developed.
5.1. Functional Verification
The schematic diagram of the functional verification platform is shown in Figure 6. The experimental system covers all the necessary elements in the proposed DR system, such as the UP and HEM platform, DRAS, HIG, and communication lines. For the functions carried out by LAs which also run on the DRAS and HEMS with different parameters and strategies, the segment of the function run by LAs is ignored in the functional verification. The system in Figure 6 was installed in a real customer building.
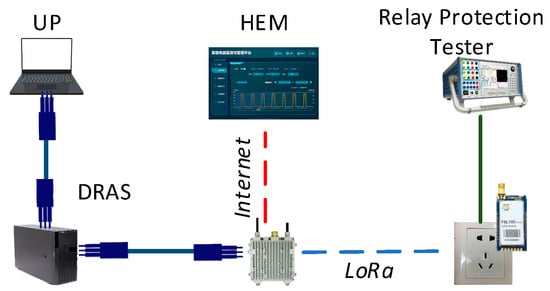
Figure 6.
Experimental platform for the functional verification.
(a) System monitoring
The first step was to test the system’s monitoring ability, which provides the real-time operation status of the power system and acts as the basis for various power system control decisions including DR. In addition, the privacy of customers also needs to be considered in the data collection.
The load information available to the UP is shown in Figure 7. For the mask strategy of the HIG (LA) in this case, the values of peak, average, and valley loads in the building are sent to the upper agents (DRAS in this case) every 10 min. Although the details for a single appliance did not expose the UP, the information for most DR decisions is enough. For example, the peak appeared from 12:00 p.m. to 4:00 p.m. (the hottest time of the day), which means that the main contributions might be air conditioners, which are DR-friendly loads. In addition, during the peak time, maximum load was sometimes two times higher than average load, which means the peak load occupied a really short time compared to high values where many DR programs and researches were devoted to curtailing them.
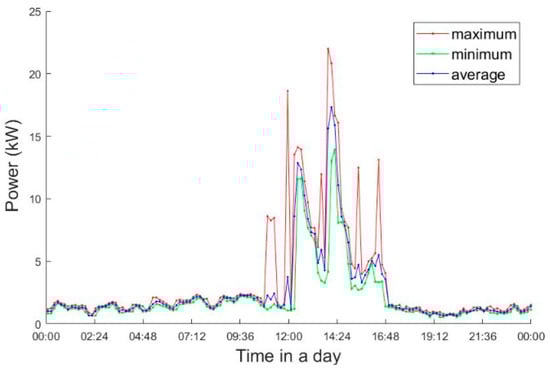
Figure 7.
Curve of load data accessed on grid side.
(b) Communication performance
The second step was to test the remote monitoring and control abilities of the proposed DR system, which has important meaning for DR tasks. During the test, dozens of remote breaks were executed with a long communication distance over 100 km, which was near to a normal direct control distance from the DRAS to customers; the delay curve is shown in Figure 8.
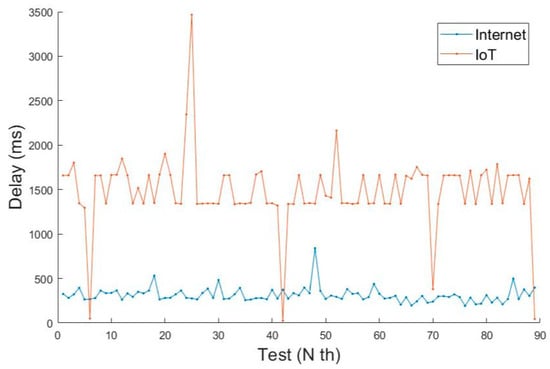
Figure 8.
Communication delay of internet and Internet of things (IoT).
As mentioned before, IoT was applied for wider-area mass access, while the internet was used for stable high-speed transmissions. The test results presented in Figure 8 imply that the communication delay was much lighter than for the IoT even when the internet connections were 100 km away, while the IoT was in the building. The communication performance gap provides the feasibility of taking the internet as the communication method between important infrastructures. From the overall communication test results, the delay was acceptable at under 3.5 s. It should be noted that the fluctuations of the IoT are mainly due to the polling style in Lora, and the performance may differ from other IoT technologies.
(c) Local action ability
Because a “local detection and action” strategy was proposed to address quick DR problems in this paper, the ability and performance of the proposed system in a local action also needed to be checked. Therefore, this subsection tests the local action ability of this system, which is the basic function of supporting quick DR tasks. The relay protection tester in Figure 6 was hooked with a smart terminal, and a frequency threshold was applied as the quick DR task indicator. When the output frequency of the relay protection tester dropped below the threshold, the smart terminal acted. The delays between the time output frequency dropped to the threshold and the time terminal action was recorded (Figure 9). The figure shows that the delays were mainly 100~120 ms. The causes for the delay were mainly the strategies needing four cycles to confirm that the accident occurred. Moreover, the zero-crossing switch strategy also increased the time.
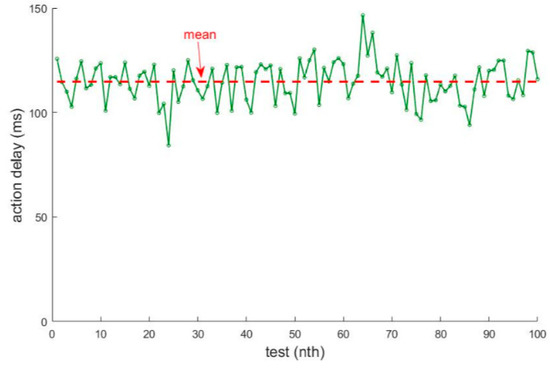
Figure 9.
Curve of load data accessed on grid side.
The results of the functional verification demonstrate that the proposed DR system has large-scale monitoring and control capability and the ability to undertake the system’s multi-time-scale DR tasks described before.
5.2. Strategic Verification
Quick DR ability is meaningful for power system control, but it has a high requirement for the control system. A “local detection and action” response strategy was proposed in order to achieve quick DR tasks based on public communication connections. However, this strategy is new to traditional power system control, and its influence and performance need to be checked. Therefore, frequency regulation was chosen as the scene of the proposed system and strategy participating in the quick DR task. A hardware-in-loop co-simulation platform was developed to undertake the experiment.
5.2.1. Introduction of the Simulation Platform
The structure of the hardware-in-loop co-simulation platform is shown in Figure 10. RT-Lab was used to simulate the physical power system, while OPNET was used to simulate the communication system. Furthermore, the smart terminals and HIG were incorporated as actual physical equipment. In a loop of simulation, the RT-Lab sends electrical quantities to the smart terminals through the power amplifier unit (PAU). The smart terminals then upload the measured information to the HIG, where the information is processed and forwarded to the LA through the router. Next, the UP and DRAS receive the information from the LA via the virtual network in OPNET.
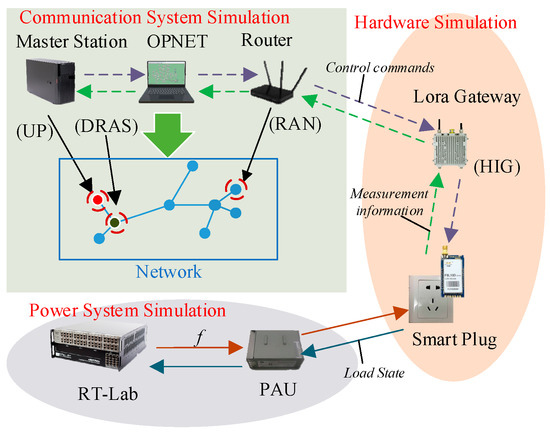
Figure 10.
Hardware-in-loop co-simulation platform.
By adding smart terminals and the HIG, the platform can reflect the operation of the system on the customer side more precisely. OPNET and RT-Lab are able to undertake real-time simulations of wide-area internet networks and power systems, respectively. Therefore, the platform can accomplish more accurate simulations of the influence of the proposed system on the power system.
Figure 11 shows the workflow of the active load shedding (ALS) method based on the “local detection and action” strategy in the proposed DR system to assist primary frequency control. Firstly, the UP regularly summarizes the information stored in the DRAS to evaluate the operating status of the power system. Then, the load shedding quantities and thresholds are determined and distributed to corresponding LAs, where more accurate decisions are made to determine which loads are in turn to act as the reserve. Finally, the thresholds are distributed to corresponding smart terminals. When a power system fault occurs, the smart terminal can act automatically based on the threshold and frequency collected.
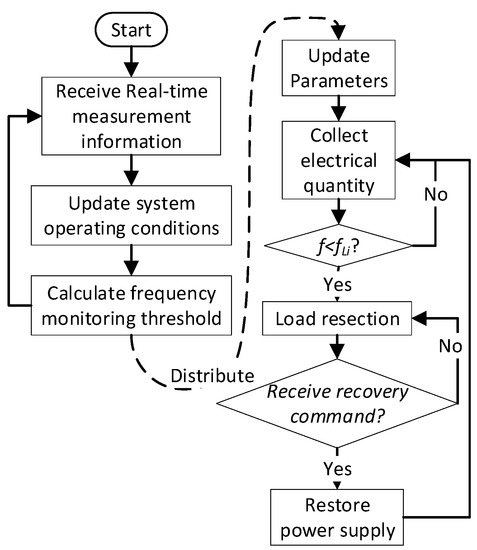
Figure 11.
Control scheme of active load shedding (ALS) in the proposed DR system.
5.2.2. Description of the Case
As Figure 12 shows, an Institute of Electrical and Electronics Engineers (IEEE) system including four generations and two areas was taken as the power system model. The total load of the power system was 1450 MW. The system was separated into two zones (A and B) after the tie lines 6–11 and 7–12 were disconnected. Then, 70-MW responsible loads were set at bus 10 as the reserve for load shedding in the frequency control. Both traditional under-frequency load shedding (UFLS) and the proposed ALS approach were applied on the bus 10 loads.
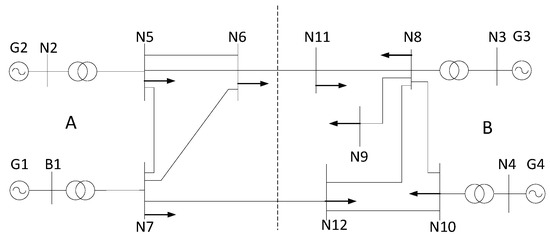
Figure 12.
Simulation scenario of the power system.
For the ALS approach, the frequency threshold was transmitted to the corresponding smart terminals in advance. The simulation platform was hooked to five smart terminals; thus, the loads at bus 10 were divided into five grades with different thresholds, as shown in Table 2.
Table 2.
Frequency thresholds and quantity of under-frequency load shedding (UFLS) via DR approach.
For the traditional UFLS approach, the parameter setting method referred to the standards of the China State Grid. The first grade should be set at 49.0 Hz and, after UFLS, the frequency should recover to a value between 49.5 and 51.5 Hz. For the tie lines cut off, this would lead to approximately 50 MW of power loss in zone B, where the quantities of UFLS were set as 30 MW and 40 MW to decrease the influences from the parameter setting strategy. Relevant settings are shown in Table 3.
Table 3.
Settings of traditional UFLS approach.
The delay for the utility from detecting the frequency exceeding the threshold to cut off loads via UFLS was assumed as 0.2 s, which is better than the actual performance of UFLS.
5.2.3. Simulation Results and Discussion
The comparison of the system frequency curves between UFLS and ALS is shown in Figure 13. The blue line is the original curve of the system with no load participation, and the yellow line and green line are the 30-MW and 40-MW load shedding via UFLS respectively, whereas the red one is load shedding via ALS.
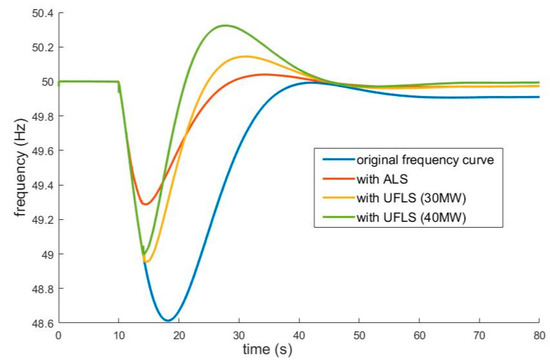
Figure 13.
Comparison of control performances between under-frequency load shedding (UFLS) and ALS.
With no customer-side participation, the frequency would drop rapidly to 48.5 Hz in a duration shorter than 10 s, which far exceeds the permits of safe grid operation and has a high potential of causing a black out. After adding UFLS, the frequency is able to recover to the normal state with an offset of 0.2 Hz. Considering the recovery speed and over-correction, this is approximately the best performance that the traditional strategy could achieve.
However, the frequency recovery of ALS has better performance. After triggering the third-grade response loads (49.3 Hz in Table 2), the frequency rose gradually to a normal state with a higher bottom and lower peak of frequency.
Hence, from the quantity of over-correction and frequency drop, the ALS approach has better performance than the traditional method. This is because, in UFLS, loads are cut off regionally at the bus, which leads to a relatively conservative control strategy to prevent important loads from being affected as much as possible. In addition, in the proposed DR system, the interruptible loads and the important ones are separated to achieve more precise classification of load shedding. It means that the control strategy can be adjusted to perform a quicker response to prevent accidents from spreading, with no significant impact on customers’ normal life.
As a conclusion, the proposed DR system is affordable for undertaking quick DR tasks through the method of “local detection and action”. Moreover, the configuration mechanisms of parameters like the threshold and quantity are from existing projects and researches on power systems. In other words, the strategies applied and researched for traditional power systems could be applied easily in the proposed system to gain more flexible and selective control. It shows that, with feasible configuration and strategies, the proposed DR system can be easily integrated into the existing power system.
6. Conclusions
To implement large-scale DR with lower cost, the following steps were taken in this paper: (1) a multi-communication-based DR system implementation routine was researched; (2) a plug-and-play smart terminal meeting multi-time-scale DR requirements was designed; (3) the practicality of the proposed system was validated in a laboratory environment through hardware-in-loop co-simulation.
The advantages of the proposed system could be concluded as follows: (1) both building and maintaining costs were relatively saved by utilizing existing internet connections and IoT communication technologies; (2) system flexibility and customer initiative were improved through multi-level agents; (3) quick DR tasks were viable by means of “local detection and action”.
However, compared with AMI-based implementation methods, the proposed structure and its strategy indeed have some limitations and need additional research on system management and decisions, which can be concluded as follows:
(1) The proposed regulation method utilizes public communication connections and smart terminals to undertake data collection and signal transmission tasks. This leads to a decrease in data accuracy and timeliness, as well as cyber security challenges.
(2) Diverse third-party devices are introduced, which cause a significant problem in management. Necessary standards and polices are needed to be formulated to maintain the safety of the system for the above economic activities.
Author Contributions
Conceptualization, Q.W.; methodology, Q.W. and Y.T.; software, H.W.; validation, formal analysis, investigation, resources, and data curation, L.Z. and X.W.; writing—original draft preparation, H.W.; writing—review and editing, Q.W. and Y.T.; visualization, supervision, and project administration, Q.W.; funding acquisition, Y.T.
Funding
This research was funded by the National Key Research and Development Program of China, grant number 2017YFB0903000 (Basic Theories and Methods of Analysis and Control of the Cyber Physical Systems for Power Grids), the Science and Technology Project of State Grid Jiangsu Electric Power Company, grant number 1KJ-17601-DJ (Flexible Control of Distributed Source-Grid-Load in Active Distribution Network), and the National Natural Science Foundation of China, grant number 51707032.
Conflicts of Interest
The authors declare no conflicts of interest.
References
- Haider, H.T.; See, O.H.; Elmenreich, W. A review of residential demand response of smart grid. Renew. Sustain. Energy Rev. 2016, 59, 166–178. [Google Scholar] [CrossRef]
- Samad, T.; Koch, E.; Stluka, P. Automated Demand Response for Smart Buildings and Microgrids: The State of the Practice and Research Challenges. Proc. IEEE 2016, 104, 726–744. [Google Scholar] [CrossRef]
- NIH and the American Recovery and Reinvestment Act (ARRA). Available online: https://recovery.nih.gov/ (accessed on 25 June 2019).
- Avancini, D.B.; Rodrigues, J.J.P.C.; Martins, S.G.B.; Rabêlo, R.A.L.; Al-Muhtadi, J.; Solic, P. Energy meters evolution in smart grids: A review. J. Clean. Prod. 2019, 217, 702–715. [Google Scholar] [CrossRef]
- Kuzlu, M.; Rahman, M.M.; Pipattanasomporn, M.; Rahman, S. Internet-based communication platform for residential DR programmes. IET Netw. 2017, 6, 25–31. [Google Scholar] [CrossRef]
- Shakeri, M.; Shayestegan, M.; Abunima, H.; Reza, S.M.S.; Akhtaruzzaman, M.; Alamoud, A.R.M.; Sopian, K.; Amin, N. An intelligent system architecture in home energy management systems (HEMS) for efficient demand response in smart grid. Energy Build. 2017, 138, 154–164. [Google Scholar] [CrossRef]
- Zhuang, Z.; Won Cheol, L.; Yoan, S.; Kyung-Bin, S. An Optimal Power Scheduling Method for Demand Response in Home Energy Management System. IEEE Trans. Smart Grid 2013, 4, 1391–1400. [Google Scholar] [CrossRef]
- Bedi, G.; Venayagamoorthy, G.K.; Singh, R.; Brooks, R.R.; Wang, K.C. Review of Internet of Things (IoT) in Electric Power and Energy Systems. IEEE Internet Things J. 2018, 5, 847–870. [Google Scholar] [CrossRef]
- Al-Ali, A.R.; Zualkernan, I.A.; Rashid, M.; Gupta, R.; Alikarar, M. A smart home energy management system using IoT and big data analytics approach. IEEE Trans. Consum. Electron. 2017, 63, 426–434. [Google Scholar] [CrossRef]
- Sechilariu, M.; Wang, B.; Locment, F. Building-integrated microgrid: Advanced local energy management for forthcoming smart power grid communication. Energy Build. 2013, 59, 236–243. [Google Scholar] [CrossRef]
- Tang, Y.; Li, F.; Chen, Q.; Li, M.; Wang, Q.; Ni, M.; Chen, G. Frequency prediction method considering demand response aggregate characteristics and control effects. Appl. Energy 2018, 229, 936–944. [Google Scholar] [CrossRef]
- OpenADR. Available online: http://www.openadr.org (accessed on 25 June 2019).
- Robert, F.C.; Sisodia, G.S.; Gopalan, S. A critical review on the utilization of storage and demand response for the implementation of renewable energy microgrids. Sustain. Cities Soc. 2018, 40, 735–745. [Google Scholar] [CrossRef]
- Raza, U.; Kulkarni, P.; Sooriyabandara, M. Low Power Wide Area Networks: An Overview. IEEE Commun. Surv. Tutor. 2017, 19, 855–873. [Google Scholar] [CrossRef]
- Gungor, V.C.; Sahin, D.; Kocak, T.; Ergut, S.; Buccella, C.; Cecati, C.; Hancke, G.P. A Survey on Smart Grid Potential Applications and Communication Requirements. IEEE Trans. Ind. Inf. 2013, 9, 28–42. [Google Scholar] [CrossRef]
© 2019 by the authors. Licensee MDPI, Basel, Switzerland. This article is an open access article distributed under the terms and conditions of the Creative Commons Attribution (CC BY) license (http://creativecommons.org/licenses/by/4.0/).