1. Introduction
Detecting damage in composite materials is becoming more and more important with the increase in applications for composites. Up to date, there are many nondestructive testing (NDT) methods for evaluating the structural integrity of a target structure [
1,
2,
3,
4,
5,
6,
7,
8,
9]. For composites, since bonding of two composite parts with adhesives is the preferred choice over the conventional mechanical fastening approach, detecting debonding is a crucial factor when maintaining a composite structure. Some of the recent studies in this area include effects of sensor debonding failure on mathematical representation of smart composite laminate [
10], piezoelectric wafer guided wave-based debonding of carbon fiber reinforced polymer (CFRP) overlay in CFRP-reinforced concrete structures [
11], and laser ultrasonic guided waves for detecting debonding of multilayered bonded composites [
12]. Although various NDT methods are available for detecting damage, most of the methods require well-trained experts or heavy equipment to perform the procedure. For this reason, a low-cost, portable NDT system that is easy to use can be an important item in the field of NDT. Moreover, with advance in technology, efforts have been made by combining NDT with IoT (Internet of Things) technology, and a well-summarized work in this area can be found in [
13].
The electromechanical impedance (EMI) technique is one of the NDT techniques that use a single piezoelectric (PZT) transducer to act as both actuator and sensor. The technique involves measuring the impedance below 500 kHz and monitoring the changes in the signature for damage identification. The one-dimensional equation first introduced by Liang et al. [
14] shows that the electrical impedance of the PZT transducer is directly related to the mechanical impedance of the host structure as shown below. Here, the electrical admittance,
, is a combined function of the mechanical impedance of the host structure,
, and the PZT transducer,
, respectively. This proves that any change in the host structure can be monitored by measuring
. Other variables in the equation,
,
,
,
,
,
,
,
, are the PZT output current, PZT input voltage, input frequency, geometric constant, dielectric constant, loss tangent, piezoelectric constant, and Young’s modulus, respectively.
Currently, there are three ways of conducting the EMI technique. The most-used one is by using an impedance analyzer (e.g., Agilent 4924a), which can measure impedance over 1 MHz depending on specification. However, such equipment can be very costly and weigh over 10 kg making it impractical for field use. Another way of conducting the EMI technique is by combining a function generator with an oscilloscope and using a simple circuit proposed by Peairs et al. [
15]. Using this approach, one can conduct the EMI technique for a cost less than 25% compared to the conventional approach, and various authors have tested the reliability of this low-cost version. The cheapest way of conducting the EMI technique is by using the AD5933 evaluation board commercialized by Analog Devices Co. The small size of the device gives the possibility of creating a portable system for conducting the EMI technique. The cost of the AD5933 evaluation board can be as low as under 2% of the cost of the conventional impedance analyzer, which makes the EMI technique a very cheap technique to perform. However, one of the downsides of the device is that it can only measure impedance up to 100 kHz. Since one needs a signature with multiple peaks (e.g., resonance) to successfully identify damage, up to 100 kHz of frequency range might be not enough and could result in an impedance signature without any peak, resulting in failing to detect any damage. Especially for composite materials, due to its non-homogenous property, an impedance signature without any resonance can be commonly seen. To overcome this problem, the concept of sandwiching a metal disc between the PZT transducer and the host structure was proposed in [
16], where its reliability was tested using glass fiber epoxy laminates.
To create a portable impedance measuring system, the way of attaching the PZT transducer must be changed. Since the EMI technique requires the PZT patch to be permanently attached to the host structure, one must alter this so that the PZT transducer can be temporarily attached and detached for multiple EMI measurements. The easiest way to achieve this would be to use a double-sided tape with the PZT–metal EMI transducer; the reliability and performance of this idea are tested in this study. In addition to the test, simulation studies on using PZT in smaller sizes are introduced.
2. Evaluation of the PZT–Metal Transducer Using Double-Sided Tape
The idea of the PZT–metal transducer proposed in [
16] used a commercialized epoxy adhesive for attachment to the host structure. Thus, to make the PZT–metal transducer re-attachable, a simple idea of using a double-sided tape (purchased from
www.alpha.co.kr) is evaluated in this section against debonding and crack damage.
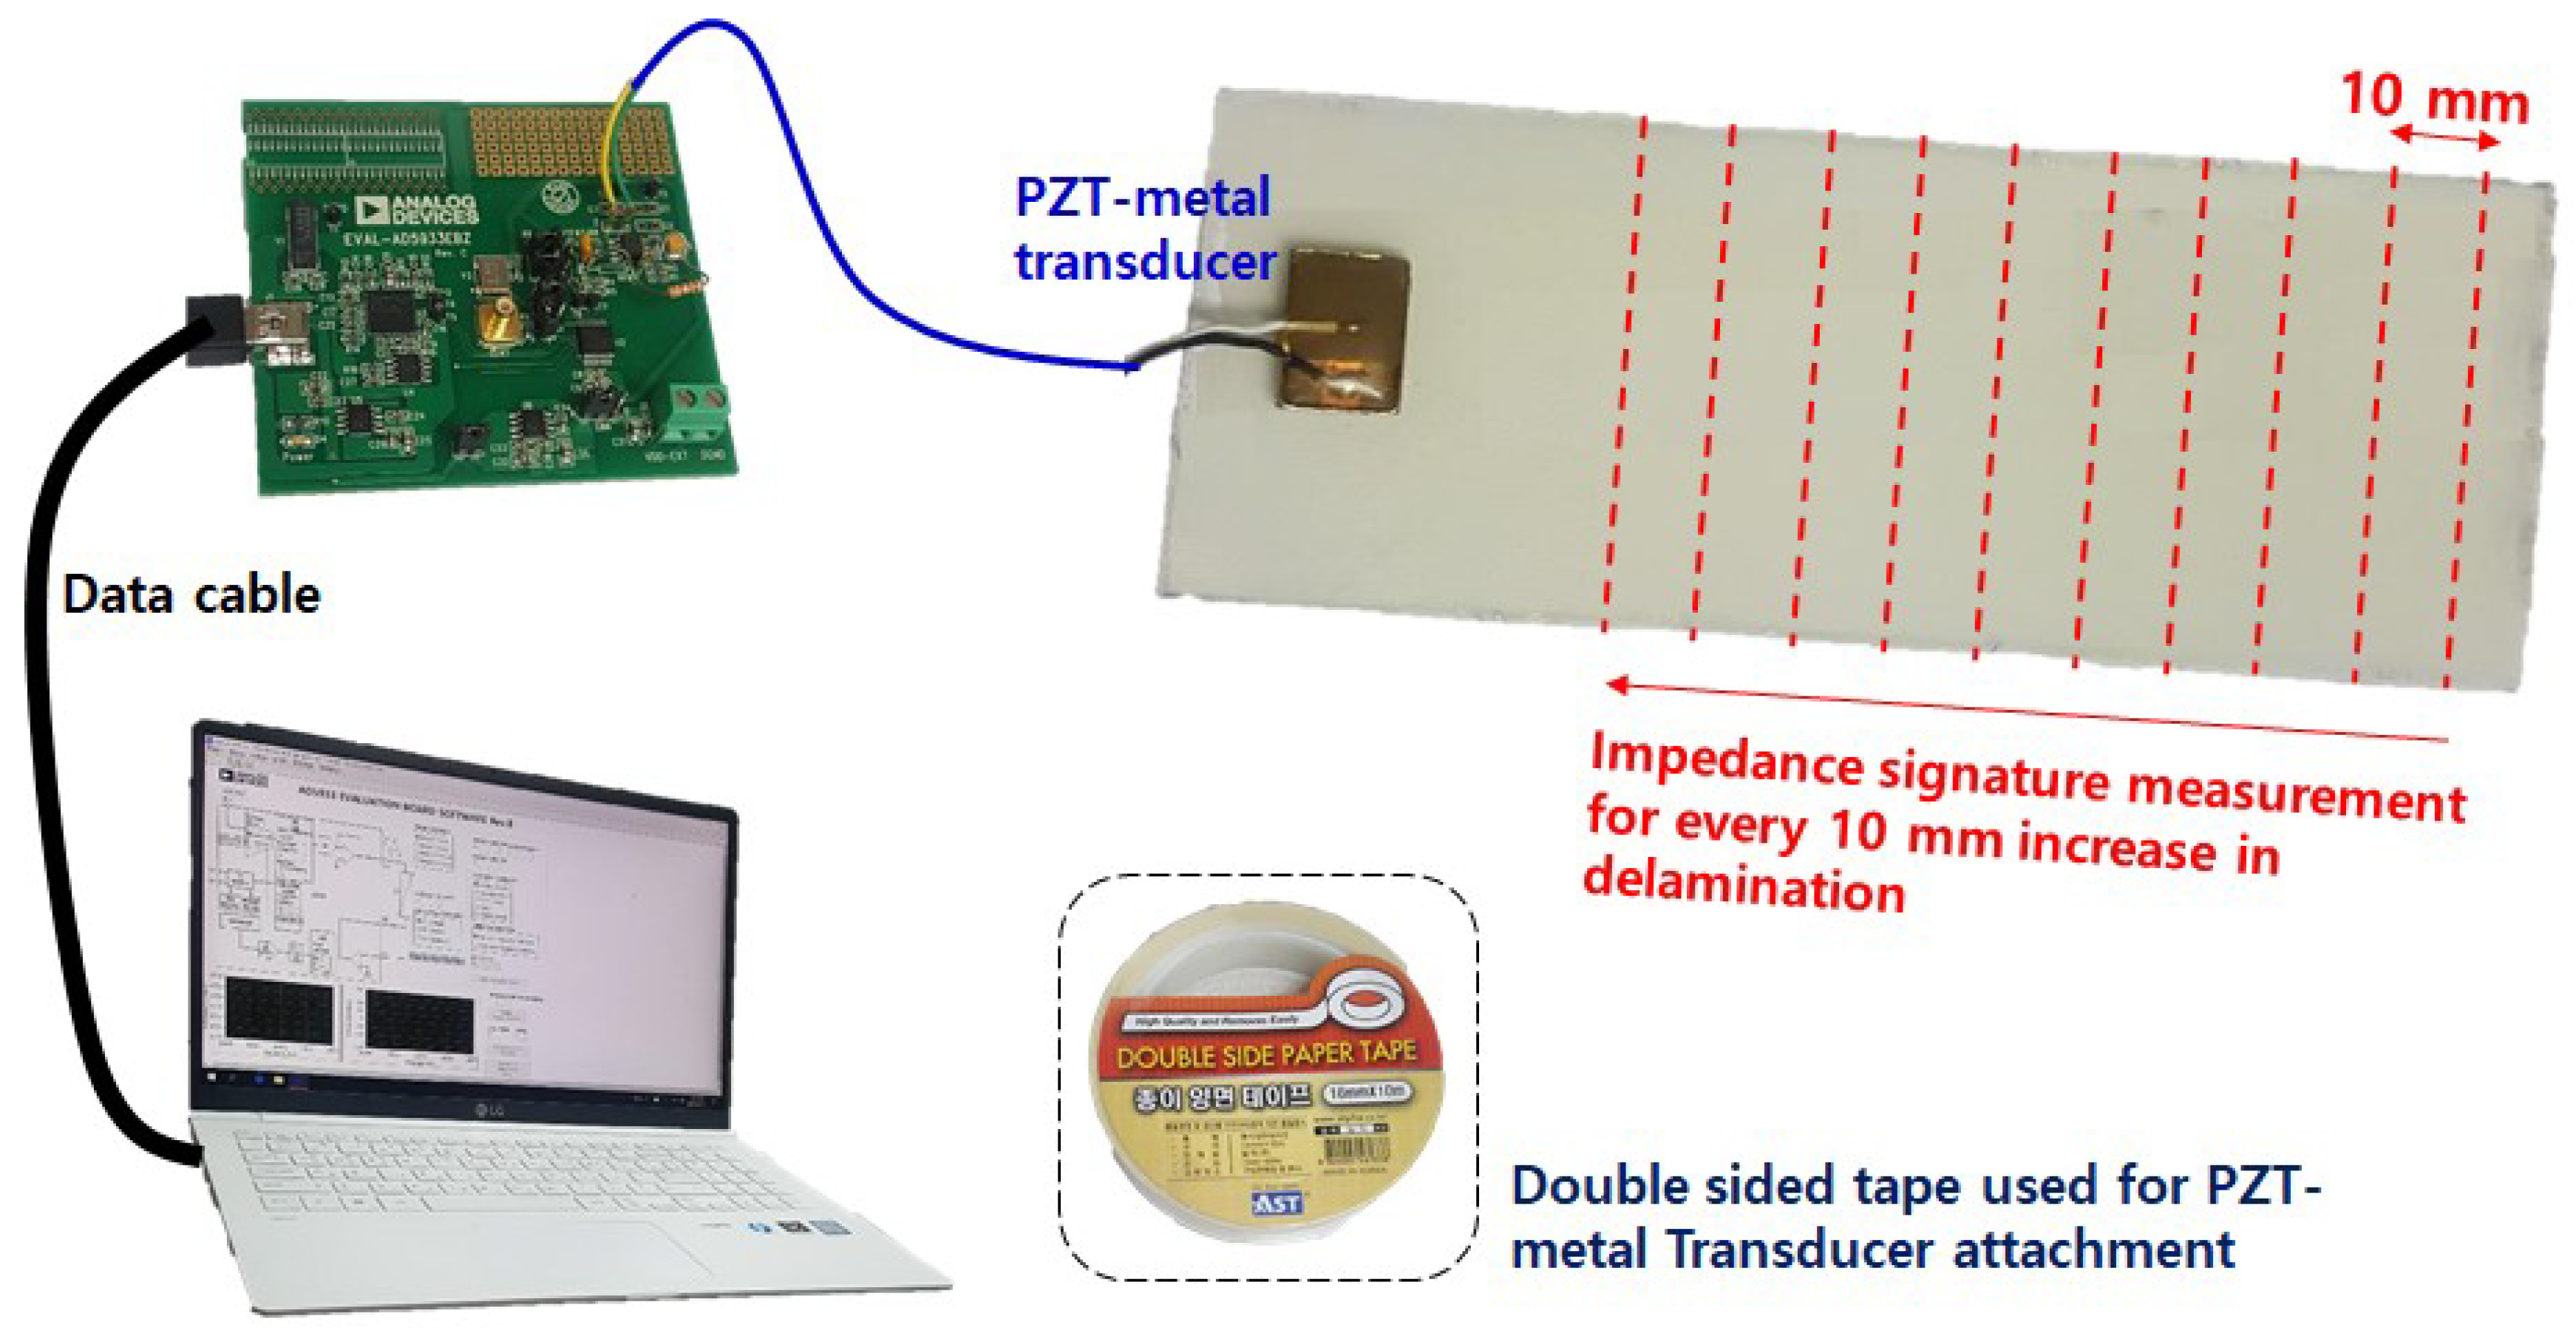
Figure 1 shows the experimental setup to evaluate the performance of the PZT–metal transducer with double-sided tape attachment. The AD5933 evaluation board is connected to the laptop as shown in the figure where the positive and negative wires from the board are attached to the PZT–metal transducer by soldering. More details on the PZT–metal transducer with its damage detection performance can be found in [
16]. For evaluating the performance of the PZT–metal transducer, two glass fiber epoxy laminates of 200 mm × 70 mm with 0.4 mm thickness were adhered to each other using a commercialized epoxy (Loctite Quick-set). After fully curing the epoxy for 48 h at room temperature, the impedance signature was measured from 25 to 75 kHz in 100 Hz steps to be used as a reference signature. Then, debonding was achieved by inserting a chisel tip between the two composite plates and seperating them apart 10 mm at a time until 100 mm debonding was achieved. For each 10 mm of debonding, impedance sigantures were measured. After 100 mm debonding was achieved, the final impedance signature was measured with complete debonding of the bottom composite plate. The reason for this was to observe the difference in the impedance signature subjected to debonding that occurs away from the PZT transducer and which that occurs right below the PZT transducer. To check the reliability of the double-sided tape attachment approach, five identical tests (Test 1, Test 2, Test 3, Test 4, and Test 5) were conducted.
Observing
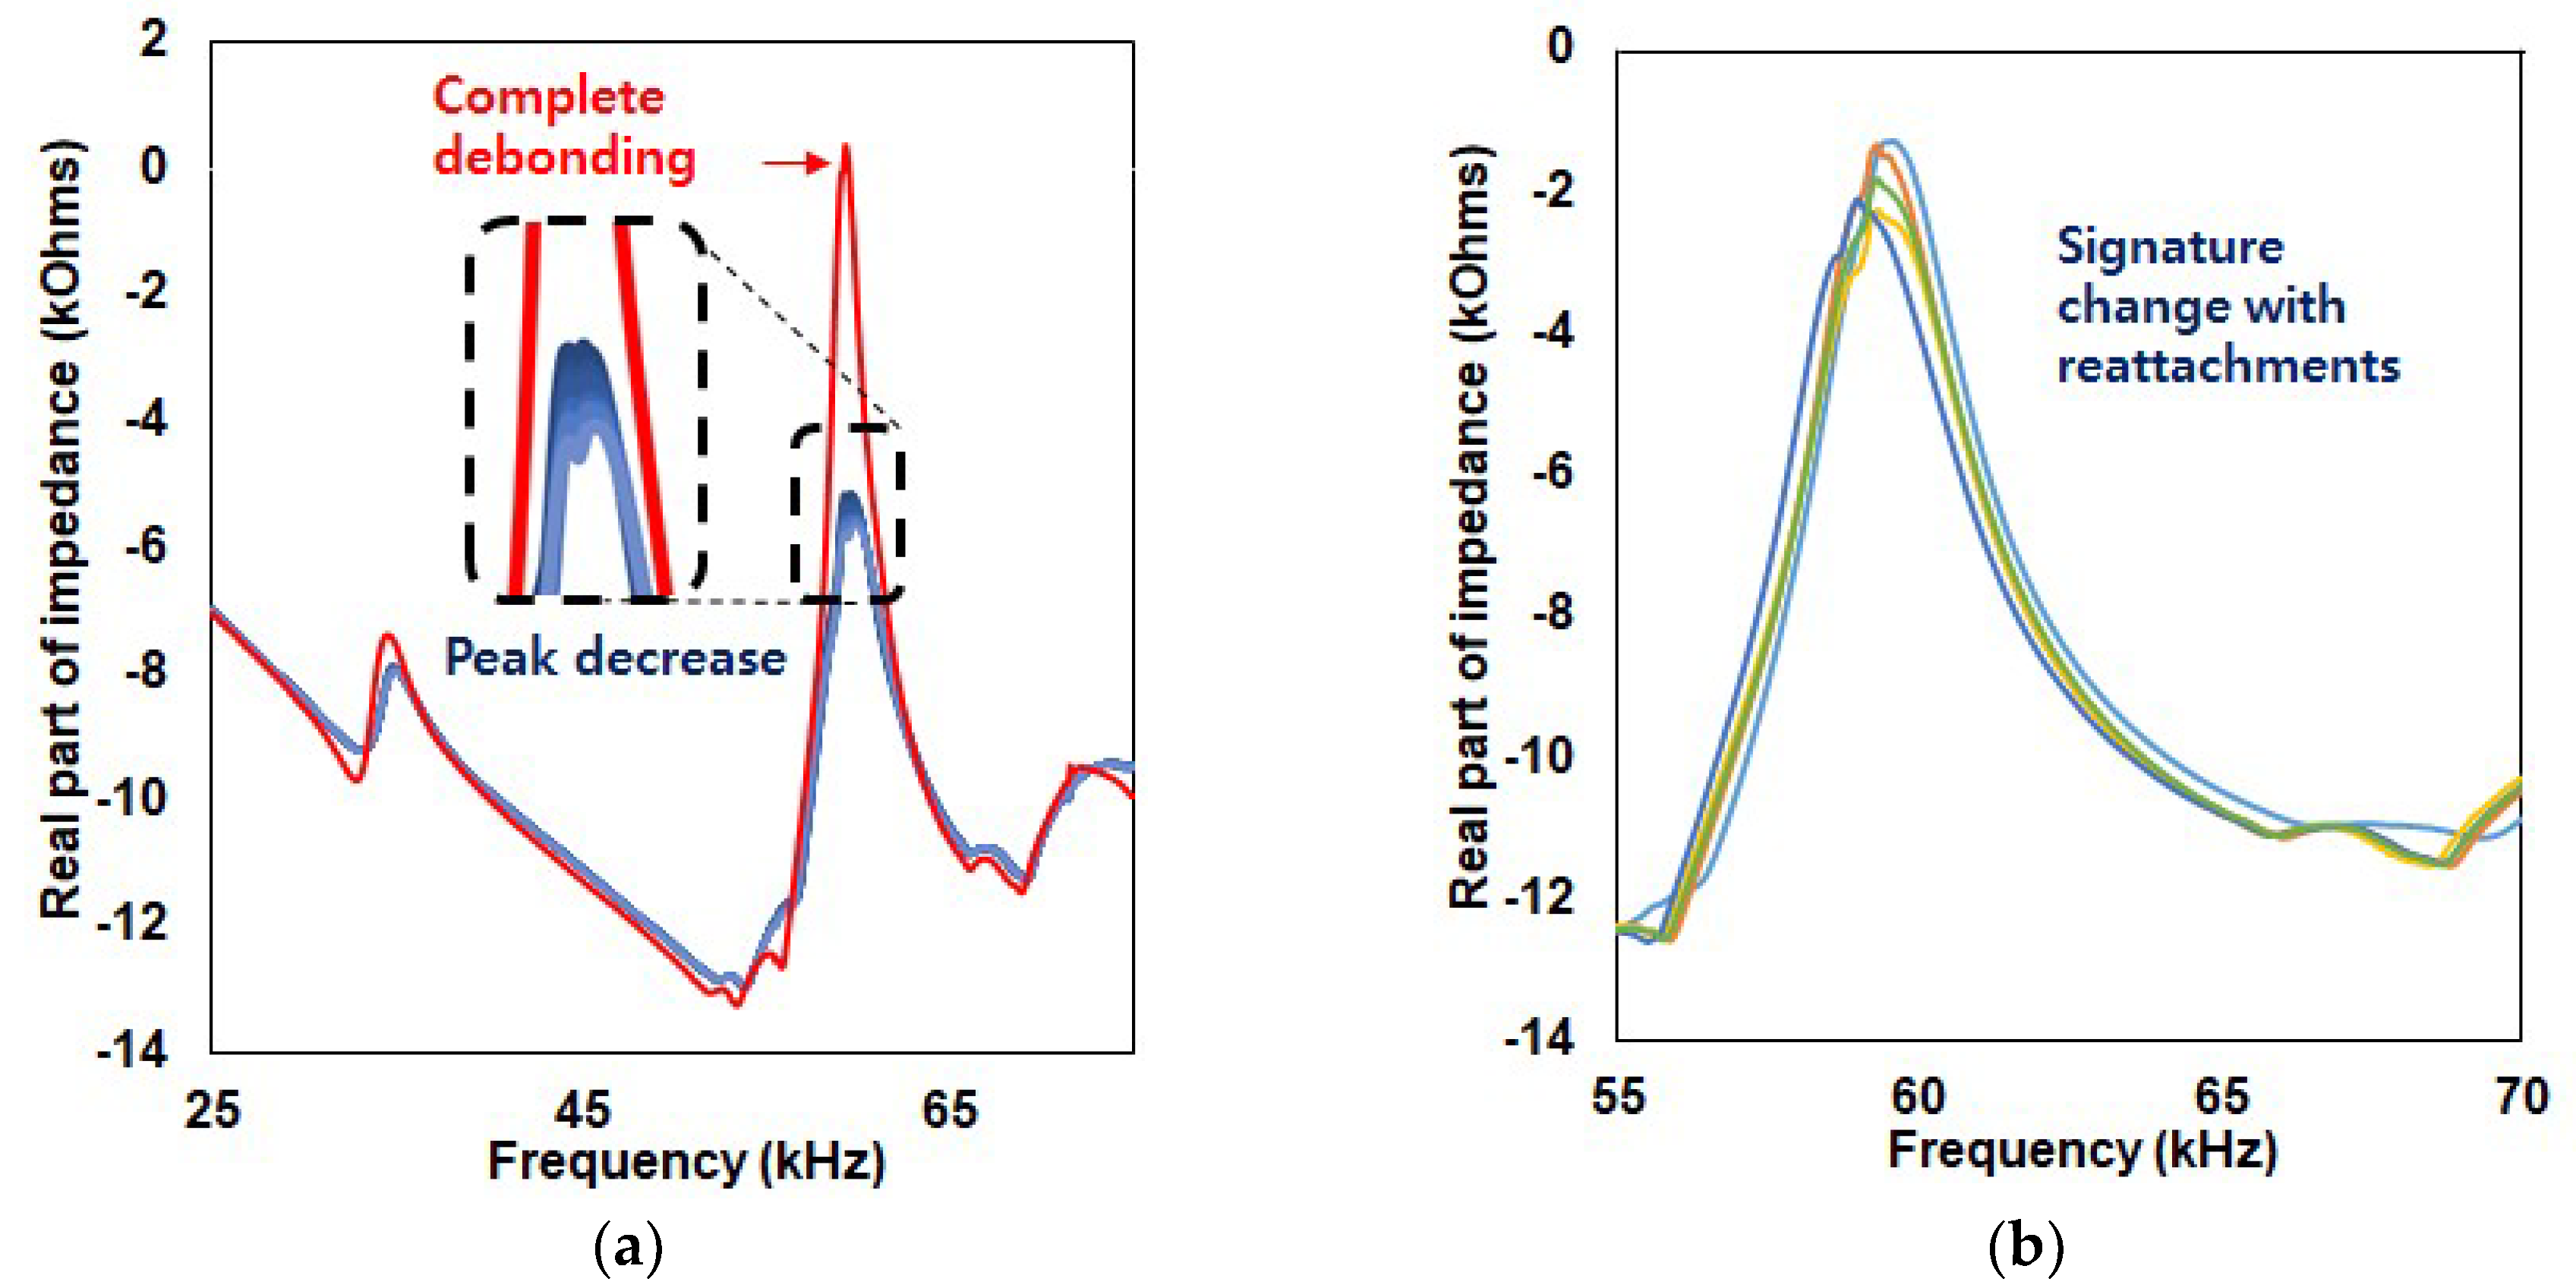
Figure 2a, which represents the impedance signatures from Test 1, debonding has caused the amplitude peak (at 60 kHz) to decrease with increase in debonding area. However the amplitude remains virtually the same for the frequency range at 35 kHz where change is very difficult to see. However, when bottom composite plate is removed, the impedance signature peak increases dramatically at the 60 kHz resonance range. This experimentally proves that signature change is significant when debonding occurs below the PZT–metal transducer.
Figure 2b shows the limitation of using the double-sided tape as the five impedance signatures seen in this figure were acquired by removing and reattaching the PZT–metal transducer onto the same area of the composite plate. The change is not significant but such change in signatures can cause false alarms when no damage has been experienced by the structure.
For evaluating the damage detection performance, the variations between the reference and corresponding signatures (after damage) were quantified using root-mean-square deviation (RMSD) in equations below. In the equations,
and
represents the real part of the reference and the corresponding impedance signatures, respectively.
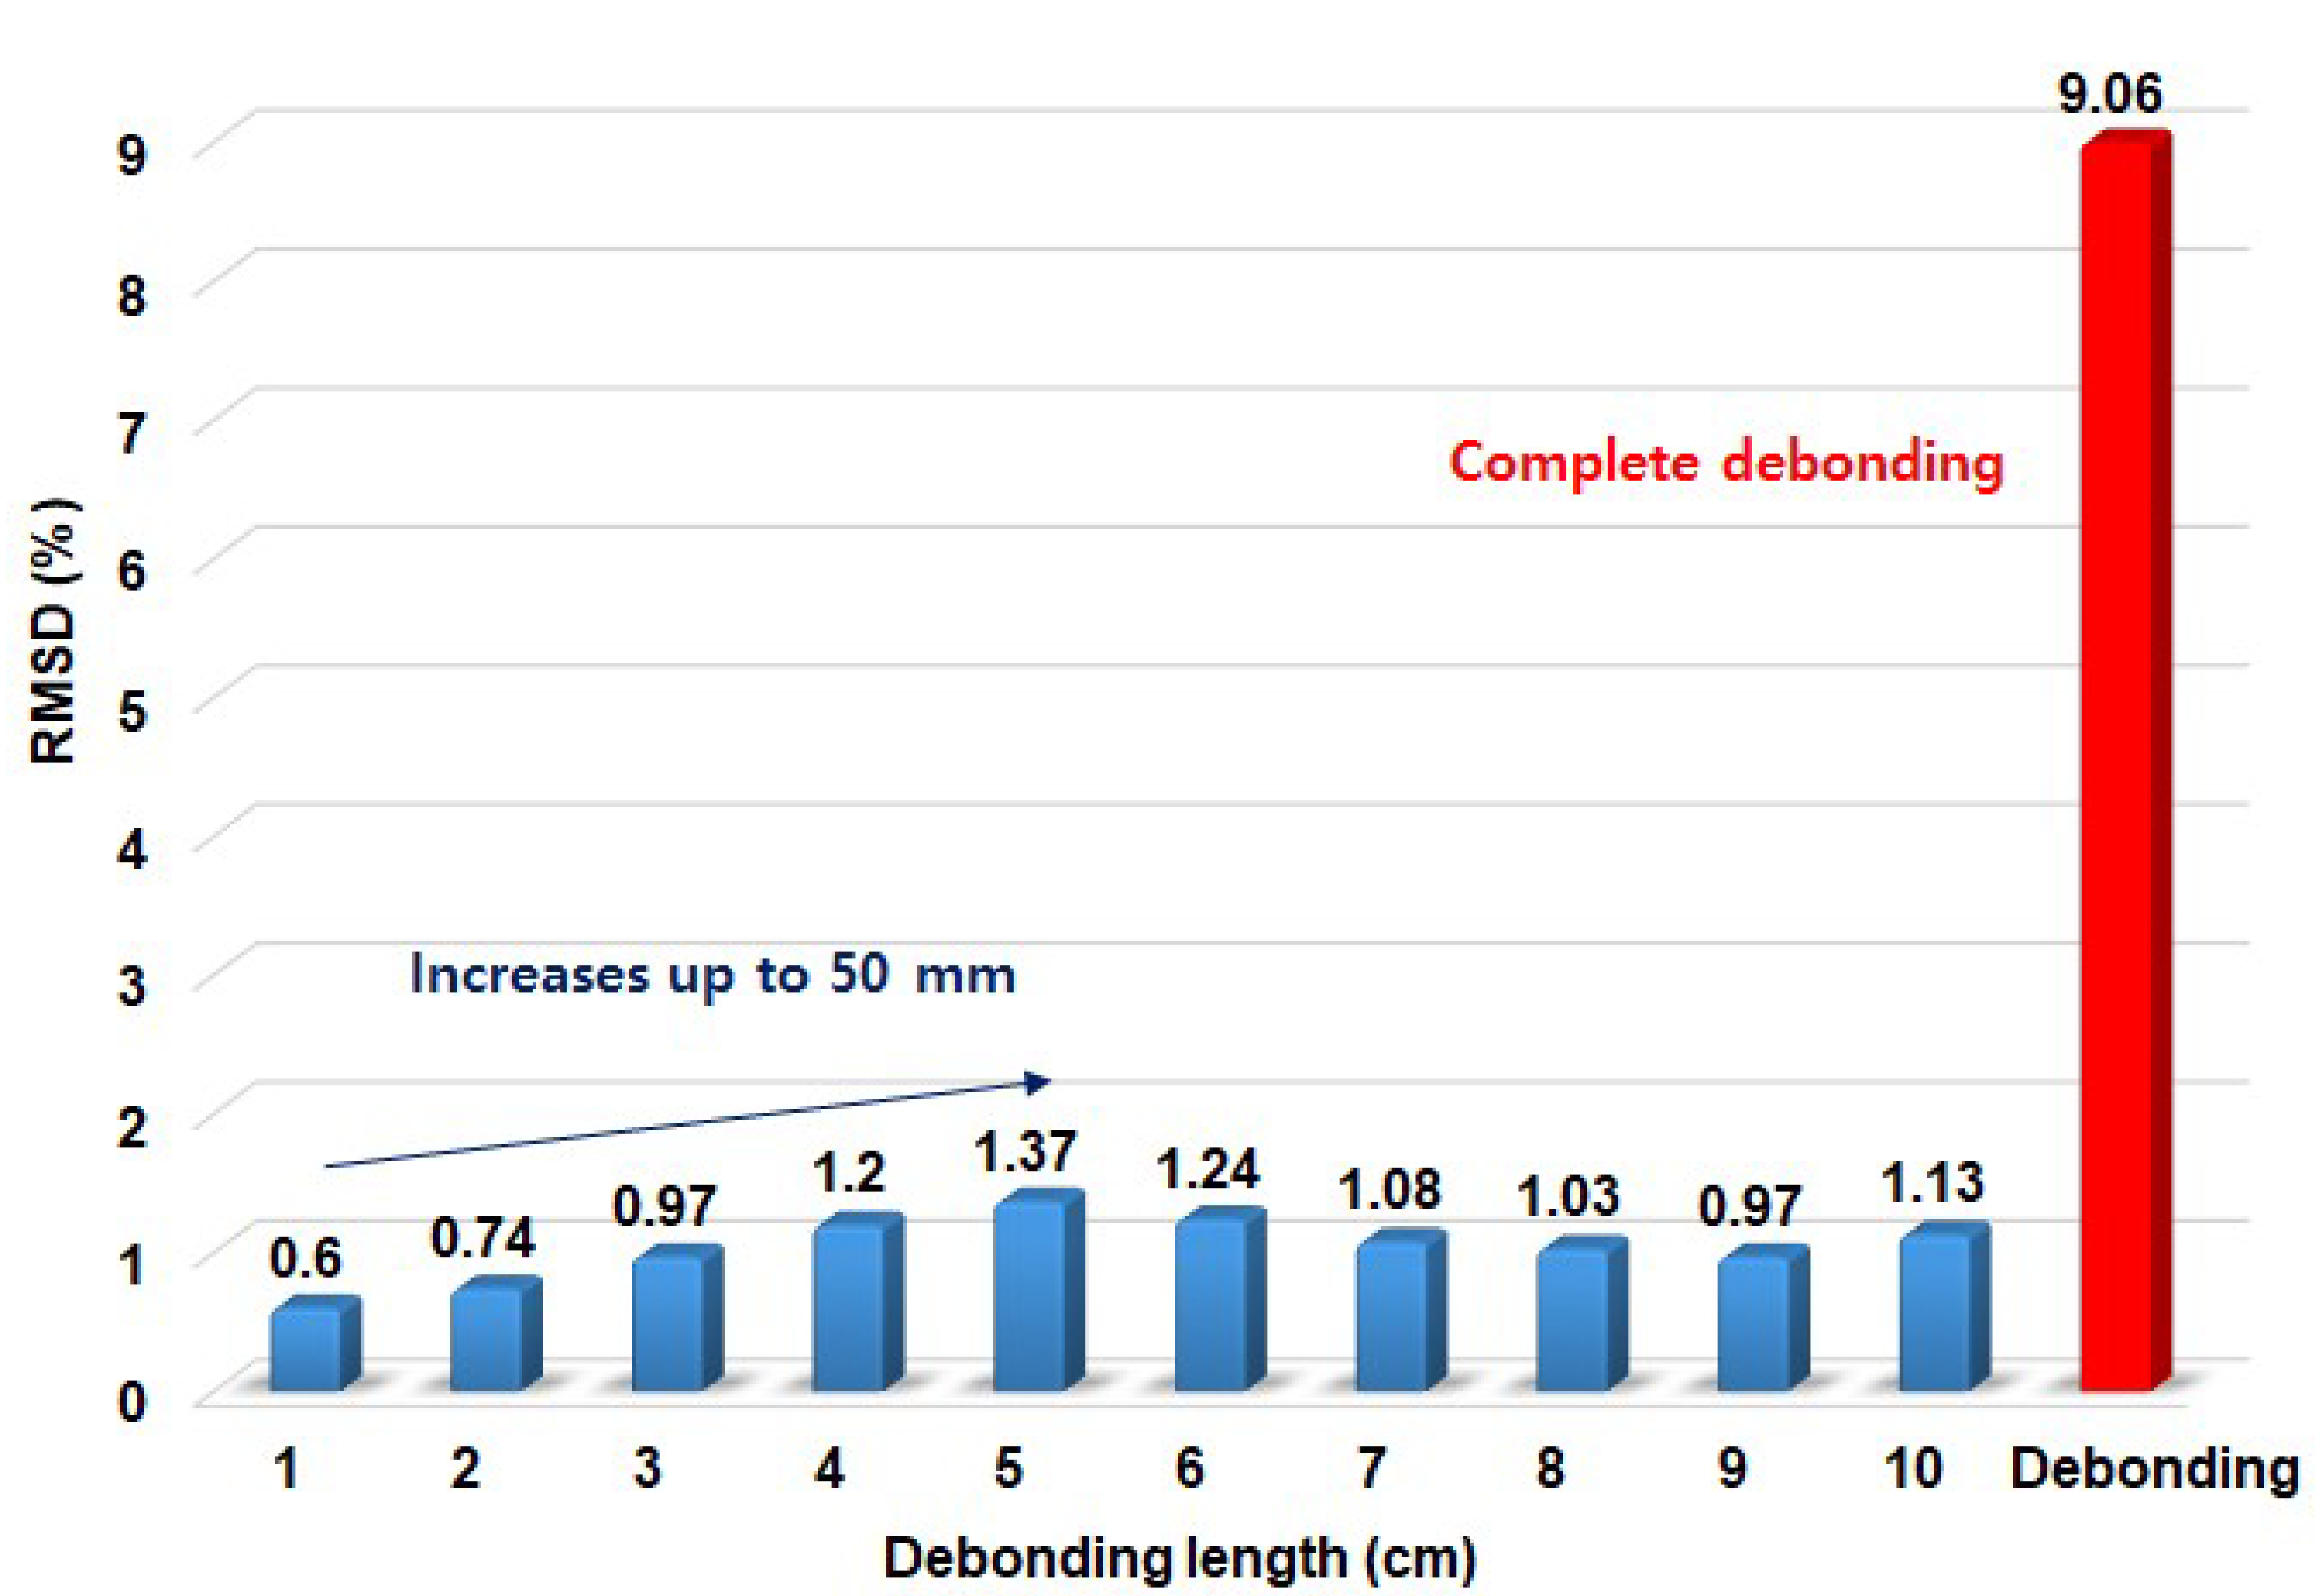
Looking at
Figure 3, the RMSD values with the reference signature being the intact case, the RMSD value was 0.6% with 1 cm debonding and increased to 1.37% with 5 cm debonding. However the RMSD values decreased down to 0.97% with 9 cm debonding. This shows the limitation of debonding detection using the PZT–metal transducer, where it seems that the highest value that can be obtained from this test is 1.37%. With full removal of the bottom composite plate, the RMSD resulted in 9.06%.
Table 1 summarizes all the five test results including the data from
Figure 3. Although the same tests were conducted, the RMSD results were different. With Test 2, all the RMSD values were below 1% and it was difficult to observe the increasing trend subjected to increase in debonding length. However, debonding below the PZT–metal transducer resulted in 10.29% once again proving that this NDT technique is effective at finding damage below the sensor. For Test 3, the increasing trend was clearly seen with increase in debonding length as the RMSD value started from 0.66% and rose to 2.31% with 8 cm debonding length. Here, the RMSD value with full removal of the bottom plate resulted in 10.98%, which shows that the reliability of finding defects located under a PZT–metal transducer is very effective. Tests 4 and 5 show similar results compared to Test 2 where all the RMSD values were below 1%, where the values generally increase with increase in debonding length. With full removal of the plate, the RMSD values were 11.9% and 15.32% for Tests 4 and 5, respectively.
3. FEM (Finite Element Method) Simulation for Smaller PZT Patches
From the previous section, although the PZT–metal transducer was able to detect debonding damage of composite plates, the impedance signature changed dramatically when debonding occurred below the attached PZT transducer. For this reason, various tests with smaller PZT sizes should be tested to validate the suitability of using smaller PZT transducers, as using smaller PZT could detect small debonding areas. However, using PZT in smaller sizes (compared to the conventional size of 10 mm × 10 mm with 0.5 mm thickness) would be very difficult to perform experimentally. For an example, it would be impossible to perform an EMI technique using a 0.1 mm square PZT as soldering of the positive and negative sides of the PZT would be difficult. Thus, to first check the reliability of the simulation, commercial FEM software ANSYS Workbench was used with coupled field analysis. Here, finite element couples the effects of interrelated physics within the element matrices making the electromechanical impedance simulation possible. In addition, the convergence criteria in ANSYS was unaltered as the program itself produced acceptable performance compared to the experimental result. Using ANSYS, a model representing the PZT–metal transducer used in the previous section with 6407 nodes and 1096 elements was created as shown in
Figure 4. The average element quality was 0.959. In addition, the properties used for the PZT material can be seen in
Table 2. The properties for the metal part of the PZT–metal transducer were selected from the ANSYS Workbench engineering database (stainless steel).
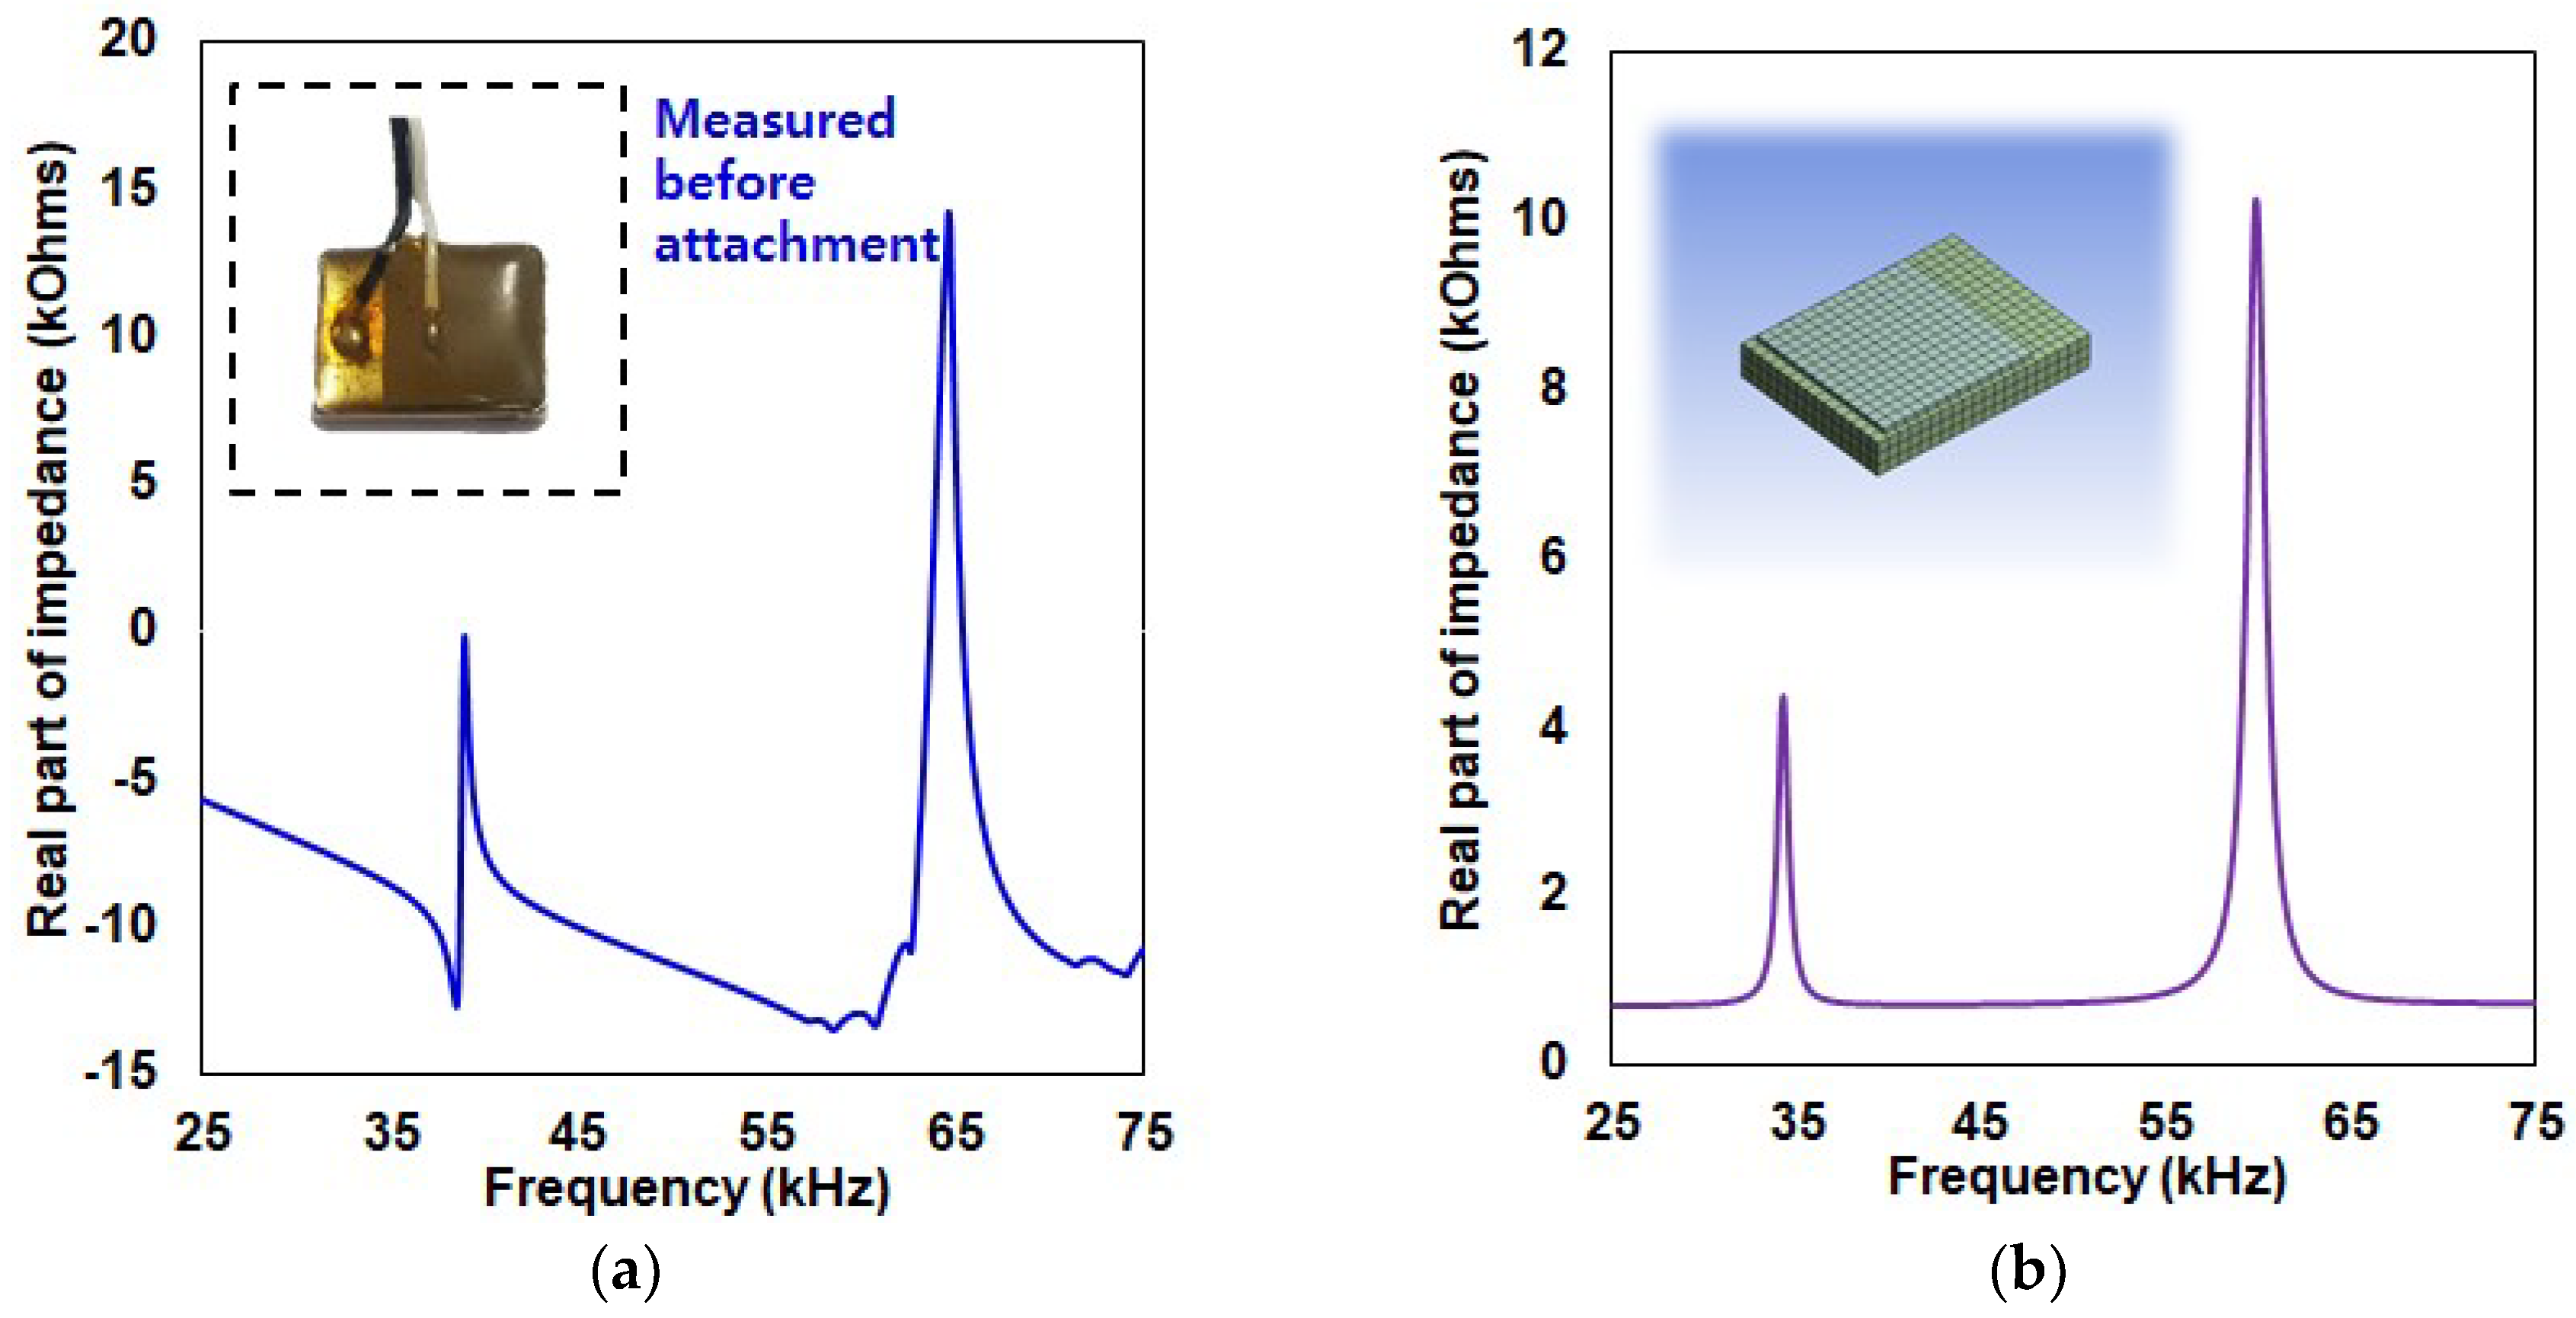
Figure 5a shows the actual impedance signature of the PZT–metal transducer in air using the AD5933 evaluation board, and
Figure 5b shows the impedance signature from the ANSYS simulation. Comparing both results, although the shapes of the signature are slightly different, the resonance frequency range from the FEM simulation result matches very well with the actual experimental result. Two large resonance peaks exist, where the larger one is located at around 65 kHz for both results (
Figure 5a,b), and the smaller resonance peak for both signatures is located near 40 kHz. Furthermore, the amplitude of the large peak is around twice the size of the smaller resonance peak.
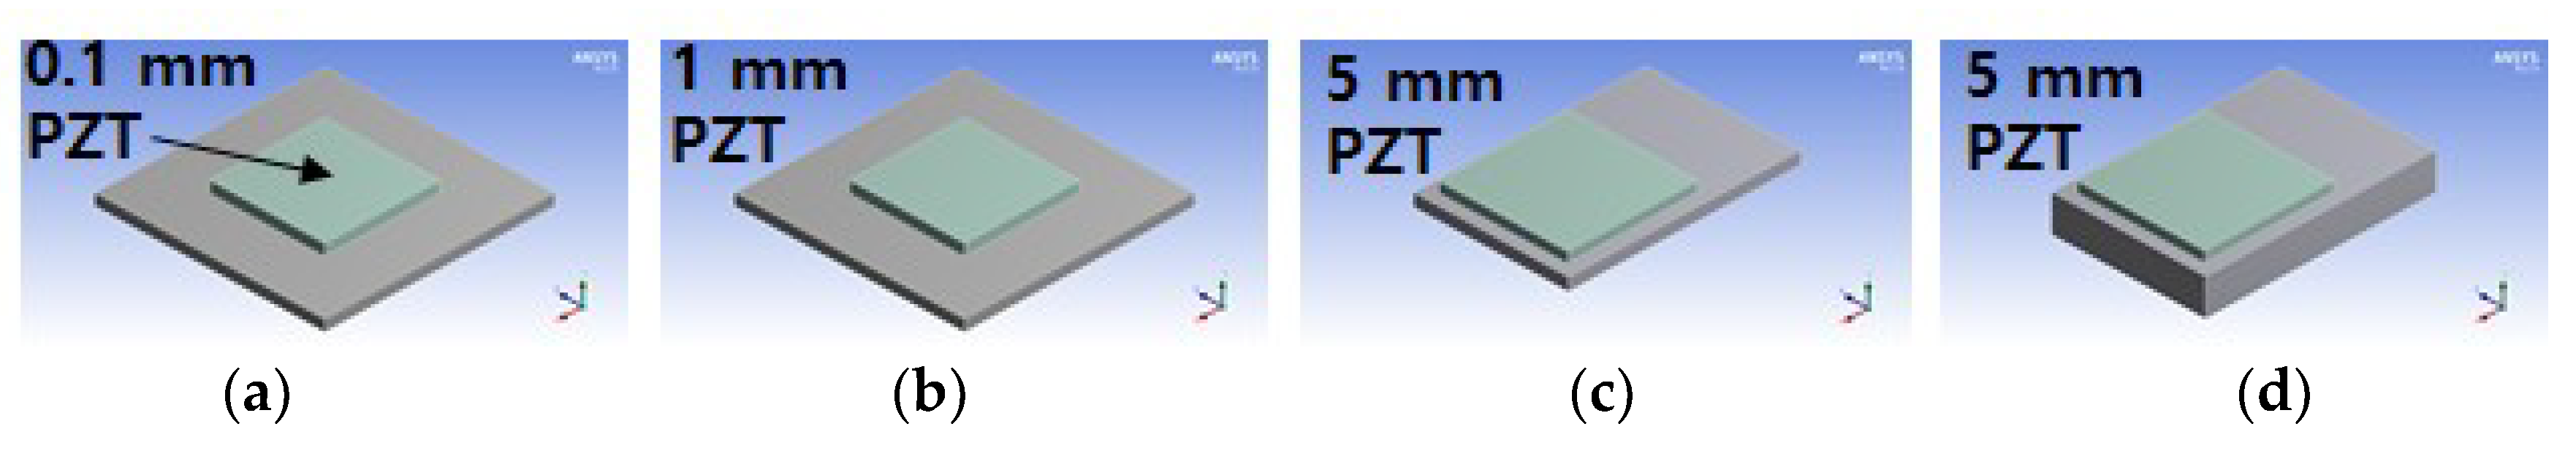
Now that we had confirmed that the FEM simulation result was reliable, four more FEM models were created to evaluate the impedance signatures. PZT patches sizing from as small as 0.1–5 mm were created to investigate for resonance.
Figure 6a shows the FEM model with a 0.1 mm × 0.1 mm PZT patch with 0.01 mm thickness attached to a square metallic material on the bottom (0.2 mm × 0.2 mm with 0.01 mm thickness),
Figure 6b looks identical to
Figure 6a but the size is 10 times larger. The PZT size is 1 mm × 1 mm with 0.1 mm thickness with the bottom metal plate of 2 mm × 2 mm with 0.1 mm thickness.
Figure 6c has a 5 mm × 5 mm size PZT with 1 mm thickness and a metal size of 6 mm × 9 mm with 0.5 mm thickness. The last FEM model,
Figure 6d, has the same dimension as the previous figure but with the thickness of the metal plate increased to 1.5 mm. All four models were meshed with element quality over 0.9 to achieve the best outcome before obtaining the simulation results.
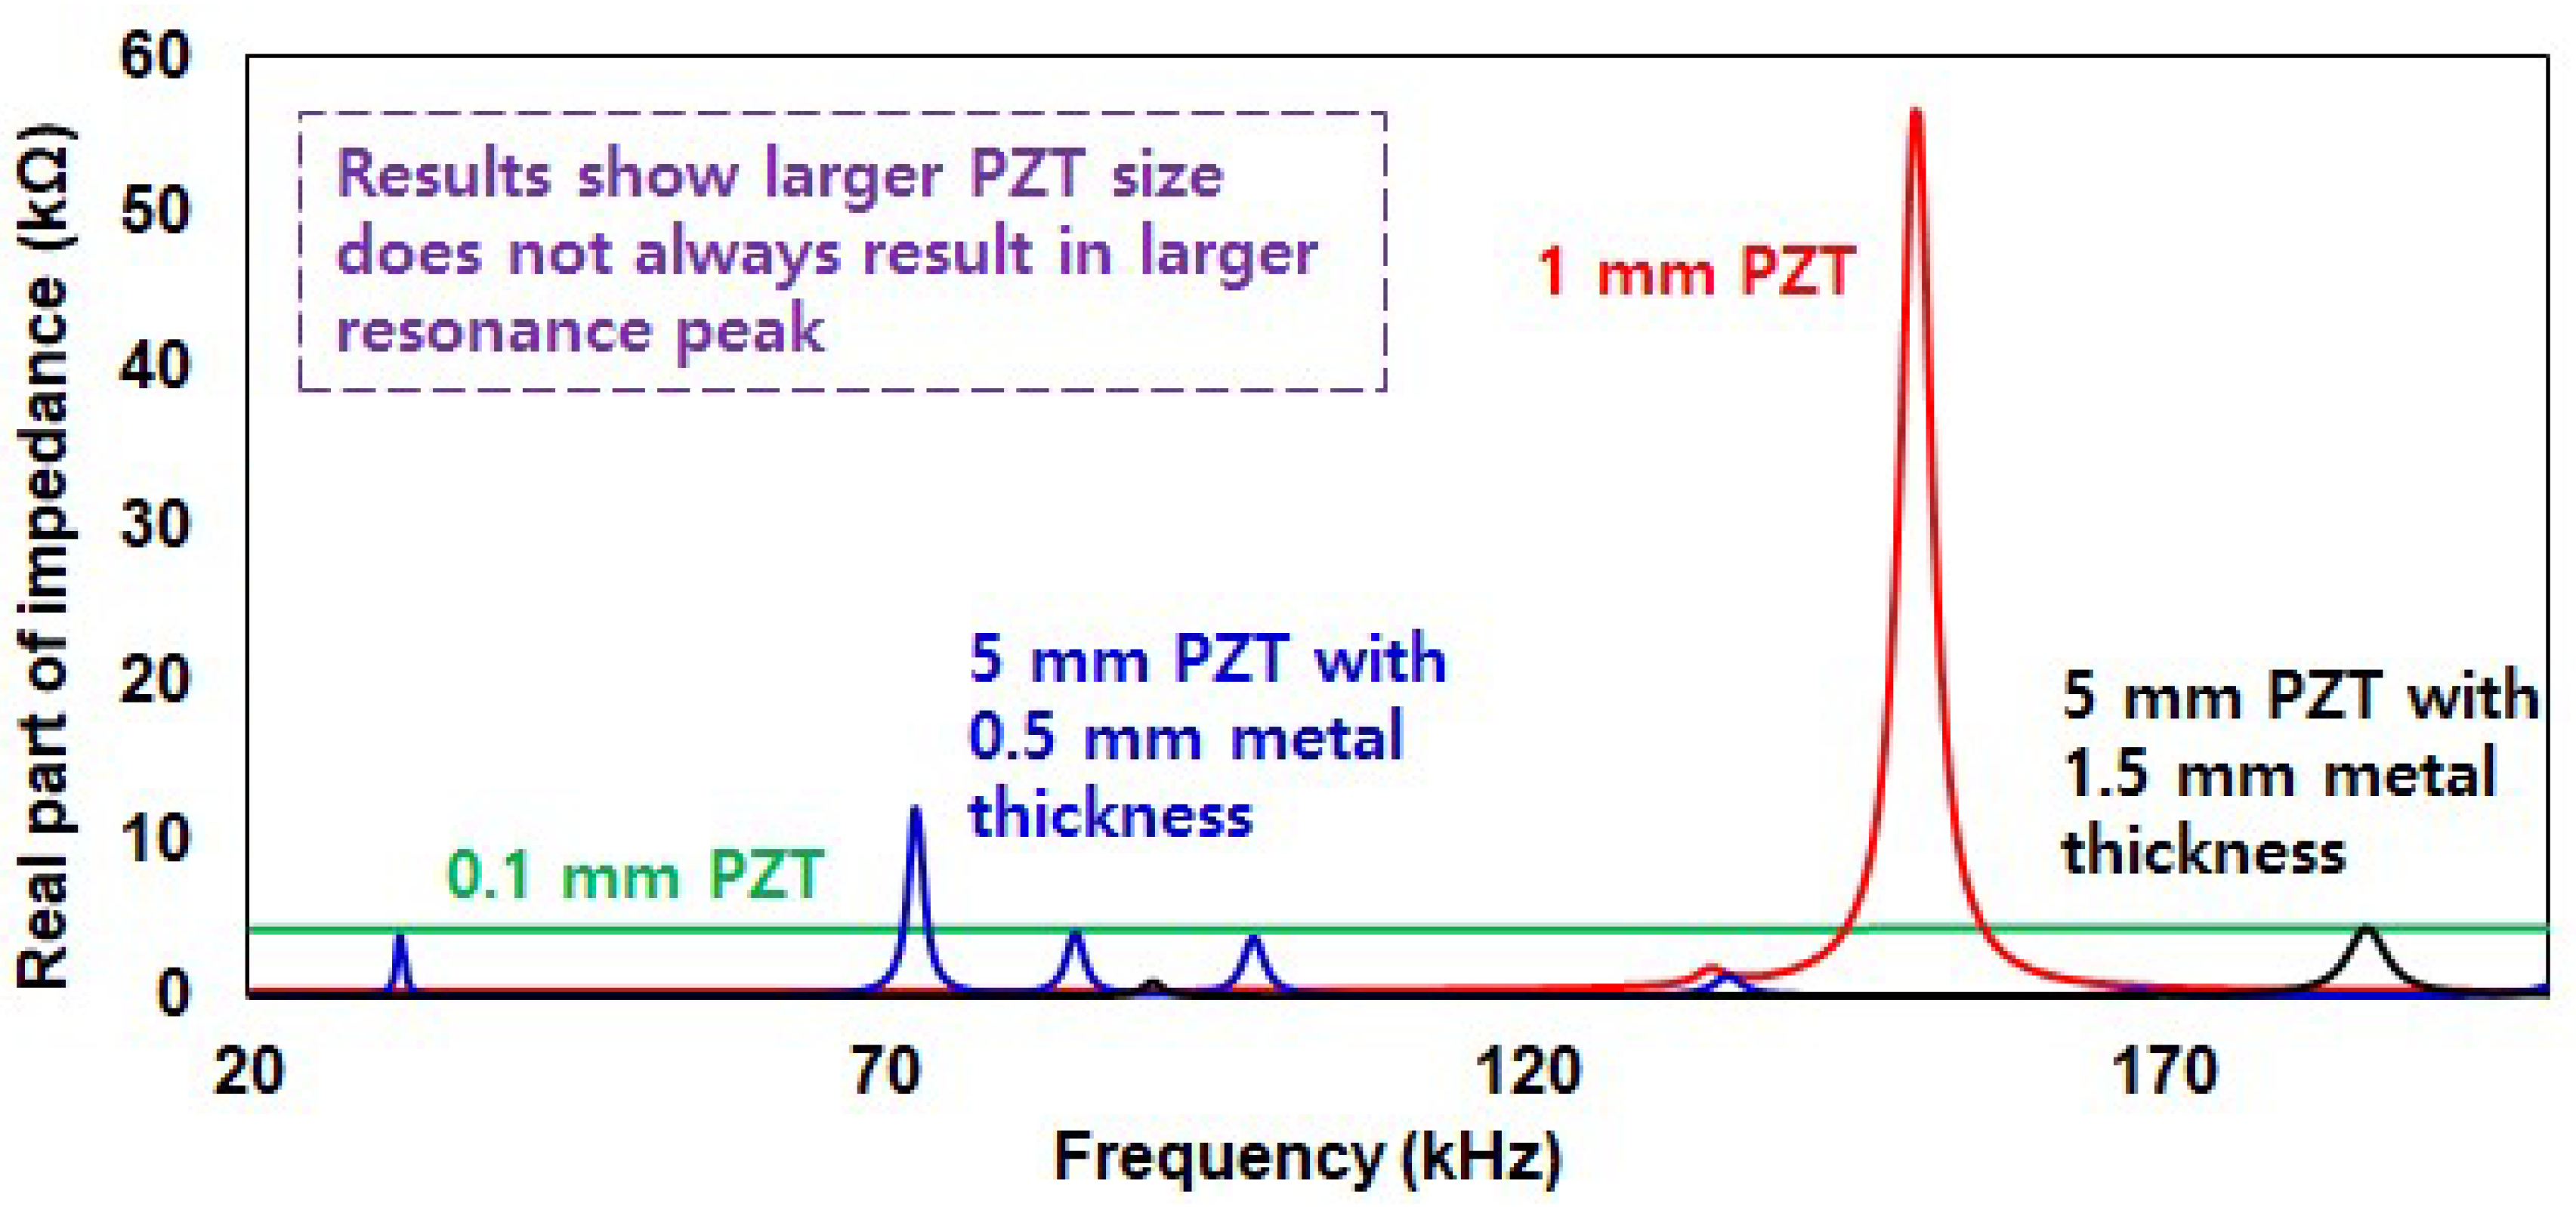
Figure 7 shows the impedance signatures acquired from the four FEM models in the frequency range 20–200 kHz. With the 0.1 mm square PZT patch (
Figure 6a), there is no resonance at all. This suggests that using such a small PZT will possibly result in a failure when detecting damage unless resonance can be found over the 200 kHz frequency range. Observing the 1 mm square PZT patch (
Figure 6b), it has the highest value compared to the rest of the signatures. Larger than the signatures with 5 mm square PZTs (
Figure 6c,d). This shows that larger PZT size does not always result in bigger amplitude. The two impedance signatures for the last two FEM models have completely different frequency ranges. The thinner bottom metal layer FEM model resulted in multiple resonance range with five resonance peaks below 150 kHz, whereas the last FEM model with the thicker metal layer had two resonance peaks (very small one at 90 kHz and another one near 200 kHz). Although these simulation results were not verified with experimental results due to the fact that it is virtually impossible to conduct experiments with PZT sizes of 0.1 mm × 0.1 mm × 0.01 mm, the fact remains that PZT sizes smaller than 10 mm × 10 mm can be used to detect damage as long as resonance is found. Furthermore, changing the bottom metal plate can also create resonance to overcome the problem of resonance-free signatures, which may cause the EMI technique to fail at detecting damage.
4. Conclusions
In this study, a work toward creating a cheap and portable nondestructive testing (NDT) method known as the electromechanical impedance (EMI) technique was carried out. Since the EMI technique requires the brittle PZT patch to be permanently attached to the structure for damage detection analysis, the idea of making the attachment temporarily was tested using a double-sided tape. Such an approach made the PZT–metal transducer very easy to be attached and detached. In addition, regardless of the temporary attachment approach, debonding damage of a glass fiber epoxy composite could be detected by monitoring the changes in the impedance signatures. However, this change was not as significant as the change subjected to debonding that occurred right below the PZT–metal transducer. This study experimentally showed that the debonding damage is best detected when it happens under the PZT patch. Therefore, to seek the possibility of detecting smaller debonding size, the size of the PZT patch had to be smaller than the conventional size of 10 mm × 10 mm with 0.5 mm thickness. Thus, the finite element analysis tool known as ANSYS Workbench was used to conduct simulations with smaller PZT patches as small as 0.1 mm × 0.1 mm with 0.01 mm thickness, virtually impossible to conduct experiment. Four different models were created with small PZT patches to find out that the size of the PZT was not the most important factor as the 1 mm square sized PZT patch showed resonance with highest peak amplitude.
Overall from this work, we found that the EMI technique can be made into a portable system, where the PZT transducer can be attached simply using a double-sided tape. Regardless of the damping effect, which may cause the impedance signatures to be less sensitive when subjected to damage, the results from this study have demonstrated its possibilities. Furthermore by conducting simulation studies, the PZT size can be further reduced for a successful debonding detection of composite structures.


