A Weighted Estimation Algorithm for Enhancing Pulsed Eddy Current Infrared Image in Ecpt Non-Destructive Testing


Abstract
:1. Introduction
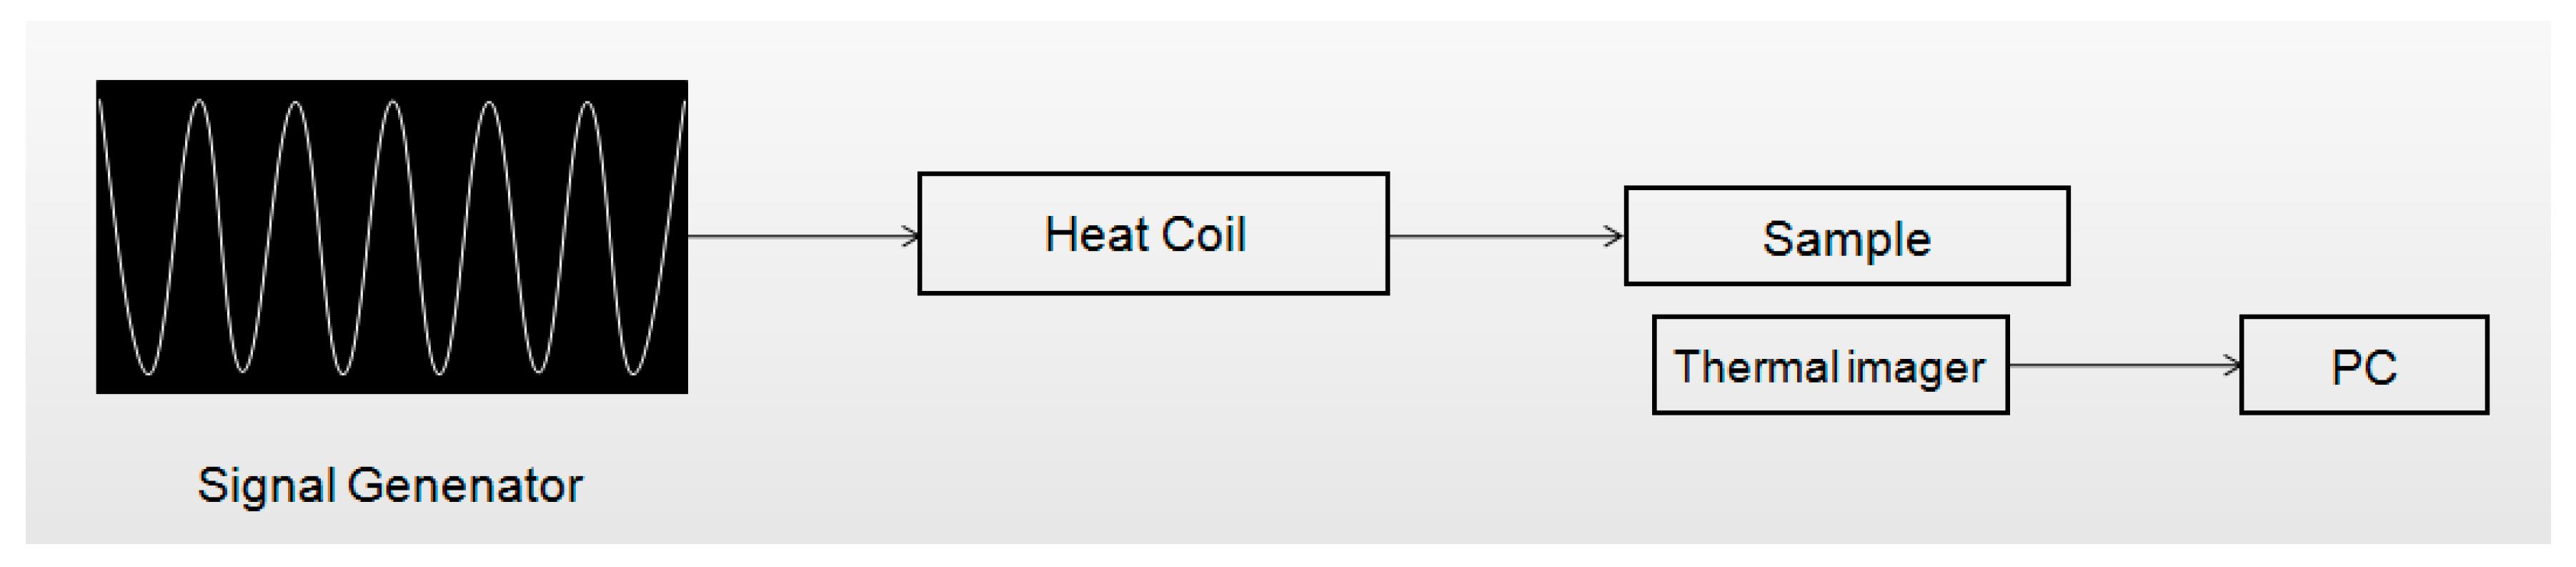
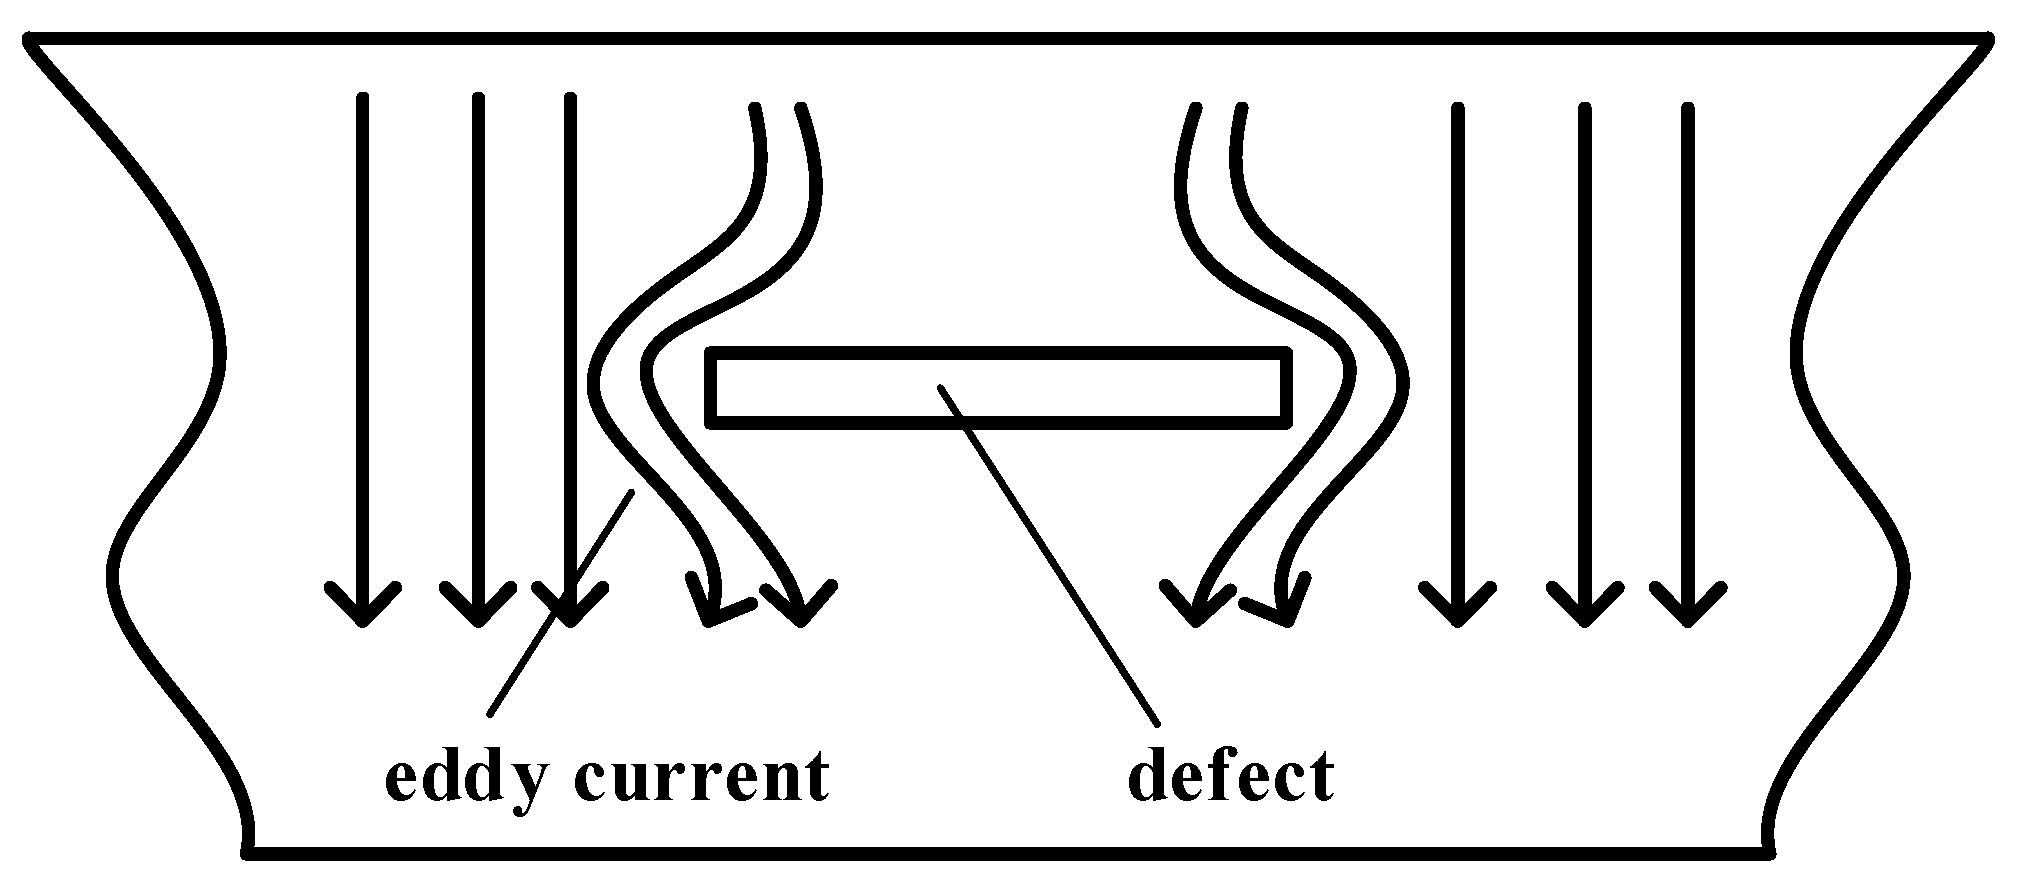
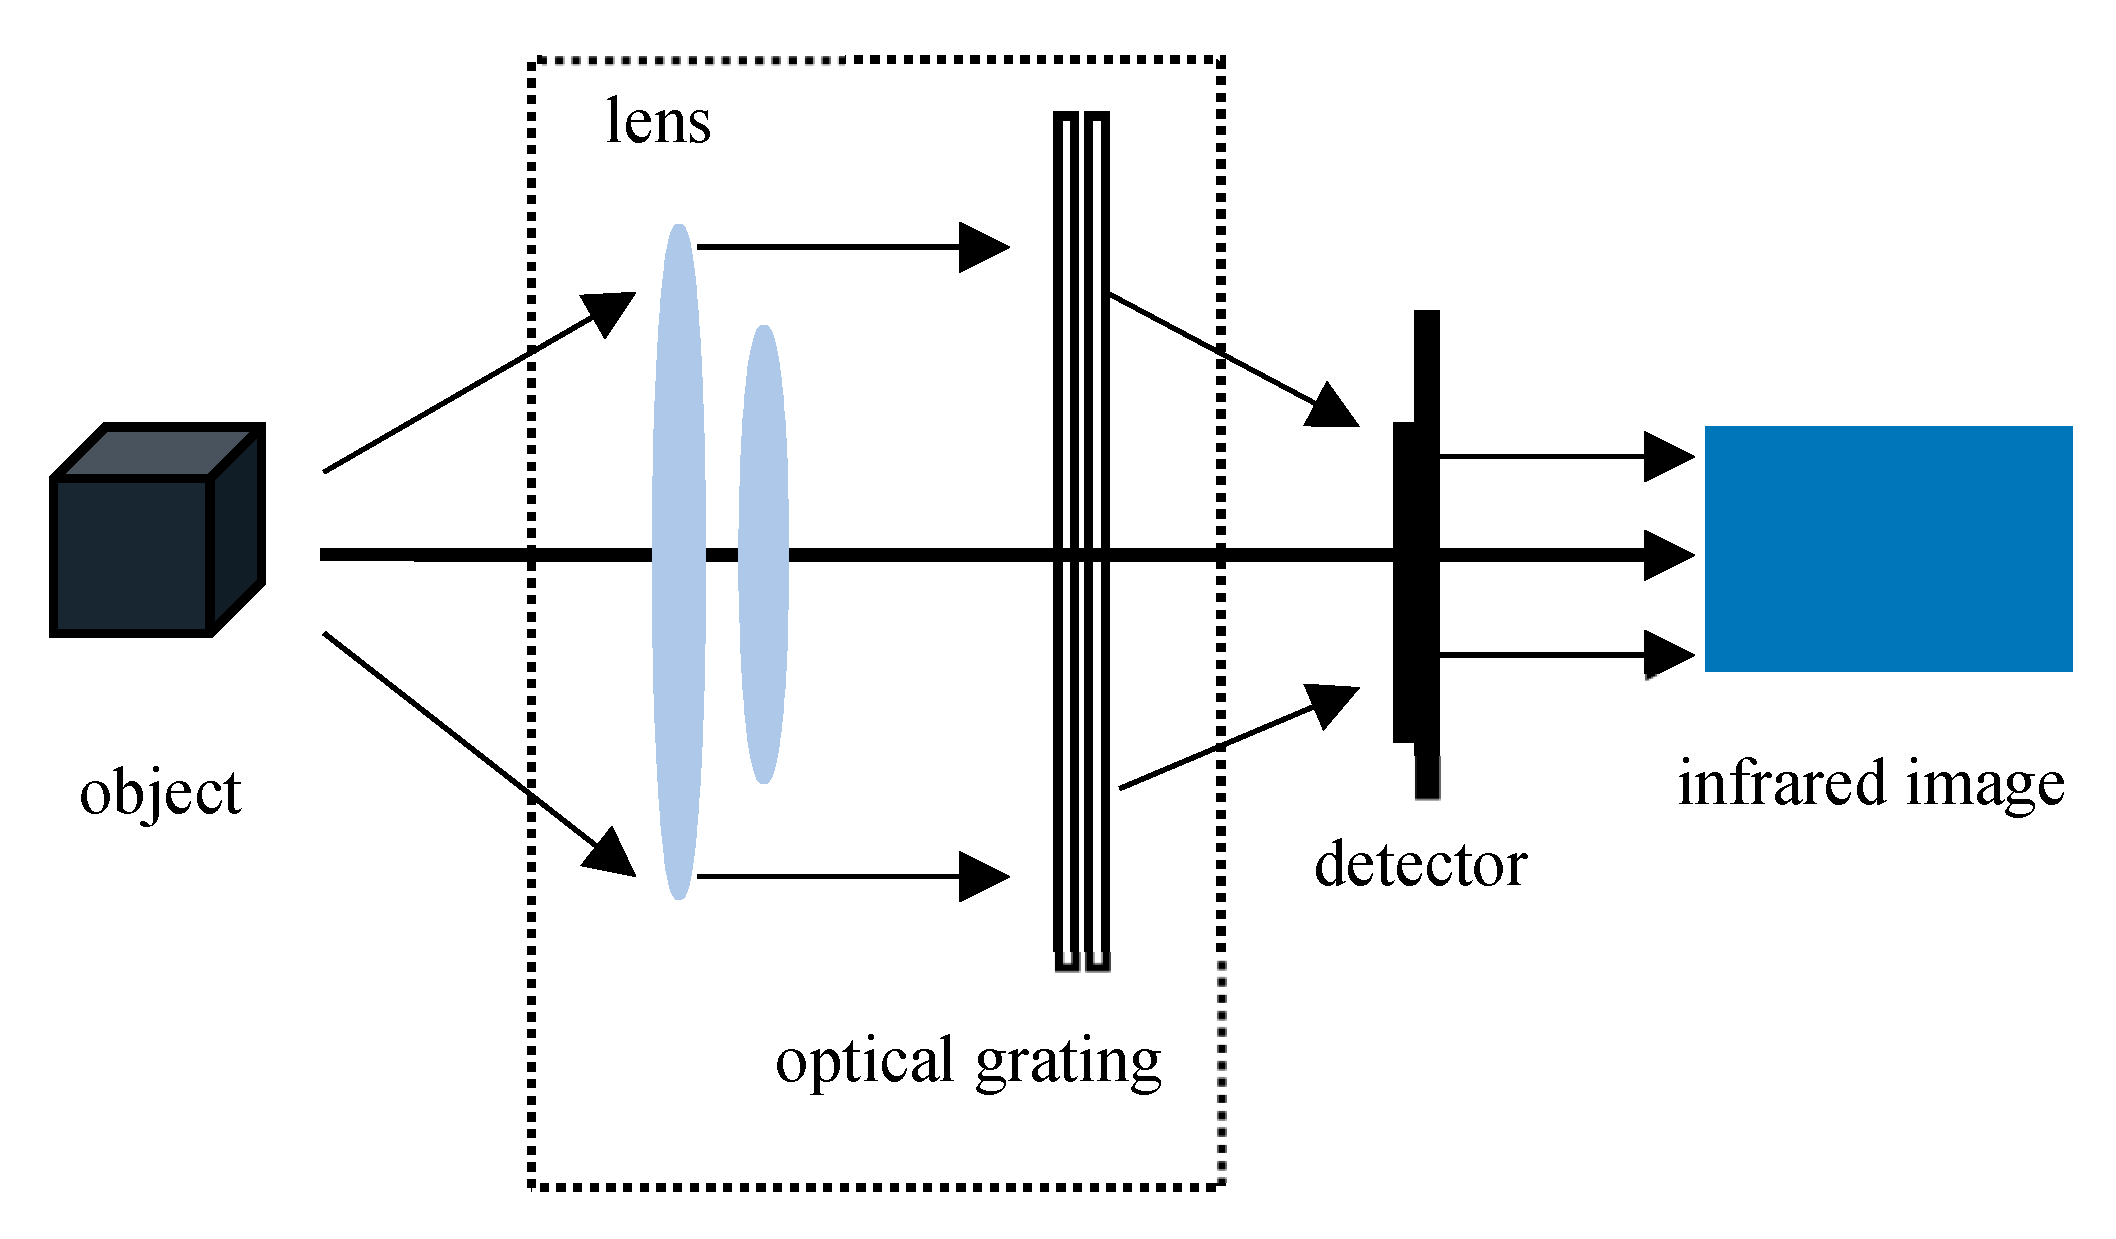
2. Experiment Setup
3. Proposed Algorithm
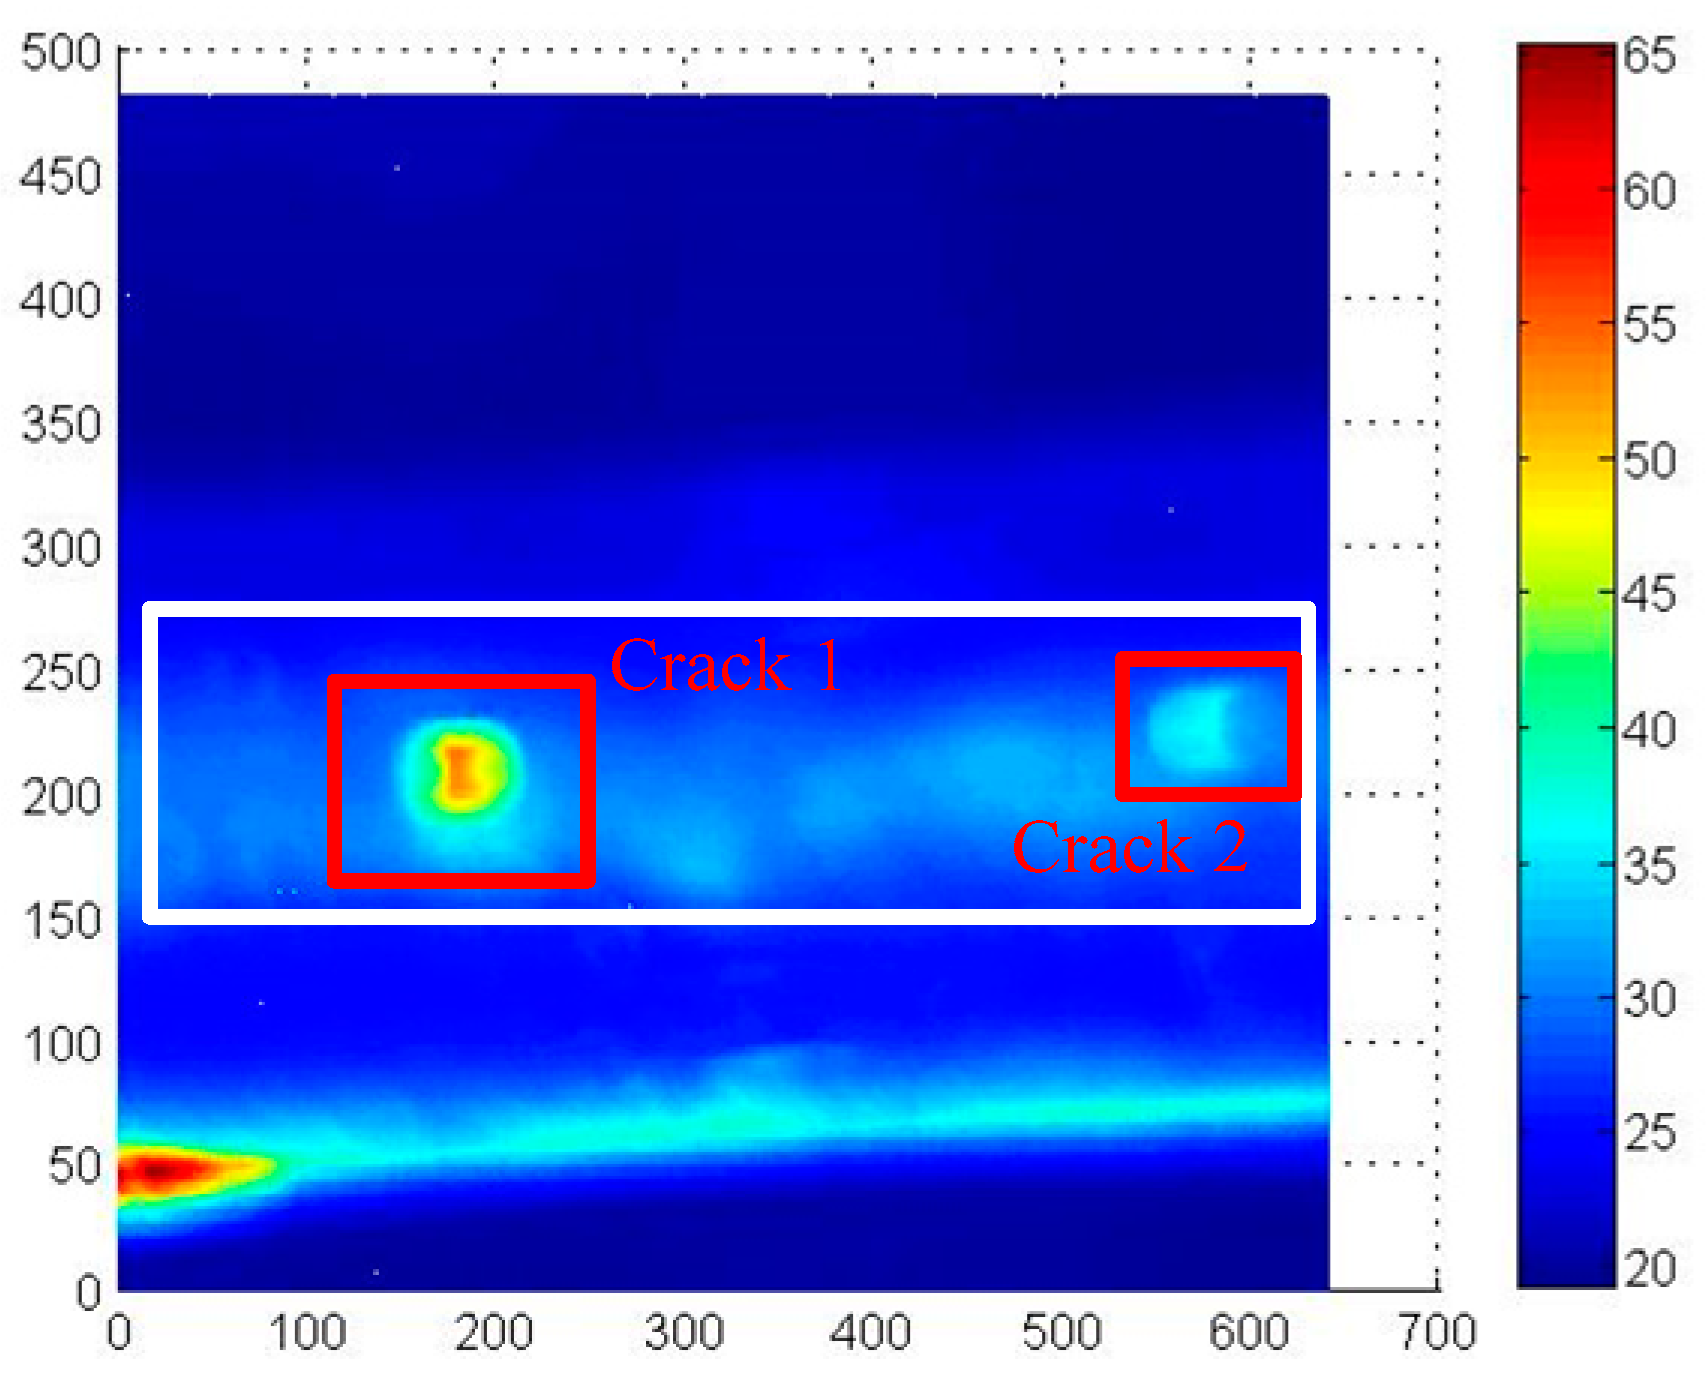
4. Results and Discussion
5. Conclusions
Author Contributions
Funding
Conflicts of Interest
References
- Ebrahimkhanlou, A.; Athanasiou, A.; Hrynyk, T.D.; Bayrak, O.; Salamone, S. Fractal and Multifractal Analysis of Crack Patterns in Prestressed Concrete Girders. J. Bridge Eng. 2019, 24, 04019059. [Google Scholar] [CrossRef]
- Ebrahimkhanlou, A.; Salamone, S.; Ebrahimkhanlou, A.; Azad, A.R.G.; Kreitman, K.; Helwig, T.; Williamson, E.; Engelhardt, M. Acoustic emission monitoring of strengthened steel bridges: Inferring the mechanical behavior of post-Installed shear connectors. In Proceedings of the Nondestructive Characterization and Monitoring of Advanced Materials, Aerospace, Civil Infrastructure, and Transportation XIII, Denver, CO, USA, 4–7 March 2019. [Google Scholar]
- Ebrahimkhanlou, A.; Choi, J.; Hrynyk, T.D.; Salamone, S.; Bayrak, O. Detection of the onset of delamination in a post-Tensioned curved concrete structure using hidden Markov modeling of acoustic emissions. In Proceedings of the Sensors and Smart Structures Technologies for Civil, Mechanical, and Aerospace Systems 2018, Anaheim, CA, USA, 26–30 April 2018. [Google Scholar]
- Tian, L.; Cheng, Y.; Yin, C.; Ding, D.; Song, Y.; Bai, L. Design of the MOI method based on the artificial neural network for crack detection. Neurocomputing 2017, 226, 80–89. [Google Scholar] [CrossRef]
- Park, H.; Choi, M.; Park, J.; Kim, W. A study on detection of micro-Cracks in the dissimilar metal weld through ultrasound infrared thermography. Infrared Phys. Technol. 2014, 62, 124–131. [Google Scholar] [CrossRef]
- Rodríguez-Martin, M.; Lagüela, S.; González-Aguilera, D.; Arias, P. Cooling analysis of welded materials for crack detection using infrared thermography. Infrared Phys. Technol. 2014, 67, 547–554. [Google Scholar] [CrossRef]
- Dapeng, C.; Hongxia, M.; Zhihe, X. Infrared Thermography NDT and Its Development. Comput. Meas. Control 2016, 4, 1–6. [Google Scholar]
- Plotnikov, Y.A.; Winfree, W.P. Advanced Image Processing for Defect Visualization in Infrared Thermography. Proc. SPIE 1998, 3361, 331–338. [Google Scholar]
- Liu, Z.P.; Hu, L.H.; Zhou, J.M.; Cai, L. Evaluation of Surface Defect Area in Metal Based on Infrared Thermal Image. Appl. Mech. Mater. 2014, 530, 171–174. [Google Scholar] [CrossRef]
- Min, Q.X.; Feng, F.Z.; Wang, P.F.; Zhang, C.S.; Zhu, J.Z. Recognition of contact interface defect in metal plate based on pulsed phase thermography. In Proceedings of the Prognostics & System Health Management Conference, Beijing, China, 21–23 October 2015. [Google Scholar]
- Fan, C.F.C.; Sun, F.S.F.; Yang, L.Y.L. A general quantitative identification algorithm of subsurface defect for infrared thermography. In Proceedings of the 2005 Joint 30th International Conference on Infrared and Millimeter Waves and 13th International Conference on Terahertz Electronics, Williamsburg, VA, USA, 19–23 September 2005. [Google Scholar]
- Meola, C.; Carlomagno, G.M. Recent advances in the use of infrared thermography. Meas. Sci. Technol. 2004, 15, 27. [Google Scholar] [CrossRef]
- Maldague, X. Applications of infrared thermography in nondestructive evaluation. In Trends in Optical Nondestructive Testing; Elsevier Science: Amsterdam, NL, USA, 2000; pp. 591–609. [Google Scholar]
- Avdelidis, N.P.; Hawtin, B.C.; Almond, D.P. Transient thermography in the assessment of defects of aircraft composites. Ndt E Int. 2003, 36, 433–439. [Google Scholar] [CrossRef]
- Wang, X. Transient Thermography for Detection of Micro-Defects in Multilayer Thin Films. Ph.D. Thesis, Loughborough University, Loughborough, UK, 2017. [Google Scholar]
- Chen, D.; Zhang, X.; Zhang, G.; Zhang, Y.; Li, X. Infrared Thermography and Its Applications in Aircraft Non-destructive Testing. In Proceedings of the 2016 International Conference on Identification, Information and Knowledge in the Internet of Things (IIKI), Beijing, China, 20–21 October 2016. [Google Scholar]
- Li, H.J.; Lin, J.G.; Mei, X.; Zhao, Z. Infrared Image Denoising Algorithm Based on Adaptive Threshold NSCT. In Proceedings of the 2008 Congress on Image and Signal Processing, Sanya, China, 27–30 May 2008. [Google Scholar]
- Ibarra-Castanedo, C.; Gonzalez, D.; Klein, M.; Pilla, M.; Vallerand, S.; Maldague, X. Infrared image processing and data analysis. Infrared Phys. Technol. 2004, 46, 75–83. [Google Scholar] [CrossRef]
- Wang, J.; Hong, J. A new self-Adaptive weighted filter for removing noise in infrared images. In Proceedings of the 2009 International Conference on Information Engineering and Computer Science, Wuhan, China, 9–20 December 2009. [Google Scholar]
- Voronin, V.; Tokareva, S.; Semenishchev, E.; Agaian, S. Thermal Image Enhancement Algorithm Using Local and Global Logarithmic Transform Histogram Matching with Spatial Equalization. In Proceedings of the 2018 IEEE Southwest Symposium on Image Analysis and Interpretation (SSIAI), Las Vegas, NV, USA, 4–10 April 2018. [Google Scholar]
- Bai, J.; Chen, Q.; Wang, X.; Qian, W. Contrast enhancement algorithm of infrared image based on noise filtering model. Infrared Laser Eng. 2010, 39, 777–780. [Google Scholar]
- Liu, T.; Zhang, W.; Yan, S. A novel image enhancement algorithm based on stationary wavelet transform for infrared thermography to the de-bonding defect in solid rocket motors. Mech. Syst. Signal Process. 2015, 62, 366–380. [Google Scholar] [CrossRef]
- Yin, A.; Gao, B.; Yun Tian, G.; Woo, W.L.; Li, K. Physical interpretation and separation of eddy current pulsed thermography. J. Appl. Phys. 2013, 113, 064101. [Google Scholar] [CrossRef]
- He, Y.; Pan, M.; Luo, F. Defect characterisation based on heat diffusion using induction thermography testing. Rev. Sci. Instrum. 2012, 83, 104702. [Google Scholar] [CrossRef]

© 2019 by the authors. Licensee MDPI, Basel, Switzerland. This article is an open access article distributed under the terms and conditions of the Creative Commons Attribution (CC BY) license (http://creativecommons.org/licenses/by/4.0/).
Share and Cite
Li, H.; Yu, Y.; Li, L.; Liu, B. A Weighted Estimation Algorithm for Enhancing Pulsed Eddy Current Infrared Image in Ecpt Non-Destructive Testing. Appl. Sci. 2019, 9, 4199. https://doi.org/10.3390/app9204199
Li H, Yu Y, Li L, Liu B. A Weighted Estimation Algorithm for Enhancing Pulsed Eddy Current Infrared Image in Ecpt Non-Destructive Testing. Applied Sciences. 2019; 9(20):4199. https://doi.org/10.3390/app9204199
Chicago/Turabian StyleLi, Hanchao, Yating Yu, Linfeng Li, and Bowen Liu. 2019. "A Weighted Estimation Algorithm for Enhancing Pulsed Eddy Current Infrared Image in Ecpt Non-Destructive Testing" Applied Sciences 9, no. 20: 4199. https://doi.org/10.3390/app9204199
APA StyleLi, H., Yu, Y., Li, L., & Liu, B. (2019). A Weighted Estimation Algorithm for Enhancing Pulsed Eddy Current Infrared Image in Ecpt Non-Destructive Testing. Applied Sciences, 9(20), 4199. https://doi.org/10.3390/app9204199