Article

Damage Assessment of Porcelain Insulators through Principal Component Analysis Associated with Frequency Response Signals

1
KEPCO Research Institute, Daejeon 34056, Korea
2
Department of Safety Engineering, Incheon National University, Incheon 22012, Korea
*
Authors to whom correspondence should be addressed.
Appl. Sci. 2019, 9(15), 3150; https://doi.org/10.3390/app9153150
Submission received: 2 July 2019 / Revised: 30 July 2019 / Accepted: 31 July 2019 / Published: 2 August 2019
(This article belongs to the Section Applied Industrial Technologies)

Abstract

:
More than 55% of porcelain insulators installed throughout Korea have exceeded their service life. Hence, utilities are extremely interested in determining the robustness of insulators in their systems. In this study, the identification of the peak ranges in the main natural modes by frequency response analysis, the principal component analysis (PCA) method by feature extraction in the time and frequency domains for the damage detection of porcelain insulators are investigated; among these, the PCA method, which utilizes frequency response data, is proposed for defect classification. The 67 porcelain insulators are secured as specimens from 154 kV transmission towers installed in various parts of Korea; their main materials are cristobalite and alumina. In these specimens, it is observed that the three types of damage, such as porcelain damage, cap damage, and internal damage, are those that are typically found in actual sites. Accordingly, the use of two eigenvectors (moments of real value and moments of imaginary value) considerably aids in the analysis of principal components. With the frequency response data, the material and damage types are found to be distinguishable. The classification accuracy is increased by including the third largest eigenvector (area of real value) in three-dimensional analysis. By employing frequency response data, the PCA method provides useful information for assessing the integrity of porcelain insulators; it may be used as basis for future machine learning applications.

1. Introduction

With the ever-increasing power demand as a result of modern industrial development, high-voltage transmission lines are required to transmit large amounts of electricity; consequently, this raises the demand for high levels of insulation for power lines. Moreover, although composite insulators have been developed in recent years, porcelain insulators remain in use in extremely high-voltage transmission applications in Korea.
Porcelain insulators are devices for mechanically securing and electrically isolating power lines in live transmission towers. They perform an important function in determining the reliability of transmission lines, as well as ensuring that insulation intervals are provided between transmission towers and transmission lines [1].
Of the total 1,223,538 porcelain insulators (manufactured by foreign companies) used in the 154 kV transmission lines throughout Korea, approximately 65% or 797,659 have exceeded their 30-year service life [2]. Although there is no immediate degradation in their insulation performance or mechanical failure as a result of exceeding their service life, utilities are concerned about aging insulators because these assets are key factors in the reliability of the power system. Hence, utilities prefer fast and accurate methods for detecting insulator defects.
In the past, insulator damage has been primarily investigated from an electrical standpoint; however, with this approach, mechanical conditions are difficult to measure. For example, one of the most commonly used methods is the insulation resistance measurement, in which each insulator in the string is tested by the continuous application of high voltage. With this technique, the resistance of the insulator is obtained by simply dividing the DC voltage applied to the insulator by the sum of the charging current and leakage current generated [3]. Another technique that is used by a number of utilities is based on the principle of electric field measurement. When the insulator has an electric fault or low level of insulation capacity, the axial and radial distributions along the insulator of the surrounding electric field produce distortion; the foregoing field condition is then detected and compared with that of the non-fault standard electric field. If no distinct difference is observed, then the insulator is judged normal; otherwise, it is deemed defective [4,5,6].
In order to detect the mechanical defects of insulators, investigation is underway to classify fault-state by various techniques, such as ultrasonic wave method with contact-type ultrasonic probes [7], noise measurement method using contactless microphones [8], and temperature measurement method using infrared cameras [9]. In addition, small damage inside the insulator is detected with high accuracy using radiation such as CT (Computed Tomography) and MRI (Magnetic Resonance Imaging) [10]. In recent years, a method of detecting defects in appearance through imaging of an insulator using an unmanned aerial vehicle (UAV) has been studied [11]. However, most of these methods are significantly influenced by environmental conditions, such as seasons, weather, illumination, temperature, humidity, and solar flux [3,12,13,14]. The use of ultrasonic testing also has its limitations: It is problematic and time consuming to scan the entire surface [7]; using radiation is a problem in test time and cost, and there is a high risk in the test method [10]; and using UAV is easy, but it can only detect insulators breakdown [11].
In this study, the frequency response function (FRF) method is employed to facilitate mechanical damage measurements and minimize the influence of the surrounding environment in such measurements. In the field of machinery, frequency response analysis (FRA) using FRF is mainly used for setting the resonant frequency of automotive frames [15]. In the field of electricity, it is employed in diagnosing internal abnormalities of the winding and fault of core earths within power transformers to assess system integrity [16,17,18,19,20]. In the field of civil engineering, FRA is used to estimate the locations and severities of structural damage as part of structural health monitoring [21].
Based on the FRA used in these various fields, a large amount of data may be involved; accordingly, it is necessary to reduce the amount of data while retaining the principal characteristics.
The principal component analysis (PCA) method is applied as a technique to test multiple objects or to analyze numerous results obtained from different locations. PCA has been found effective in identifying trends in analysis and results involving large amounts of data [22,23,24,25,26].
In this study, three typical types of defects in the porcelain insulators are investigated by PCA. Frequency response analysis and principal component analysis based on frequency response signals are presented in order to distinguish the characteristics of intact and damaged insulators from the collected data.

2. Materials and Methods

2.1. Test Specimen

The main materials of the porcelain insulator used in the experiment are cristobalite and alumina. In this study, the aim was to identify the damage type of porcelain insulators for cristobalite material. In addition, the insulators with alumina were used to confirm the possibility of material separation with cristobalite. A total of 67 specimens were tested: 47 were cristobalite and 20 were alumina. Moreover, to study damage, 57 were intact specimens, 4 had damaged porcelain, 3 had damaged caps, and 3 had artificial internal damage as presented in Table 1. Thus, three types of defects were selected for this study.
First, in the case of insulators with damaged porcelain, there were specimens with intentionally broken discs and others had radial cracks caused by lightning.
Second, if the cap was damaged, then it could be regarded as damage in the bracket because of persistent fatigue or sudden increase in tensile load.
Third, internal damage in insulators can mimic cracks that can occur inside the porcelain because of high stresses that cannot be visually confirmed; such cracks are generated during the insulator manufacturing process or under overvoltage conditions.

2.2. Frequency Response Function (FRF)

The test specimens were manufactured by the NGK insulators, Ltd. in Japan; it is difficult to verify the exact properties of porcelain and cement because of various variables. Consequently, there is a limit in verifying the theoretical FRFs. The FRF is calculated by Equation (1) using experimental data [27]; it is the relationship between the power spectral density, Pxx(f), of the signal measured by the impact hammer, and the signal cross power spectral density, Pxy(f), measured by the accelerometer:
FRF = Pxy ( f ) / Pxx ( f ) .

2.3. Principal Component Analysis (PCA)

The principal component analysis is one of the statistical techniques that simplify datasets. This was proposed by Pearson in 1901 as a problem in geometric optimization to determine a plane that best fits n-dimensional space in the concept of least squares [23]; it was subsequently proposed by Hotelling in 1936. In the analysis of the correlation between two sets of variables, the lower independent variables that determine the variation of the original n variables are called components.
The most modern PCA theory was established as follows. PCA is a linear transformation that converts data for a new coordinate system. The new variable set, which is the main variable, is a linear function of the original variable and has no correlation; the largest variance because of data projection appears in that direction. The first vector has the first largest variance, and the second vector has the second largest variance [25]. This can be achieved by obtaining a covariance matrix for the entire dataset and calculating the eigenvectors and eigenvalues of the covariance matrix; thereafter, these are sorted according to decreasing eigenvalues. The procedure is illustrated in Figure 1 [26]. However, PCA bias is not always appropriate; actually, a vector with a low variance may be highly predictive.
PCA using the covariance matrix calculation by extracted features, as shown in Figure 1, is performed as follows [26].
Given that a feature data matrix (X = [x1, x2, …, xN]) has a total number of N samples, and xi represents the ‘i’th sample, calculate the mean of all samples using the following:
μ = 1 N i = 1 N x i .
The deviation (D) is calculated by subtracting the mean (μ) from all samples as follows:
D = { d 1 , d 2 , , d N } = i = 1 N x i μ .
The covariance matrix (Σ) is calculated by the following:
= 1 N 1 D D T .
Calculate the eigenvectors (V) and eigenvalues (λ) of the covariance matrix (). Thereafter, sort the eigenvectors according to their corresponding eigenvalues.
Select the eigenvectors that have the largest eigenvalues, W = {v1, …, vk}; the use of selected eigenvectors (W) could represent the projection space of PCA. All samples could be projected on the lower dimensional space of PCA (V) by Y = WT ∗ D.

2.4. Test Methods

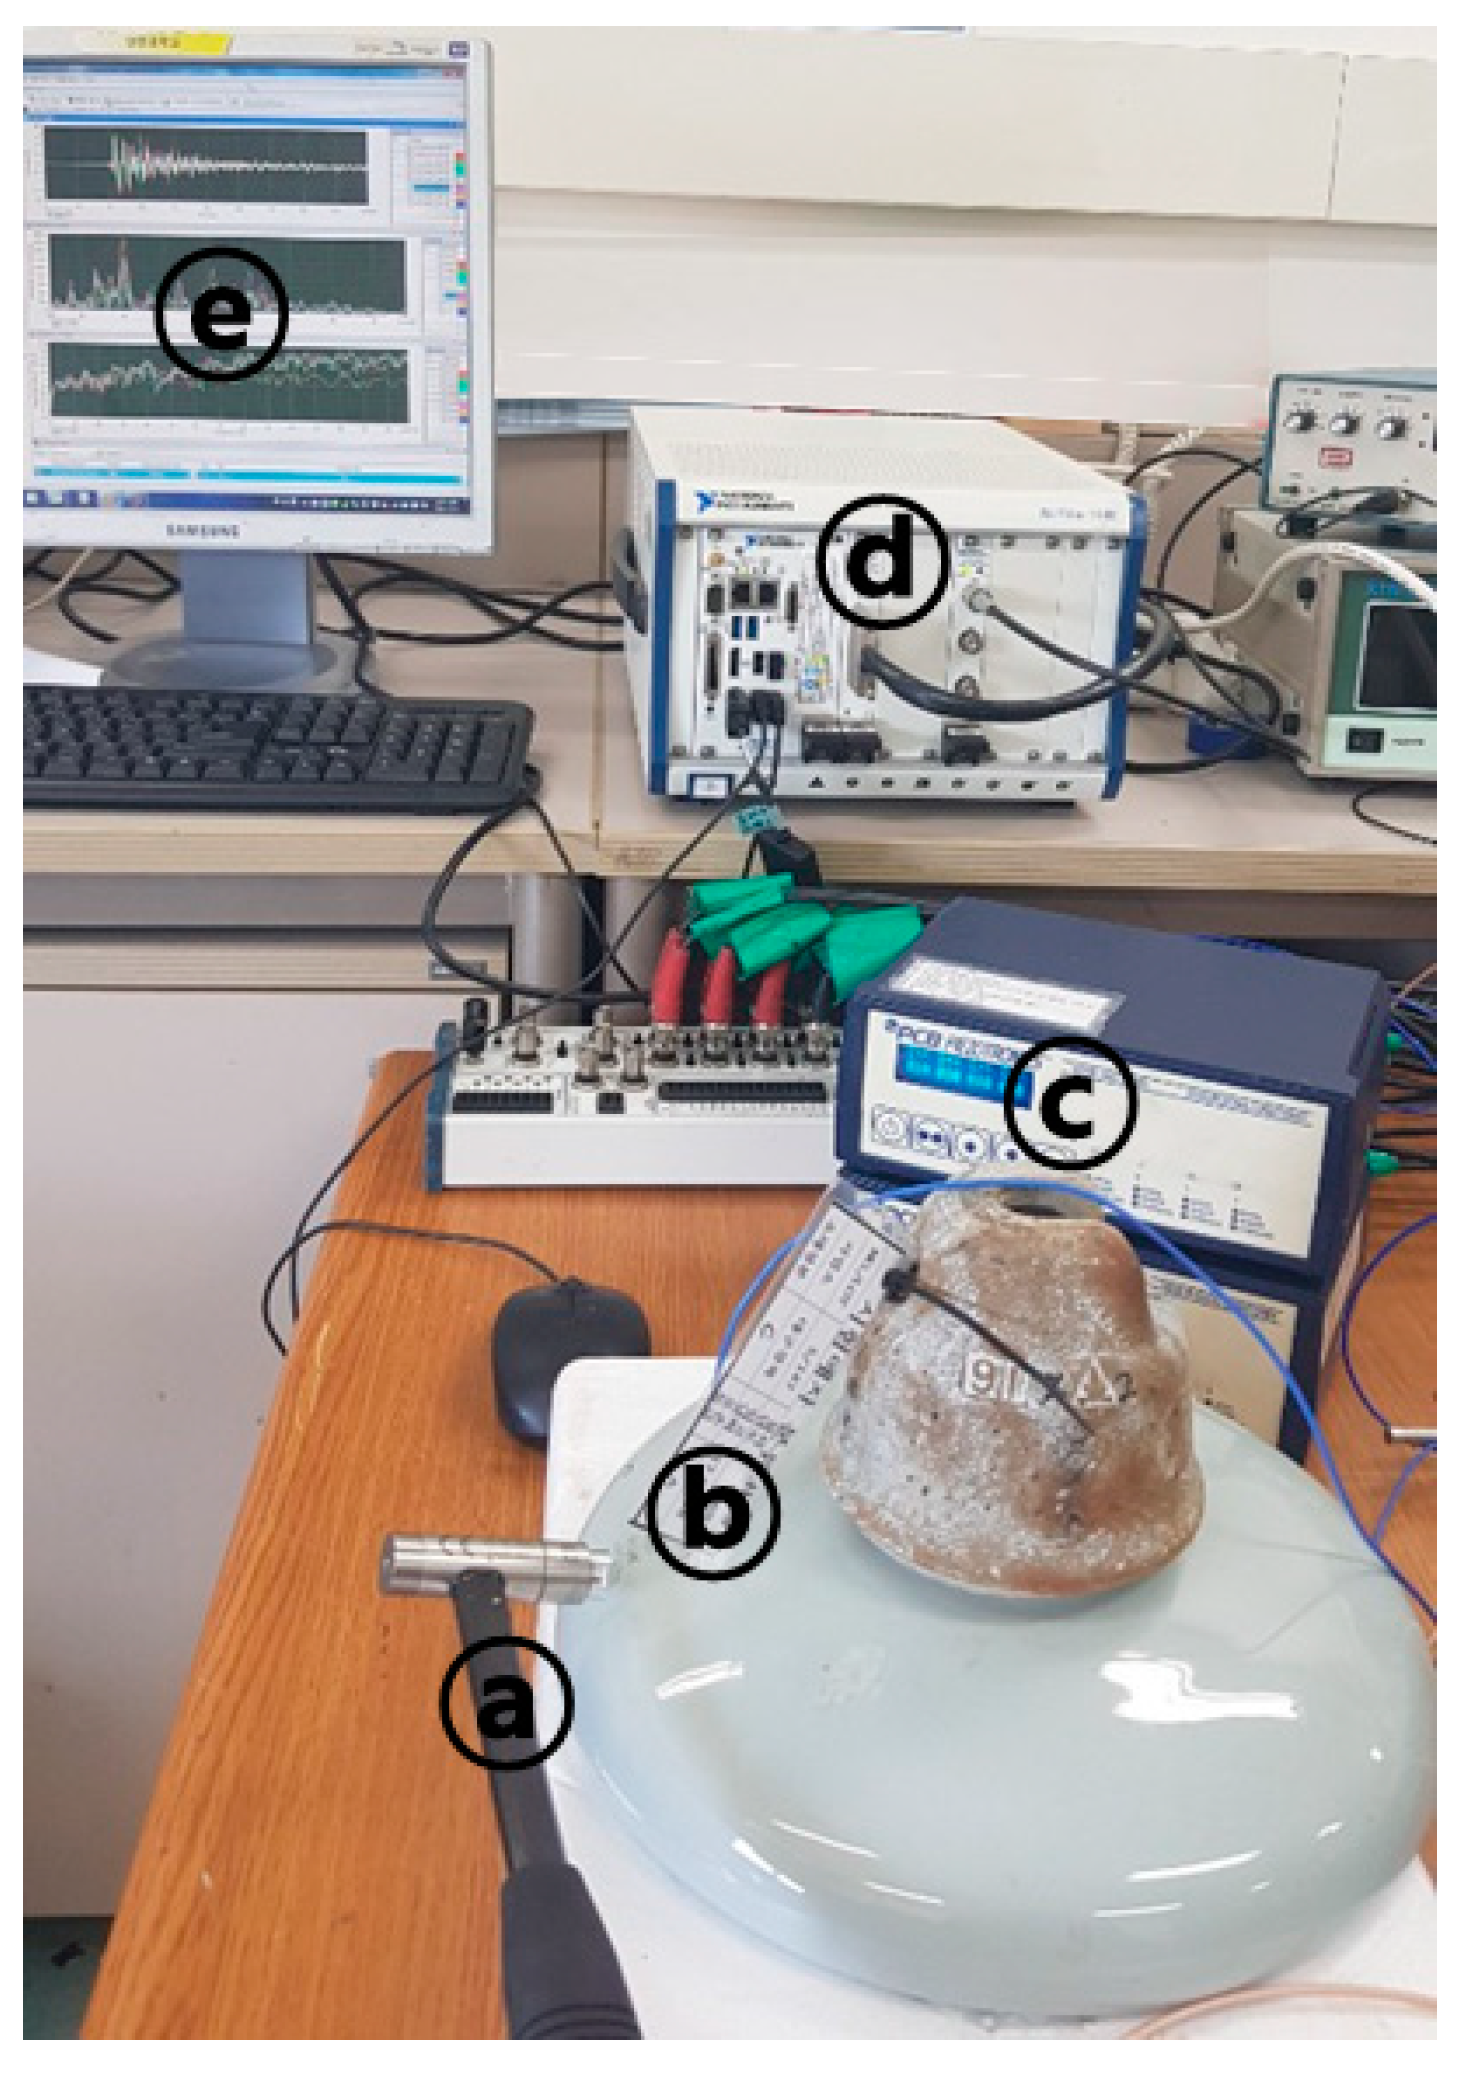
In order to calculate the FRF experimentally, it is necessary to measure the experimental values of the impact and response energy. The configuration of the experimental equipment for the FRF measurement is shown in Figure 2: (a) The impact hammer (PCB 086C03) (PCB Piezotronics, Inc., Depew, NY, USA) measures the impact energy in the test specimen; (b) the accelerometer (PCB 208C05) (PCB Piezotronics, Inc., Depew, NY, USA) measures responses that depend on the test specimen; (c) signal conditioning (PCB 482C16) (PCB Piezotronics, Inc., Depew, NY, USA); and (d) DAQ (NI PXIe – 6366) (National Instruments Co., Austin, TX, USA) are employed to collect data from the test apparatus.
The measurement program stores data at a sampling rate of 500 kS/sec using NI LabVIEW SignalExpress (National Instruments Co., Austin, TX, USA). Here, because the stored data are values in the time domain, it is transformed into the frequency domain using the MATLAB signal process toolbox (MathWorks, Inc., Natick, MA, USA), and the FRF is obtained using Equation (1). Through the obtained FRF, the natural frequency and FRF waveform are analyzed according to the damage types of porcelain insulators.

3. Results and Discussion

3.1. Basic Experiment Analysis and Results

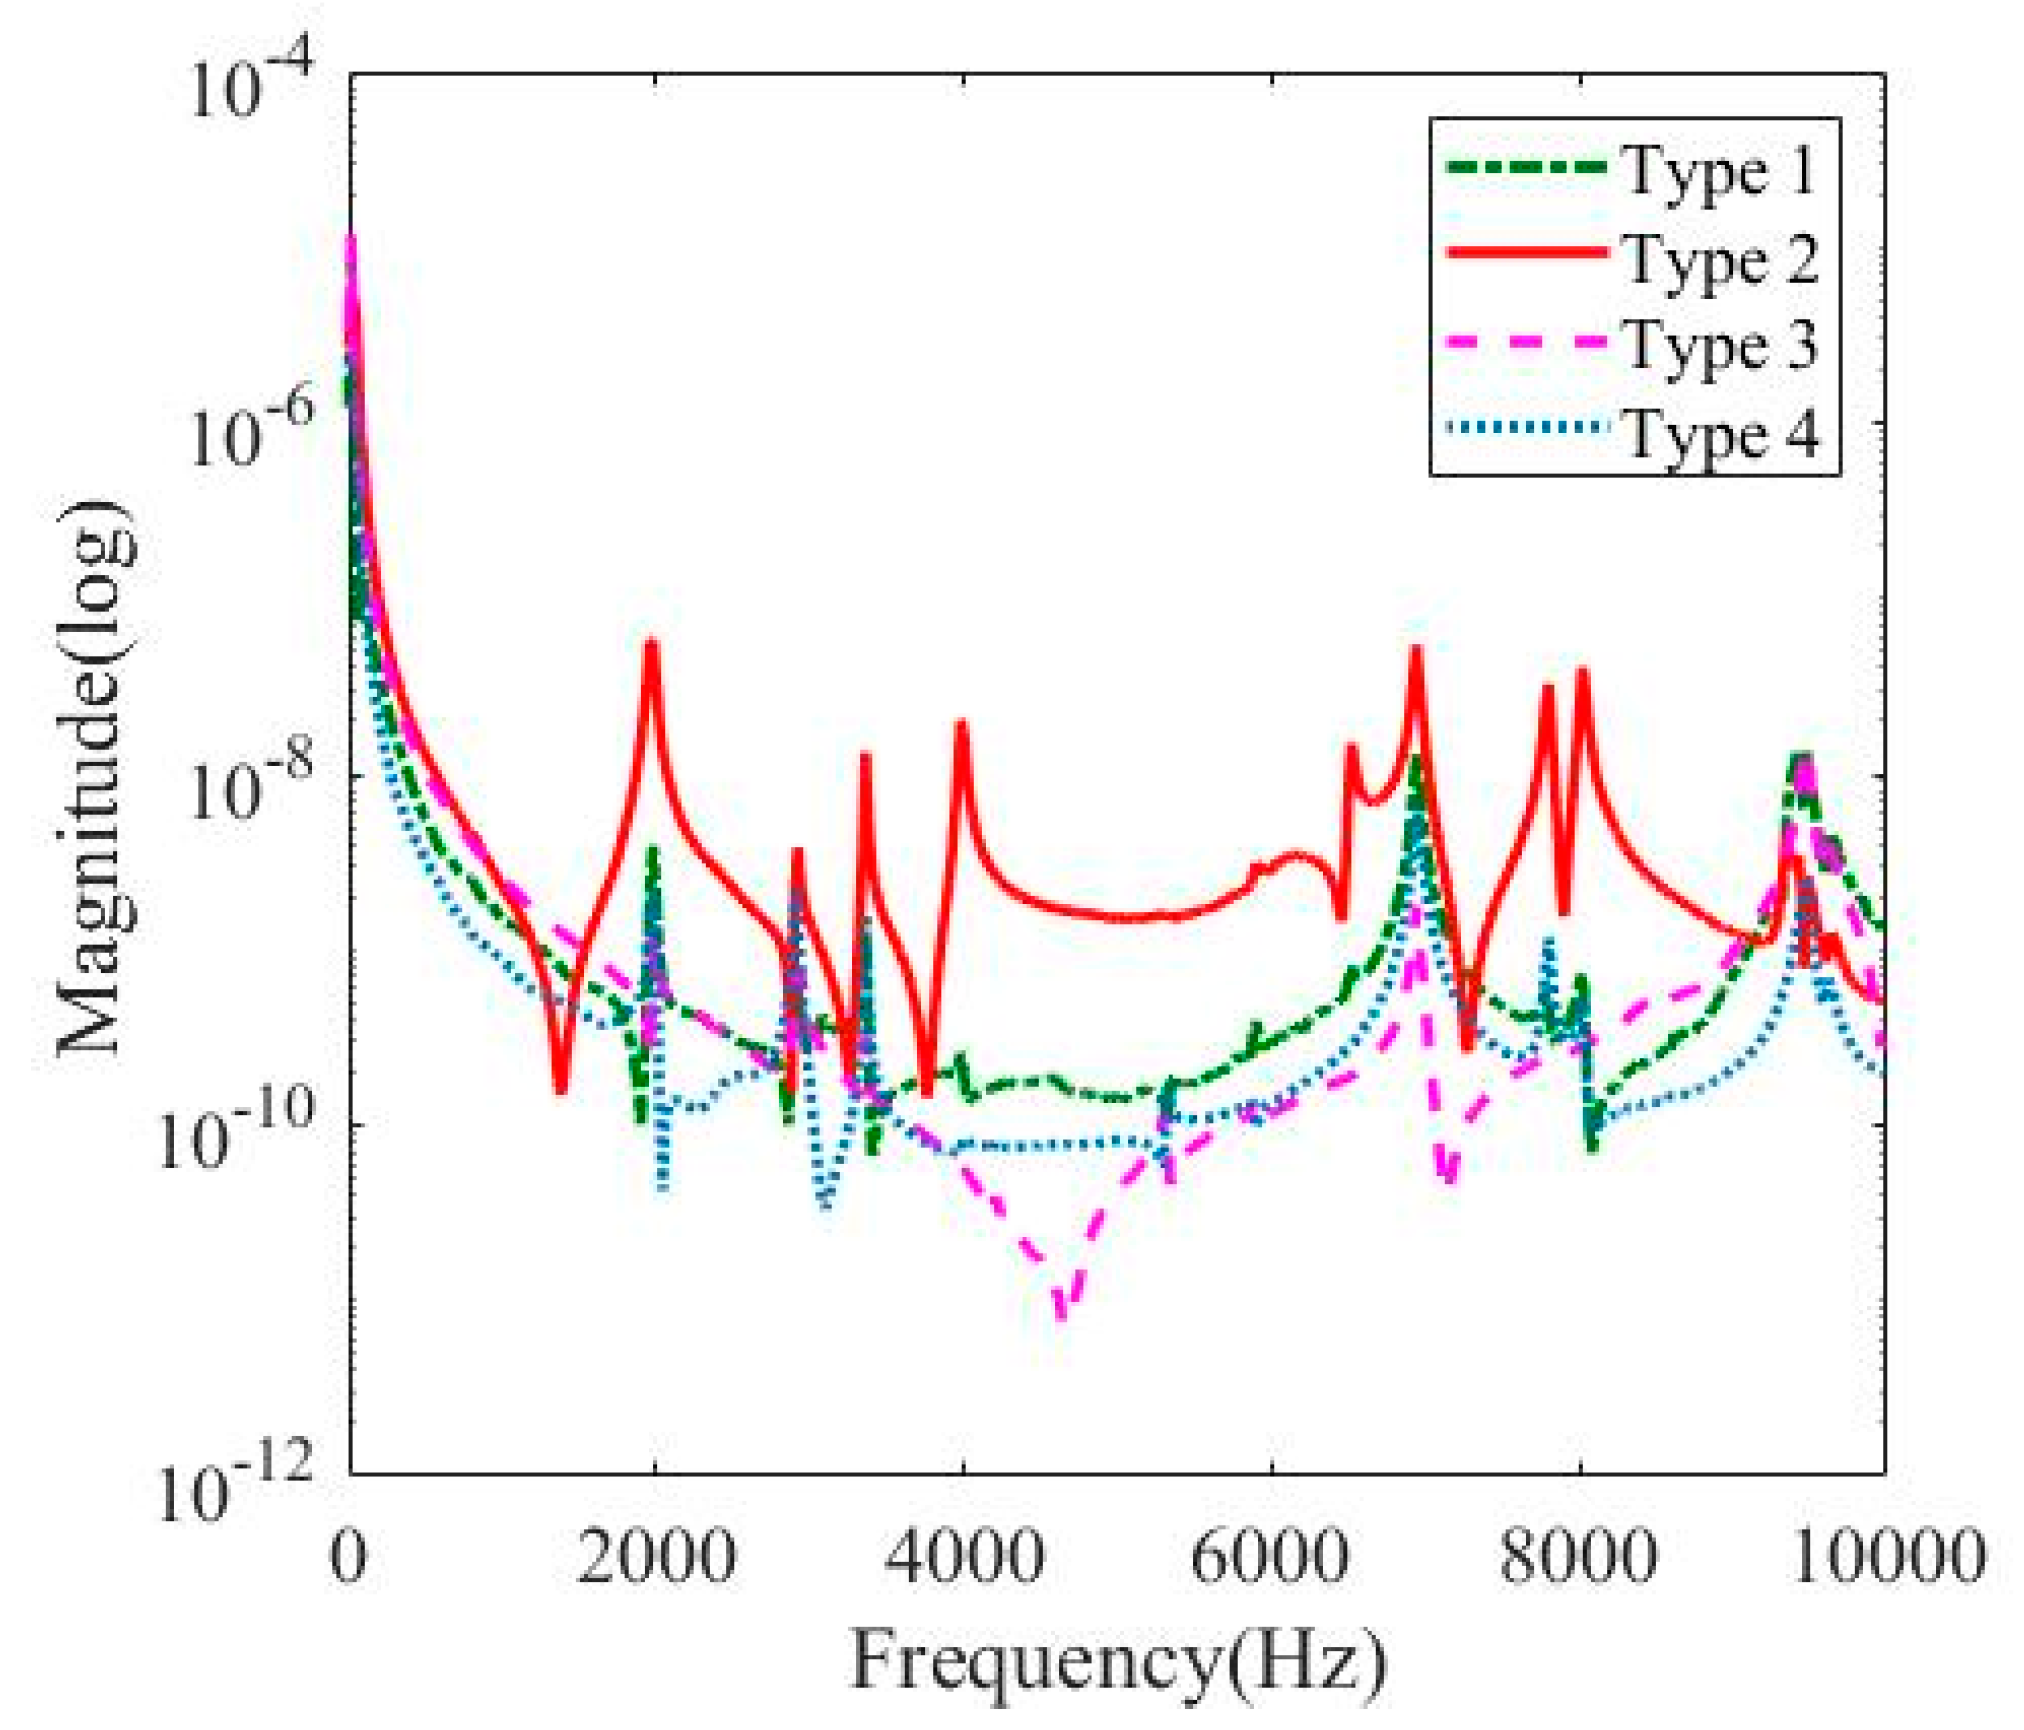
In order to select the sensor and impact position, which can grasp the dynamic behavior of the porcelain insulator, four experimental conditions were set up, as listed in Table 2; the hammer and sensor positions and the FRF results are shown in Figure 3. It was found that the natural mode obtained from Type 2 was the most visible, and its average value through the five experiments was also the most consistent.
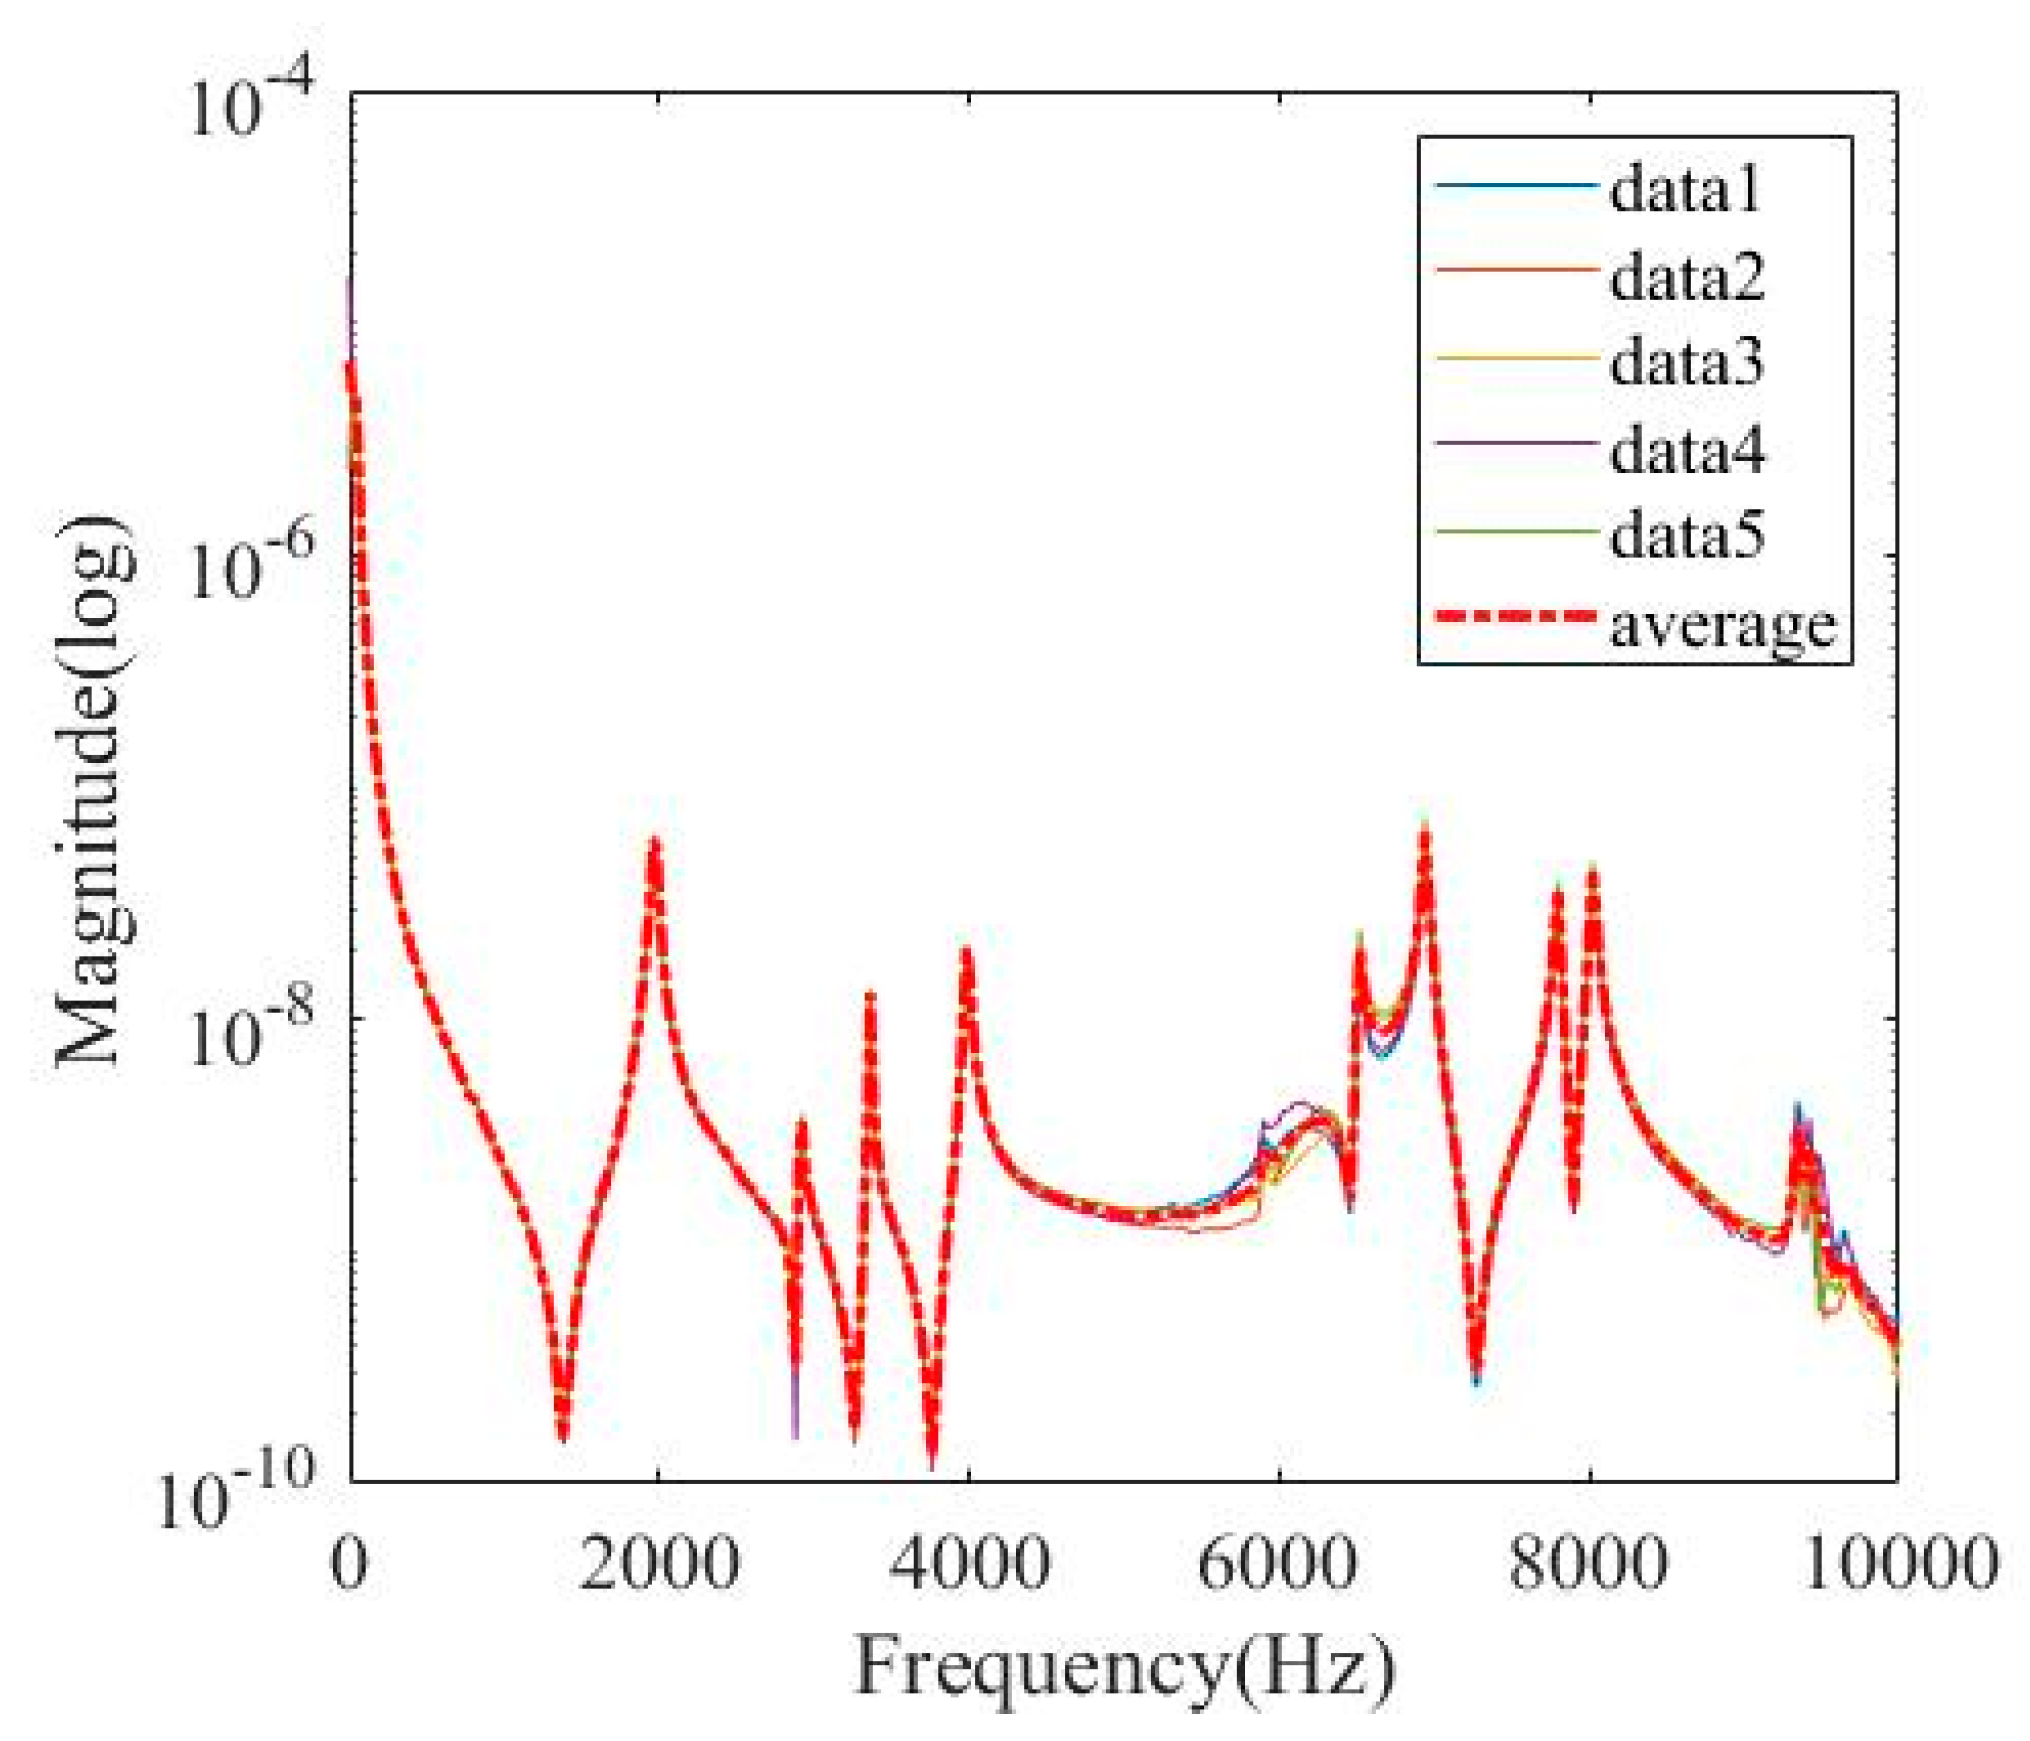
In order to ensure data reliability, an accelerometer was installed in the porcelain part; thereafter, as indicated for type 2, the side of the porcelain part was struck with an impact hammer. Figure 4 shows a graph of the frequency response of the mean and five experimental results at the same location.
At frequencies less than 5 kHz, the five experimental and average values agreed. At frequencies greater than 5 kHz, the natural frequencies were identical; however, the waveforms among the natural modes were slightly different.
After confirming the consistency of experimental results, the frequency response of the intact insulator was analyzed. As mentioned above, porcelain insulators used in the 154 kV transmission towers in Korea are combined with cristobalite and alumina materials; thus, basic analysis was necessary to distinguish between the two materials.
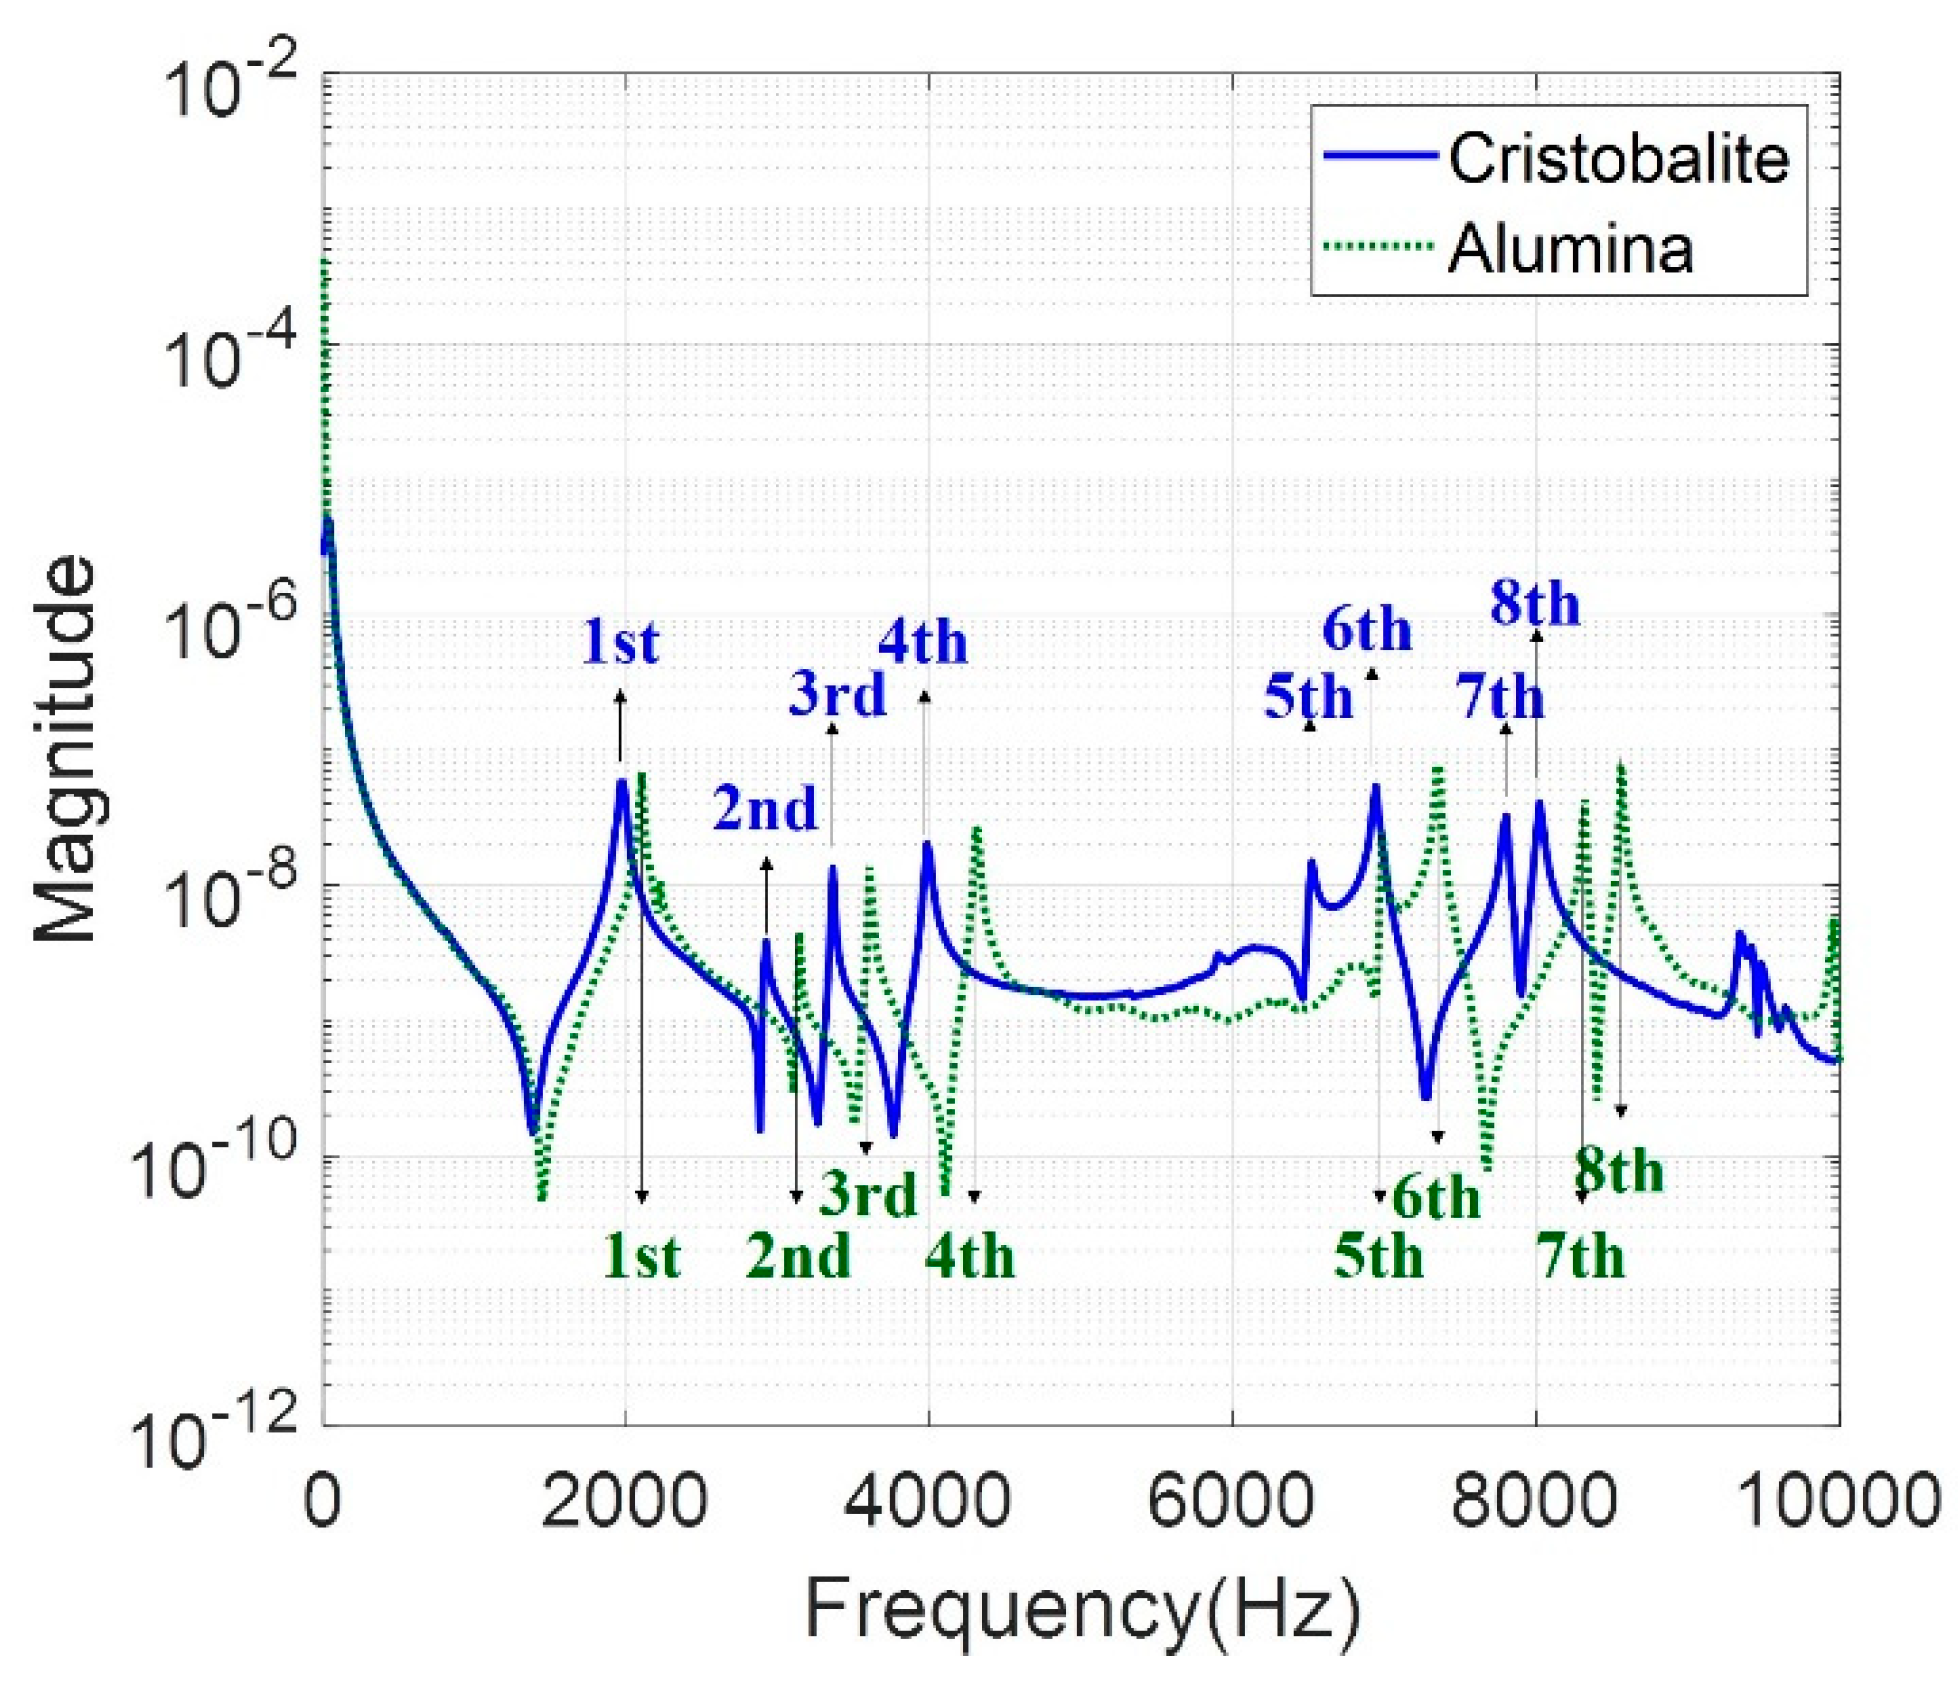
The frequency response of the intact porcelain insulator of the two materials is shown in Figure 5; four natural modes appeared below 5 kHz, and four appeared between 5 and 10 kHz in both materials.
In the first mode, the alumina exhibited a frequency of approximately 100 Hz higher than that in cristobalite; the frequency difference gradually increased in the subsequent modes. Accordingly, the two materials could be distinguished based on the difference in positions among the natural modes, as shown by the basic frequency response graph.
Porcelain insulators undergo several manual processes during manufacture that may introduce uncertainties; uncertainties are also introduced by cement and porcelain materials. Because specimens are manufactured in different locations, installation sites, and service periods, the natural frequencies may change. Accordingly, experiments were conducted to set the frequency range of the natural modes of the intact porcelain insulators before measuring and comparing them with those of damaged insulators.
Table 3 shows min, max, frequency average, standard deviation values by the peaks of the natural modes (modes 1–4) of the cristobalite and alumina insulators. It can be observed that there are differences in the natural mode frequencies among the 15 intact insulators. In the case of cristobalite, the minimum and maximum differences of 100 and 190 Hz were generated, respectively; for alumina, the minimum and maximum differences were 80 and 140 Hz, respectively. Similar differences were observed in natural modes 4–8.

3.2. Frequency Response Analysis Results

A frequency response analysis of damaged cristobalite specimens was conducted to distinguish between normal and damaged specimens.
In the case of a damaged insulator, the frequency of the natural mode may change because of change in mass, inner voids, non-adhesion of interface, or cracked porcelain; the magnitude of the response energy may change because of variation in attenuation. Accordingly, the specimens were analyzed according to damage type.
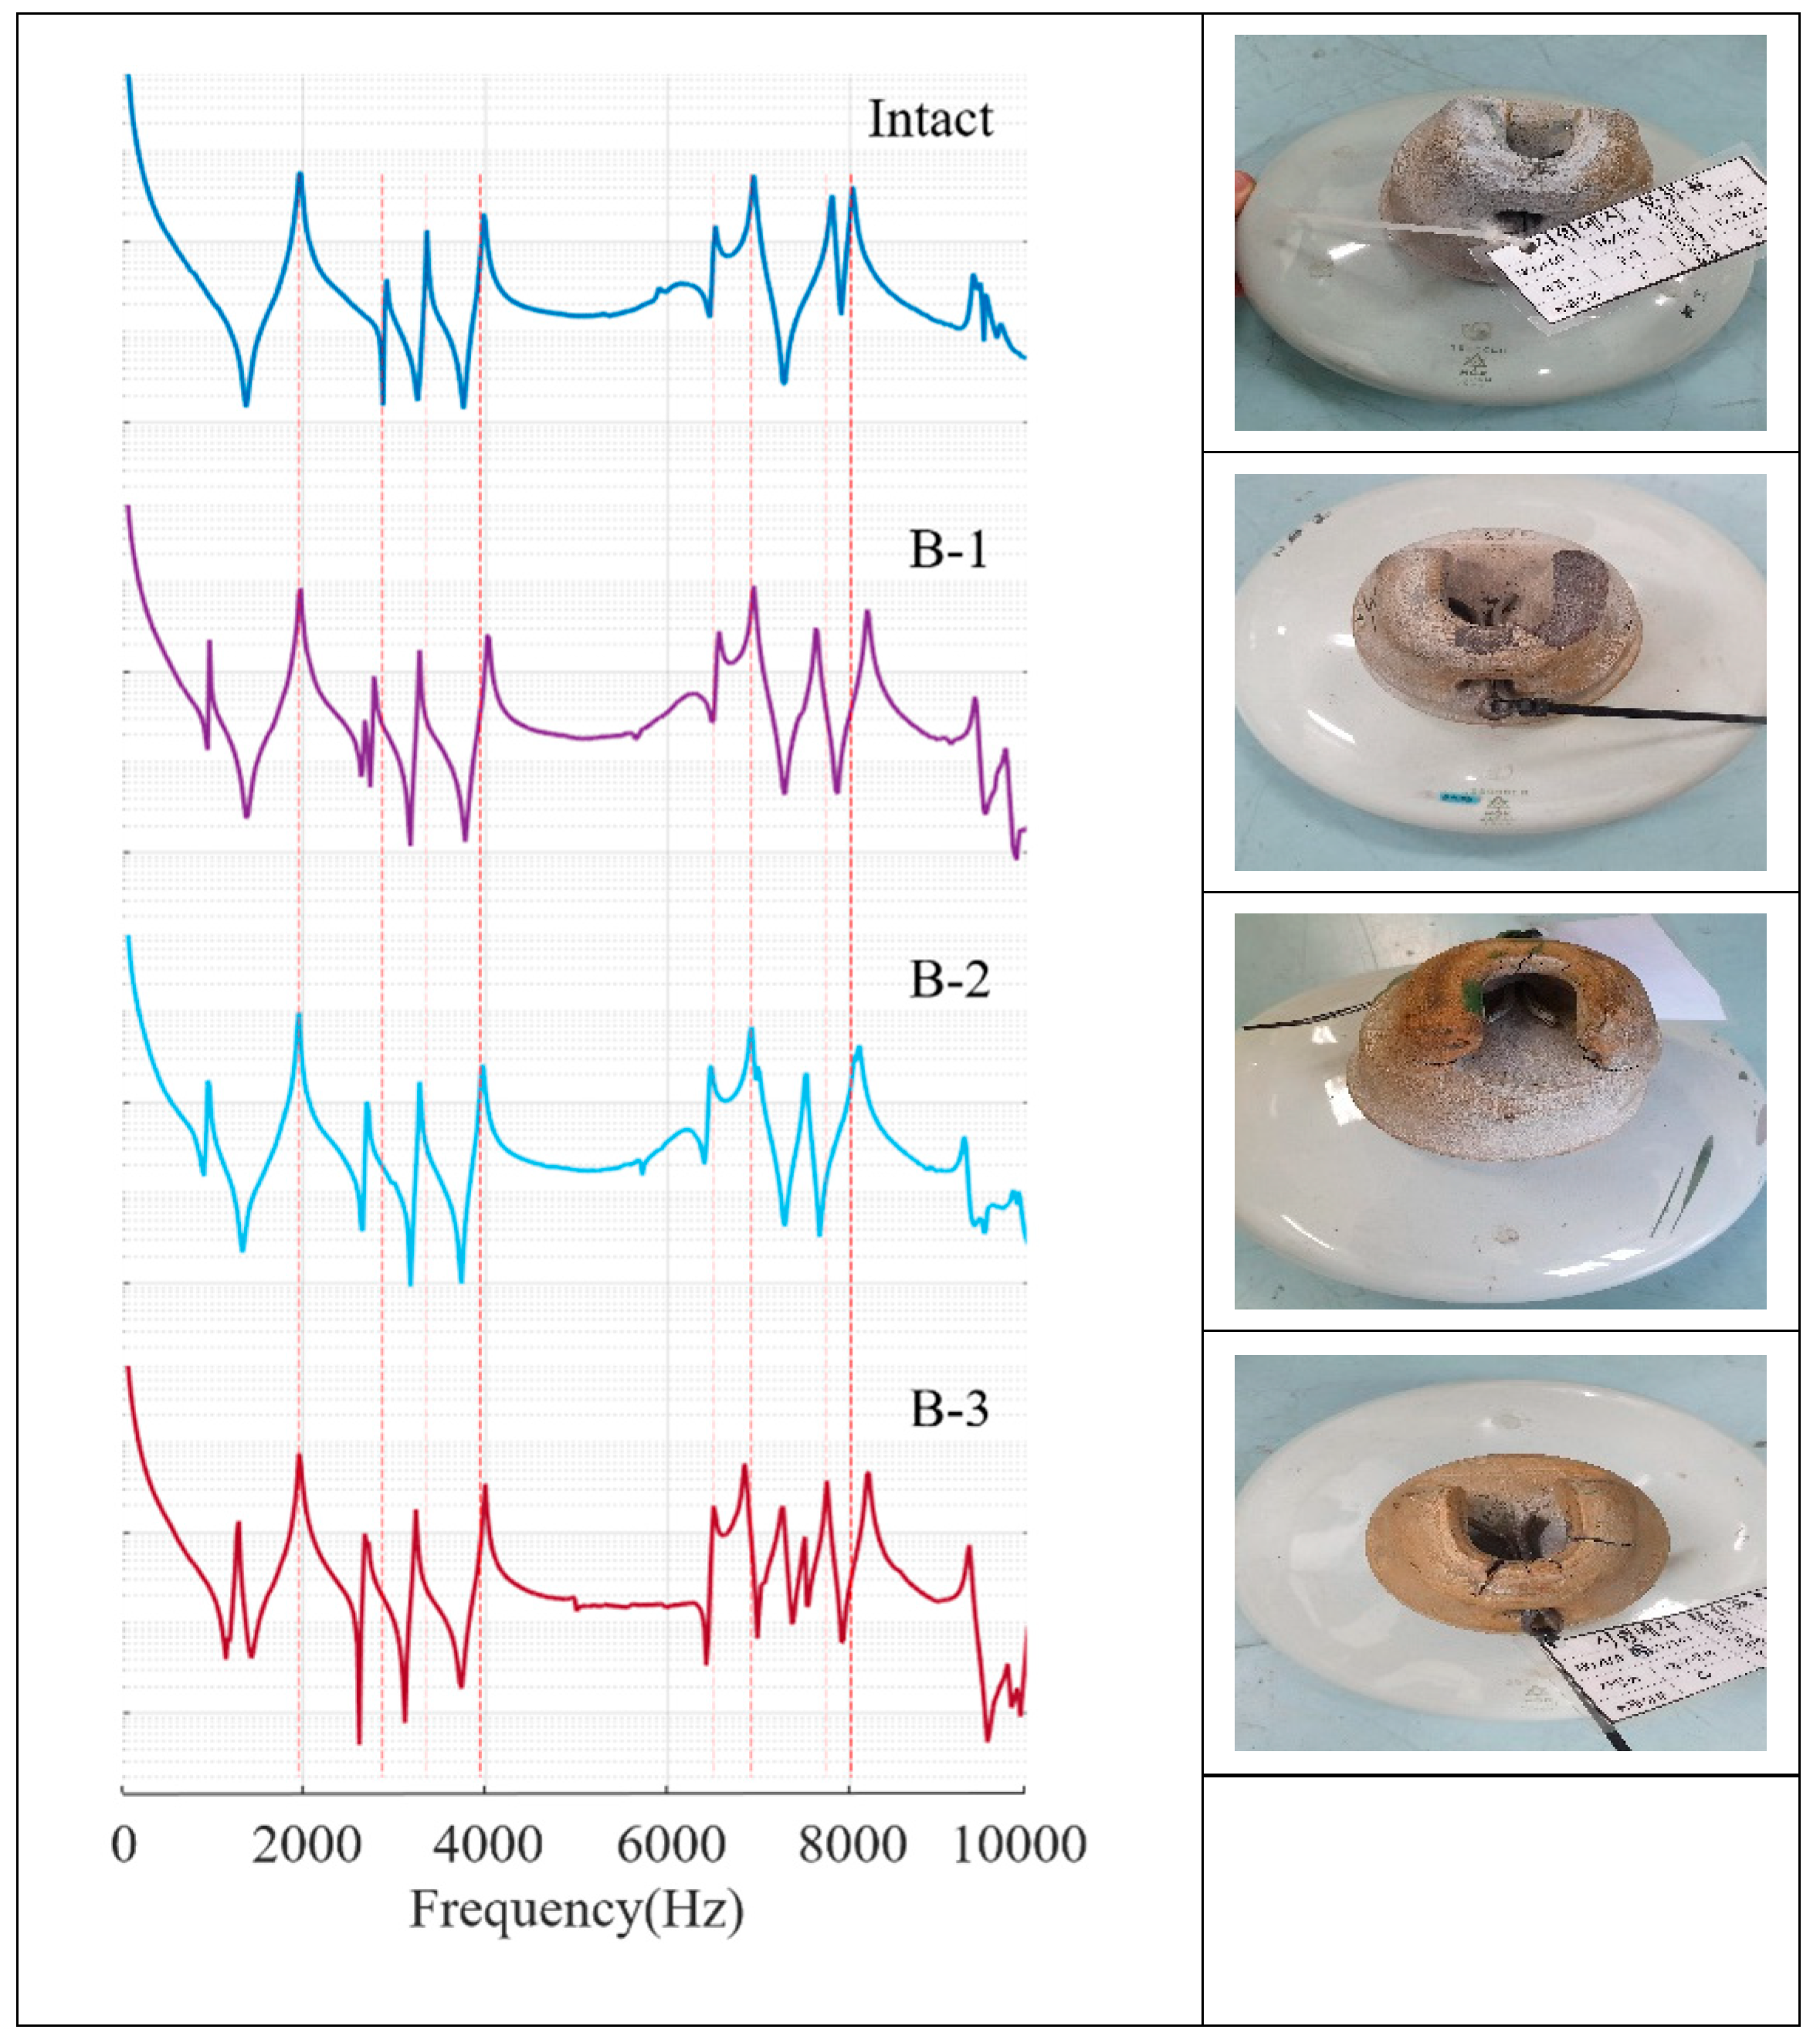
The frequency response graphs of intact and defective porcelain insulators are presented in Figure 6. The frequency response of the damaged and cracked porcelain samples was significantly different compared with that of the intact sample. The broken porcelain discs (A-1, A-2, A-3) lost eight natural mode characteristics that were observed in the intact specimens; they dissipated most of the energy within the 5 kHz frequency. In the porcelain disc with crack (A-4), all natural modes disappeared, and a new mode occurred at low frequencies. In the case of damaged porcelain, porcelain disc cracking was judged to have a greater effect on resonance than the broken porcelain disc.
The frequency response of cap damage shown Figure 7 was maintained in the eight natural modes observed in the intact frequency response. However, a new mode occurred near the 1 kHz frequency; this mode appeared in all three cap-damaged specimens. In addition, the second and third modes moved to a lower frequency, which was found to be significantly outside the original mode range of the previous set.
The internally damaged specimen was fabricated by placing a normal ceramic insulator in insulating oil and then applying a commercial frequency voltage. This applied voltage was raised as quickly as possible to the insulated failure voltage between 175 and 190 kV (minimum and maximum, respectively) as confirmed by an instrument that measured the voltage [28].
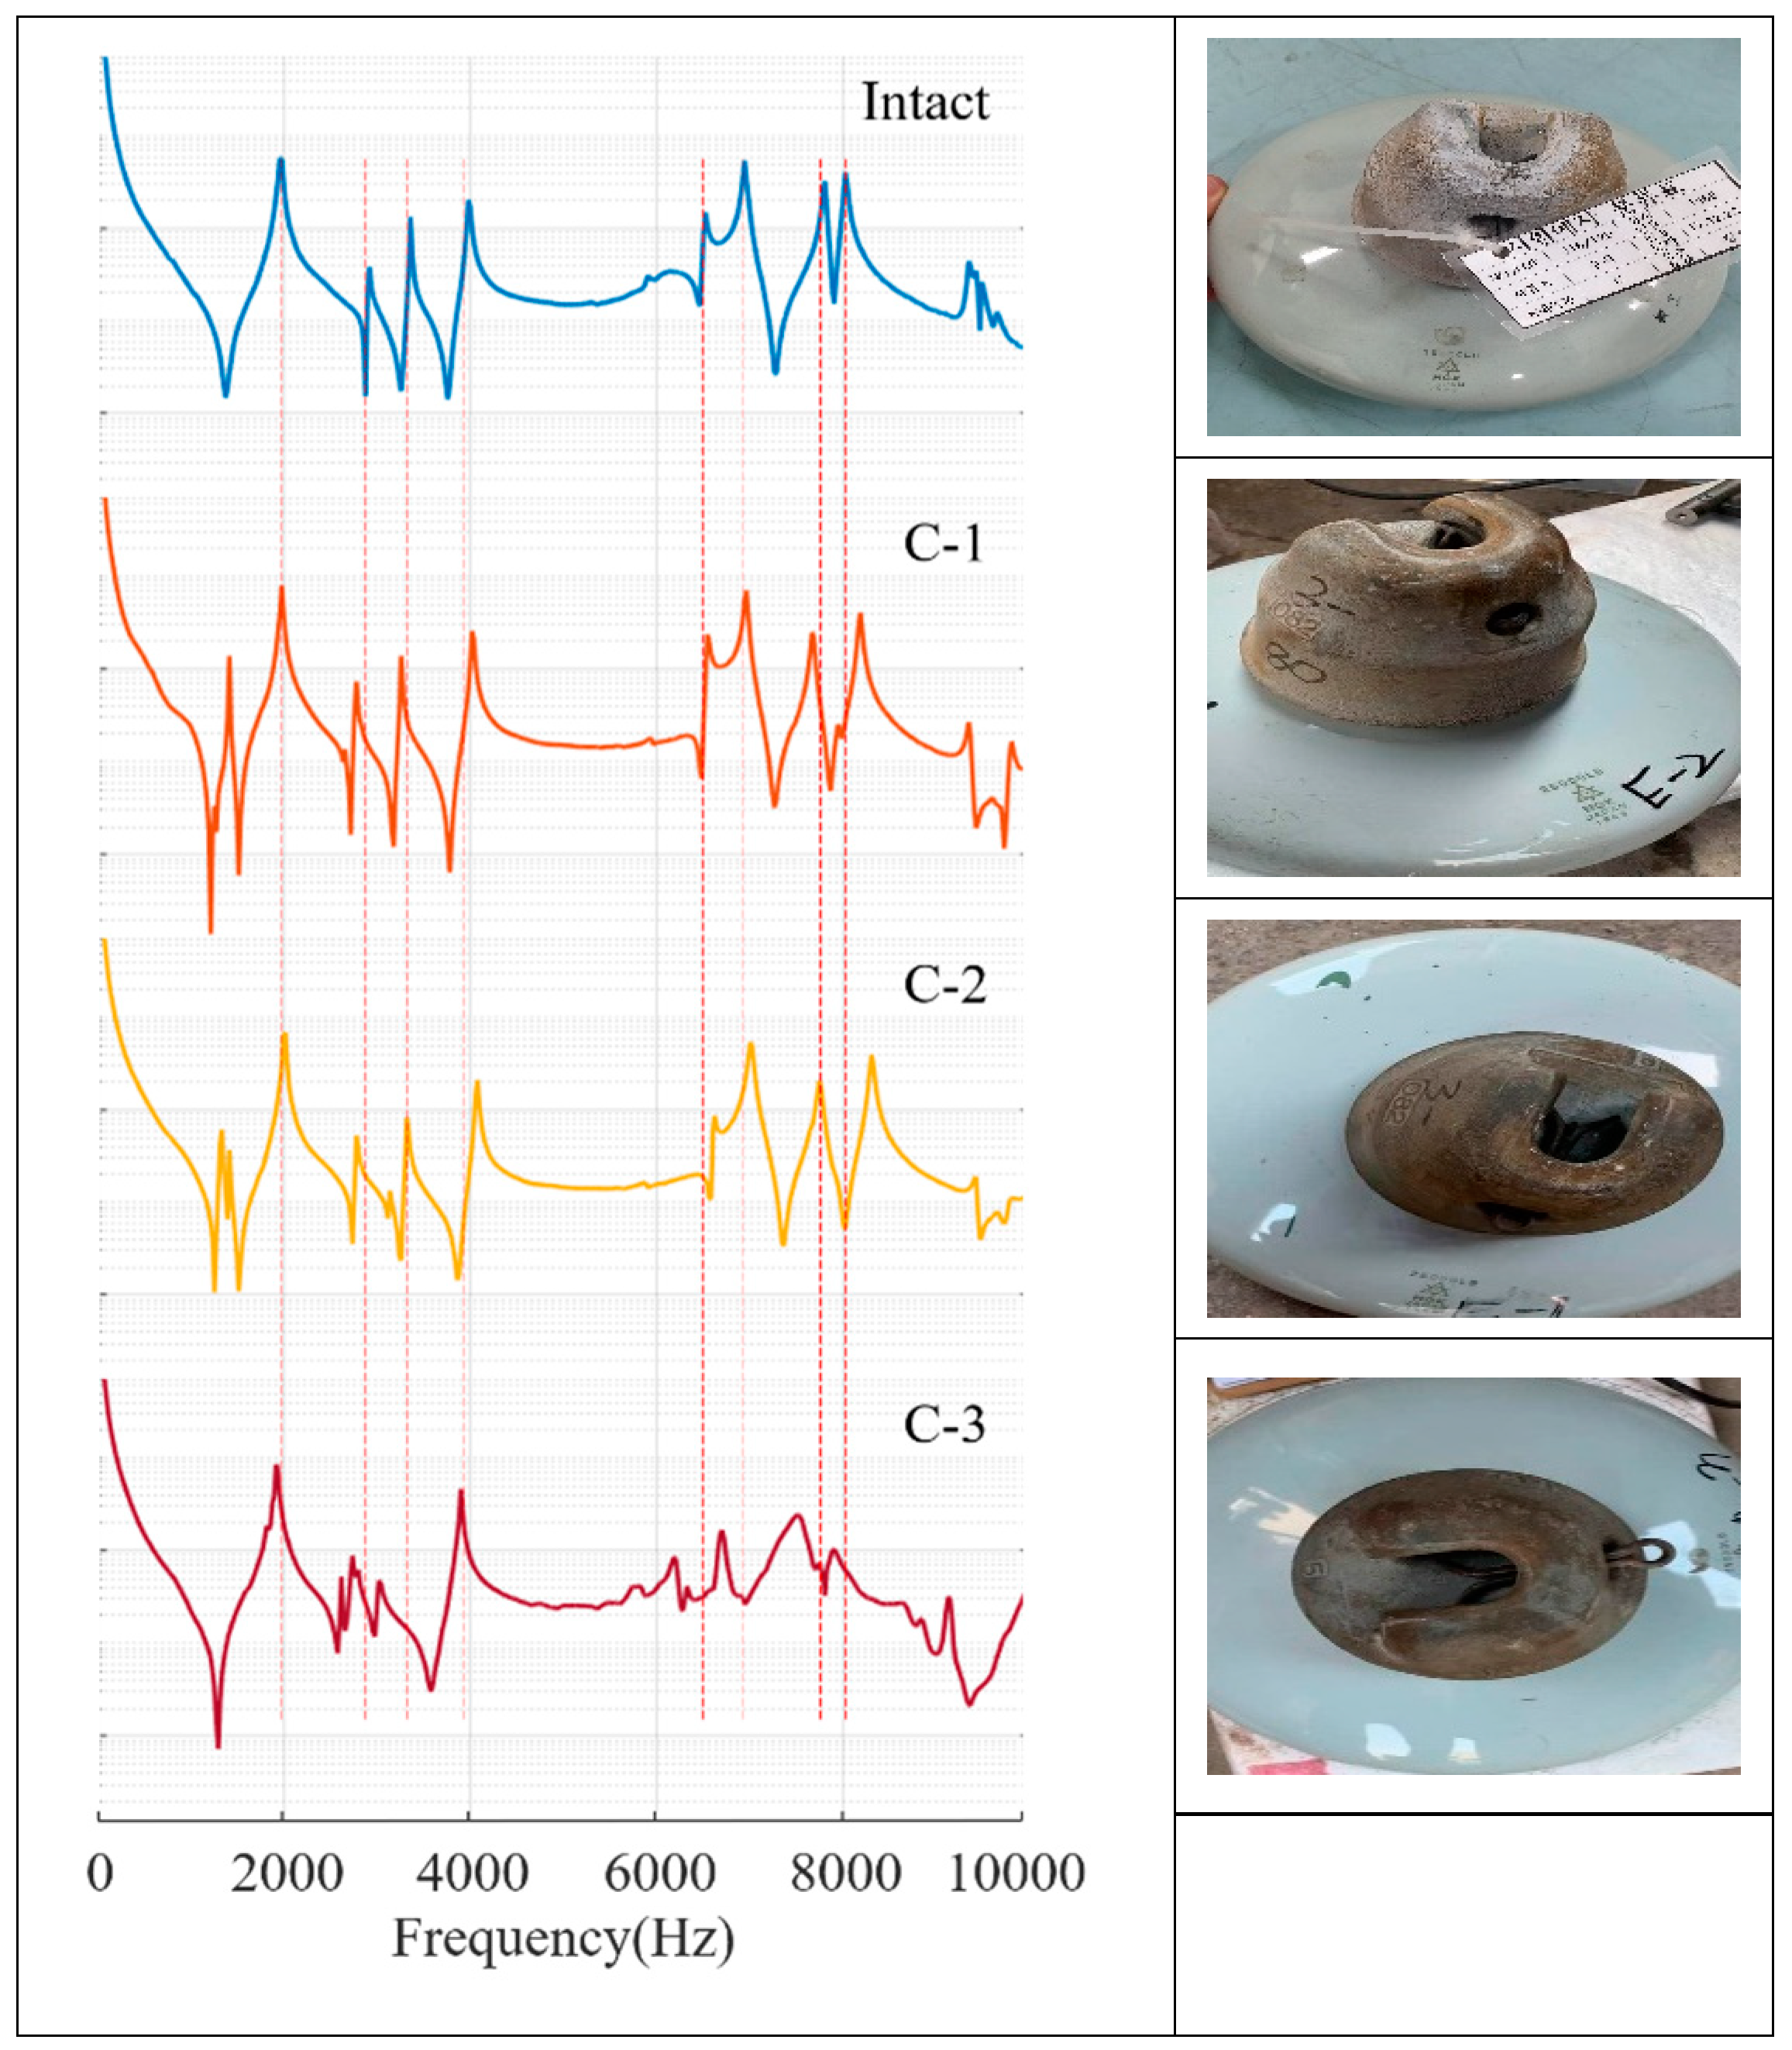
A frequency response graph was plotted for each of the three test specimens that had been subjected to the commercial frequency voltage test but with no apparent damage to the appearance of the insulator, as shown in Figure 8.
The FRF of C-1 and C-2 exhibited eight unique modes, a new mode occurred near 1 kHz, and a second mode moved to a lower frequency. This result is the same as the FRF result of the cap damage test specimen; it is deduced that the two test specimens were damaged inside the cap.
Different from these two cases, no new mode occurred in the case of C-3 test specimens. However, the second and third modes moved the most to the lower frequencies, and the mode near the 5 kHz frequency disappeared. Because the disappearance of the natural mode was similar to that in the FRF result of porcelain damage, it was expected that considerable damage had occurred inside the porcelain.
In the frequency response graph, several peaks, waveforms, and frequency range analyses of natural modes were conducted; characteristics such as extinction, generation, and movement of natural modes were found to vary depending on the type of damage, and internal damage could be estimated by contrasting their characteristics.

3.3. Principal Component Analysis Results

The extraction of characteristics for the analysis of the main component was performed from two perspectives: Time data and frequency response data. As an advantage over the frequency response data analysis, the time-data analysis does not require energy in the use of the impact hammer [29].
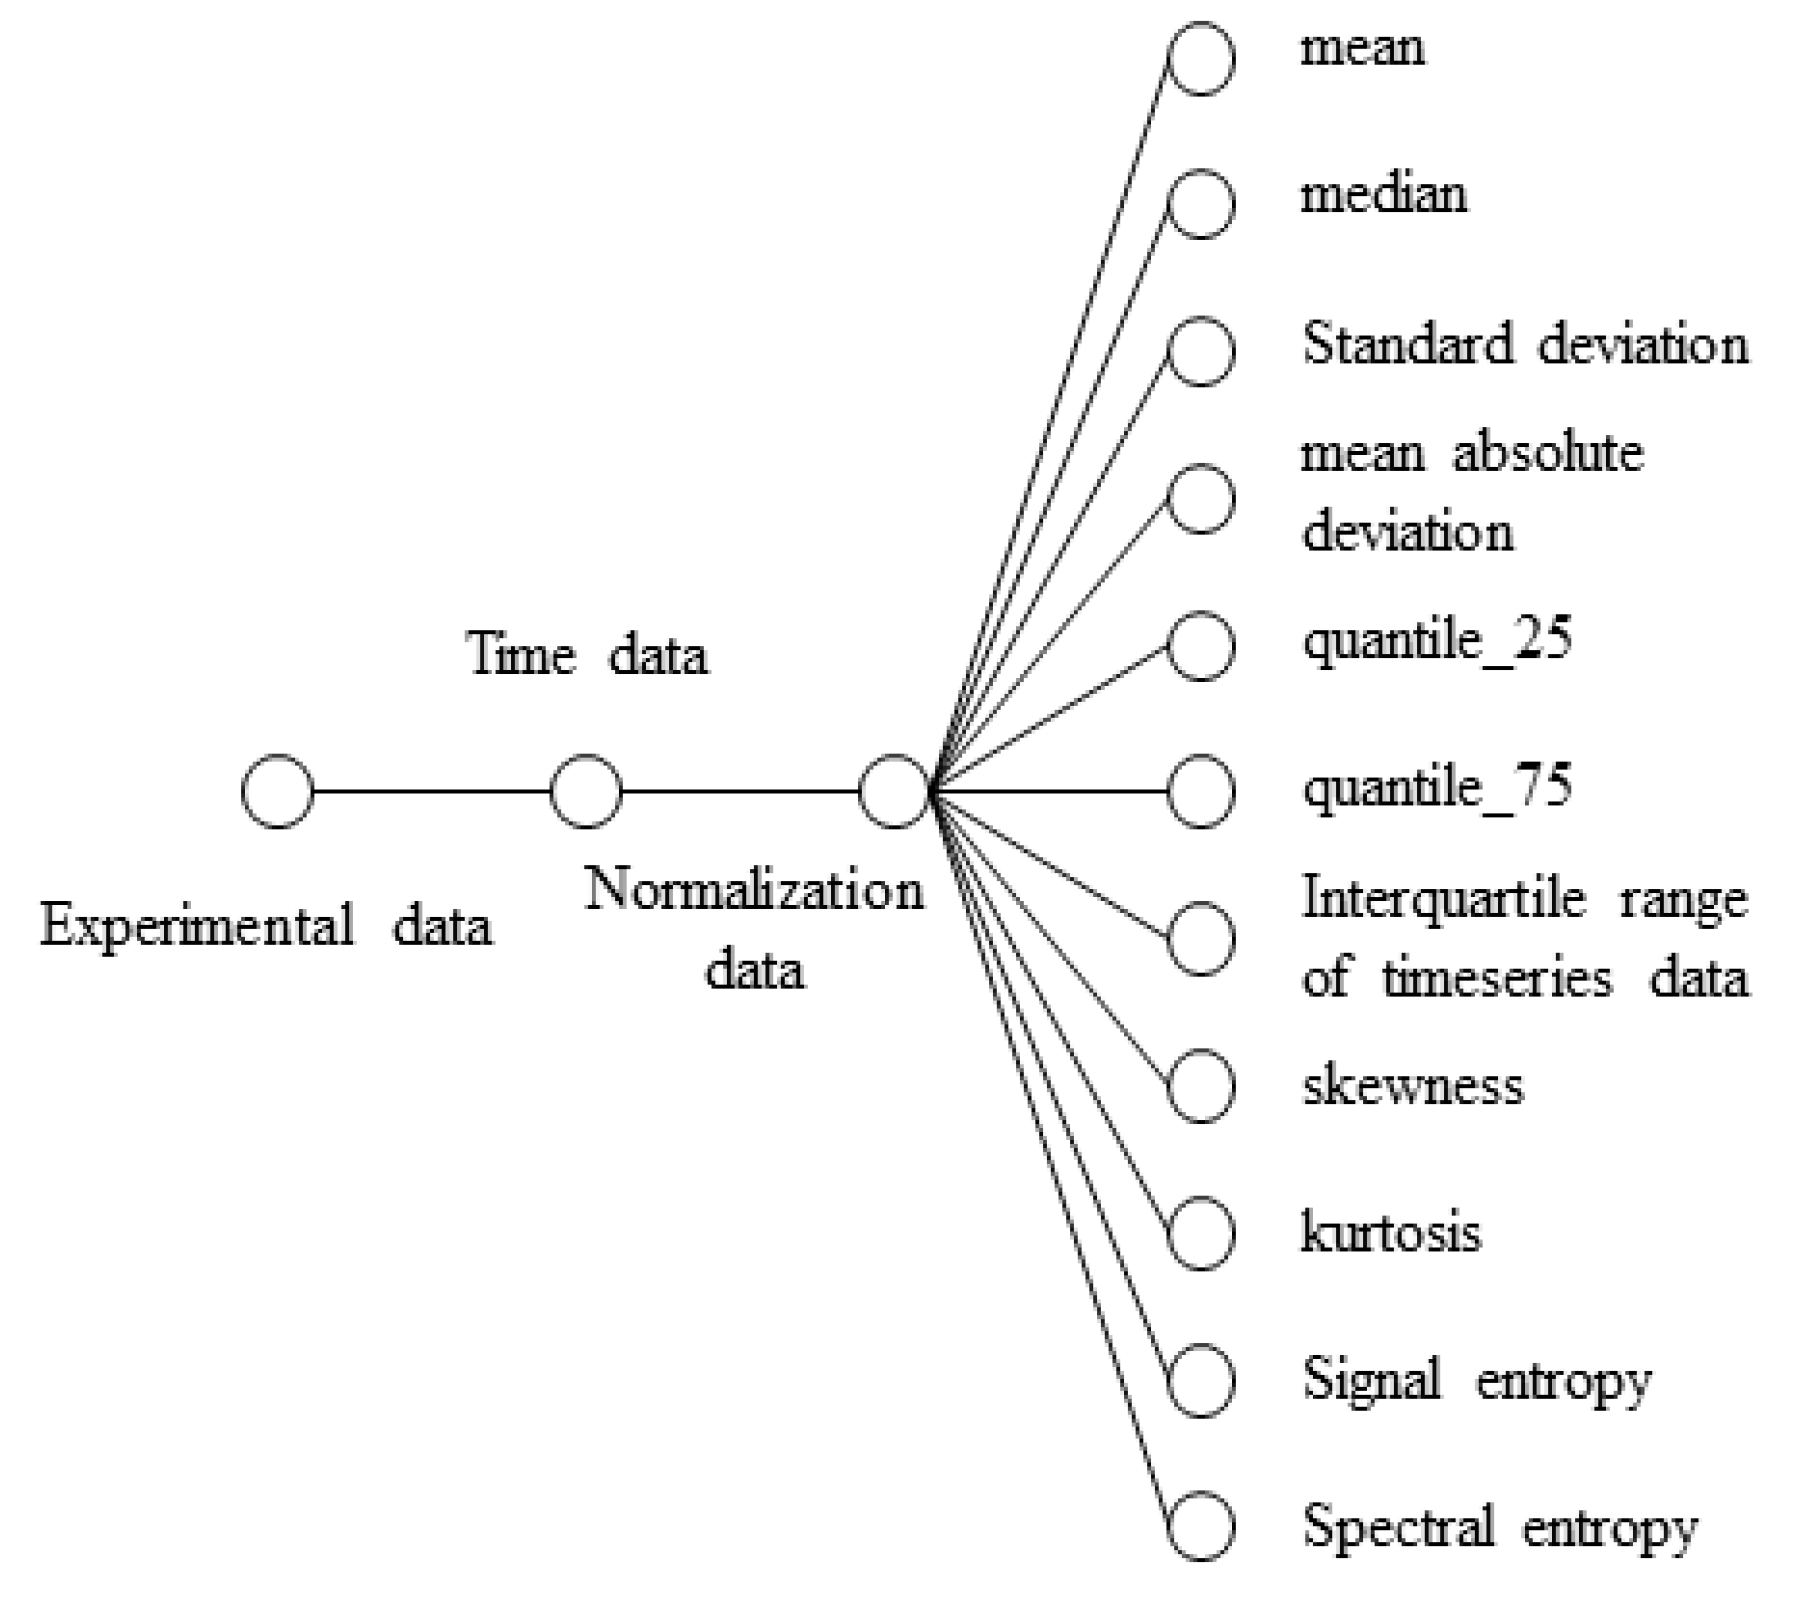
Various characteristics that can be calculated using time data were considered to set up the basic matrix. The features extracted according to the procedure in Figure 9 were employed in the default matrix; this means that 11 features were derived for each sample of porcelain insulators.
The entropy of time data was computed and used as one of the features. Here, entropy pertains to the Shannon entropy of discrete distribution; it is a measure of the uncertainty or disorder within a system. A signal that is more chaotic generates a larger value of entropy and vice versa; the entropy (H) of an entire signal, Xi [x1, x2, …, xn], is given by Equation (5):
H = xi i X i log ( x i ) .
Skewness measures the degree of asymmetry with respect to the sample mean; in a normal distribution, skewness is zero. The skewness (S) of a discrete signal, x, is defined by Equation (6):
S = E ( x i μ ) 3 σ 3 .
The kurtosis (K) of a discrete distribution function, Xi, measures how peaky the distribution is with respect to the normal distribution. It is mathematically given by Equation (7):
K = E ( x i μ ) 4 σ 4 .
The basic matrix with 11 feature values for each of the 67 samples was first assembled. Thereafter, the principal component analysis procedure in Figure 1 was followed.
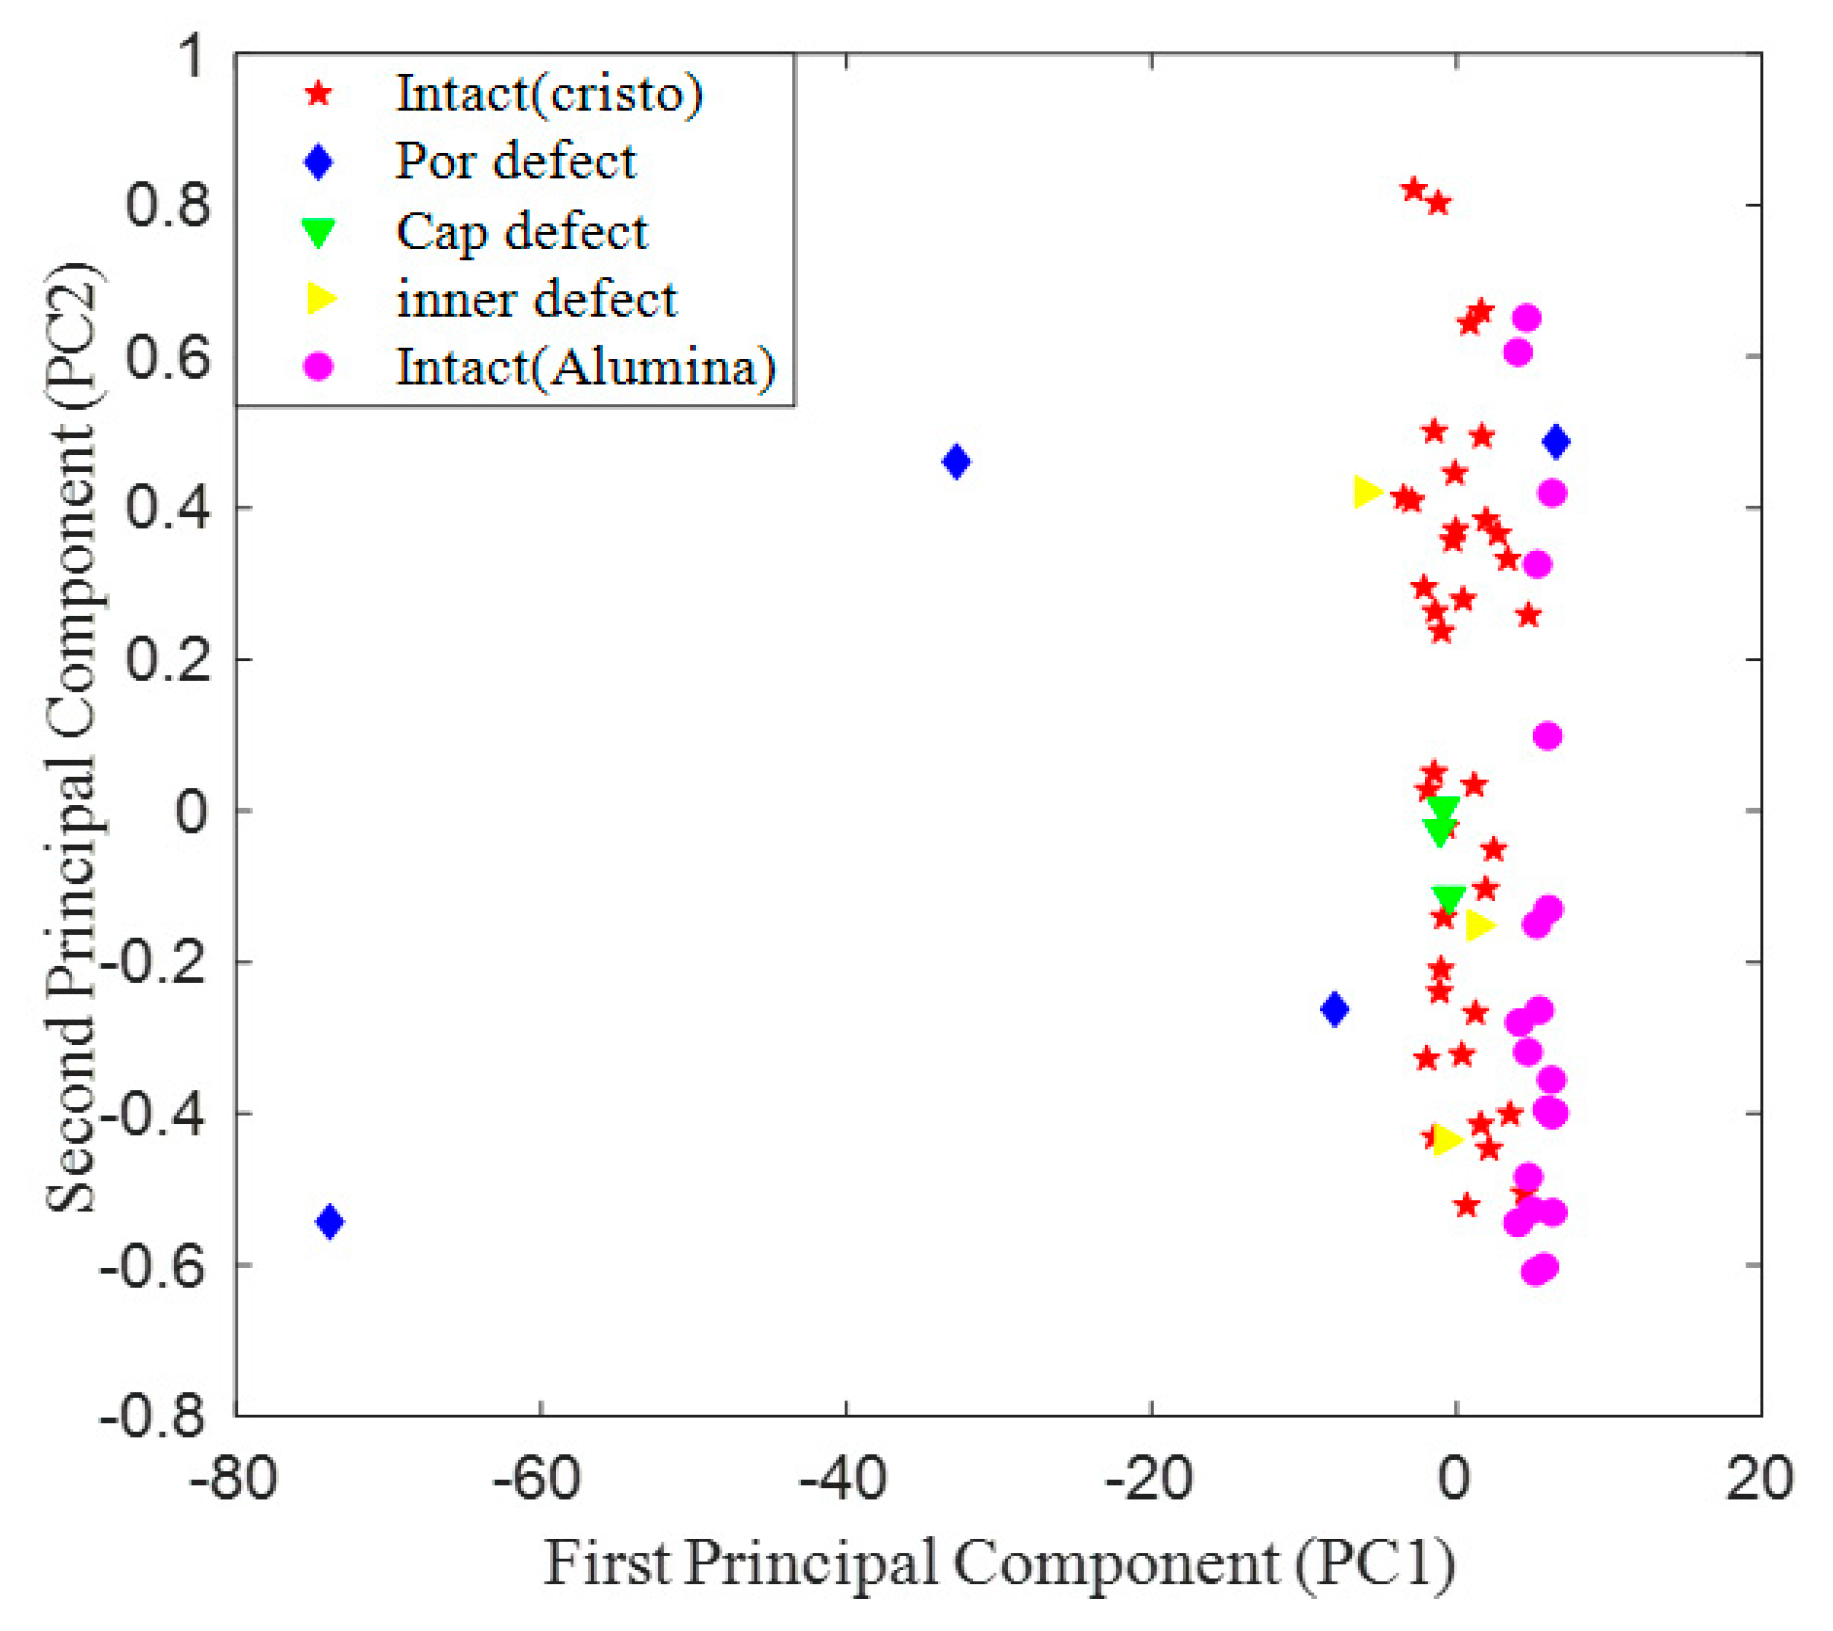
Through PCA, it was found that the vector with the greatest contribution of data variances was kurtosis (99.74%), second was average (0.15%), and third was skewness (0.10%). The x-axis coordinates were multiplied by the largest variance, PC1 (kurtosis), and the y-axis coordinates were multiplied by the second largest variance, PC2 (average); these were two-dimensionally plotted, as shown in Figure 10.
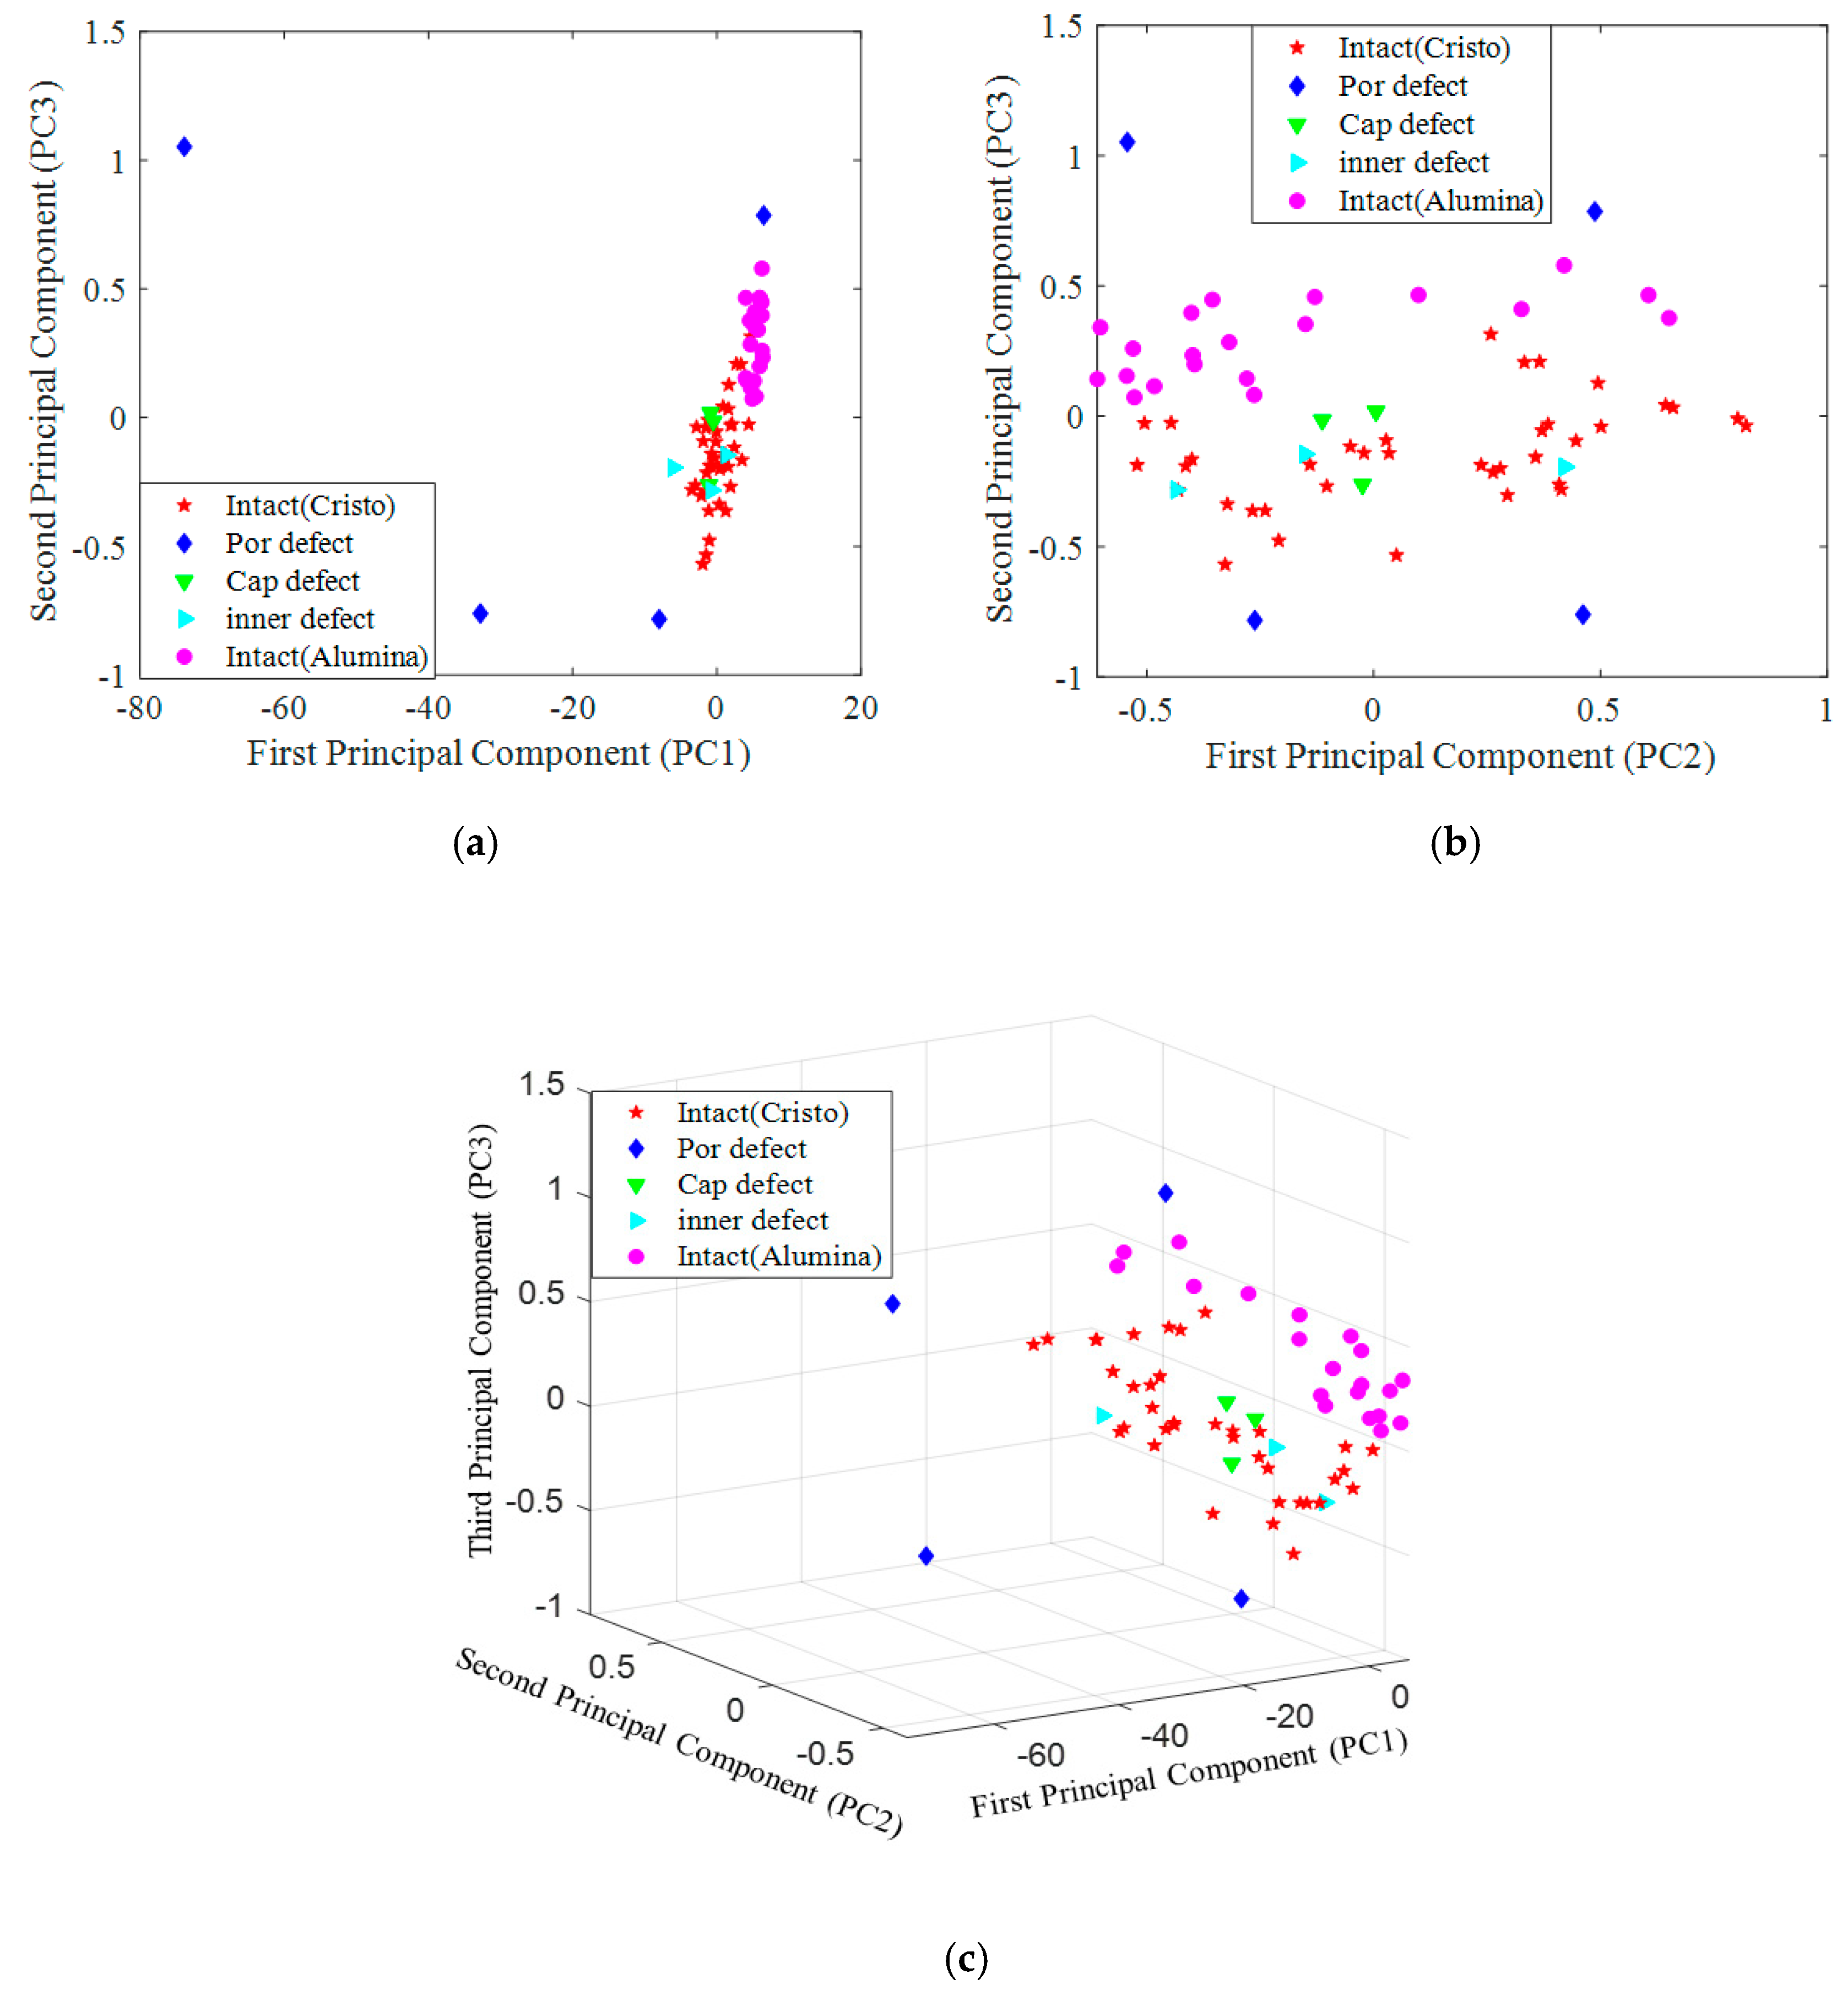
The two-dimensional graph analysis of all data using the largest PC1 and PC2 showed that three out of the four damaged porcelain data exhibited considerable differences from other data in the negative direction of PC1. However, this two-dimensional classification was ambiguous depending on the damage of the cap, internal damage, and material. Therefore, the analysis was performed, as shown in Figure 11, using the third vector for further analysis.
One set of porcelain damage data that was close to the normal cluster range on a two-dimensional graph differed in the normal cluster range and z-axis direction; this allowed for differentiation in the three-dimensional graph. Moreover, it was found that instead of the intact cristobalite data, the intact alumina data were distributed upward in the z-axis direction. However, cap damage and internal damage data were still within the normal data distribution.
The principal component analysis using the time data showed that porcelain damage and material were distinguishable in the three-dimensional graph; however, it was difficult to distinguish between gold and internal damage. To distinguish between these two, new characteristics were derived and analyzed from the frequency domain.
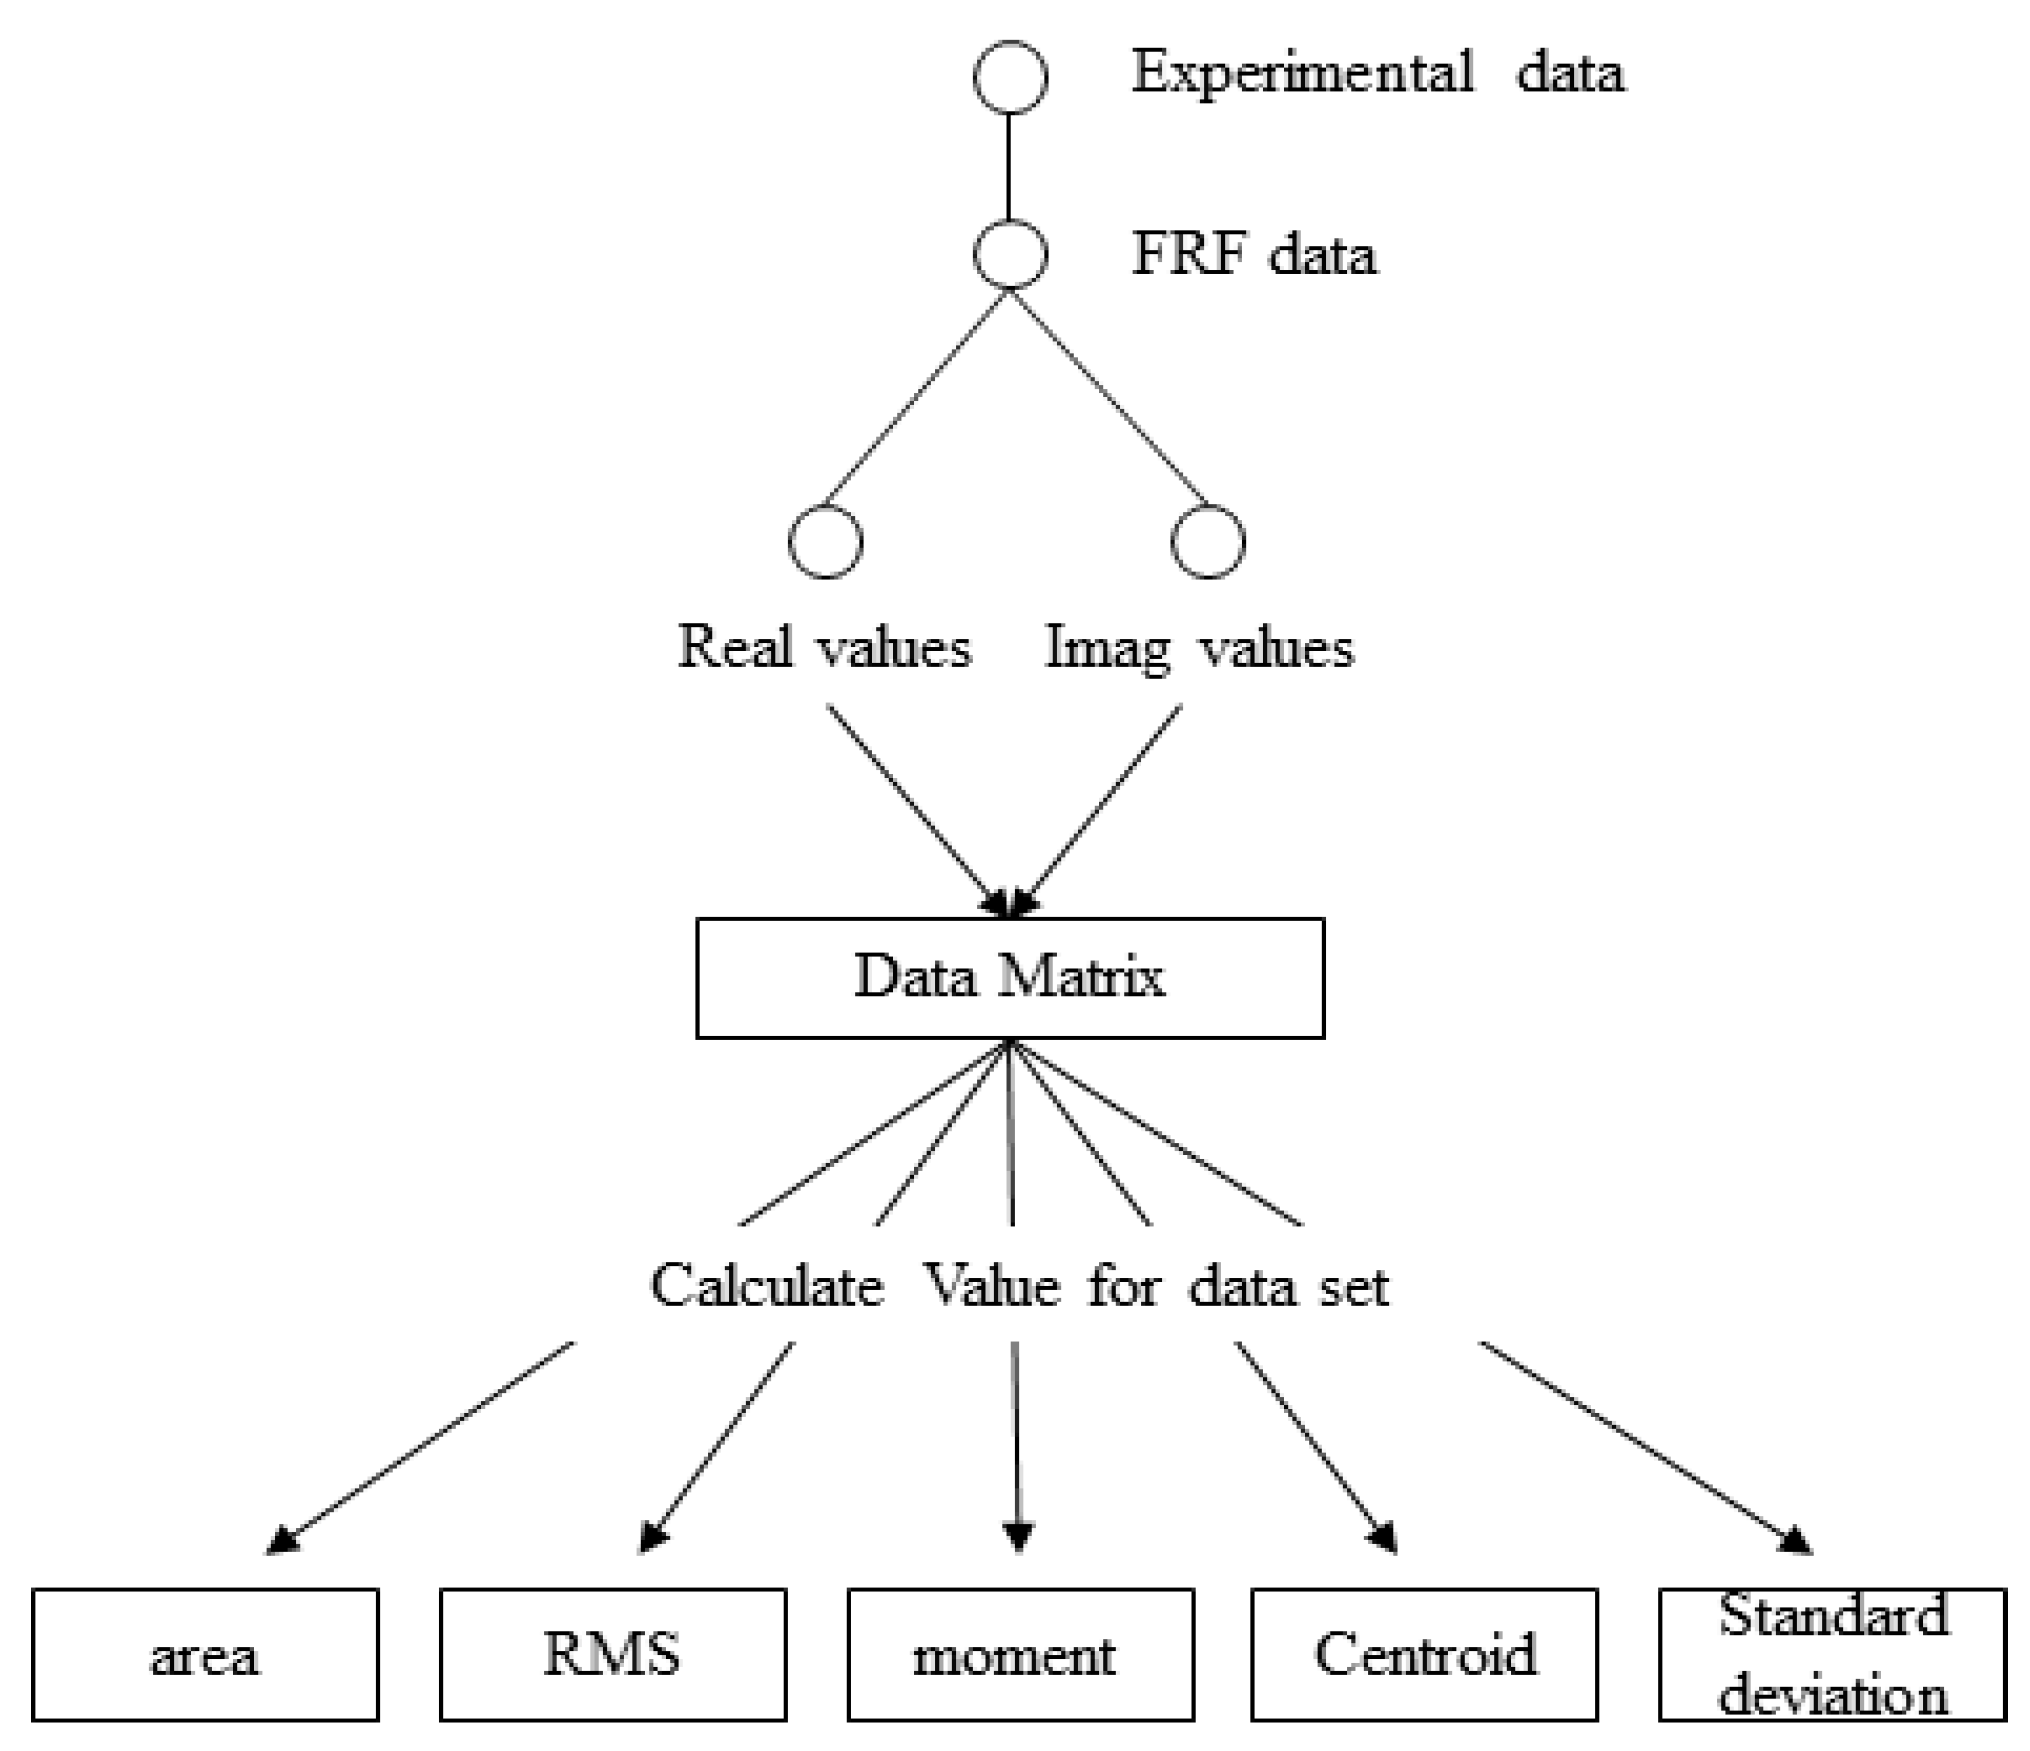
The characteristic extraction of frequency response was based on the frequency response data shown in Figure 6, Figure 7 and Figure 8. The real and imaginary values were set to be the basic values according to the procedure in Figure 12; each of the two values extracted five characteristics for a total of 10 features.
In Figure 12 and Equation (8), area (A) represents the lower area of the frequency response graph curve; Xi denotes the magnitude at each point of the frequency response data:
A = f ( x ) d x = X i .
Root mean square (RMS) can be defined for a continuously varying function in terms of an integral of the squares of the instantaneous values in a cycle:
R M S = 1 n i = 1 n X i 2 .
The geometrical moment of area is obtained by first dividing the shape of area A into n small areas; refer to each small random area as ai; hold the arbitrary orthogonal x for this shape, and adjust the small area ai (xi, yi). The sum of ai × yi for the entire shape is referred to as the primary moment of section with respect to the x-axis, and is given as follows:
Q x = a 1 y 1 + +   a n y n = ( a i y i ) .
The centroid pertains to the coordinates at which the geometrical moment of area of the cross-section for the orthogonal coordinate axis is zero at any given section. To obtain the distance from the orthogonal coordinate axis to the centroid, divide the geometrical moment of area of the section by the area of the shape, as follows:
x ¯ = Q x A .
Because the analysis using time data cannot identify the cap damage and internal damage, an analysis of the frequency response data limited to cristobalite materials was performed.
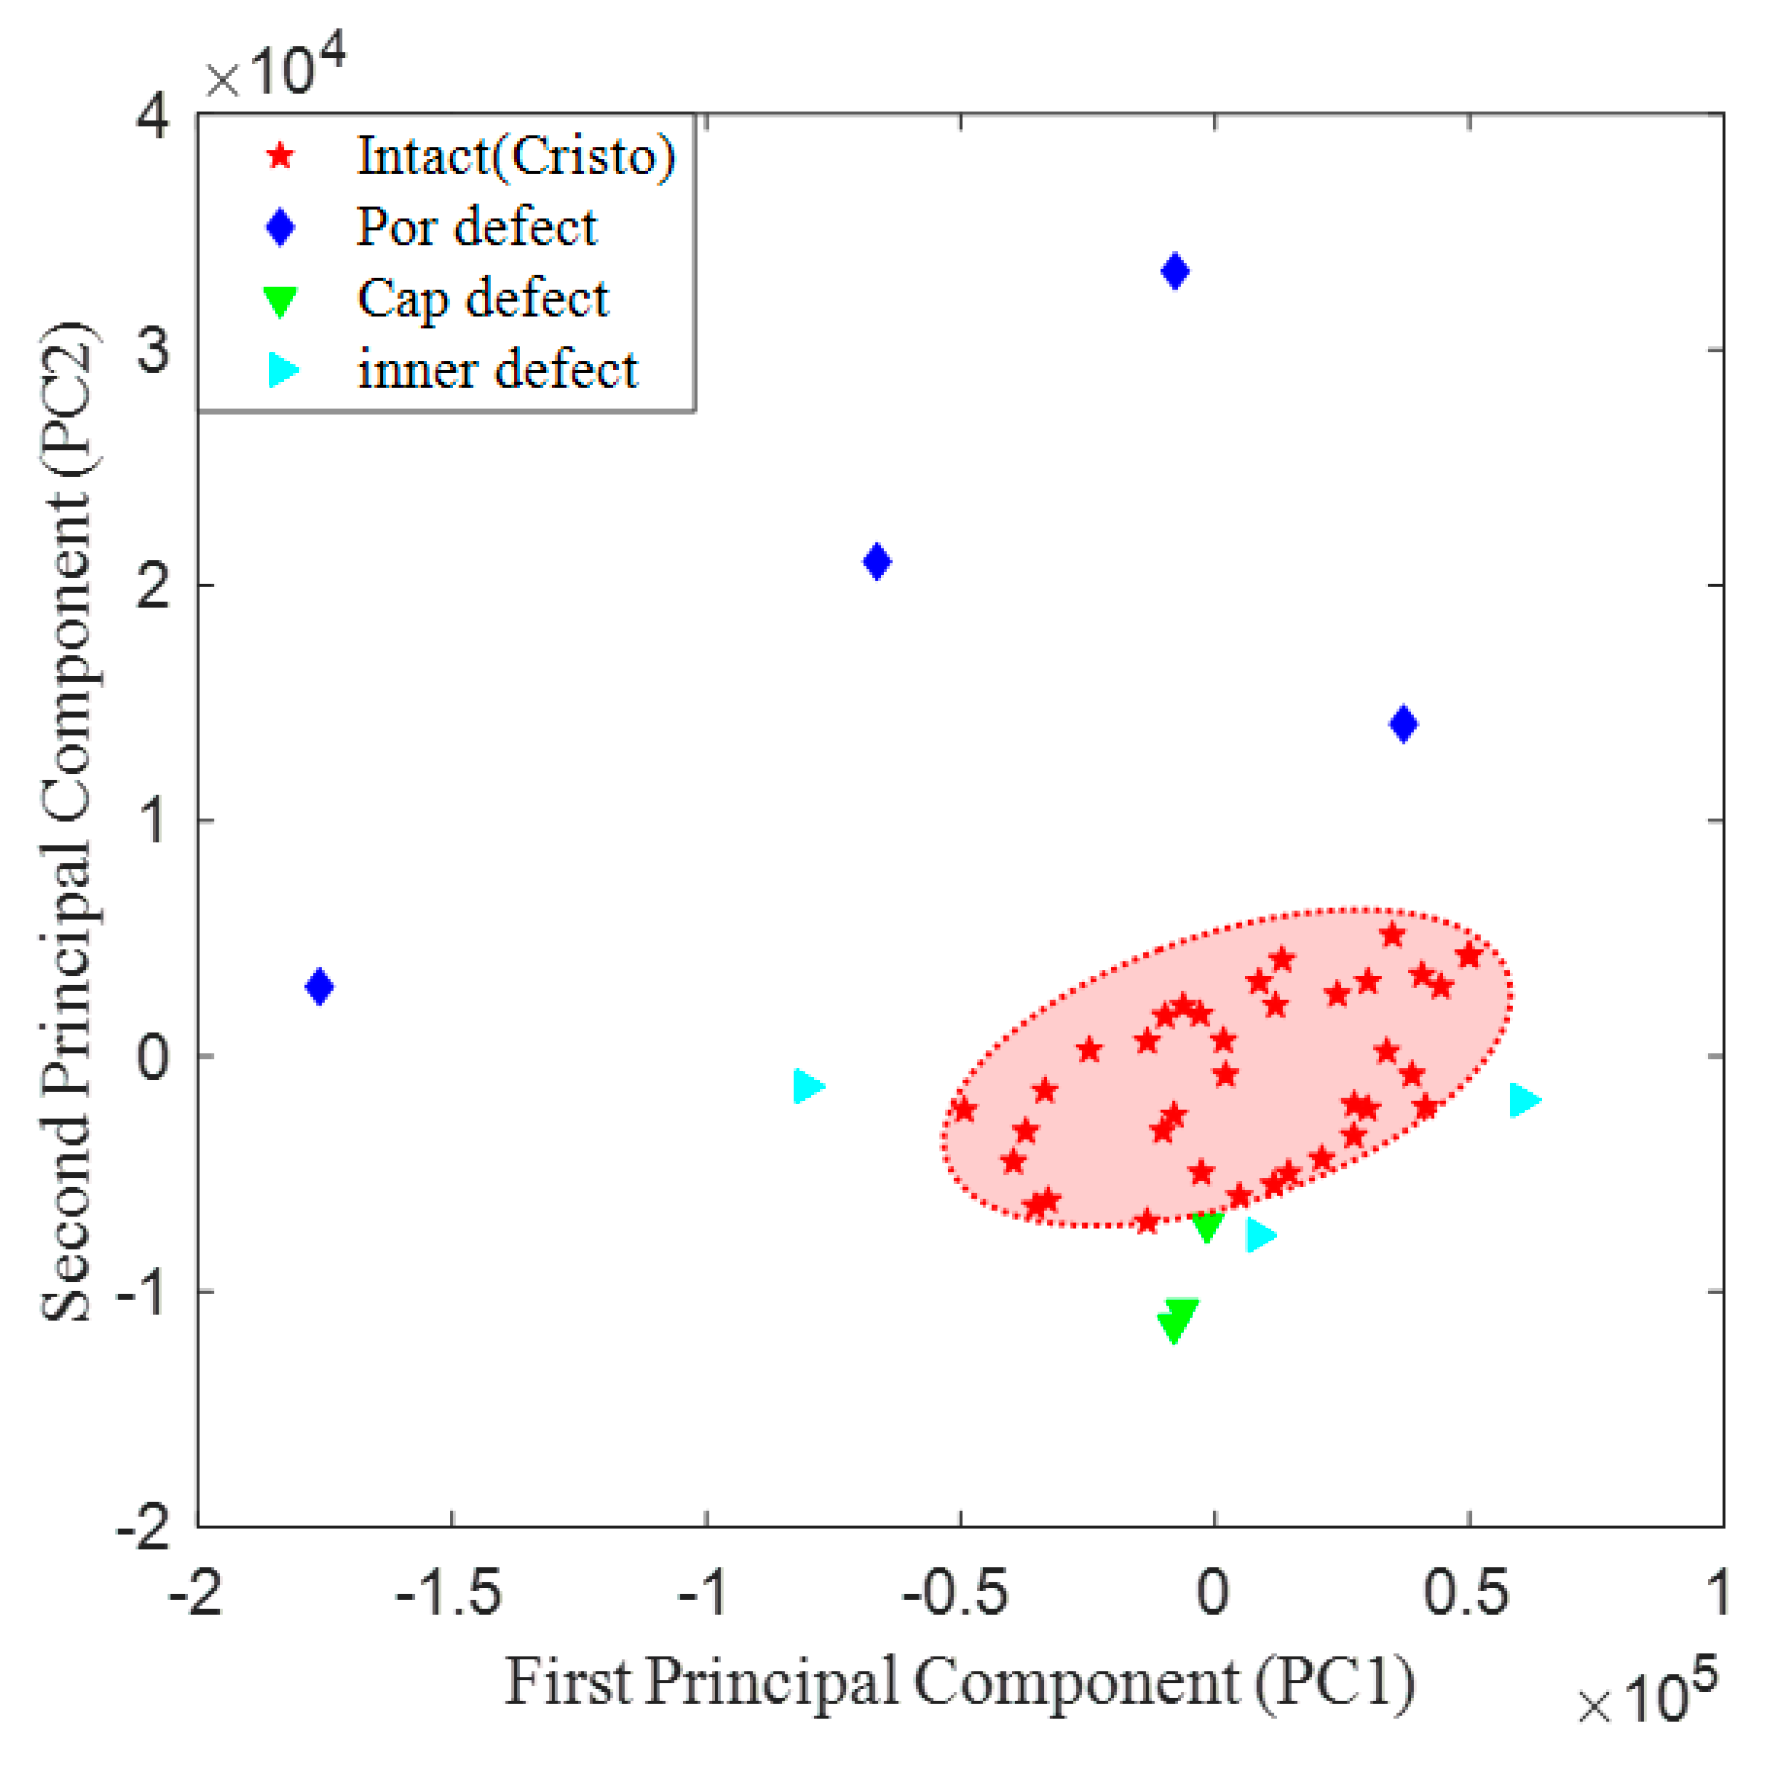
Through PCA, the vector with the greatest contribution of data variances was identified as the moment of real value (98.4%), and the second was the moment of imaginary value (0.10%).
The x-axis coordinates were calculated by PC1 (moment of real value) of the largest variance, and the y-axis coordinates were calculated by PC2 (moment of imaginary value) of the second largest variance; these were plotted two-dimensionally, as shown in Figure 13.
The analysis based on two principal component vectors showed that normal data were clustered within the range of red ellipse; the damage data showed the following differences. Because porcelain damage data were located in the negative direction of PC1 and the positive direction of PC2, it was possible to distinguish these from intact data. Moreover, cap damage data were found to be distributed in the negative direction of PC2 compared with intact data; hence, it was possible to distinguish these from intact data.
In the case of internal damage, it was presumed that the interior of the porcelain was damaged because one data point was located in the negative direction of PC1; it was presumed that the interior of the cap was damaged because two data points were located in the negative direction of PC2. However, because one of the cap damage data points was close to the distribution range of normal data, a third PC vector (area of real value) was employed to perform a three-dimensional analysis, as shown in Figure 14.
The three-dimensional graph analysis of the distribution differences between cap damage data and intact data showed that the former were distributed in the negative direction of PC2 and the latter in the positive direction of PC3.
Using the frequency response data, the two-dimensional and three-dimensional analyses of the newly extracted principal component enabled the distinction among the three types of damage that were initially set. Data of internal damage could be anticipated as porcelain and cap damage depending on the distribution location of data.
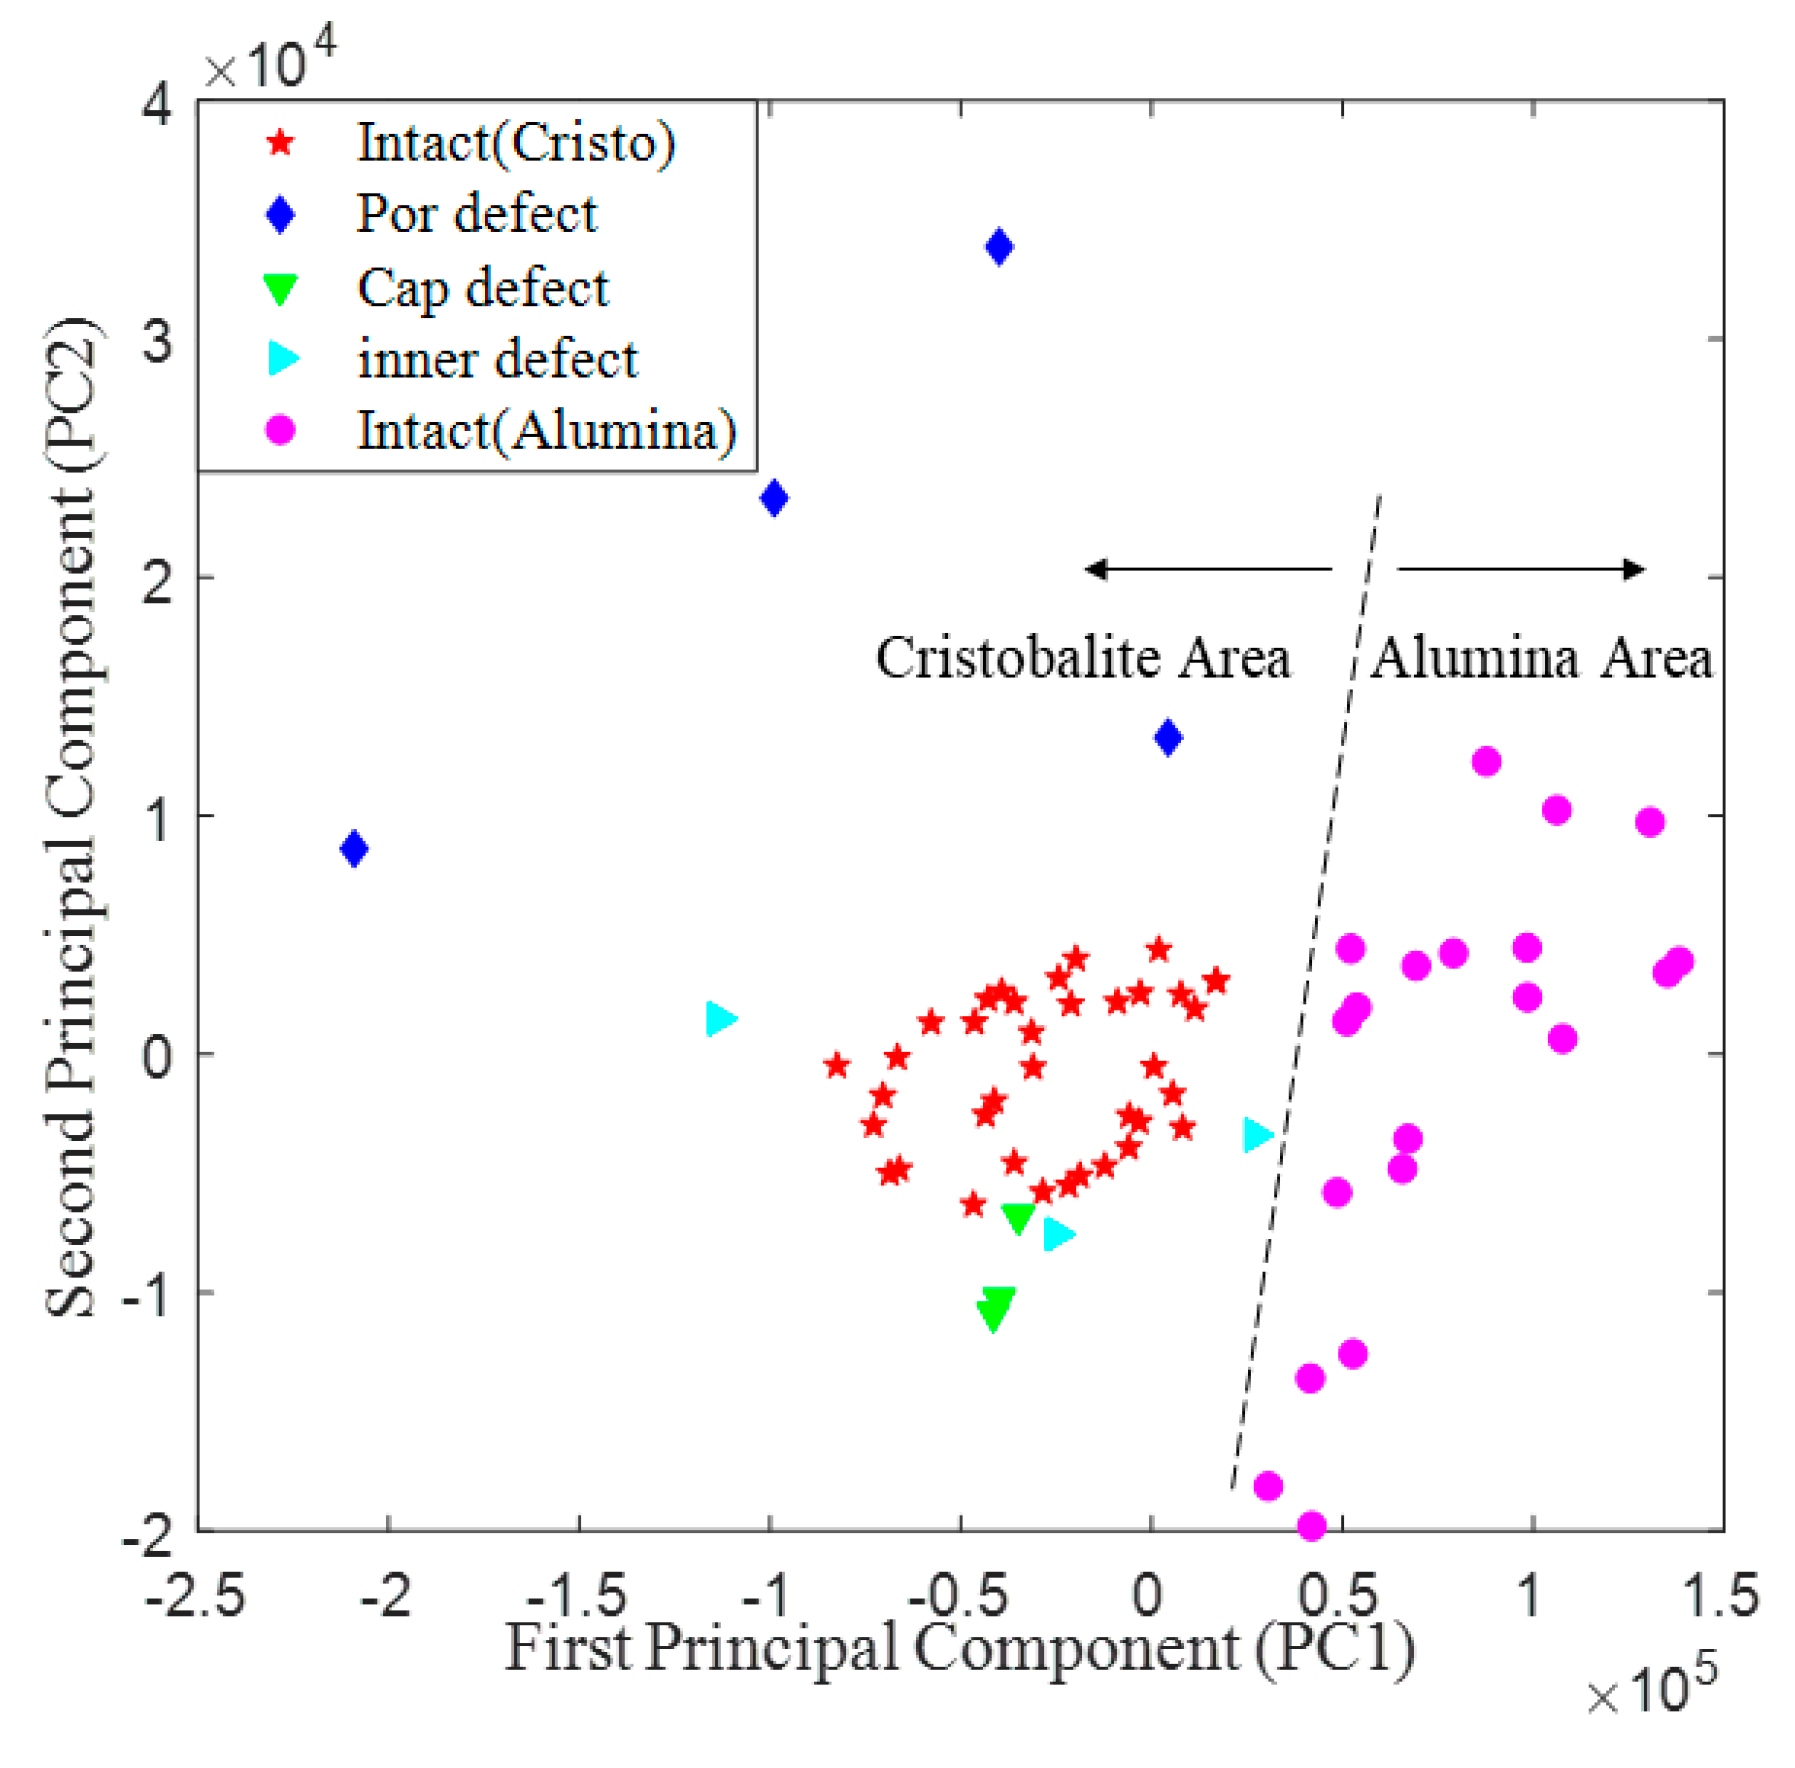
Finally, principal component analysis was conducted using 67 sets of data to distinguish between damage and materials as shown in Figure 15. Based on the main component analysis of the total 67 sets of data, it was calculated that the vector with the greatest variance was the moment of real value (96.70%), and the second vector was the moment of imaginary value (3.29%).
The distribution of cristobalite was the same. Furthermore, data from the intact alumina material were found to be distributed in the positive direction of PC1 whereas in the cristobalite material there was a greater variance in PC2.
The PCA results based on the frequency response data using at least two main component vectors or three main component vectors showed that it was possible to make a distinction between intact and damaged cristobalite materials and between cristobalite and alumina materials.

4. Conclusions

Various methods have been applied, such as insulation resistance measurement, field measurement, temperature measurement, ultrasonic wave method, image analysis, and CT, as conventional methods for evaluating the integrity of insulators. These methods show high reliability in the assessment only under certain conditions, and there are significant deviations from the results depending on the environmental conditions and needs for complicated test equipment. However, the proposed method has the advantage of being less affected by the surrounding environment and being able to judge with high sensitivity and accuracy regardless of the types of insulator and damage. However, this application method also has disadvantages, e.g., it should be applied by proximity to the insulator on site or by sampling in the laboratory. Furthermore, it requires somewhat complicated interpretation and an expert to analyze it.
This paper proposes basic FRA, the PCA of time and frequency response data to distinguish materials and damage type among porcelain insulators. A total of 67 ceramic insulators were collected from 154 kV transmission towers in various locations, and test specimens were constructed to mimic three possible defects at the site. Based on the experimental results, the following conclusions can be drawn:
• Frequency response analysis
The basic frequency response analysis shows that the frequency response function varied depending on the type of material and whether the insulator was intact or damaged. The frequency response of an intact porcelain insulator in cristobalite material was shown in a total of eight natural modes below 10 kHz; in the case of alumina material, the natural modes were shifted to high frequencies. Porcelain damage lost some of the natural modes. Cap damage was similar to the intact response; however, a new natural mode was created in the 1 kHz segment, and the second and third natural modes were moved to a lower frequency. Internal damage was observed as the disappearance of natural modes (such as porcelain damage) or the creation of new modes (such as cap damage).
• PCA using time data
Eleven features were extracted using time data. Only porcelain damage was distinguished through PCA, using kurtosis and average, which are the principal components of a large contribution. With the use of skewness, porcelain damage and materials could be distinguished; however, there was no distinction between cap and internal damage.
• PCA using frequency response data
Ten features were extracted using frequency response data. Through the analysis of the main components, intact, porcelain damage, cap damage, internal damage, and materials were all distinguishable using the moment of real value with considerable variance and the moment of imaginary value. If the third vector of the area of real value with a large variance was included, the distinction became more accurate.
The proposed PCA method requires modification to enhance its accuracy; other optimization features can be applied to determine the methods required in damage identification. Moreover, it has to be generalized to be applicable to various cases for easy and fast damage classification. The foregoing could be areas of future investigations. PCA is expected to perform an important function in determining damage in porcelain insulators for future machine learning analyses.

Author Contributions

I.H.C., J.A.S., and J.B.K. conceived and designed the experiments; Y.G.Y. and T.K.O. performed the experiments and analyzed the data; I.H.C. contributed device/analysis tools; Y.G.Y. and T.K.O. wrote the paper.

Funding

This research was funded by Korea Electric Power Corporation (KEPCO).

Conflicts of Interest

The authors declare no conflict of interest.

References

  1. Looms, J.S.T. Introduction. In Insulators for High Voltages, 7th ed.; Peter Peregrinus Ltd.: London, UK, 1988; pp. 1–3. [Google Scholar]
  2. Choi, I.H.; Kim, T.K.; Yoon, Y.B.; Kim, T.Y.; Nguyen, H.T.; Yi, J.S. A Study on the Life-Time Assessment Ways and Various Failure Types of 154 kV Porcelain Insulators Installed in South Korea. Trans. Electr. Electron. Mater. 2018, 19, 188–194. [Google Scholar] [CrossRef]
  3. Ostendorp, M. Assessing the integrity and remaining service life of vintage high voltage ceramic insulators. In Proceedings of the 2003 IEEE 10th International Conference on Transmission and Distribution Construction, Operation and Live-Line Maintenance, Orlando, FL, USA, 6–10 April 2003; pp. 169–175. [Google Scholar]
  4. Vaillancourt, G.H.; Carignan, S.; Jean, C. Experience with the detection of faulty composite insulators on high-voltage power lines by the electric field measurement method. IEEE Trans. Power Deliv. 1998, 13, 661–666. [Google Scholar] [CrossRef]
  5. Volat, C.; Jabbari, M.; Farzaneh, M.; Duvillaret, L. New method for in live-line detection of small defects in composite insulator based on electro-optic E-field sensor. IEEE Trans. Dielectr. Electr. Insul. 2013, 20, 194–201. [Google Scholar] [CrossRef]
  6. Padma, V.; Raghavan, V.S. Analysis of insulation degradation in Insulators using Partial Discharge analysis. In Proceedings of the 2011 3rd International Conference on Electronics Computer Technology, Kanyakumari, India, 8–10 April 2011; pp. 110–114. [Google Scholar]
  7. Park, K.C.; Motai, Y.C.; Yoon, J.R. Acoustic fault detection technique for high-power insulators. IEEE Trans. Ind. Electron. 2017, 64, 9699–9708. [Google Scholar] [CrossRef]
  8. Cherney, E.A.; Amm, D.E. Development and application of a hot-line suspension insulator tester. IEEE Trans. Power Appar. Syst. 1981, PAS-100, 1525–1528. [Google Scholar] [CrossRef]
  9. Ha, H.; Han, S.; Lee, J. Fault detection on transmission lines using a microphone array and an infrared thermal imaging camera. IEEE Trans. Instrum. Meas. 2012, 61, 267–275. [Google Scholar] [CrossRef]
  10. Kim, T.Y.; Jeon, S.H.; Lee, Y.J.; Yi, J.S.; Choi, I.H.; Son, J.A.; Choi, C.W. Three-Dimensional Computed Tomography and Composition Analysis of Porcelain Insulators for 154-kV Power Transmission Lines. IEEE Trans. Dielectr. Electr. Insul. 2019, 26, 115–119. [Google Scholar] [CrossRef]
  11. Miao, X.R.; Liu, X.Y.; Chen, J.; Zhuang, S.B.; Fan, J.W.; Jiang, H. Insulator Detection in Aerial Images for Transmission Line Inspection Using Single Shot Multibox Detector. IEEE Access 2019, 7, 9945–9956. [Google Scholar] [CrossRef]
  12. Auckland, D.W.; McGrail, A.J.; Smith, C.D.; Varlow, B.R.; Zhao, J.; Zhu, D. Application of ultrasound to the inspection of insulation. IEE Proc. Sci. Meas. Technol. 1996, 143, 177–181. [Google Scholar] [CrossRef]
  13. Wong, K.L. Application of the Very-high Frequency (VHF) Method to Ceramic Insulators. IEEE Trans. Dielectr. Electr. Insulm. 2004, 1, 1057–1064. [Google Scholar] [CrossRef]
  14. Park, J.Y.; Cho, B.H.; Byun, S.H.; Lee, J.K. Development of Robot System for Automatic Cleaning and Inspection of Live-line Suspension Insulator Strings and Its Application. J. Korean Soc. Precis. Eng. 2007, 24, 66–75. [Google Scholar]
  15. Miletiev, R.; Simeonov, I.; Iontchev, E.; Yordanov, R. Time and frequency analysis of the vehicle suspension dynamics. Int. J. Syst. Appl. Eng. Dev. 2013, 7, 287–294. [Google Scholar]
  16. Miyazaki, S.; Mizutani, Y.; Taguchi, A.; Murakami, J.; Tsuji, N.; Takashima, M.; Kato, O. Diagnosis Criterion of Abnormality of Transformer Winding by Frequency Response Analysis (FRA). Electr. Eng. Jpn. 2017, 201, 25–34. [Google Scholar] [CrossRef]
  17. Sano, T.; Miyagi, K. Experimental investigation on FRA diagnosis of transformer faults. IEEJ Trans. Power Energy 2007, 127, 791–796. [Google Scholar] [CrossRef]
  18. Ryder, S.A. Diagnosing transformer faults using frequency response analysis. IEEE Electr. Insul. Mag. 2003, 19, 16–22. [Google Scholar] [CrossRef]
  19. Christain, J.; Feser, K. Procedures for detecting winding displacements in power transformer by the transfer function method. IEEE Trans. Power Deliv. 2004, 19, 214–220. [Google Scholar] [CrossRef]
  20. Miyazaki, S.; Mizutani, Y.; Matsumoto, K.; Nakamura, S. On-Site Diagnosis of Transformer Winding by Frequency Response Analysis. IEEJ Trans. Power Energy 2010, 130, 451–459. [Google Scholar] [CrossRef]
  21. Li, J.C.; Dackermann, U.; Xu, Y.L.; Samali, B. Damage identification in civil engineering structures utilizing PCA-compressed residual frequency response functions and neural network ensembles. Struct. Control Health Monit. 2011, 18, 207–226. [Google Scholar] [CrossRef]
  22. Zhang, G.; Tang, L.Q.; Zhou, L.C.; Liu, Z.J.; Liu, Y.P.; Jiang, Z.Y. Principal Component Analysis Method with Space and Time Windows for Damage Detection. Sensors 2019, 19, 2521. [Google Scholar] [CrossRef]
  23. Pearson, K. On lines and planes of closest fit to systems of points in space. In The London, Edinburgh and Dublin Philosophical Magazine and Journal of Science, 6th ed.; Taylor and Francis: London, UK, 1901; Volume 2, pp. 559–572. [Google Scholar]
  24. Hotelling, H. Analysis of a complex of statistical variables into principal components. J. Educ. Psychol. 1933, 24, 417–441. [Google Scholar] [CrossRef]
  25. Jolliffe, I.T. Principal Component Analysis, 2nd ed.; Springer Science & Business Media: New York, NY, USA, 2002; pp. 1–27. [Google Scholar]
  26. Tharwat, A. Principal component analysis-a tutorial. IJAPR 2016, 3, 197–240. [Google Scholar] [CrossRef]
  27. Stoica, P.; Moses, R. Introduction to Spectral Analysis, 1st ed.; Prentice Hall: Ann Arbor, MI, USA, 1997; pp. 52–54. [Google Scholar]
  28. ES (Technical Standards of KEPCO). Testing Methods for Insulators; Korea Electric Power Corporation: Daejeon, Korea, 2014. [Google Scholar]
  29. Anjum, S.; Jayaram, S.; El-Hag, A.; Naderian, A. Radio frequency (RF) technique for field inspection of porcelain insulators. In Proceedings of the 2015 IEEE 11th International Conference on the Properties and Applications of Dielectric Materials (ICPADM), Sydney, NSW, Australia, 19–22 July 2015; pp. 1019–1022. [Google Scholar]
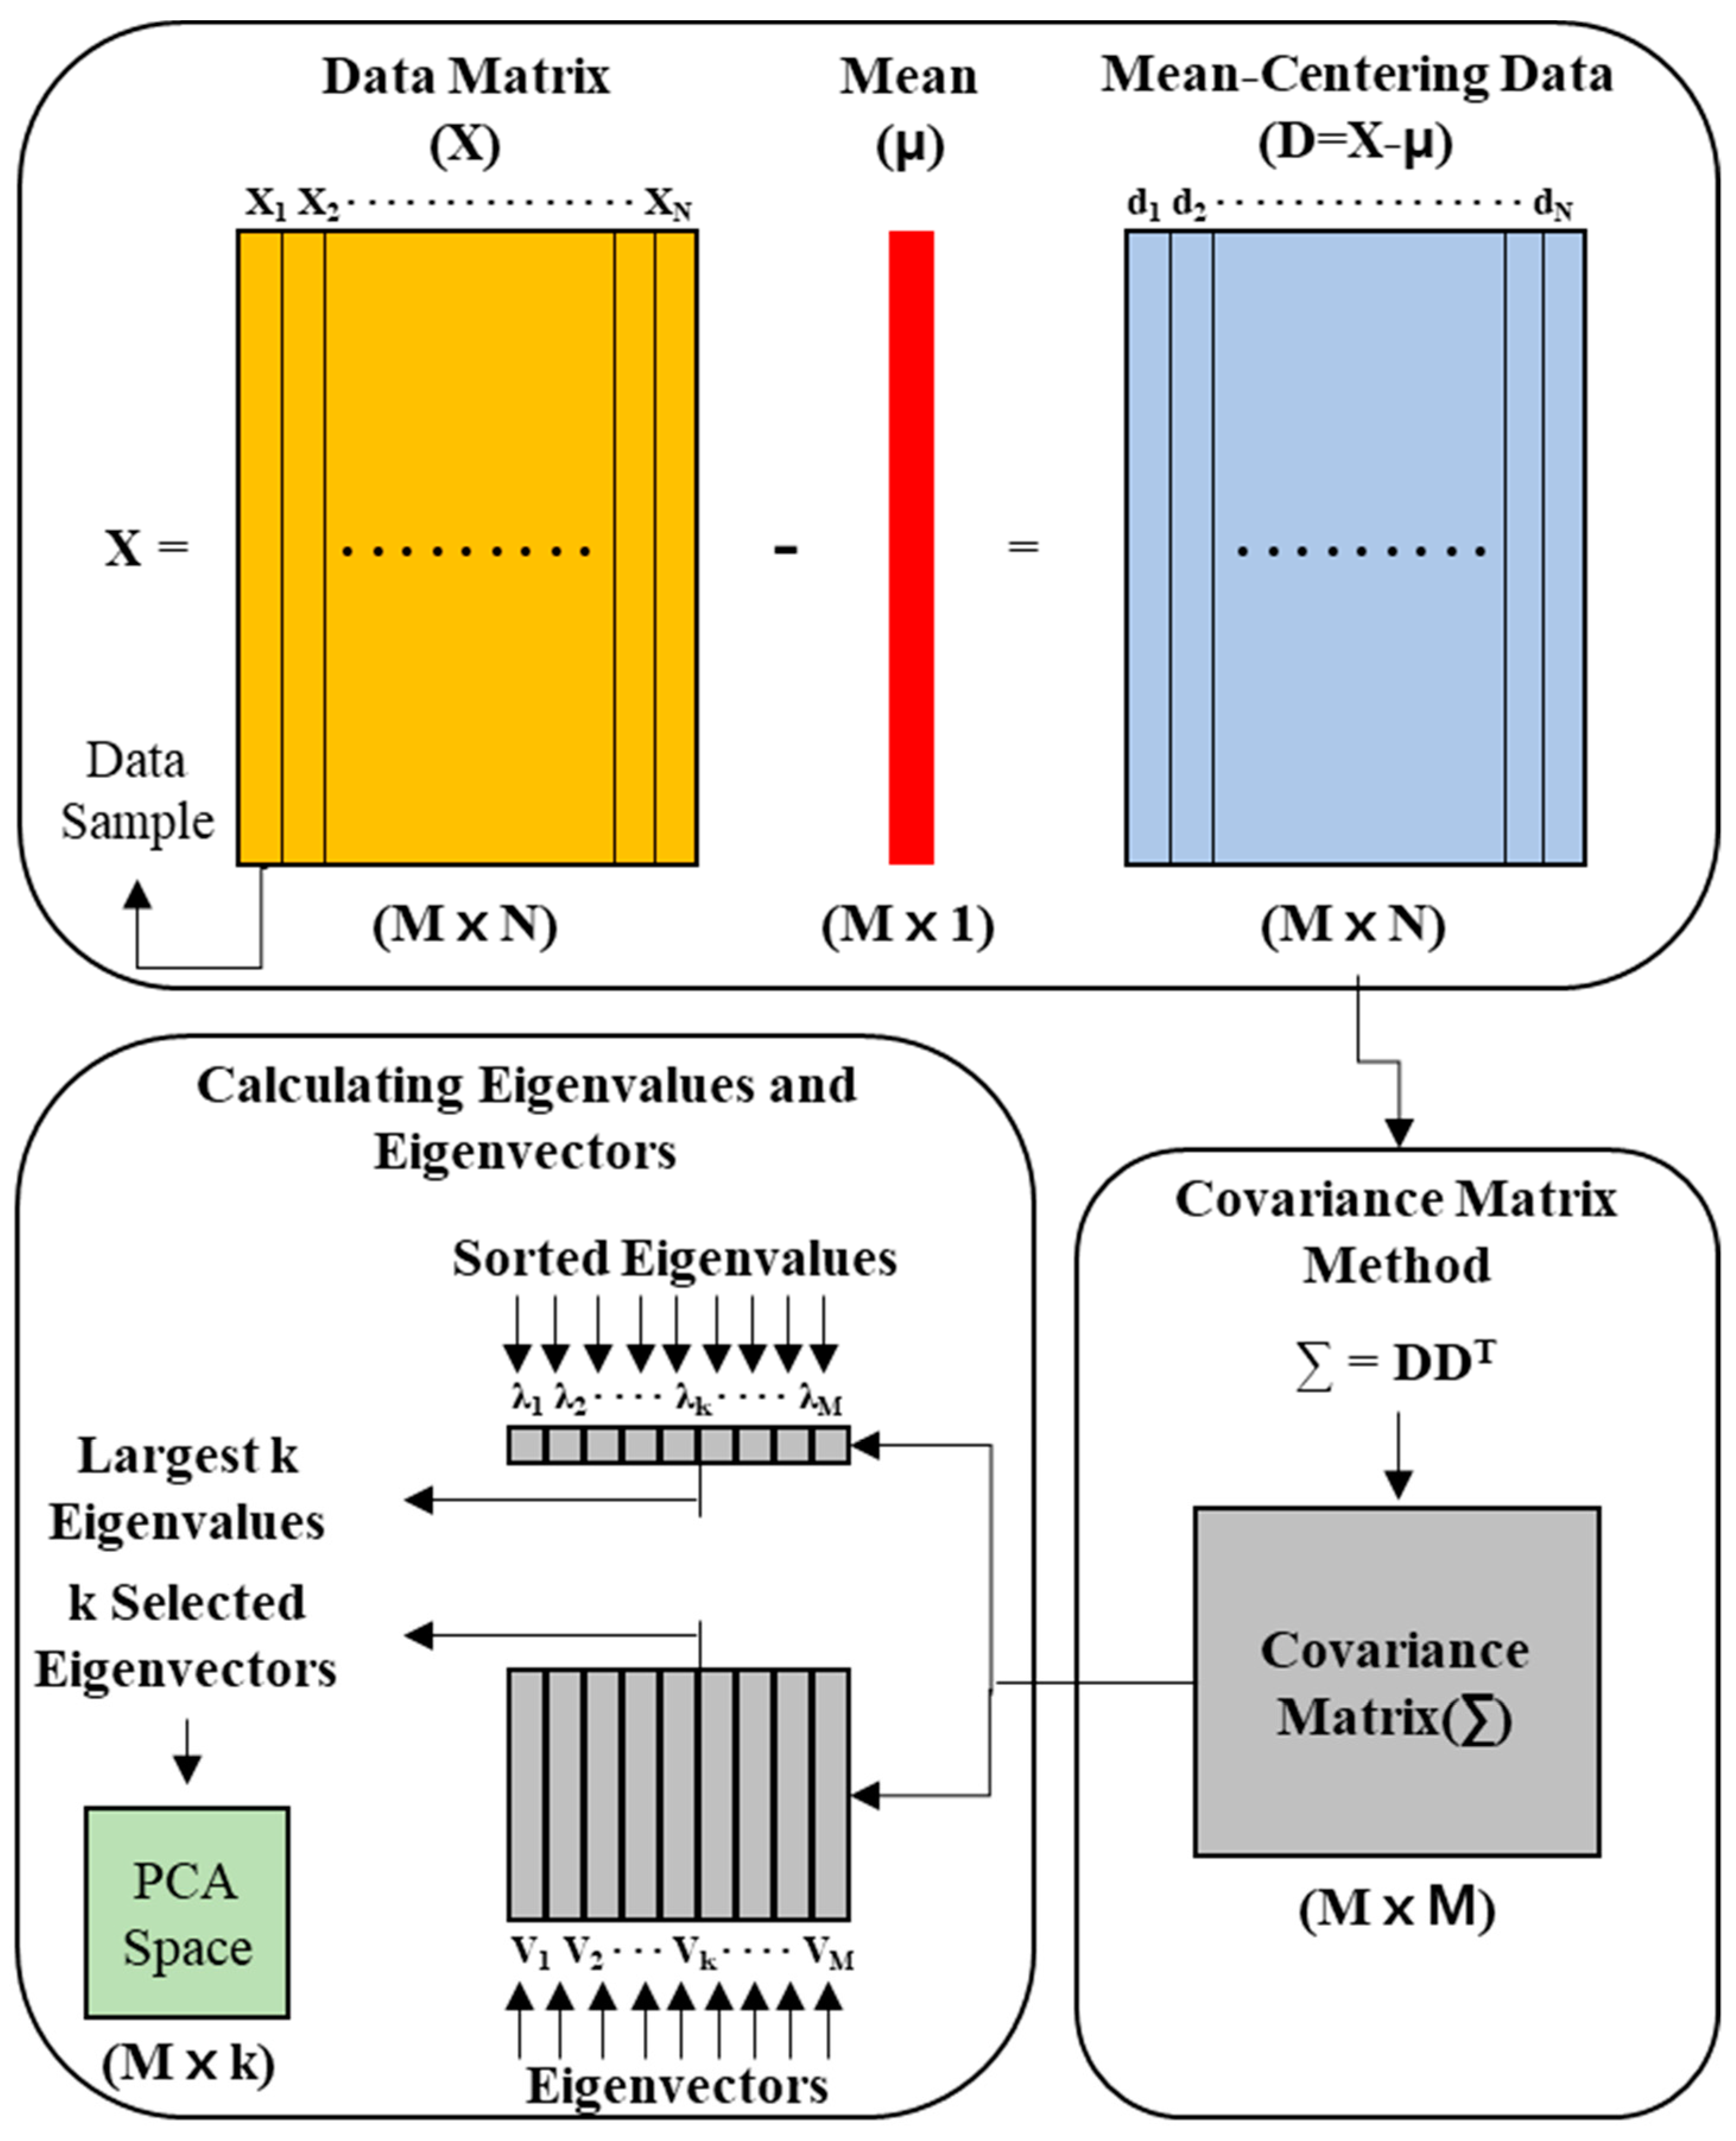
Figure 1. Visualized steps in calculating principal component analysis (PCA) space using covariance matrix.
Applsci 09 03150 g001
Figure 2. Experimental setup for frequency response function measurement of porcelain insulator. (a) Impact hammer; (b) accelerometer; (c) signal conditioner; (d) DAQ; (e) data visualization.
Applsci 09 03150 g002
Figure 3. Frequency response function (FRF) results according to impact and sensor position.
Applsci 09 03150 g003
Figure 4. FRF results of five experimental and average values.
Applsci 09 03150 g004
Figure 5. Natural frequency of FRF results according to material.
Applsci 09 03150 g005
Figure 6. Defective porcelain samples and FRF result. A-1, A-2, A-3: Broken porcelain discs; A-4: Porcelain disc with crack.
Applsci 09 03150 g006
Figure 7. Cap defective samples and FRF results.
Applsci 09 03150 g007
Figure 8. Internally defective samples and FRF results.
Applsci 09 03150 g008
Figure 9. Features extracted from time series of experimental data.
Applsci 09 03150 g009
Figure 10. 2D plot using extracted two eigenvectors from time data.
Applsci 09 03150 g010
Figure 11. 2D and 3D plots using two and three eigenvectors extracted from time data. (a) 2D plot using PC1 an PC3; (b) 2D plot using PC2 and PC3; (c) 3D plot using largest PC1, PC2, and PC3.
Applsci 09 03150 g011
Figure 12. Features extracted from frequency response of experimental data.
Applsci 09 03150 g012
Figure 13. Two-dimensional plot using two eigenvectors extracted from frequency response data.
Applsci 09 03150 g013
Figure 14. Three-dimensional plot using three eigenvectors extracted from frequency response data.
Applsci 09 03150 g014
Figure 15. Two-dimensional plot using two eigenvectors extracted from frequency response of all data.
Applsci 09 03150 g015
Table 1. Classification of specimens according to material and defect.
CategoryCristobaliteAluminaSum
Total472067
Intact372057
Damage
type
Sub Total10-10
Porcelain Defect4-4
Cap Defect3-3
Internal defect3-3
Table 2. Type according to impact hammer and sensor position.
TypeImpactSensor
Type 1PorcelainCap
Type 2PorcelainPorcelain
Type 3CapCap
Type 4CapPorcelain
Table 3. Range of natural frequency according to materials.
ModeCristobaliteAlumina
Frequency, MinFrequency, MaxFrequency, AverageStandard DeviationFrequency, MinFrequency, MaxFrequency, AverageStandard Deviation
119202040198628.021002180214122.5
228803000293731.730403140309824.7
333603460340832.535803660361620.9
439404100402243.142804420435038.6