Article

A Hybrid Two-Phase Recommendation for Group-Buying E-commerce Applications

1
School of Accounting, Shanghai Lixin University of Accounting and Finance, Shanghai 201602, China
2
College of Electrical Information and Engineering, Tongji University, Shanghai 201804, China
*
Author to whom correspondence should be addressed.
Appl. Sci. 2019, 9(15), 3141; https://doi.org/10.3390/app9153141
Submission received: 27 June 2019 / Revised: 19 July 2019 / Accepted: 31 July 2019 / Published: 2 August 2019

Abstract

:

Featured Application

The hybrid two-phase recommendation for some group-buying based e-commerce applications, such as Meituan.com and Pinduoduo.com.

Abstract

The last two decades have witnessed an explosive growth of e-commerce applications. Existing online recommendation systems for e-commerce applications, particularly group-buying applications, suffer from scalability and data sparsity problems when confronted with exponentially increasing large-scale data. This leads to a poor recommendation effect of traditional collaborative filtering (CF) methods in group-buying applications. In order to address this challenge, this paper proposes a hybrid two-phase recommendation (HTPR) method which consists of offline preparation and online recommendation, combining clustering and collaborative filtering techniques. The user-item category tendency matrix is constructed after clustering items, and then users are clustered to facilitate personalized recommendation where items are generated by collaborative filtering technology. In addition, a parallelized strategy was developed to optimize the recommendation process. Extensive experiments on a real-world dataset were conducted by comparing HTPR with other three recommendation methods: traditional CF, user-clustering based CF, and item-clustering based CF. The experimental results show that the proposed HTPR method is effective and can improve the accuracy of online recommendation systems for group-buying applications.

1. Introduction

In recent years, the rapid development of the Mobile Internet [1] and Web 2.0 [2,3] has not only transformed people’s way of life but also created new business models and economic behaviors, to enable a culture of sharing-economy. In particular, the last two decades have witnessed an explosive growth of e-commerce applications [4,5], and a great number of users are participating in a lifestyle of shopping online and sharing data. According to the data analytics firm ComScore (http://www.comscore.com/), the sales on Cyber Monday, i.e., the biggest online shopping day in the US, reached $1.35 bn. In China, Alibaba has broken its own record for sales on China’s Single Day in 2017, with 168.2 bn yuan (about $26.4 bn). An enormous amount of data has been produced and has grown exponentially in e-commerce applications. The large-scale data yield the Big Data analytics problem for relevant practitioners [6]. Moreover, the data of group-buying websites, a popular transaction model for online shopping [6,7], are even more complex and dynamic due to the uncertainty, diversity and randomness of user behaviors. Group-buying, also known as collective buying, offers products and services at significantly reduced prices on the condition that a minimum number of buyers would make the purchase. Group-buying can be produced anytime and anywhere, through which discount prices are obtained from retailers when a certain group of people were willing to buy the same item. Therefore, the data of group-buying are sparser compared to that of other e-commerce models. Efficiently and effectively recommending services/items to users in such an application scenario have become a significant challenge [7].
In typical online recommendation systems, results of non-personalized recommendation lack of interpretation and are not acceptable to users because the users’ personalized requirements are not considered [8]. As a result, developing effective personalized recommendation approaches is important for high-quality service recommendation. Neighborhood-based collaborative filtering (CF) approaches [9,10,11,12,13], which include user-based and item-based, have become the most popular technique for a personalized recommendation. The user-based CF approach is to find out a set of users who have similar favor patterns to a given user (i.e., “neighbors” of the user) and recommend to the user those items that other users in the same set like, the item-based CF approach aims to provide a user with the recommendation on an item based on the other items with high correlations (i.e., “neighbors” of the item). In all collaborative filtering methods, it is a significant step to find users’ (or items’) neighbors, that is, a set of similar users (or items). However, current CF methods suffer from such problems as data sparsity and recommendation inaccuracy.
With the rapid development of Big Data techniques and platforms, effective implementation of recommendation approaches in distributed computing platforms such as MapReduce [7] has been explored, which gains good scalability and efficiency in Big Data environments. On the other hand, many studies have proven that online recommendation systems using hybrid recommendation approaches can achieve enhanced effects. Hybrid approaches mainly include collaborative filtering, demographic filtering [14], location information [15,16], clustering [17,18], content filtering [19] and Bayesian networks [20].
In this paper, a hybrid two-phase recommendation (TPR) method is proposed, combining collaborative filtering with clustering techniques. The main contributions of this work are summarized as follows:
-
To alleviate the data sparsity problem, item features and user behaviors were fully investigated; feature description approaches were designed to construct the feature matrix.
-
Based on item clustering, the user-item category tendency was defined to integrate users’ preferences with users’ concern degrees for item category. In addition, a concept of integrating similarity between users is proposed by considering user behaviors and frequencies of these behaviors.
-
A parallelized strategy of execution is proposed to improve the capability of dealing with massive data with the recommendation process. To be specific, after item clustering, the rating for new items (not rated) was predicted and taken as supplementation of the feature matrix. Meanwhile, considering item clusters, user clustering was performed on the basis of the integrating similarity and the user-item tendency matrix.
-
An improved K nearest neighbors (KNN) method was designed to generate a personalized recommendation list. The key idea was to determine the nearest neighbors by measuring the similarity between the target user and related clusters, which were selected by comparing cluster centers with a predefined similarity threshold.
-
The rest of this paper is organized as follows: Section 2 introduces recommendation techniques and the clustering-based two-phase recommendation. Section 3 analyzes the research problem. Section 4 illustrates the proposed HTPR method in detail. Section 5 shows the experimental results, and Section 6 concludes the paper and discusses future work.

2. Literature Review

2.1. Recommendation Techniques

Recommendation systems, first proposed by Resnick [21], have become popular solutions to provide users with predictions and appropriate recommendations by utilizing diverse sources of information. A recommendation system was originally defined as a system that generates personalized recommendation as output to guide the user in an individual way to interesting or useful services in a large space of potential options [21,22,23,24,25,26]. In general, a recommendation system has:
(1)
feature input the information that describes the user’s preferences/item features in a specific data structure;
(2)
a recommendation engine that combines user’s characteristic analysis and recommendation models building to generate suggestions;
(3)
output the information that presents in various forms including rating prediction and Top-N recommendations.
In basic CF methods, the target user receives recommended items preferred by similar users, or items which are similar to preferred items by the user. The former is called user-based CF (UCF), while the latter is called item-based CF (ICF). Both of them are memory-based CF. Memory-based CF [27] is a common approach extensively applied in e-commerce platforms such as Amazon, and Taobao. Memory-based approaches identify the similarity between two users by comparing their ratings on a set of items [28], which are simple and intuitive at the conceptual level. Nevertheless, they suffer from two drawbacks: sparsity and scalability. The data sparsity problem [29] in the user-item matrix has greatly limited the applicability of this kind of CF since it is difficult to make rating predictions using sparse training data. Some approaches have been proposed to address this problem, such as default voting methods [30], imputation-boosted techniques [31], and clustering-based approaches [32]. In general, unknown ratings are filled with constant values without actual variances considered. Moreover, the computational complexity of these methods grows linearly with the number of users and items.
Model-based CF finds the relations between various items by analyzing the user-item matrix and then obtains the list of recommendations based on the relations. In light of the scalability issues, a prediction model is produced in model-based CF [33] mostly by machine learning techniques to predict the unknown data [34]. Commonly-used model-building methods include neural networks [35], matrix factorization [36], and latent semantic models [37]. User-to-user correlations are represented with the relations of their ratings without regarding specific features and attributes of items. It is not valid to analyze the users’ interests based on insufficient information. Besides, these approaches are time-consuming to build and update to some extent [38]. Rafailidis et al. [39] proposed a new measure of user-preference dynamics and a model of user-item interactions over time by applying a tensor that takes time as a dimension.
The mainstream recommendation techniques are listed and compared in Table 1. It can be seen from the table that these methods have diverse performances in aspects of cold-start [40], data sparsity, scalability, accuracy and interpretability.
The basic idea of recommendation techniques is to mine the similarity of data. Existing research efforts are mainly based on the following considerations:
(1)
content filtering: recommending services similar to those the user used to like;
(2)
social filtering: recommending services similar to those the user’s friends or other users who have similar preferences in the past;
(3)
collaborative filtering: finding out the similarity of items, or the similarity of users by mining their historical behaviors, further to generate a recommendation.

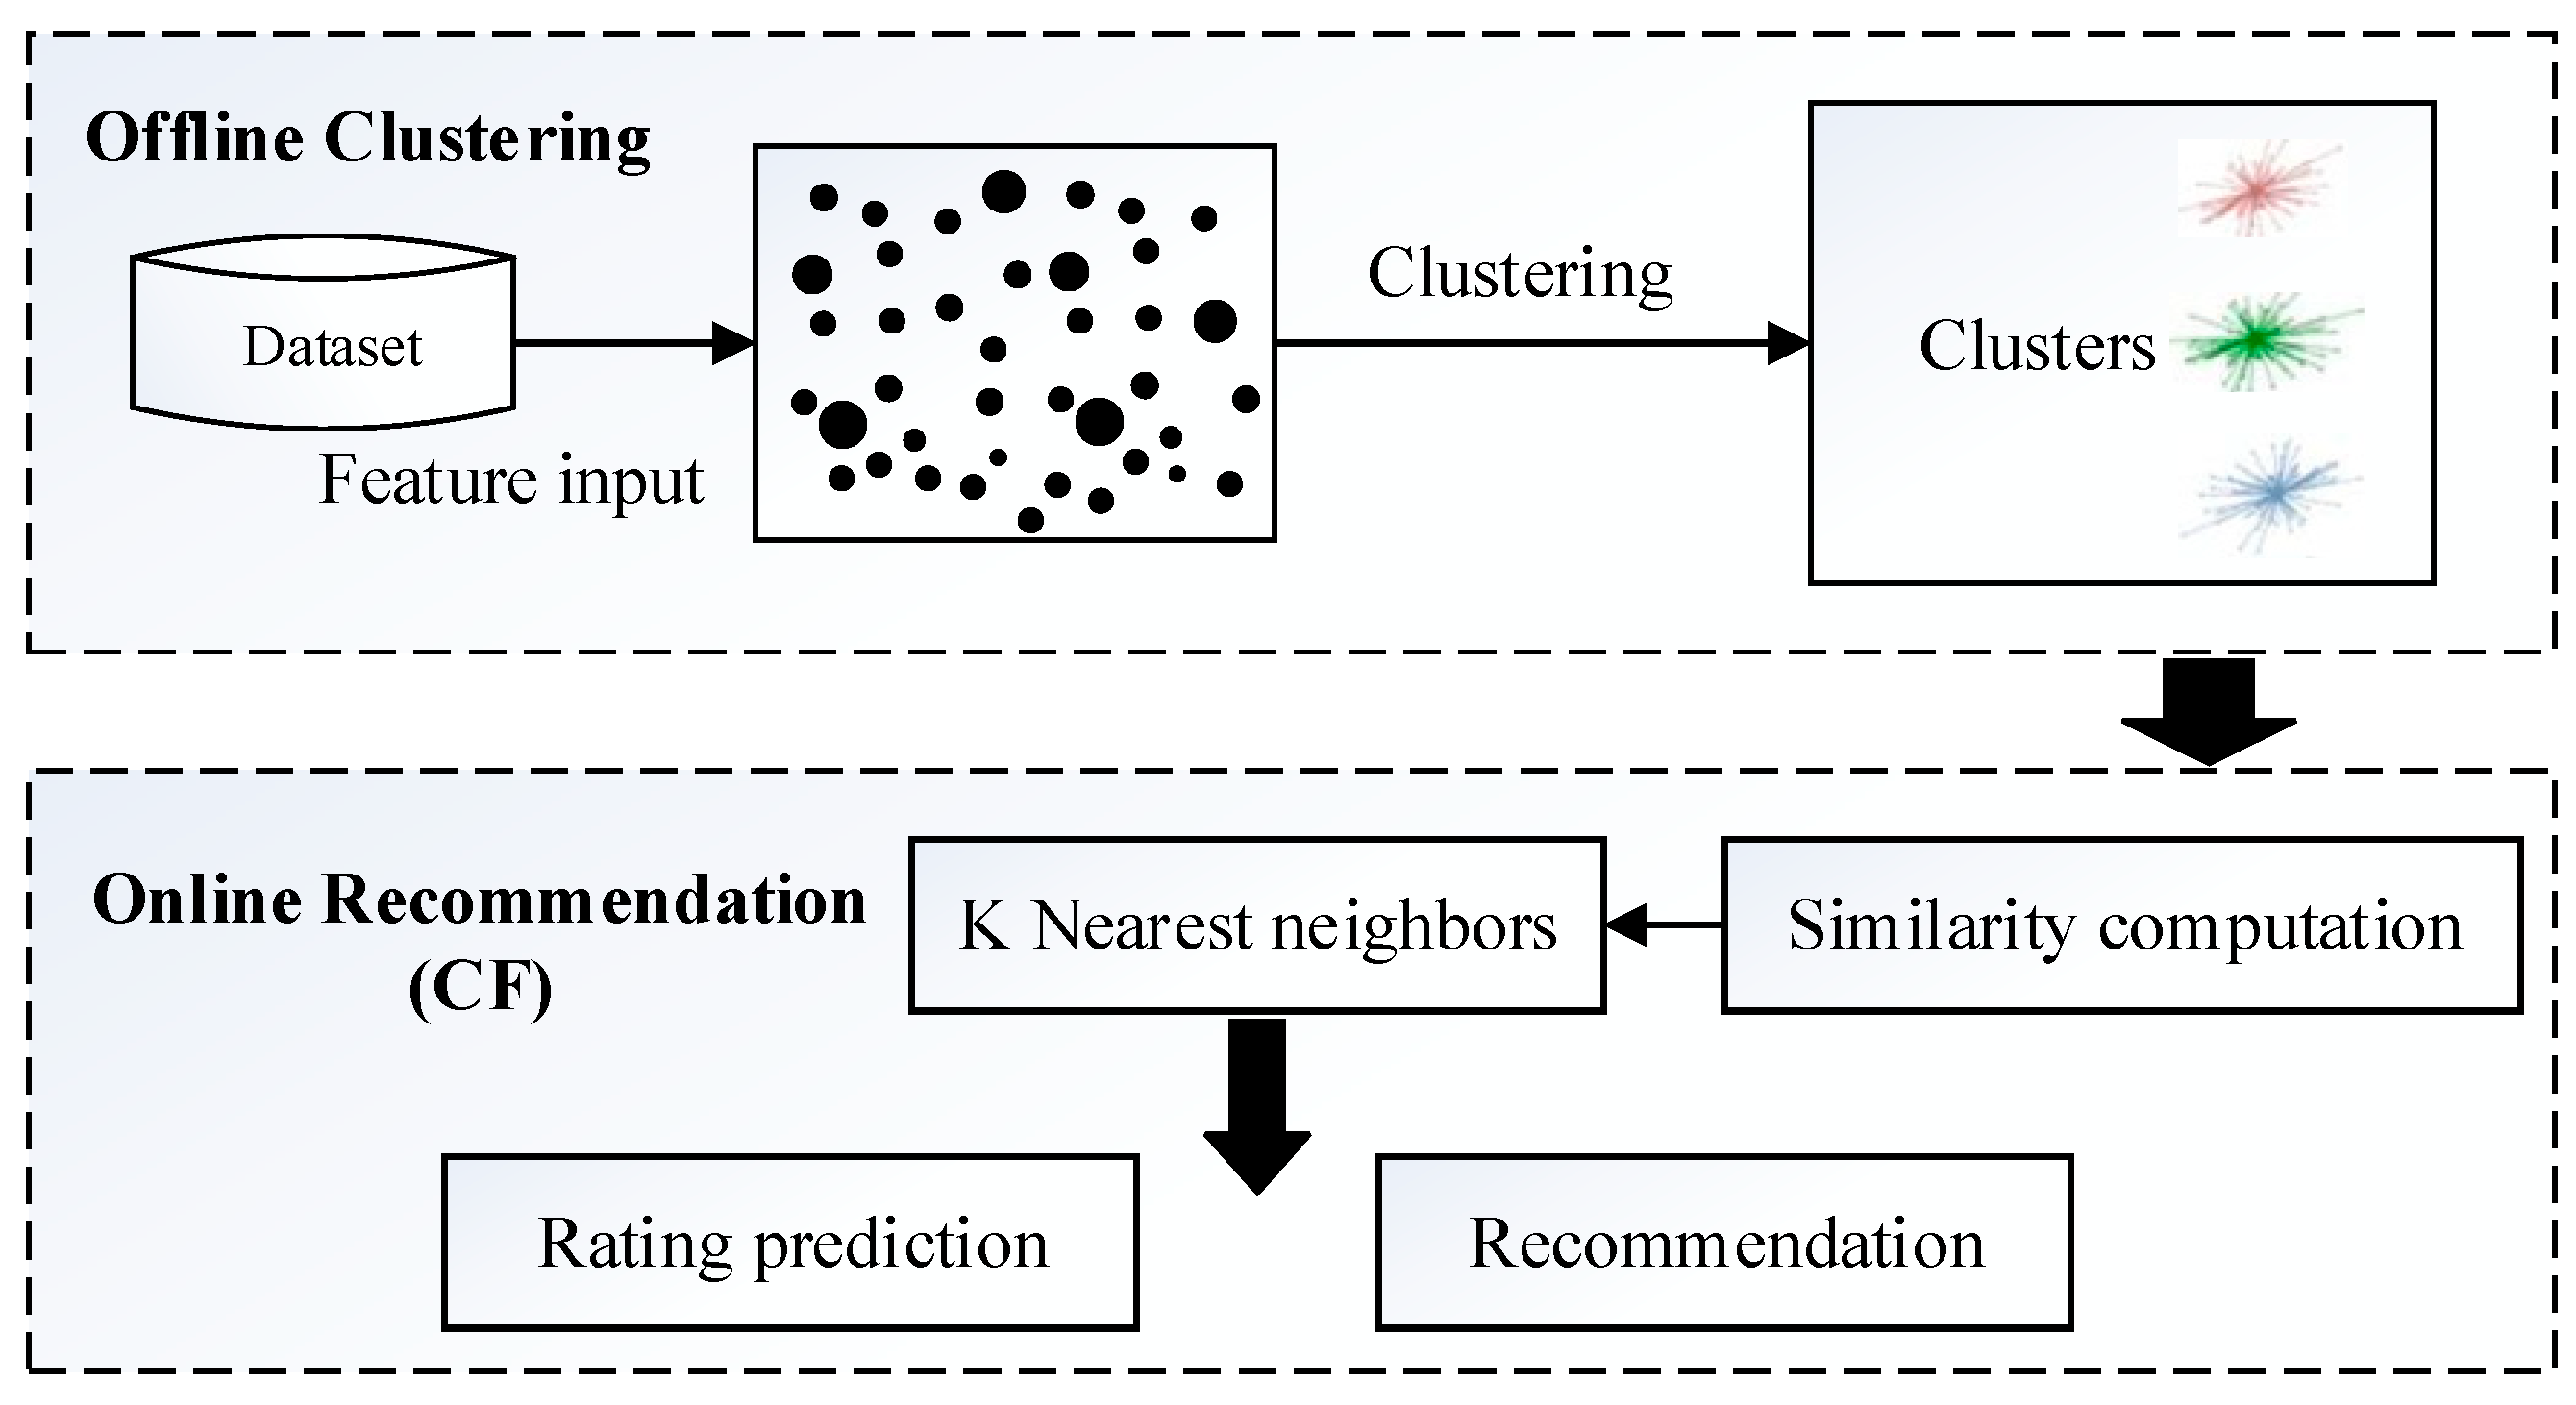
2.2. Clustering Based Two-Phase Recommendation

Existing literature has addressed the improvement of the CF algorithm through clustering analysis. For example, in Reference [41], users are grouped into clusters to find a match between the target user and each user group. Figure 1 illustrates a two-phase strategy for a recommendation based on clustering techniques, which consists of two phases, i.e., offline clustering and online recommendation. Before making rating predictions according to neighbors, users or items are aggregated first to form clusters, from which the nearest neighbors are determined through similarity calculation. Once clusters of the target user are determined, rating predictions can be made in view of the ratings of nearest neighbors of the small-scale clusters in the phase of online recommendation. In this way, the computational complexity of the CF algorithm is optimized.
However, most of them focus on clustering analysis of items only or users only. Furthermore, due to the sparsity of the user-item rating matrix, the deviation of similarity calculation is quite large, making it difficult to guarantee the quality of recommendation services. This paper proposes a hybrid recommendation method considering both item clustering and user clustering.

3. Problem Analysis

3.1. Problem Statement

Information of a recommendation system consists of data of users and items, including user features, item attributes, and the relation of user and item. A recommendation system involves users, items, and their relations. Here, relations refer to user behaviors on items, such as searches, purchases and ratings. User features refer to the basic user information submitted during the user registration process. Item attributes include all the information about an item. As indicated in Figure 2, there are three kinds of relations in the recommendation system: user-user feature (U2F) relation, user-item (U-I) relation, and item-item attribute (I2A) relation.
U-I relations are the most important relations which are used by a collaborative filtering algorithm to generate recommendations. Traditional CF methods rely on user-item rating matrix, and recommendations are generated through similarities of users or items. However, their accuracy of recommendations is not always satisfactory due to the sparsity problem of the matrix. A user often gives ratings only for items that he/she is interested in. The low possibility of rating leads to a serious lack of rating data, and further influences the quality of recommendation based on the CF methods.
Based on the analysis above, we will make full use of objects and information on recommendation systems such as metadata of items, information of user behaviors. The extracted data will be used to supplement the feature matrix.

3.2. Feature Description

Generally, a recommendation system involves data like item features and user behaviors. Apart from rating information, browse information, add-to-favorite records, purchase and other user behaviors are integrated to complete the description of U-I relations. On the other hand, information of item features is comparatively important for I2A relation, and the features of the item can be extracted and regarded as a complement to U-I relation.

3.2.1. Feature Description of Item Attribute

An item generally contains a variety of attributes, which are inherent in the item and vary from item to item. The feature description of items based on attributes is a true reflection of the I2A relation.
Assuming that an item includes multiple attributes, each item is represented by a p-dimensional vector (each item has at most p attributes). An item/attribute matrix with m items is denoted as A = ( a j , φ ) m × p , item j is represented by { a j , 1 , a j , 2 , , a j , φ , , a j , p } , where a j , φ , a j , φ { 0 , 1 } is the φ-th attribute of item j, j [ 1 , m ] , φ [ 1 , p ] .

3.2.2. Feature Description of User Behavior

User behaviors can be categorized as explicit and implicit behaviors. Table 2 lists common user behaviors. The feature description of user behaviors consists of user-item browse matrix, user-item wish list matrix, user-item purchase matrix, user-item rating matrix, and item review tag matrix.
User-item browse matrix: count the number of browse of a user on an item for a period of time and then store the number in B = ( b i , j ) n × m , where b i , j denotes the number of browse of the user i on the item j, i [ 1 , n ] , j [ 1 , m ] .
User-item wish list matrix: record the wish list of items added to the favorites by a user for a period of time and then store it in W = ( w i , j ) n × m , where w i , j { 0 , 1 } , if the user i added the item j to the favorites, then w i , j = 1 , otherwise, w i , j = 0 , i [ 1 , n ] , j [ 1 , m ] .
User-item purchase matrix: count the number of purchase by a user for a period of time and then store it in O = ( o i , j ) n × m , where o i , j denotes the number of purchase by the user i for the item j, i [ 1 , n ] , j [ 1 , m ] .
User-item rating matrix: record the rating of a user on an item and then store it in R = ( r i , j ) n × m , where r i , j represents the rating of the user i on the item j on a scale of zero to four, i [ 1 , n ] , j [ 1 , m ] .
Item review tag matrix: extract feature tags that represent community opinions on an item from the review content by using textual analysis, the matrix is denoted as T a g = ( t a g j , η ) m × q , 0 < t a g j , η < 1 where t a g j , η represents the η-th tag of item j, η [ 1 , q ] , j [ 1 , m ] .

4. Proposed HTPR Method

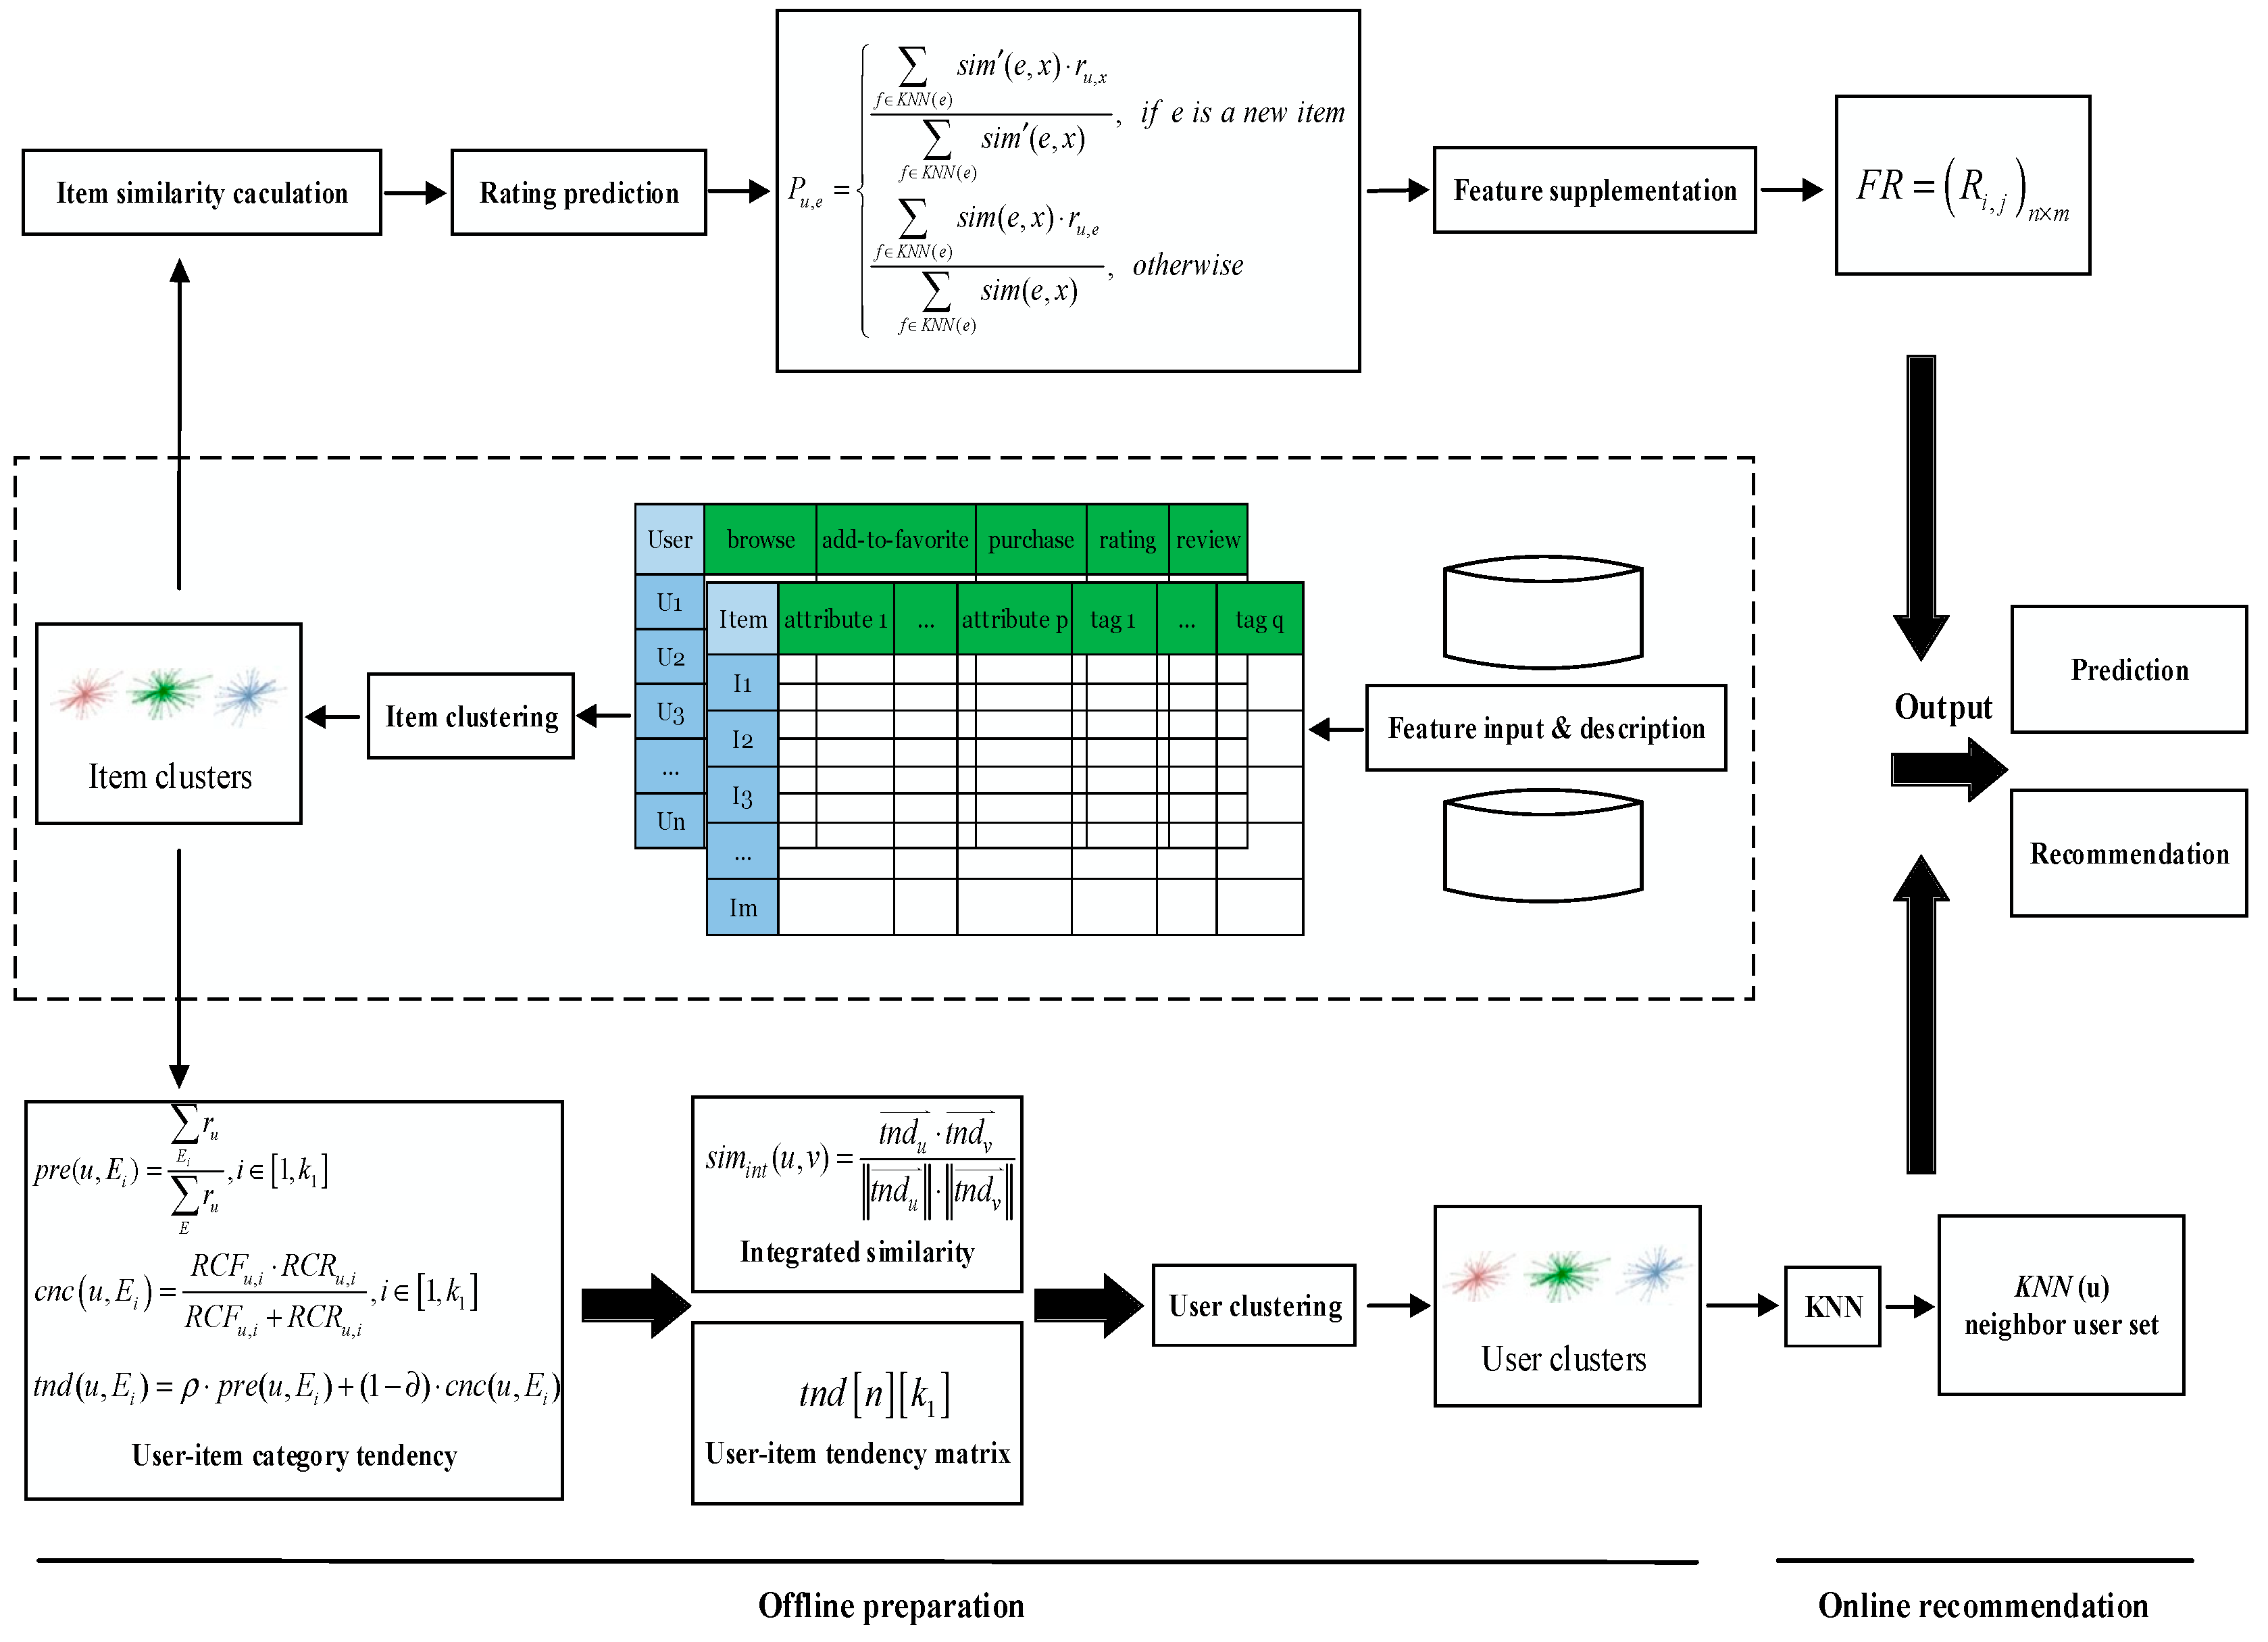
4.1. Overview of the Proposed Solution

The proposed HTPR method consists of two phases: offline preparation and online recommendation, as shown in Figure 3. Firstly, in order to achieve a high-quality recommendation effect, we consider both item features and user behaviors in the process of feature input and description. Secondly, to explore effective recommendation techniques with good capability of dealing with massive data, a parallelized execution strategy was designed to optimize the recommendation process. After item clustering, feature supplementation and user clustering were carried out in a parallelized way. A brief introduction of the key components and concepts of the proposed HTPR method is given in the following:
-
Feature input and description. Feature information was input to the recommendation system after feature description. The input features involved the content of items, i.e., item/attribute matrix and user behaviors including browse, add-to-favorite, purchase, review and rating (described as user-item browse matrix, user-item wish list matrix, user-item purchase matrix, item review tag matrix, and user-item rating matrix respectively).
-
Item clustering. After the feature combination of item review tags and item attributes were obtained, item clusters were generated by the K-Means algorithm.
-
Feature supplementation. For each item without rating in the user-item rating matrix, the most similar neighbors from its cluster were picked out, and then it was rated based on the rating of its nearest neighbors. In this way, the user-item rating matrix was supplemented.
-
Integrating similarity. The preference of a user for an item category was defined based on the results of item clustering, and then the concern degree of the user for the item category was defined based on the user’s historical behaviors. By integrating preference and concern degree, the tendency of the user for the item category could be defined, and the integrating similarity could be calculated.
-
User clustering. Clustering users according to the user-item category tendency matrix, and obtaining user clusters and their cluster centers.
-
Online recommendation. Selecting some clusters from all user clusters by comparing cluster centers with a predefined similarity threshold, and then obtaining the set of nearest neighbors by measuring the similarity between the target user and users of selected clusters. Next, the rating prediction of all candidate items was made for the target user based on the rating of the nearest neighbors. Finally, a personalized service recommendation list (Top-N list) was generated and the most appropriate items were recommended to the target user.

4.2. Feature Supplementation Based on Item Clustering

By using item clustering, similar neighbor items were selected for items without rating to predict their rating. As a result, a user-item rating matrix could be supplemented.
The feature input of a recommendation system could be transformed into optimization problems of feature extraction, feature combination. The function of the feature combination was to combine the basic features extracted from different data sources, which contributed to the perfection of feature input. In the process of item clustering, feature input was constituted by the item/attribute matrix and the item review tag matrix. Item attributes contained the metadata of items, and item review tag extracted from the content of reviews, which was the community opinions of a user on an item.
Definition 1.
For an item set with m items and p kinds of attributes, q tags are extracted from the review content of a user, and then item/attribute matrix and item review tag matrix can be represented as (1) and (2) respectively,
A = ( a j , φ ) m × p , a j , φ { 0 , 1 } ,   a j , φ = { 1 ,   j t h   i t e m   h a s   φ t h   a t t r i b u t e 0 ,   o t h e r w i s e
T a g = ( t a g j , η ) m × q ,   0 < t a g j , η < 1 .
As shown in Table 3, the feature combination can be represented as a m × ( p + q ) matrix, denoted as:
S = ( s i , j ) m × l , l = p + q ,   s i , j [ 0 , 1 ] .
For two arbitrary items u = { s μ , 1 , s μ , 2 , , s μ , k , , s μ , l } and v = { s ν , 1 , s ν , 2 , , s μ , k , , s ν , l } , the similarity of the items is measured by their distance,
s i m ( u , v ) = k = 1 l λ k 1 + d ( s μ , k , s ν , k ) = k = 1 l λ k 1 + | s μ , k s ν , k |
where λ k ( 0 λ k 1 ) is the weight of the k-th feature; d ( s μ , k , s ν , k ) denotes the absolute value of the distance between the items u and v for the k-th feature; the similarity of the items u and v for the k-th feature is denoted as 1 1 + d ( s μ , k , s ν , k ) .
In this paper, the commonly used K-Means clustering algorithm is applied for item clustering (Algorithm 1).
Algorithm 1: Item-Clustering-K-Means
Input: The item set E = { e 1 , e 2 , , e m }
   The item feature matrix S m × l
   The number of clusters k 1
Output: The item clusters E 1 , E 2 , , E k 1
   The cluster centers c 1 , c 2 , , c k 1
1: select some items whose number is k 1 from item set E at random, i.e., e 1 , e 2 , , e k 1 , as the initial cluster centers
2: for each item e E
3: calculate its similarity with each cluster center, in turn, according to (4), and assign it to the corresponding cluster
4: end for
5: for each cluster
6: adjust the cluster center according to the average value of all items in the cluster, i.e., c i = 1 n i e , i = 1 , 2 , , k 1 , where n i is the number of items for the i-th cluster
7: end for
8: return to step 2 till the square error of the cluster criterion function, i.e., J = i = 1 k 1 j = 1 n i | e j c i | 2 reaches convergence
Therefore, with the use of Algorithm 1, item set E will be divided into k 1 categories (namely clusters), i.e., E 1 , E 2 , , E k 1 with E 1 E 2 E k 1 = E and E i E j = ( i , j [ 1 , k 1 ] ).
According to the analysis above, two item similarity calculation methods are introduced in the following.
Given that the number of users is n, for the user u and the user v, their union set of rated items is denoted as E u v = E u U E v , and the set of items without a rating for the user u is denoted as N u = E u v E u . For an item e ( e N u ) that has not been rated, if x is an arbitrary item of the same cluster that e belongs to, then e , x E i , i [ 1 , k 1 ] .
If e is not a new item (rated by other users), then the similarity of item e and item x can be calculated by Pearson correlation,
s i m ( e , x ) = u U e x ( r u , e r e ¯ ) ( r u , x r x ¯ ) u U e x ( r u , e r e ¯ ) 2 u U e x ( r u , x r x ¯ ) 2
where U e x is the set of all users that provide ratings for the item e and the item x; r e ¯ and r x ¯ are respectively the average ratings of all users for the item e and the item x; r u , e and r u , x respectively denote ratings of the user u for the item e and the item x.
If e is a new item (not rated by any user), then the similarity of the item e and the item x can be calculated based on the item feature matrix (according to Equation (4)),
s i m ( e , x ) = k = 1 l λ k 1 + d ( s e , k , s x , k ) = k = 1 l λ k 1 + | s e , k s x , k | .
According to Equations (5)–(6), the set of nearest neighbors K 1 N N ( e ) was obtained which was comprised of the most similar k 1 items with the item e (not rated) in the same cluster. The nearest neighbor k1 items were used to predict rating, as shown in the formula below:
P u , e = { f K 1 N N ( e ) s i m ( e , f ) × r u f f K 1 N N ( e ) s i m ( e , f ) if   e   is   a   new   item f K 1 N N ( e ) s i m ( e , f ) × r u f f K 1 N N ( e ) s i m ( e , f ) otherwise
A null value in the user-item rating matrix means that one user has not rated the item. The null values in the user-item rating matrix will be replaced by the predicted rating as above. For the user-item rating matrix after feature supplementation, i.e., F R = ( R i , j ) n × m , the ratings of the user u for the item e can be represented as follows:
R u , e = { r u , e ,   i f   u s e r   u   h a d   r a t e d   i t e m   e P u , e ,   o t h e r w i s e .

4.3. Integrating Similarity Calculation and User Clustering

In this paper, we present an integrating similarity calculation method considering user behaviors. Item category is taken as a supplement for feature input based on the result of item clustering.
User behaviors can be categorized as implicit and explicit behaviors. Implicit behaviors show a user’s concern for an item measured by the frequency of behaviors including browse, add-to-favorite and purchase, while explicit behavior indicates exactly a user’s preference for an item, and the rating represents how much the user likes the item directly. As a matter of fact, the data size of browser behaviors is far larger than that of behaviors of add-to-favorite, and purchase. Moreover, ratings are the most valuable data with a minimum size. In order to guarantee the efficiency and quality of recommendation, data in recommendation systems are usually updated offline, for example, the short-period data (browser information) are totally updated once every day, the long-period data (information of add-to-favorite and purchase) are incrementally updated once every day, and the full-period data (rating information) are updated once every few days.
According to the analysis above, preference and concern degree of a user for an item category can be defined on the basis of user behaviors and frequency of these behaviors.
Definition 2.
User-item category preference is defined as the ratio of the sum of ratings of a user for an item category to that of the user for all items. For example, the category preference of the user u for the item category E i , i [ 1 , k 1 ] is represented as:
p r e ( u , E i ) = E i r u E r u , i [ 1 , k 1 ] .
User behaviors on items are endowed with weights, e.g., ratings of browse, add-to-favorite and ordering, and they are valued at 1, 3 and 5 separately. Then statistics of all items in each item category are used to count behavior frequencies and the sum of behavior ratings.
A user may show a preference for a certain item category to some degree even when he/she knows little about the details. The ratio of behavior frequency of a user for an item category to that of the user for all categories is defined as RCF (relative category frequency). The ratio of the sum of behavior ratings of a user for an item category to that of the user for all categories is defined as RCR (relative category rating). The concern degree is defined as follows:
c o n c ( u , E i ) = R C F u , i R C R u , i R C F u , i + R C R u , i , i [ 1 , k 1 ]
R C F u , i = b h v F u , i / s u m b h v F u , i
R C R u , i = b h v R u , i / s u m b h v R u , i
where c o n c ( u , E i ) [ 0 , 1 ] is the concern degree of the user u for the item category E i ; b h v F r q u , i denotes the behavior frequency of the user u for the i-th category; b h v R u , i denotes the sum of behavior ratings of the user u for the i-th category. The behavior frequency and the sum of behavior ratings of the user u for all categories are respectively written as s u m b h v F r q u , i and s u m b h v R u , i .
Definition 3.
User-item category tendency is an integration of preference and concern degree of a user for an item category. The tendency of the user u for the item category E i is defined as follows:
t n d ( u , E i ) = ρ p r e ( u , E i ) + ( 1 ) c n c ( u , E i ) , i [ 1 , k 1 ]
where ρ , 0 < ρ < 1 is a weight, called the regulating parameter.
Once the feature vectors of user-item category tendency were obtained, a matrix could be constructed by these vectors. If the feature vector of the user u for all categories (the number is k1) is denoted as t n d u = [ t n d u , 1 , t n d u , 2 , , t n d u , k 1 ] , then the tendency matrix is t n d [ n ] [ k 1 ] , n is the number of users.
Furthermore, based on the definition of user-item category tendency, the calculation method of integrating similarity between users is introduced as follows:
s i m i n t ( u , v ) = t n d u t n d v t n d u t n d v
where, s i m i n t ( u , v ) denotes the integrating similarity between the user u and the user v, t n d u and t n d v are respectively the feature vectors of category tendency for the user u and the user v.
Through integrating similarity calculation considering item clustering and user behaviors, users who have the highest similarity will be assigned into one cluster. As similar with item clustering, user clustering applies the K-Means clustering algorithm as well. Algorithm 2 illustrates the user clustering method for n users.
Algorithm 2: User-Clustering-K-Means
Input :   The   user   set   U [ n ] = { u 1 , u 2 , , u n }
The user-item category tendency matrix t n d [ n ] [ k 1 ] , The number of user clusters k2
Output :   The   user   clusters   U 1 , U 2 , , U k 2 ,   The   cluster   centers   c 1 , c 2 , , c k 2
1: select some users whose number is k2 from user set U at random, i.e., u 1 , u 2 , , u k 2 , as the initial cluster centers
2 :   for   each   user   u U
3: calculate its similarity with each cluster center, in turn, according to (14), and assign it to the nearest cluster
4: end for
5: for each cluster
6: adjust the cluster center according to the average value of item category tendency for all users in a cluster, i.e., c i = 1 m i t n d , i = 1 , 2 , , k 2 , where mi is the number of users for the i-th cluster
7: end for
8: return to step 2 till the square error of the cluster criterion function, i.e., J = i = 1 k 2 j = 1 m i | t n d j i c i | 2 reaches convergence
At this point, users with similar user-item category tendency will be assigned to one cluster, and thus the search scope of neighbor users can be narrowed through the offline preparation process. In this way, we reduced the computational complexity of the online recommendation.

4.4. Online Recommendation

In this section, the process of searching the set of nearest neighbor users and making rating prediction is introduced, and an online recommendation for the target user was created.
The search scope will be too small if nearest neighbors are only selected from the cluster that has the highest similarity with the target user without regard to other clusters. Therefore, the outcome of clustering cannot be assumed to be optimal. For this reason, a proxy user is defined as the cluster center of each cluster. Firstly, we calculated the similarity between the proxy user and the target user, and then defined a threshold of similarity and select eligible clusters. Finally, the set of nearest neighbors was obtained from these clusters.
Through user clustering, n users were divided into k 2 clusters, i.e., U 1 , U 2 , , U k 2 where U 1 U 2 U k 2 = U and U i U j = ( i , j [ 1 , k 2 ] ). Assuming that the user u was the target user, we calculated the similarity of the user u and its neighbor user. To obtain the neighbor user set, the Pearson correlation was used to measure the similarity,
s i m ( u , v ) = i E u v ( R u , i R u ¯ ) ( R u , i R v ¯ ) i E u v ( R u , i R u ¯ ) 2 i E u v ( R u , i R v ¯ ) 2
where v is a candidate neighbor user; E u v denotes the union set of items rated by the user u and the user v as well; R u ¯ and R v ¯ are respectively the average ratings given by the user u and the user v.
Algorithm 3 illustrates the algorithm to search for a neighbor user set.
Algorithm 3: K-Nearest-Neighbors
Input: The target user u
   The number of nearest neighbor users K
   The user clusters U 1 , U 2 , , U k 2
  The cluster centers c 1 , c 2 , , c k 2 i (here, c i represents the proxy user for the i-th cluster)
   The similarity threshold θ
Output: The neighbor user set K N N ( u )
1: for each cluster center c i
2: calculate its similarity with the target user according to (15), written as s i m ( u , c i )
3: if s i m ( u , c i ) θ then
4: calculate the similarity of the user u and every other user of this cluster, e.g., the user v and the target user u
5: end if
6: end for
7: sort the users according to the result of a similarity calculation
8: return the set of nearest neighbor users K N N ( u ) which is consisted of the users with the Top-K highest similarity
Here, we use a weighted average approach to predict the personalized rating of an item for the target user.
P R u , j = R u ¯ + v K N N ( u ) s i m ( u , v ) ( R v , j R v ¯ ) v K N N ( u ) s i m ( u , v )
where s i m ( u , v ) is the similarity of the target user u and the neighbor user v in neighbor user set K N N ( u ) ; R u ¯ and R v ¯ are respectively the average ratings given by the user u and the user v in user-item rating matrix with feature supplemented, i.e., F R = ( R i , j ) n × m ; R v , j denotes the rating of the user v for the item j.
Once the set of nearest neighbor users was obtained, the rating of all candidate items for the target user was predicted based on the historical ratings of K neighbor users, and the candidate items were sorted according to the predicted ratings. Finally, a personalized service recommendation list (Top-N list) was generated and the most appropriate items were recommended to the target user.
Note that most of the operations of HTPR are processed offline. During the online recommendation phase, we only need to accomplish missions including nearest neighbor searching, rating prediction and recommendation, which can achieve a high quality of recommendation service. On the other hand, in the offline phase, feature information and the result of item clustering and user clustering would be updated periodically. To be specific, the newly produced data of items and users will also be updated into the database for feature input and clustering model updating.

5. Experimental Results

In this section, experiments were conducted to evaluate the effectiveness and accuracy of the proposed HTPR. Experiments for item clustering and user clustering are conducted to evaluate the effectiveness of HTPR, and to determine the values of relevant parameters used in the clustering process. In addition, to evaluate accuracy, HTPR was compared with the other three recommendation methods: basic CF, user clustering based CF (UCCF) and item clustering based CF (ICCF). Four metrics were used to evaluate the accuracy: mean absolute error (MAE), precision, recall, and F1 score [42,43]. All the experiments are carried out with the spark framework and run on a workstation equipped with an Intel 12-core 3.5 GHz CPU, a GTX1080TI GPU, and 16 GB memory.

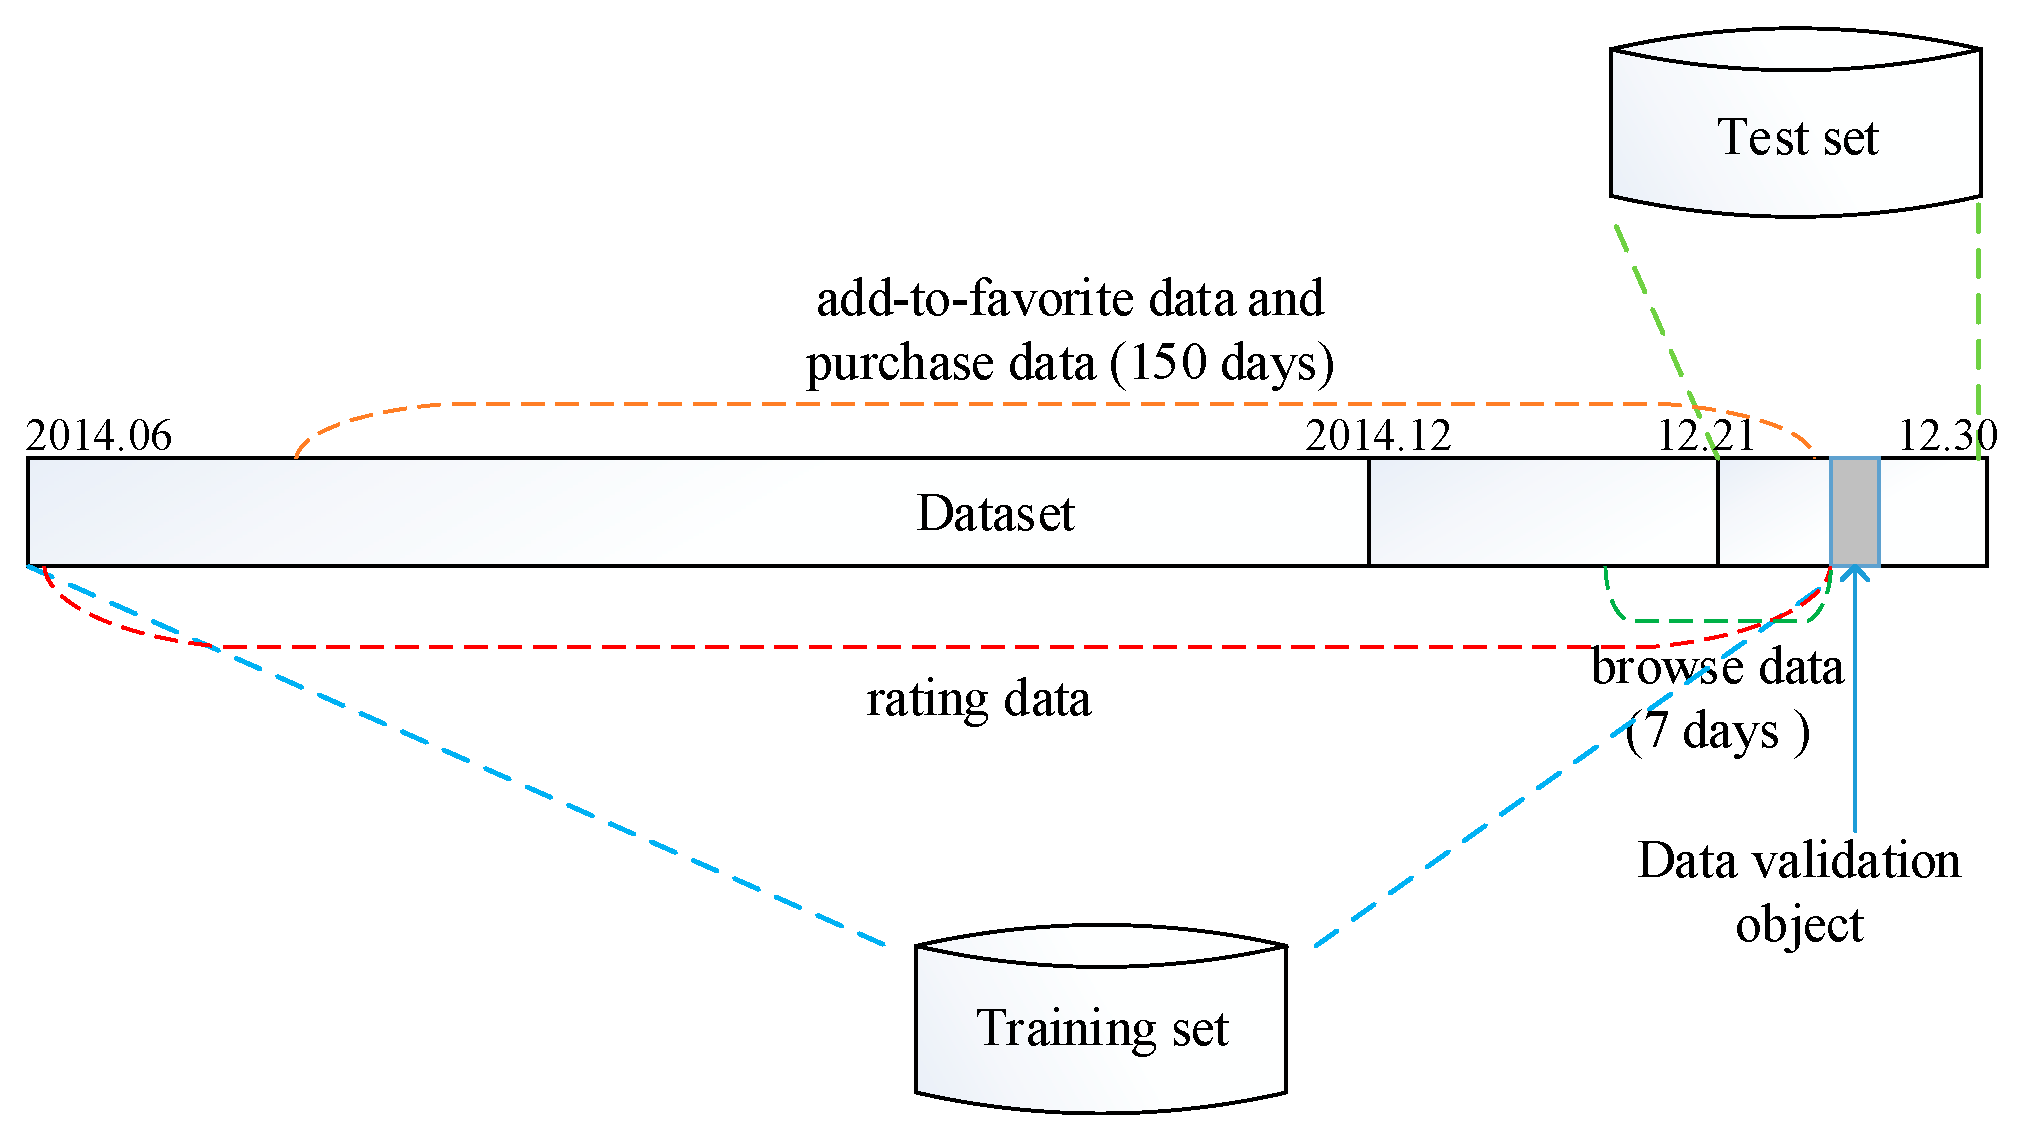
5.1. Experiment Dataset and Metrics

The dataset adopted in our experiments comes from an offline dataset used by an operation team of a group-buying website in China. With seven years of operation, the group-buying website has collected a share of large-scale user market in China and owns a comprehensive data system. The dataset used in this paper is taken from a half year (from June to December 2014) of its historical data, including ratings of 3043 users on 1628 items. The ratings are recorded on a numeric five-point scale (0, 1, 2, 3, 4). Table 4 shows the data structure of dataset with normalization.
To make a comparison, the dataset was divided into a training set and a test set. As shown in Figure 4, the test set took from the data of 21–30 December 2014, from which data of one certain day were selected as the data validation object. On the other hand, the training set consisted of browser data of 7 days, add-to-favorite data and purchase data of 150 days, and all rating data before the selected day. Based on the training set, each user was recommended with several items, which will be compared with the data in the test set.
There are several types of metrics to evaluate the quality of a recommendation system such as accuracy, coverage, diversity and novelty. In this paper, MAE, precision, recall and F1 score were chosen as evaluation metrics. MAE represents the deviation of recommendations from actual user-specified values. The lower the MAE is, the more accurate the rating prediction is. Precision is the percentage of selected items that are “relevant”; and Recall is the percentage of relevant items that are selected.
Overall, the greater the value of precision and recall are, the more effective the prediction is. However, the emphasis of the two metrics is different. The aim of precision is to return mostly useful items, while recall is designed to avoid missing useful items. F-measure is a comprehensive metric; the greater the value of F1 is, the more effective the recommendation service is.

5.2. Experiment Evaluation

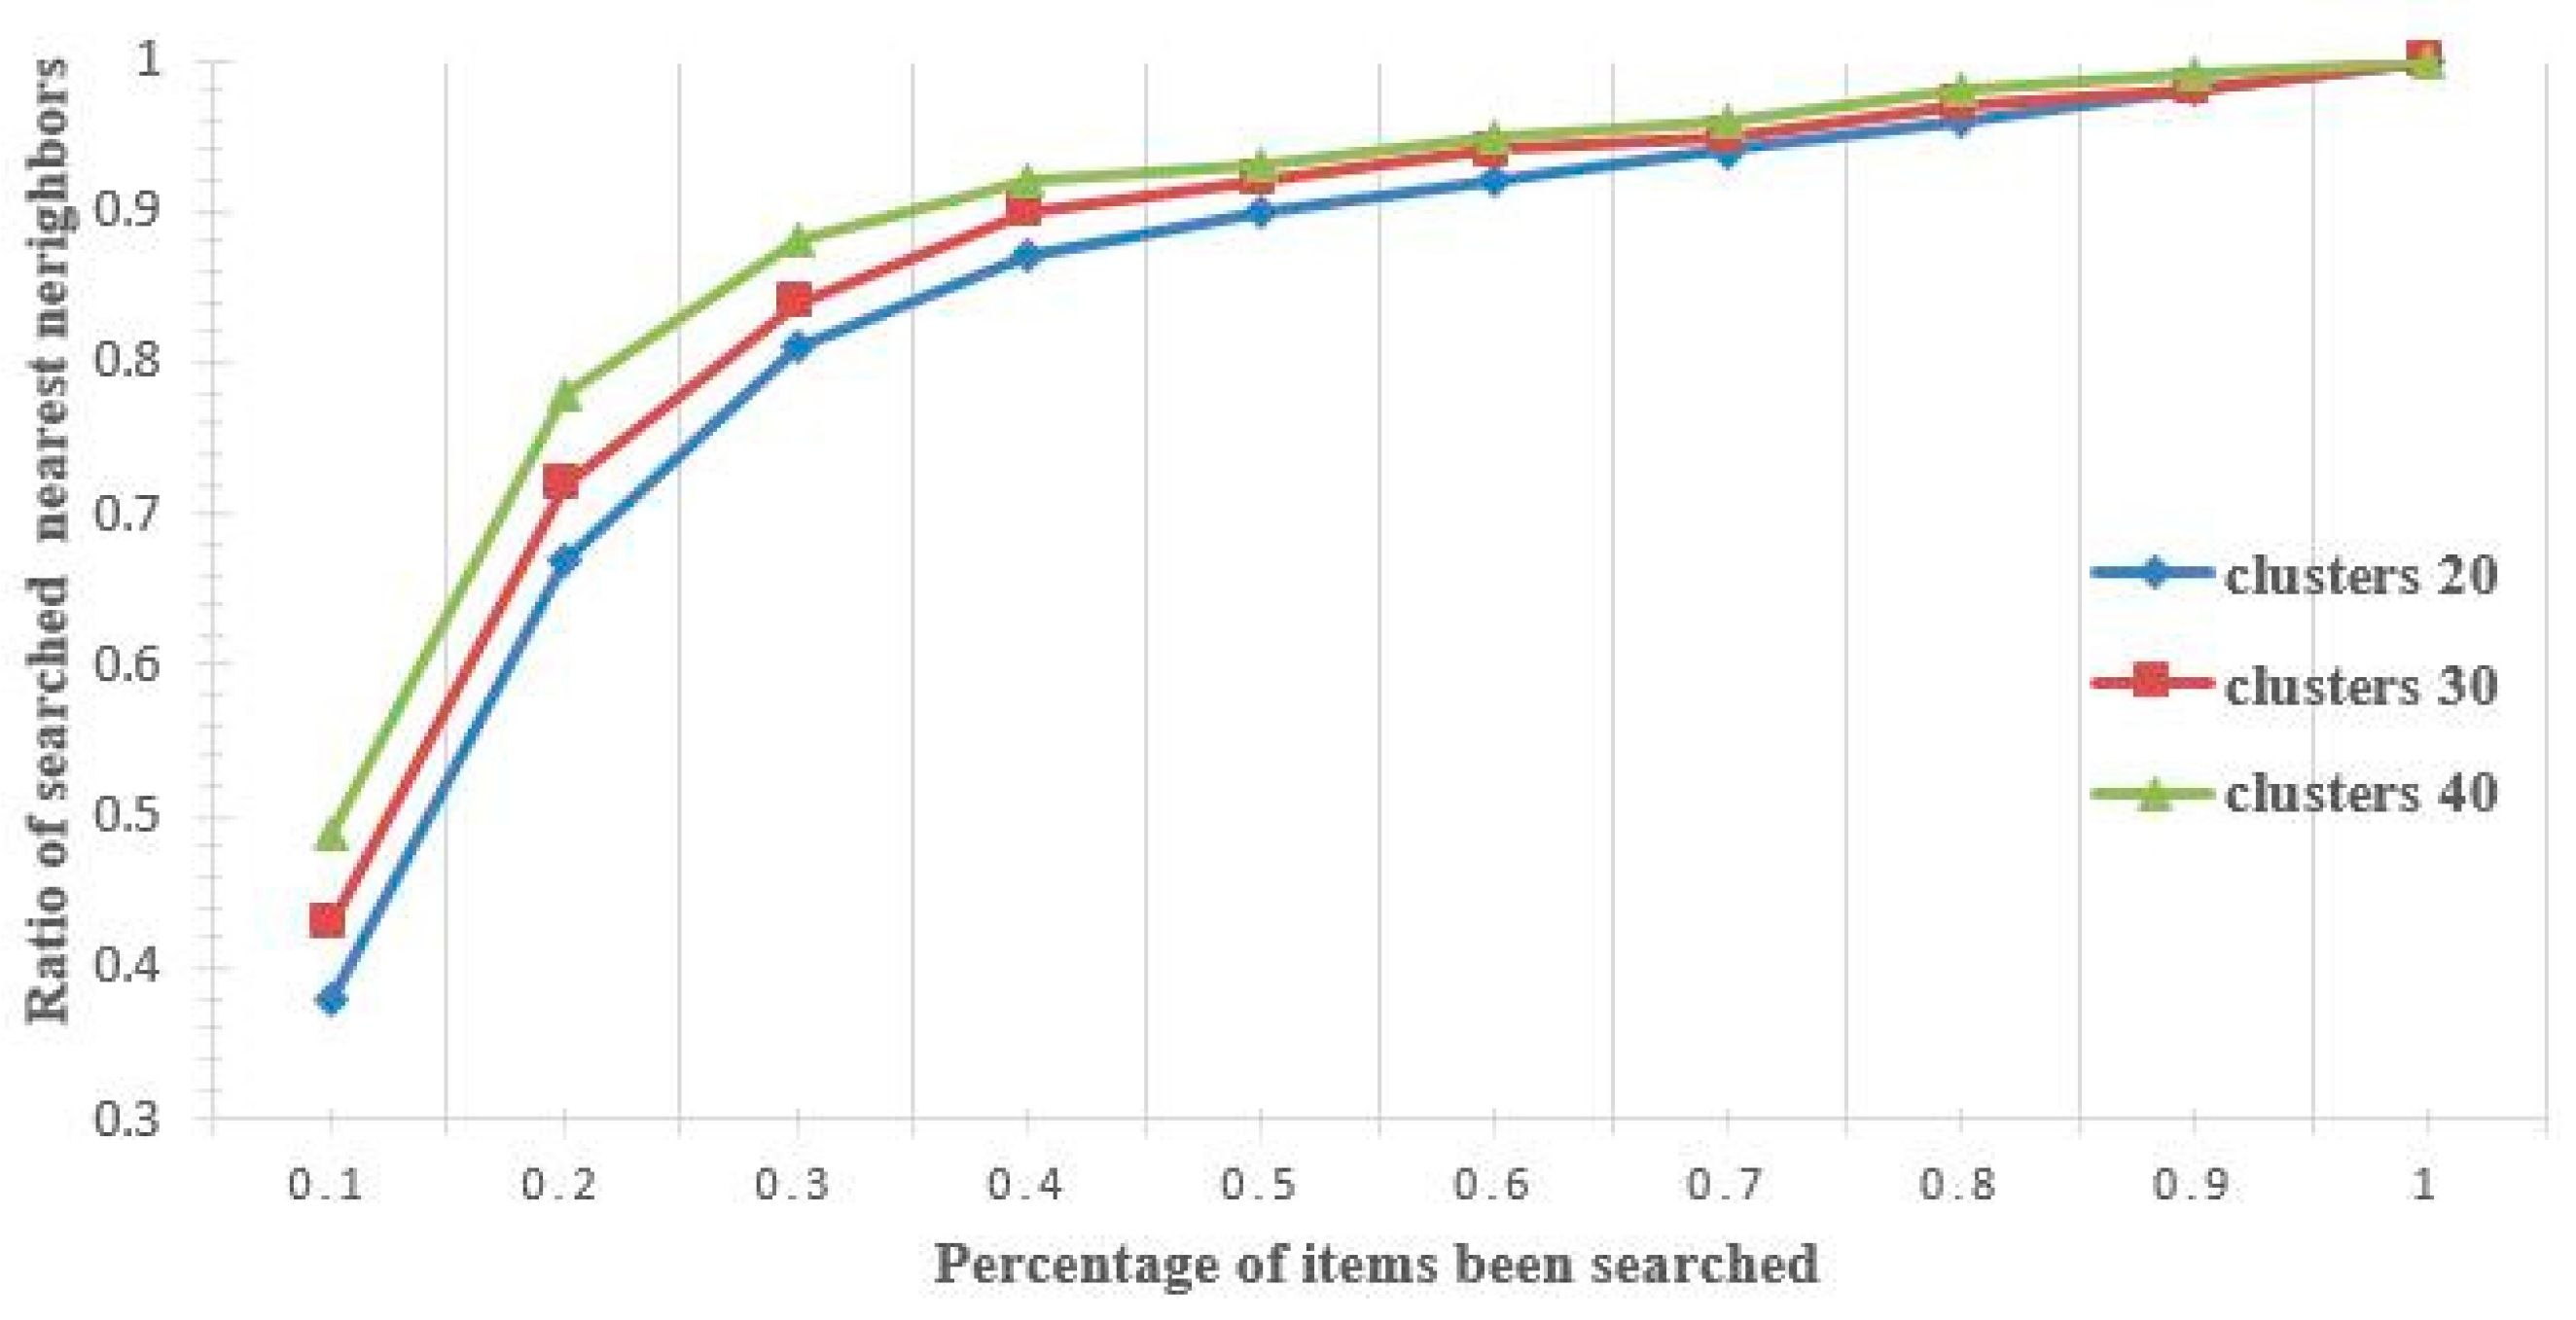
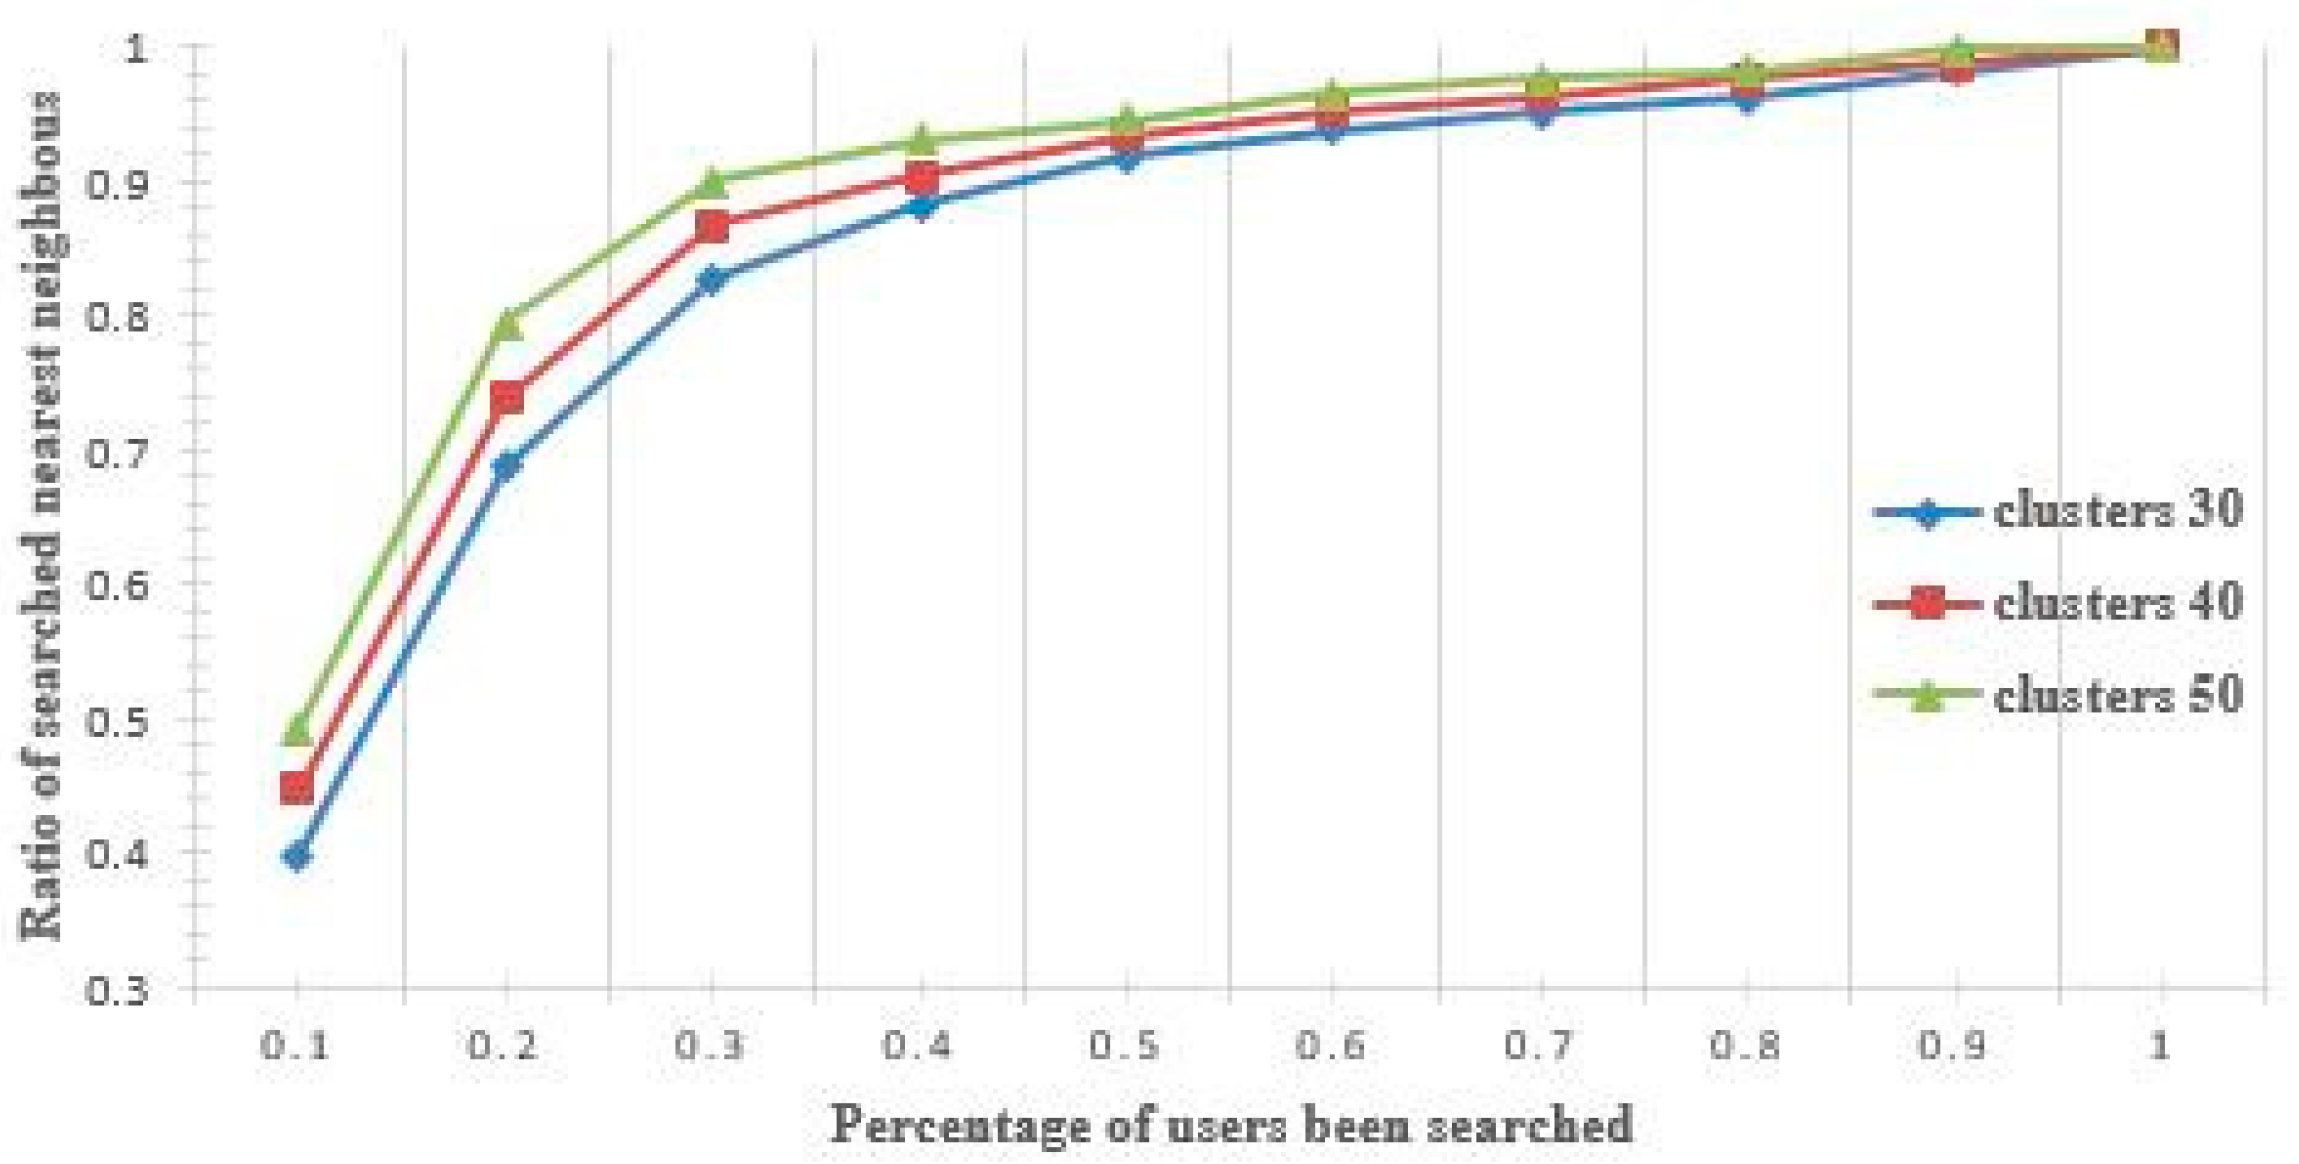
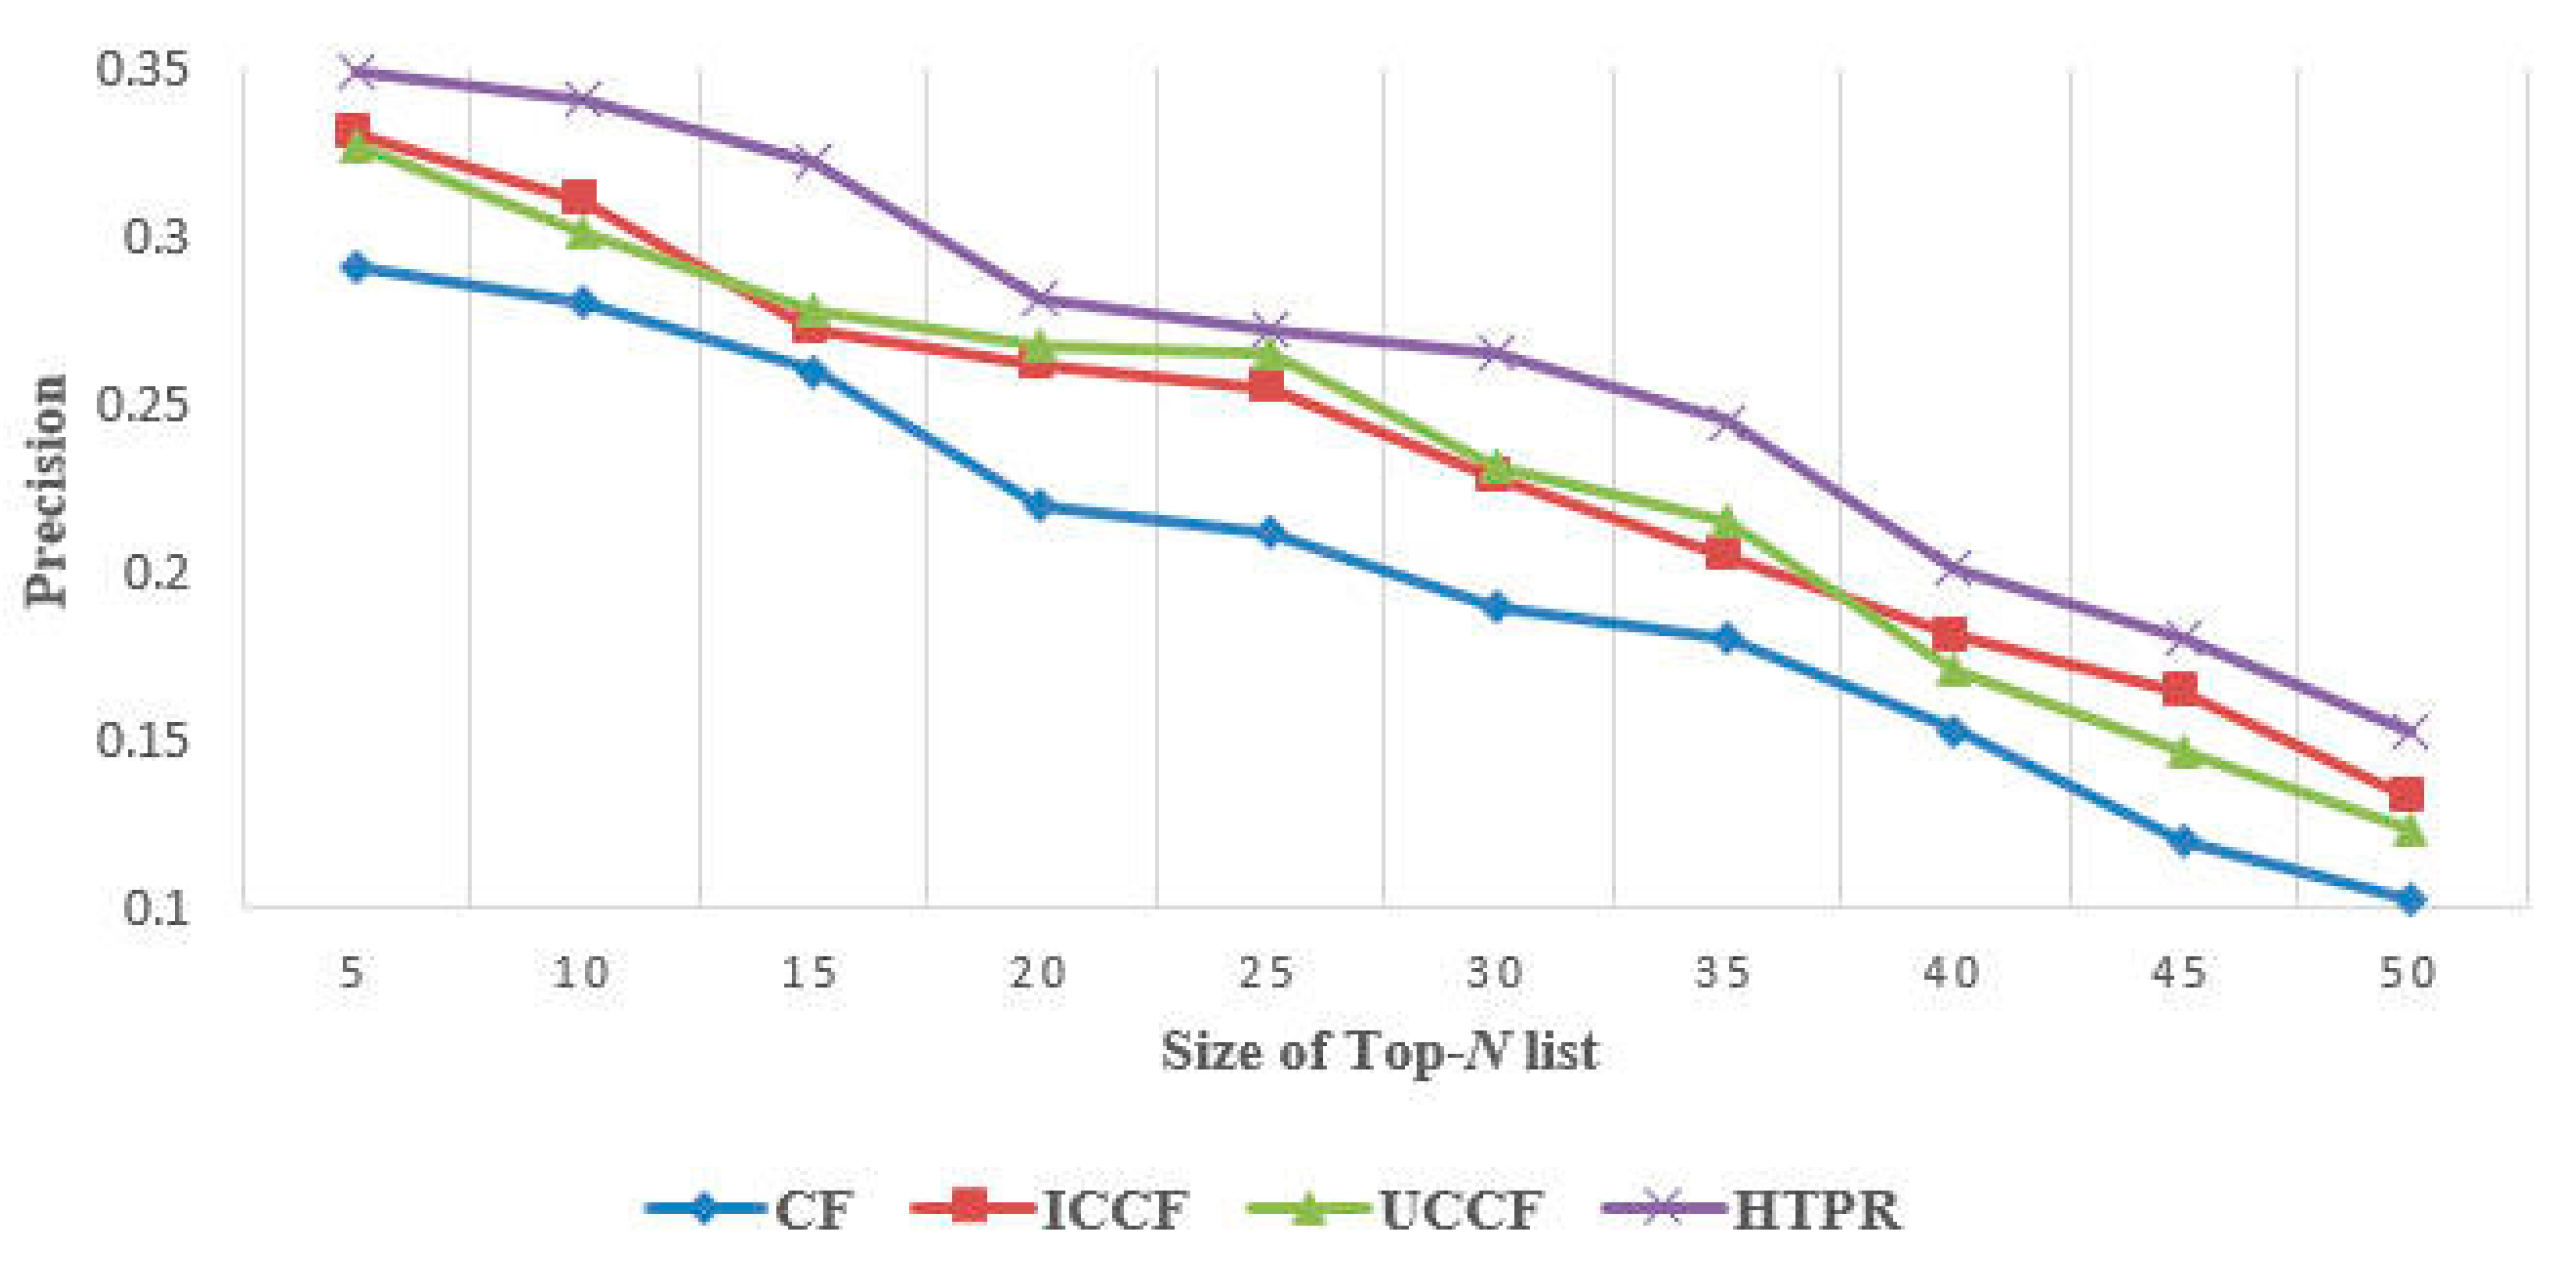
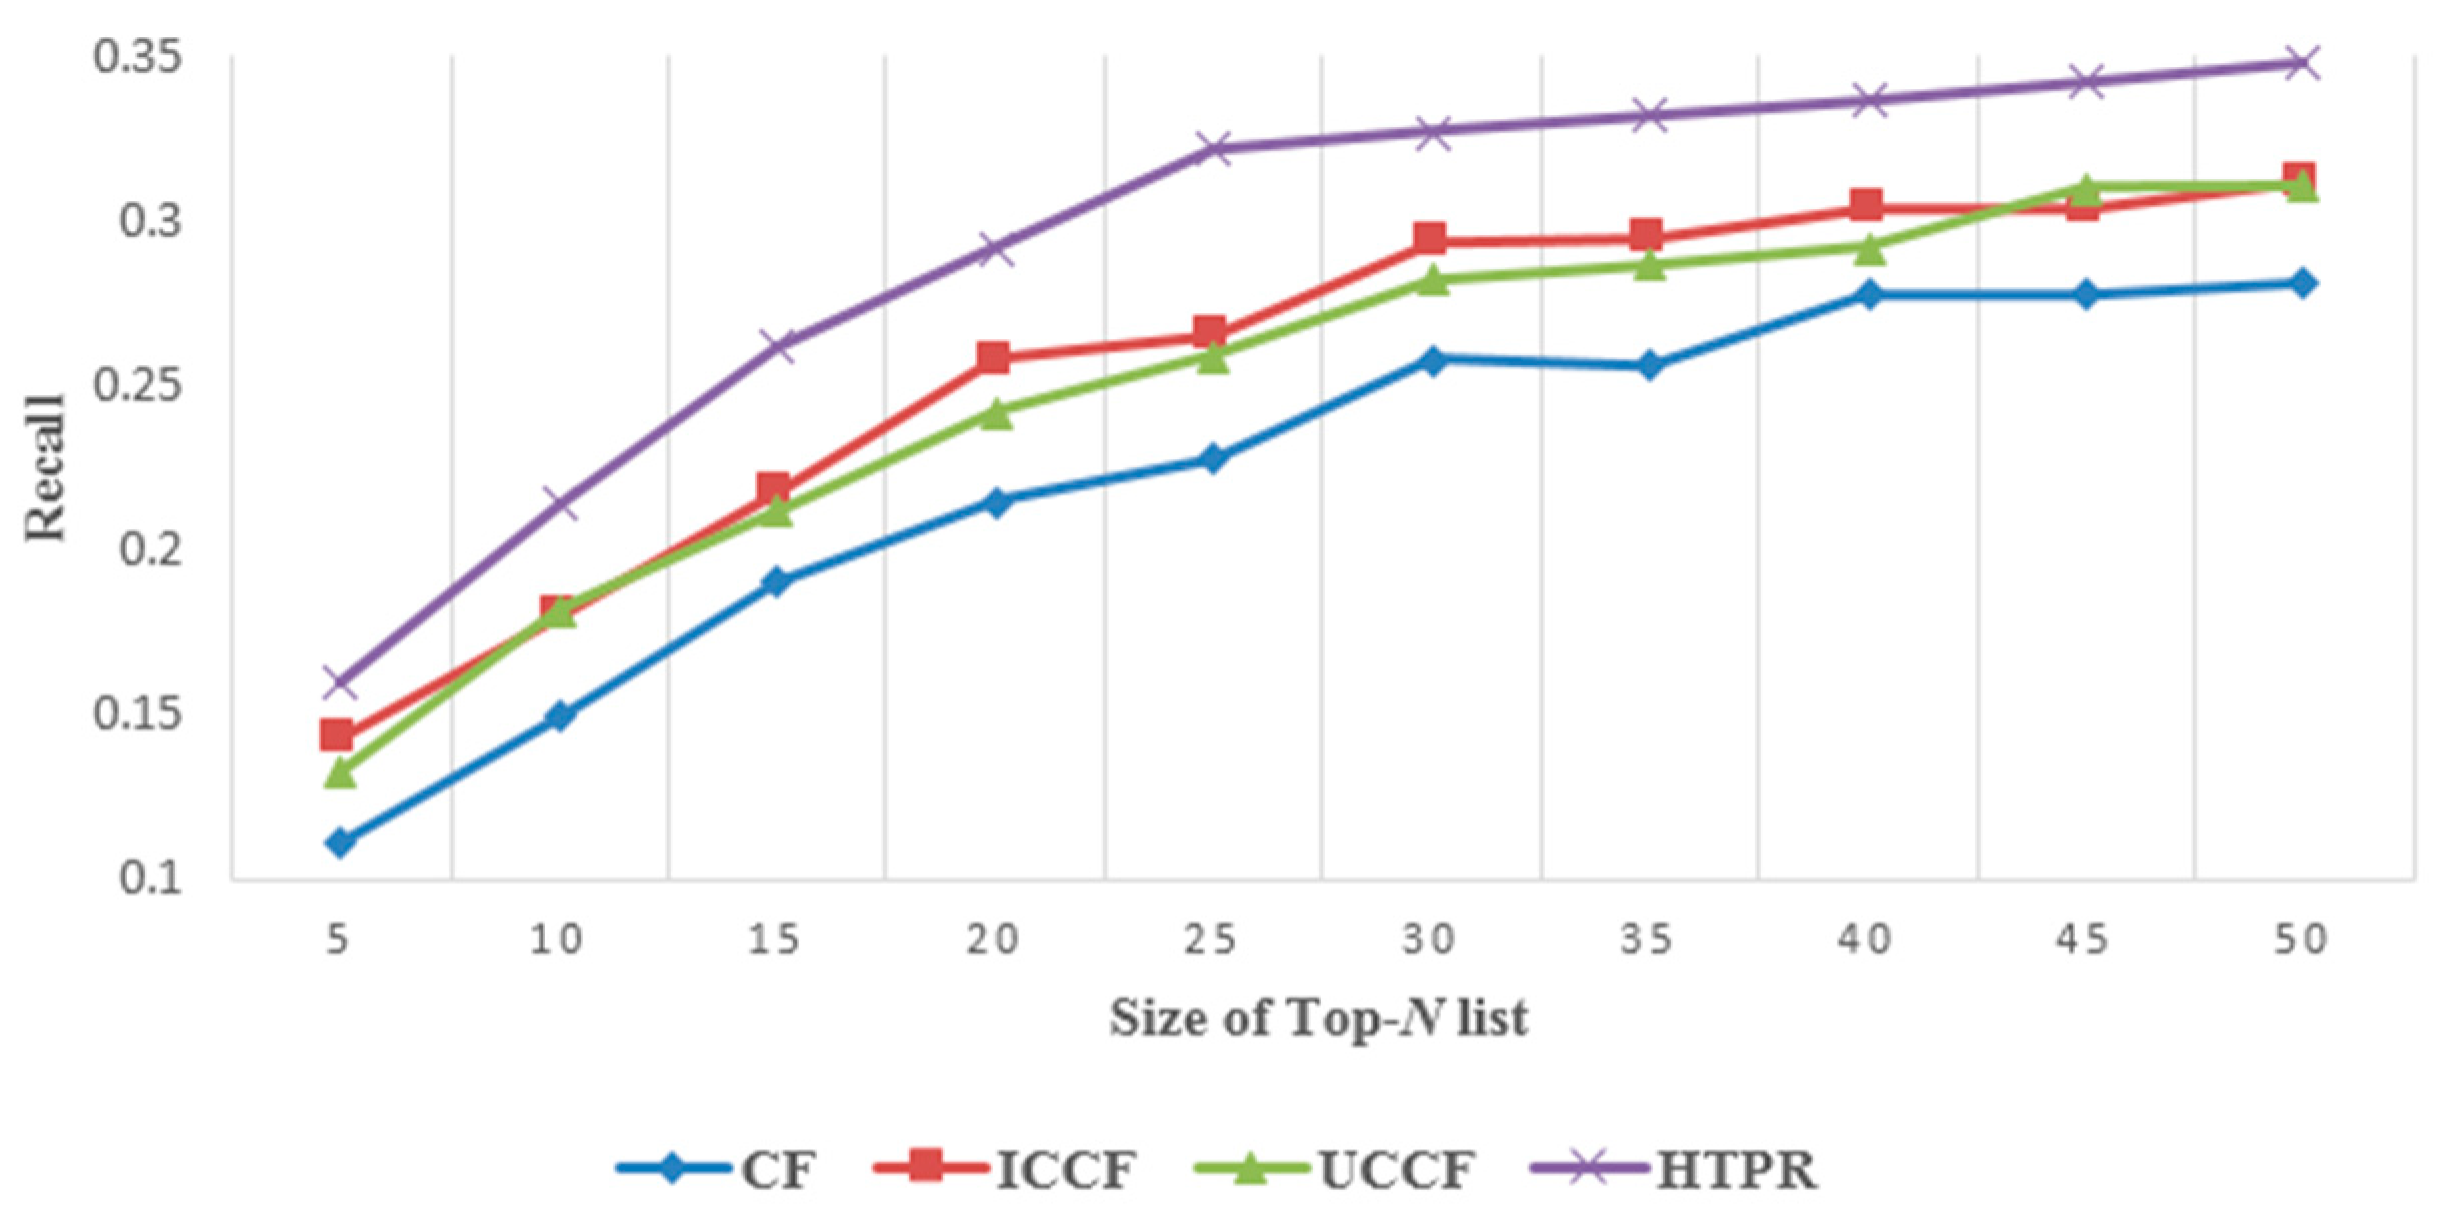
5.2.1. Effectiveness Evaluation

The first group of experiments verify the effectiveness of HTPR in term of item clustering and user clustering, the number of nearest neighbors and the number of clusters are determined as well.
(1) Validation test on item clustering. In the first experiment, the effectiveness of the item clustering was examined by measuring the search efficiency of nearest neighbor items. Specifically, the 1628 items in the dataset were clustered under the circumstances of 20 nearest neighbors. We analyzed the impact of different clusters (20, 30, 40) on the search efficiency, the results are shown in Figure 5. Y-coordinate denotes the ratio of searched nearest neighbors of items, and X-coordinate denotes the percentage of items that have been searched.
It can be found in Figure 5 that more nearest neighbor items can be found out with less searched items through item clustering. Besides, when the number of clusters was far less than the number of items, the time to compute the similarity between the target item and cluster center was very short, compared to the time used in searching its nearest neighbors. In this case, the greater the number of clusters was, the higher the efficiency of neighbors searching was. However, it may cause a loss to accuracy if the number of clusters is too big.
For further verifying the results, rating prediction of the items was made based on ratings of neighbor items and then compared with the data in the test set. The number of clusters varied from 10 to 100 with a step of 10 to compute the average MAE under different circumstances, i.e., the number of nearest neighbors was set to 10, 20, 30, 40, 50 respectively. As shown in Figure 6, the curves of MAE values in different cases as a whole show down first and then up. They decreased obviously when the number of clusters increased from 10 to 40 or 50, and afterwards go up slowly and tend to stabilize. Moreover, it swa noticed that the curve whose nearest neighbors is 30 was lower than other curves, MAE achieved the lowest value when the number of clusters was 40. Therefore, for item clustering, the optimal values of parameters, i.e., the number of clusters and nearest neighbors could be 40 and 30 respectively.
(2) Validation test on user clustering. This experiment was designed to verify the effectiveness of user clustering. The first part analyzed the influence of different user clusters on the search efficiency of nearest neighbor users. According to the results of item clustering, the number of clusters and nearest neighbors was respectively 40 and 30. While, for user clustering, the number of nearest neighbors was 30, the regulating parameter ρ was 0.5, the similarity threshold θ was 0.7. Figure 7 shows the diagram of search efficiency with different clusters varied from 30 to 50 with a step of 10. Y-coordinate denotes the ratio of searched nearest neighbors of users, and X-coordinate denotes the percentage of users that have been searched.
The results are similar to that of item clustering. When the percentage of users being searched increased, the ratio of searched nearest neighbors increased. Through user clustering, more nearest neighbor users can be found within fewer search spaces; the greater the number of clusters was, the higher the search efficiency was.
Likewise, in the second part, to investigate the relation between the relevant parameters of user clustering and the accuracy of rating prediction, we varied the number of clusters from 30 to 100 with a step of 10 to compute the average MAE under different circumstances, i.e., the number of nearest neighbors was set to 10, 20, 30, 40, 50 respectively. Values of the regulating parameter ρ and the similarity threshold θ remained the same as above.
Overall, as shown in Figure 8, MAE values decreased first and then rose with the increase in the numbers of clusters. As shown in Figure 8, the lowest MAE appeared with 0.75 when the clusters were 50 or 60; the MAE values were relatively lower with 0.85 when the nearest neighbors were 30, 40; all the curves dropped to their lowest points when the number of clusters was 50. Thus, in the following experiments, the number of clusters for user clustering was chosen as 50, while the number of nearest neighbors was indeterminate, which can be 30 or 40.
Figure 9 shows the effect of the regulating parameter on rating prediction. In view of above analyses, the number of clusters and nearest neighbors was respectively 40 and 30 for item clustering, while for user clustering, the number was 50 and 30 respectively, and the similarity threshold θ was 0.7. We varied the regulating parameter ρ from 0 to 1 with a step of 0.1. It can be found in Figure 10 that MAE achieved the lowest value when ρ = 0.4. Accordingly, the regulating parameter can be set to 0.4 in the following experiments. Note that we obtained the same conclusion if we only changed the number of nearest neighbors for user clustering to 40.

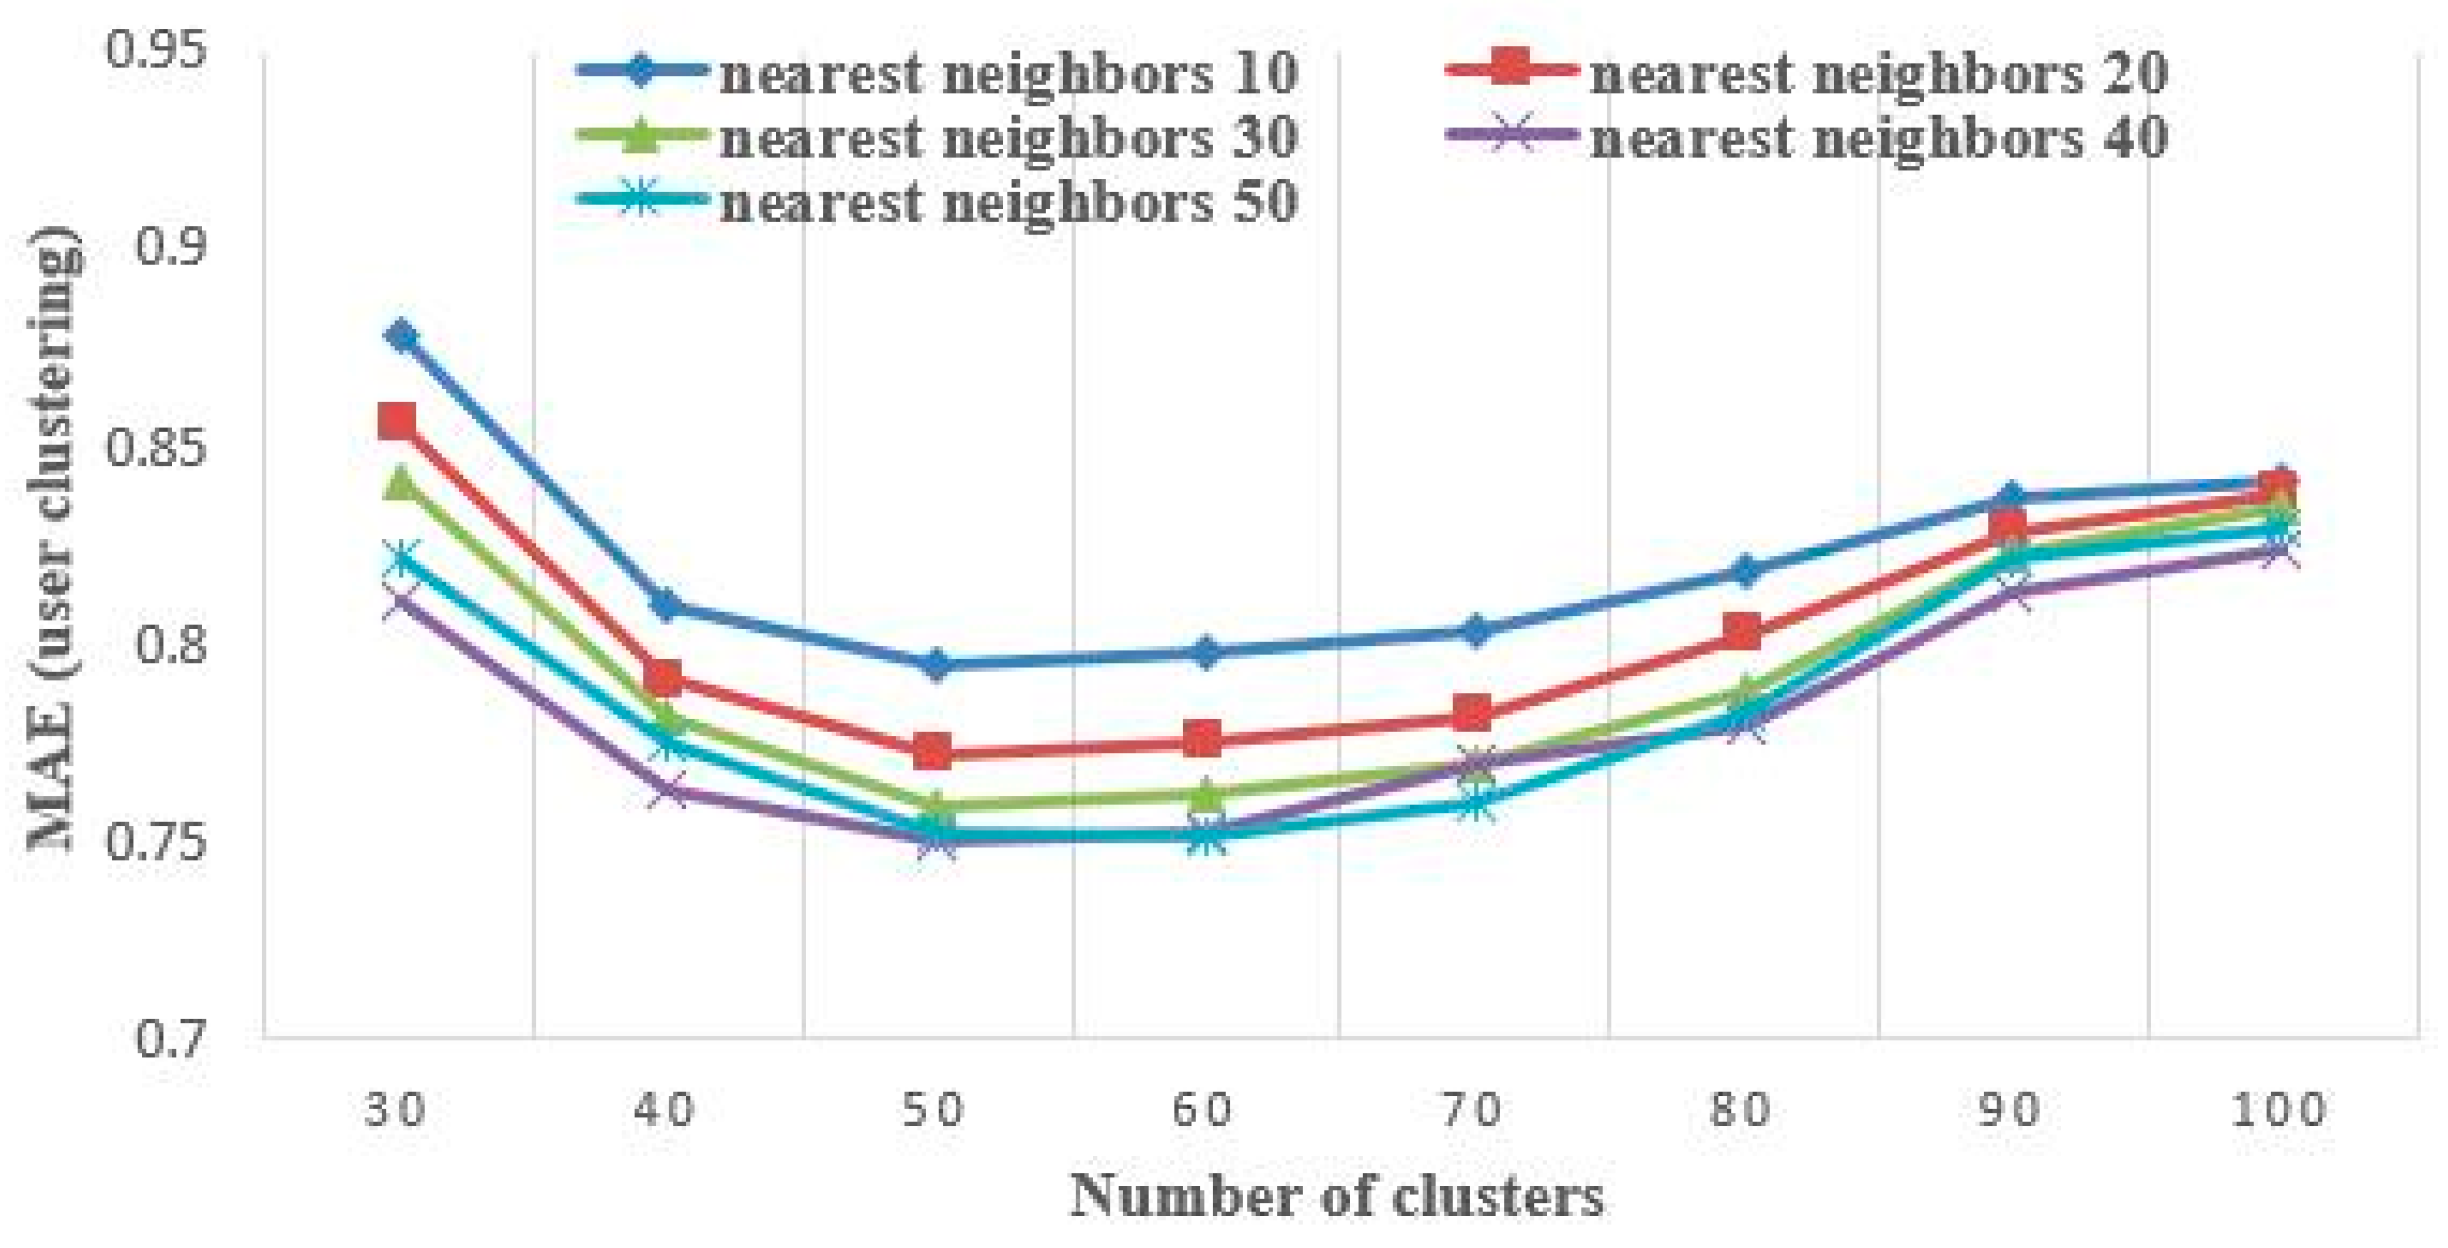
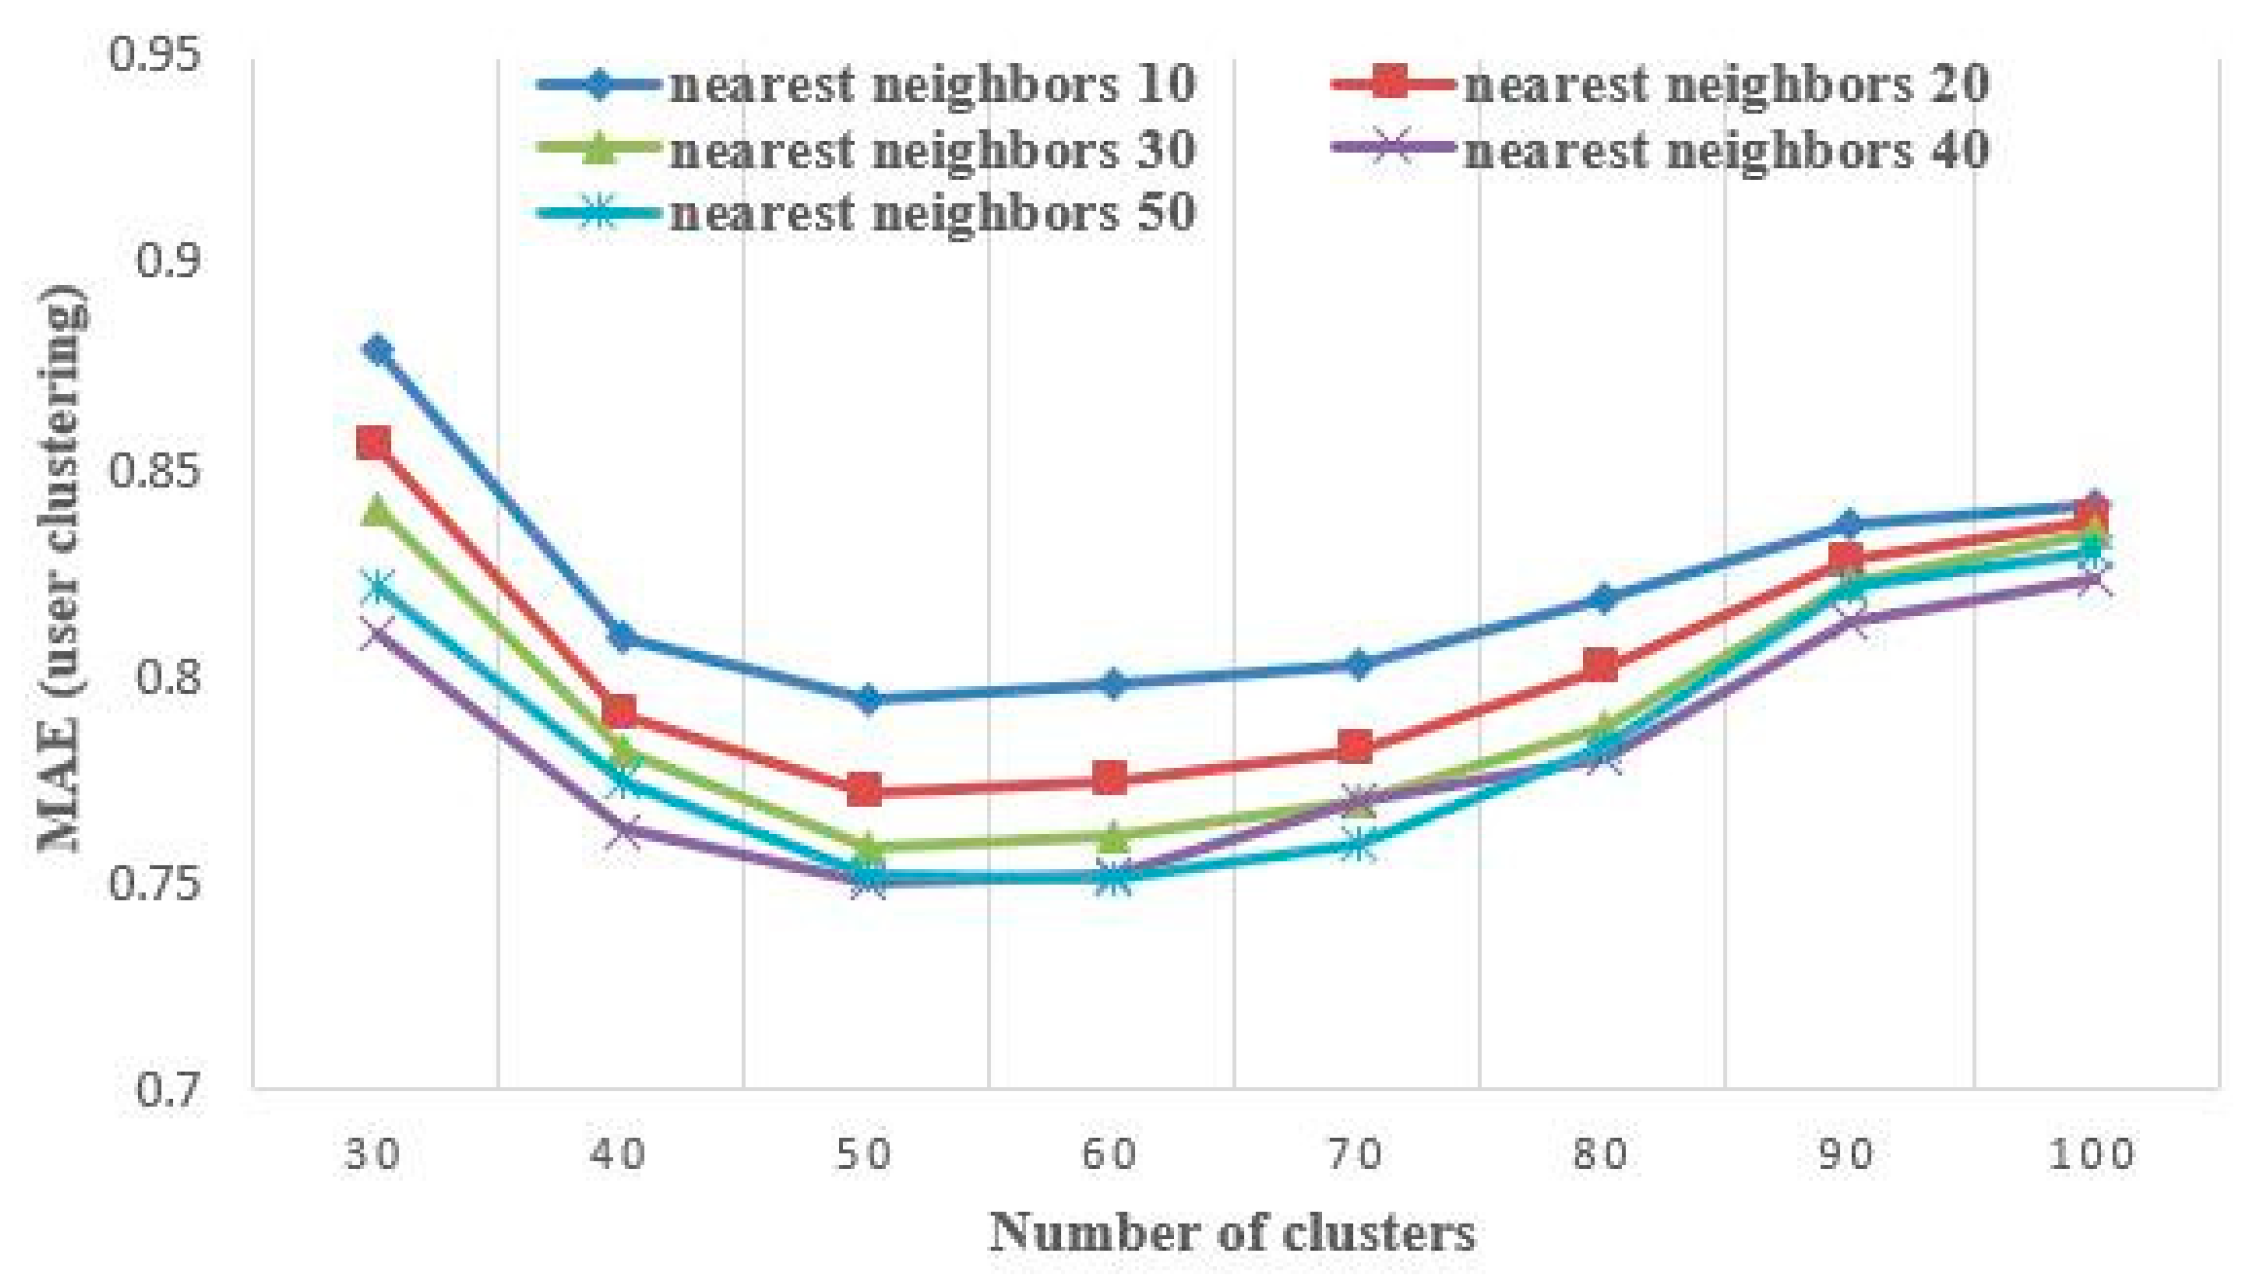
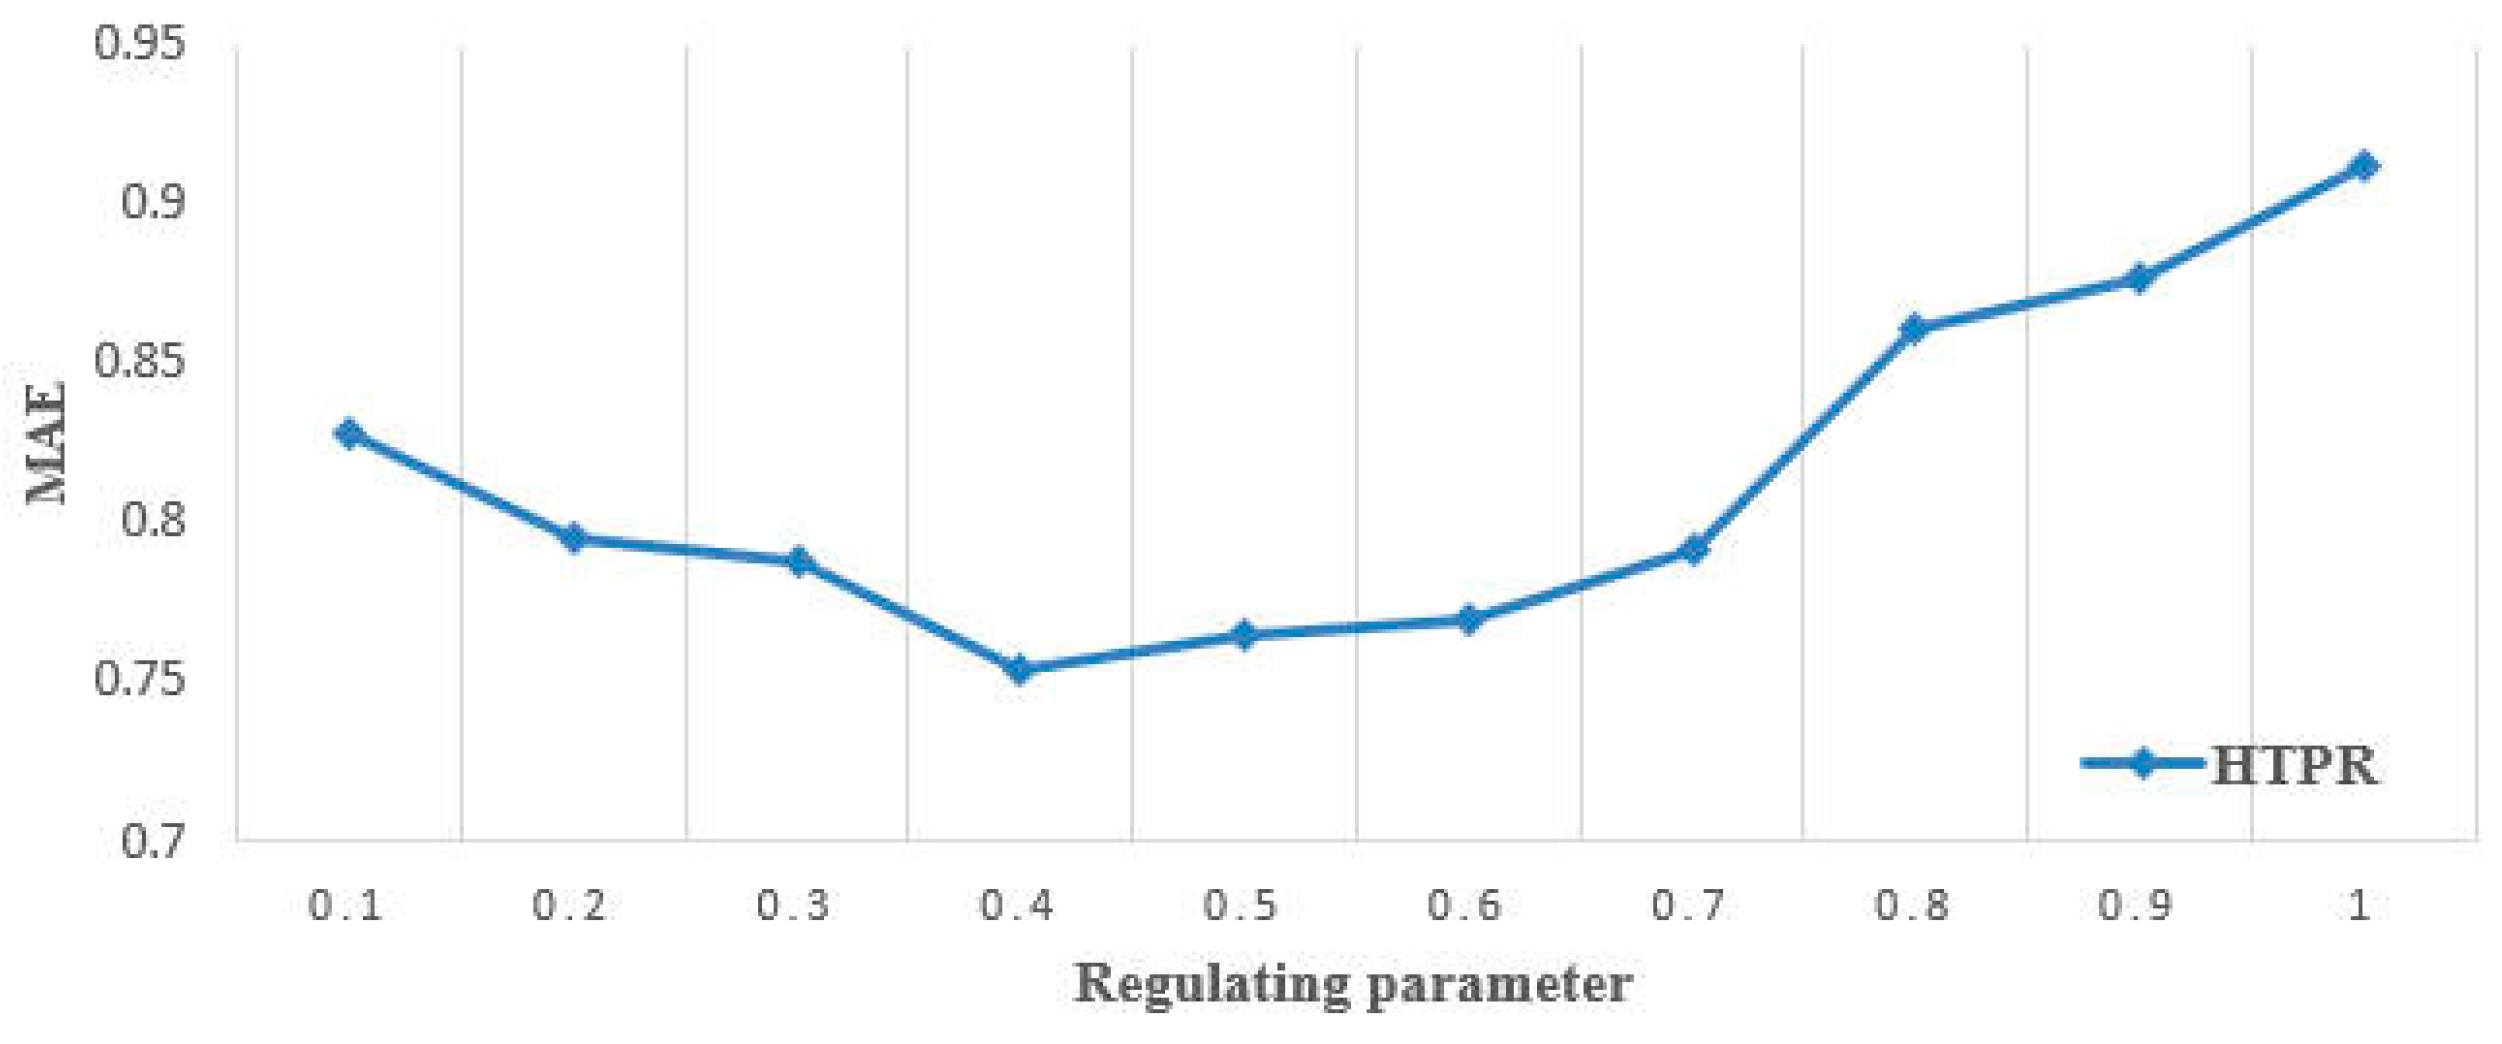
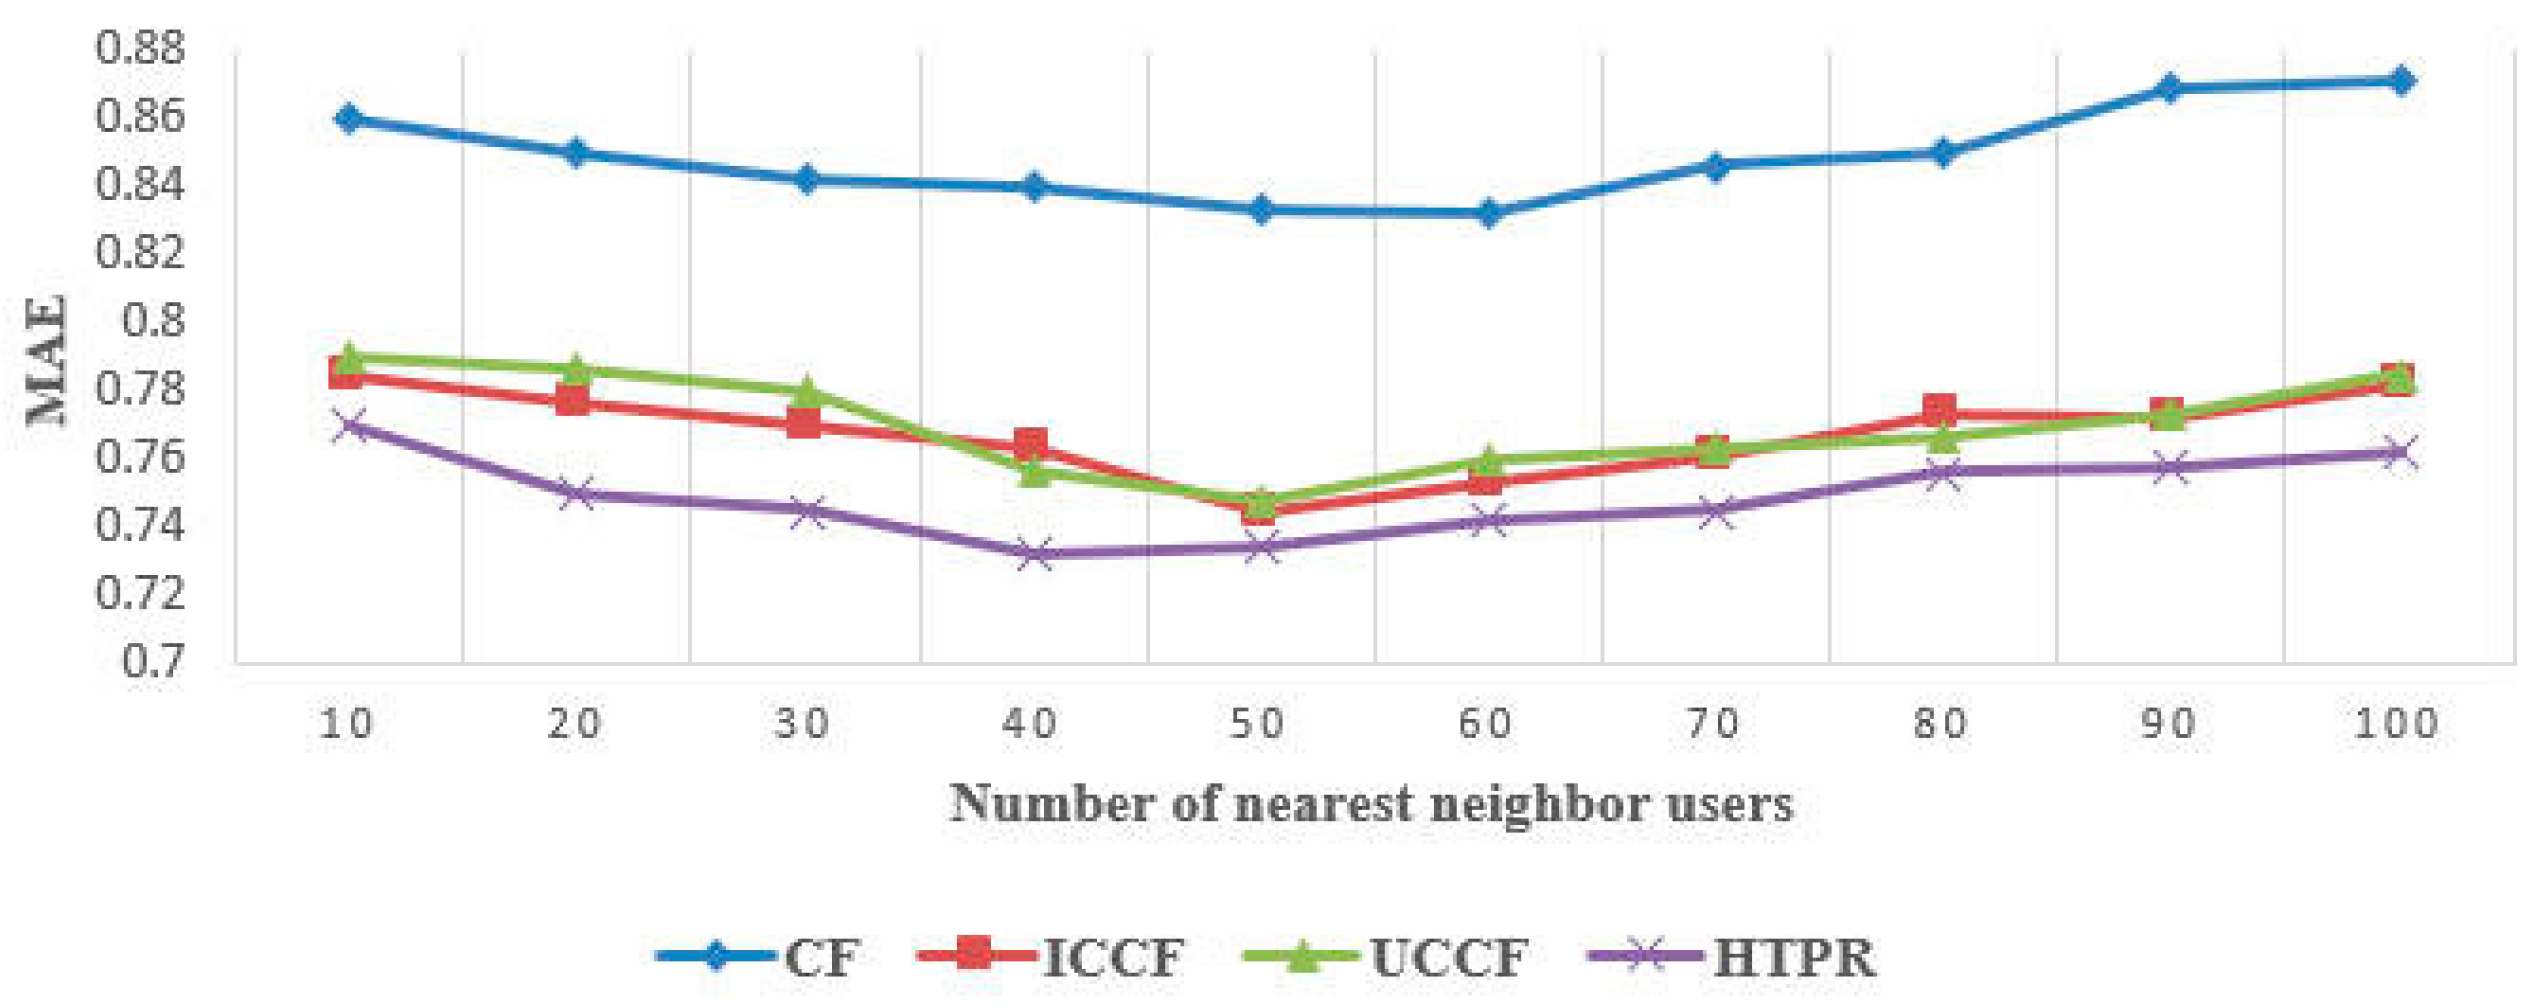
5.2.2. Accuracy Evaluation

HTPR was compared with basic CF, UCCF and ICCF on the prediction quality (MAE), and on the quality of recommendation (Precision, Recall and F1) to evaluate accuracy.
(1) Comparison of HTPR with CF, UCCF and ICCF on MAE. In this experiment, the number of clusters and nearest neighbors for item clustering was respectively 40 and 30; for user clustering, the number of clusters was 50; the similarity threshold θ was 0.7; the regulating parameter ρ was 0.4. We varied the number of nearest neighbors from 10 to 100 with a step of 10.
Figure 10 shows the MAE values of CF, ICCF, UCCF and HTPR. It can be found that the MAE values of ICCF, UCCF and HTPR were much lower than CF. In addition, the MAE value of HTPR was the lowest, the curve of HTPR shows down first and then up, and the MAE achieved a lowest value 0.732 when the number of nearest neighbors was 40. Thus the proposed HTPR method was proven to provide more accurate predictions than CF, ICCF and UCCF.
(2) Comparison of HTPR with CF, ICCF and UCCF on precision, recall and F1. In most recommendation applications, users would be recommended a personalized recommendation list, i.e., Top-N list. The services/items in higher positions should be more appropriate than the services/items in lower positions of the Top-N list. Precision, pecall and F1 were used as evaluation metrics to evaluate the quality of the Top-N recommendation list. The experiment setup was the same as for the previous comparison, except that the number of nearest neighbors for user clustering was set as 40 according to the above experiments.
Figure 11, Figure 12 and Figure 13 show the precision, recall and F1 values of Top-N (N ranged from 5 to 50 with a step of 5) recommendation list of CF, ICCF, UCCF and HTPR. The Y-coordinate respectively denotes the precision, recall and F1 values, and the X-coordinate denotes the number of items in recommendation list, i.e., N. It can be found that the precision values decreased when N increased, while the recall values increased when N increased. The F1 values went up first and then down when N increased. Besides, the precision, recall and F1 values of HTPR were comparatively higher than those of CF, ICCF and UCCF. It can also be noticed that when N = 25, the proposed HTPR method achieved the most accurate quality of recommendation.

6. Conclusions and Future Work

In this paper, a hybrid two-phase recommendation method for group-buying e-commerce applications was proposed to particularly address the problems of scalability and data sparsity by integrating collaborative filtering and clustering techniques. In this hybrid two-phase recommendation method, the feature matrix was developed to alleviate the sparsity problem by using a feature description and combination approach, the user-item category tendency was defined to integrate users’ preferences with users’ concern degrees for item category, the concept of integrating similarity between users was proposed by considering user behaviors and their frequencies, a parallelized strategy to optimize the recommendation process was also studied. The experiments from a real-world dataset indicated that the proposed HTPR method was effective.
Our future work will focus on the application of the HTPR method and analyze the strengths and weaknesses of the real-time group-buying e-commerce application.

Author Contributions

Methodology, writing—original draft preparation, L.B.; software and validation, M.H.; data curation, Y.M.; conceptualization, review and editing and funding acquisition, M.L.

Funding

Research was funded by the National Nature Science Foundation of China, grant number 61573257 and 71690234.

Acknowledgments

We thank Jingwei Wang, the Editor and the reviewing experts for their helpful suggestions.

Conflicts of Interest

The authors declare no conflict of interest.

References

  1. Lenhart, A.; Purcell, K.; Smith, A.; Zickuhr, K. Social Media & Mobile Internet Use among Teens and Young Adults; Pew Internet & American Life Project: Washington, DC, USA, 2010. [Google Scholar]
  2. Berthon, P.R.; Pitt, L.F.; Plangger, K.; Shapiro, D. Marketing meets web 2.0, social media, and creative consumers: Implications for international marketing strategy. Bus. Horiz. 2012, 55, 261–271. [Google Scholar] [CrossRef]
  3. Andriole, S.J. Business impact of web 2.0 technologies. Commun. ACM 2010, 53, 67–79. [Google Scholar] [CrossRef]
  4. Zhang, H.D.; Ni, W.C.; Li, X.; Yang, T.P. Modeling the Heterogeneous Duration of User Interest in Time-Dependent Recommendation: A Hidden Semi-Markov Approach. IEEE Trans. Syst. Man Cybern. Syst. 2018, 48, 177–194. [Google Scholar] [CrossRef]
  5. Barenji, A.V.; Wang, W.M.; Li, Z.; Guerra-Zubiaga, D.A. Intelligent E-commerce logistics platform using hybrid agent based approach. Transp. Res. Part E Logist. Transp. Res. 2019, 126, 15–31. [Google Scholar] [CrossRef]
  6. Tomohiro, A. Merchant selection and pricing strategy for a platform firm in the online group buying market. Ann. Oper. Res. 2018, 263, 209–230. [Google Scholar]
  7. Wu, Y.; Zhu, L. Joint quality and pricing decisions for service online group-buying strategy. Electron. Commer. Res. Appl. 2017, 25, 1–15. [Google Scholar] [CrossRef]
  8. Bello-Orgaz, G.; Jung, J.J.; Camacho, D. Social big data: Recent achievements and new challenges. Inf. Fusion 2015, 28, 28, 45–59. [Google Scholar] [CrossRef]
  9. Meng, S.; Dou, W.; Zhang, X.; Chen, J. Kasr: A keyword-aware service recommendation method on mapreduce for big data applications. IEEE Trans. Parallel Distrib. Syst. 2014, 25, 3221–3231. [Google Scholar] [CrossRef]
  10. Parameswaran, S.; Luo, E.; Nguyen, T. Patch Matching for Image Denoising Using Neighborhood-Based Collaborative Filtering. IEEE Trans. Circuits Syst. Video Technol. 2018, 28, 392–401. [Google Scholar] [CrossRef]
  11. Cai, Y.; Leung, H.F.; Li, Q.; Min, H.Q.; Tang, J.; Li, J.Z. Typicality-based collaborative filtering recommendation. IEEE Trans. Knowl. Data Eng. 2014, 26, 766–779. [Google Scholar] [CrossRef]
  12. Rastin, N.; Jahromi, M.Z. Using content features to enhance the performance of user-based collaborative filtering. Int. J. Artif. Intell. Appl. 2014, 5, 53–62. [Google Scholar]
  13. Jiang, S.; Fang, S.C.; An, Q.; Lavery, J.E. A sub-one quasi-norm-based similarity measure for collaborative filtering in recommender systems. Inf. Sci. 2019, 487, 142–155. [Google Scholar] [CrossRef]
  14. Alqadah, F.; Reddy, C.K.; Hu, J.; Alqadah, H.F. Biclustering neighborhood-based collaborative filtering method for top-n, recommender systems. Knowl. Inf. Syst. 2015, 44, 475–491. [Google Scholar] [CrossRef]
  15. Pavlos, K.; Panagiotis, S.; Yannis, M. Recommendations based on a heterogeneous spatio-temporal social network. World Wide Web-Internet Web Inf. Syst. 2018, 21, 345–371. [Google Scholar]
  16. Chen, X.; Zheng, Z.; Yu, Q.; Lyu, M.R. Web service recommendation via exploiting location and QoS information. IEEE Trans. Parallel Distrib. Syst. 2014, 25, 1913–1924. [Google Scholar] [CrossRef]
  17. Pereira, A.L.V.; Hruschka, E.R. Simultaneous co-clustering and learning to address the cold start problem in recommender systems. Knowl. Based Syst. 2015, 82, 11–19. [Google Scholar] [CrossRef]
  18. Tsai, C.F.; Hung, C. Cluster ensembles in collaborative filtering recommendation. Appl. Soft Comput. 2012, 12, 1417–1425. [Google Scholar] [CrossRef]
  19. Yao, L.; Sheng, Q.Z.; Ngu, A.H.; Yu, J.; Segev, A. Unified Collaborative and Content-Based Web Service Recommendation. IEEE Trans. Serv. Comput. 2015, 8, 453–466. [Google Scholar] [CrossRef]
  20. Liu, C.H.; Jin, T.; Hoi, S.C.H.; Zhao, P.L.; Sun, J.L. Collaborative topic regression for online recommender systems: An online and Bayesian approach. Mach. Learn. 2017, 106, 651–670. [Google Scholar] [CrossRef]
  21. Resnick, P.; Varian, H.R. Recommender systems. Commun. ACM 1997, 40, 56–58. [Google Scholar] [CrossRef]
  22. Lakiotaki, K.; Matsatsinis, N.F.; Tsoukias, A. Multicriteria user modeling in recommender systems. IEEE Intell. Syst. 2011, 26, 64–76. [Google Scholar] [CrossRef]
  23. Huang, Z.; Zeng, D.; Chen, H. A comparison of collaborative-filtering recommendation algorithms for e-commerce. IEEE Intell. Syst. 2007, 22, 68–78. [Google Scholar] [CrossRef]
  24. Kazienko, P.; Musial, K.; Kajdanowicz, T. Multidimensional social network in the social recommender system. IEEE Trans. Syst. Man Cybern. Part A Syst. Hum. 2013, 41, 746–759. [Google Scholar] [CrossRef]
  25. Lin, W.; Alvarez, S.A.; Ruiz, C. Efficient adaptive-support association rule mining for recommender systems. Data Min. Knowl. Discov. 2002, 6, 83–105. [Google Scholar] [CrossRef]
  26. Hassannia, R.; Barenji, A.V.; Li, Z.; Alipour, H. Web-Based Recommendation System for Smart Tourism: Multiagent Technology. Sustainability 2019, 11, 323. [Google Scholar] [CrossRef]
  27. Jeong, B.; Lee, J.; Cho, H. Improving memory-based collaborative filtering via similarity updating and prediction modulation. Inf. Sci. 2010, 180, 602–612. [Google Scholar] [CrossRef]
  28. Gong, S.J.; Ye, H.W.; Tan, H.S. Combining Memory-Based and Model-Based Collaborative Filtering in Recommender System. In Proceedings of the Pacific-Asia Conference on Circuits, Communications and Systems, Chengdu, China, 16–17 May 2009; pp. 690–693. [Google Scholar]
  29. Hu, Y.; Peng, Q.; Hu, X.; Yang, R. Time Aware and Data Sparsity Tolerant Web Service Recommendation Based on Improved Collaborative Filtering. IEEE Trans. Serv. Comput. 2015, 8, 782–794. [Google Scholar] [CrossRef]
  30. Barragáns-Martínez, A.B.; Costa-Montenegro, E.; Burguillo, J.C.; Rey-López, M.; Mikic-Fonte, F.A.; Peleteiro, A. A hybrid content-based and item-based collaborative filtering approach to recommend TV programs enhanced with singular value decomposition. Inf. Sci. 2010, 180, 4290–4311. [Google Scholar] [CrossRef]
  31. Su, X.Y.; Khoshgoftaar, T.M.; Zhu, X.Q.; Greiner, R. Imputation-Boosted Collaborative Filtering Using Machine Learning Classifiers. In Proceedings of the 2008 ACM Symposium on Applied Computing, Fortaleza, Brazil, 16–20 March 2008; pp. 949–950. [Google Scholar]
  32. Nilashi, M.; Jannach, D.; Ibrahim, O.B.; Ithnin, N. Clustering and regression-based multi-criteria collaborative filtering with incremental updates. Inf. Sci. 2015, 293, 235–250. [Google Scholar] [CrossRef]
  33. Jiang, S.; Qian, X.; Shen, J.; Fu, Y. Author topic model-based collaborative filtering for personalized poi recommendations. IEEE Trans. Multimed. 2015, 17, 907–918. [Google Scholar] [CrossRef]
  34. Wu, J.; Chen, L.; Feng, Y.; Zheng, Z.; Zhou, M.C.; Wu, Z. Predicting quality of service for selection by neighborhood-based collaborative filtering. IEEE Trans. Syst. Man Cybern. Syst. 2013, 43, 428–439. [Google Scholar] [CrossRef]
  35. Nilashi, M.; Ibrahim, O.B.; Ithnin, N. Hybrid recommendation approaches for multi-criteria collaborative filtering. Expert Syst. Appl. 2014, 41, 3879–3900. [Google Scholar] [CrossRef]
  36. Luo, X.; Zhou, M.; Xia, Y.; Zhu, Q. An efficient non-negative matrix-factorization-based approach to collaborative filtering for recommender systems. IEEE Trans. Ind. Inform. 2014, 10, 1273–1284. [Google Scholar]
  37. Hofmann, T. Latent semantic models for collaborative filtering. ACM Trans. Inf. Syst. (TOIS) 2004, 22, 89–115. [Google Scholar] [CrossRef]
  38. Pennock, D.M.; Horvitz, E.; Lawrence, S.; Giles, C.L. Collaborative Filtering by Personality Diagnosis: A Hybrid Memory and Model-Based Approach. In Proceedings of the Sixteenth Conference on Uncertainty in Artificial Intelligence, San Francisco, CA, USA, 30 June–3 July 2000; pp. 72–81. [Google Scholar]
  39. Rafailidis, D.; Nanopoulos, A. Modeling users preference dynamics and side information in recommender systems. IEEE Trans. Syst. Man Cybern. Syst. 2016, 46, 782–792. [Google Scholar] [CrossRef]
  40. Bobadilla, J.; Ortega, F.; Hernando, A.; Bernal, J. A collaborative filtering approach to mitigate the new user cold start problem. Knowl. Based Syst. 2012, 26, 225–238. [Google Scholar] [CrossRef] [Green Version]
  41. Symeonidis, P.; Nanopoulos, A.; Manolopoulos, Y. Providing justifications in recommender systems. IEEE Trans. Syst. Man Cybern. Syst. Hum. 2008, 38, 1262–1272. [Google Scholar] [CrossRef]
  42. Cacheda, F.; Carneiro, V.; Fernández, D.; Formoso, V. Comparison of collaborative filtering algorithms: Limitations of current techniques and proposals for scalable, high-performance recommender systems. ACM Trans. Web (TWEB) 2011, 5, 2. [Google Scholar] [CrossRef]
  43. Bobadilla, J.; Serradilla, F.; Bernal, J. A new collaborative filtering metric that improves the behavior of recommender systems. Knowl. Based Syst. 2010, 23, 520–528. [Google Scholar] [CrossRef]
Figure 1. Two-phase recommendation process.
Applsci 09 03141 g001
Figure 2. Schematic view of a recommendation system.
Applsci 09 03141 g002
Figure 3. Overview of HTPR method.
Applsci 09 03141 g003
Figure 4. Schematic of the training set and test set.
Applsci 09 03141 g004
Figure 5. Impact of the number of clusters for item clustering.
Applsci 09 03141 g005
Figure 6. Impact of the number of nearest neighbors on MAE for item clustering.
Applsci 09 03141 g006
Figure 7. Impact of the number of clusters for user clustering.
Applsci 09 03141 g007
Figure 8. Impact of the number of nearest neighbors on MAE for user clustering.
Applsci 09 03141 g008
Figure 9. Impact of the regulating parameter on MAE.
Applsci 09 03141 g009
Figure 10. Comparison of CF, ICCF, UCCF and HTPR in MAE.
Applsci 09 03141 g010
Figure 11. Comparison of CF, ICCF, UCCF and HTPR in Precision.
Applsci 09 03141 g011
Figure 12. Comparison of CF, ICCF, UCCF and HTPR in Recall.
Applsci 09 03141 g012
Figure 13. Comparison of CF, ICCF, UCCF and HTPR in F1.
Applsci 09 03141 g013
Table 1. Comparison of recommendation techniques.
Recommendation TechniqueAdvantagesDisadvantages
Collaborative filteringeasily realized, handle unstructured complex objects, high automation, personalizedrely on massive historical data, data sparseness problem, cold-start problem
Content filteringmore personalized, domain knowledge required, well-understood resultsdata sparseness problem, difficult to extract and describe feature from complex structured objects
Social filteringfeature-distinguished, easily-accepted user privacy problem, complex social relationship
Association rule basehigh automation, discover interest point without domain knowledge, no cold-start problemdifficult to extract rules, less personalized
Demographic baseddiscover interest point without domain knowledge, no cold-start problemdifficult to obtain demographic information of users
Table 2. Common user behavior.
Types of User BehaviorUser Behavior
Explicit behaviorrating, vote, share/forward, add-to-favorite, purchase, review
Implicit behaviorclick/browse, time on page
Table 3. Feature combination of item attribute and review tag.
FeatureAttribute 1Attribute 2Attribute pTag 1Tag 2Tag q
Item
Item 11110.12300
Item 2100000.248
Item m0000.3870.4720
Table 4. Structure of the dataset.
Data TableFormat
Item attribute<item id> <attribute id> <attribute weight>
Item review tag<item id> <tag id> <tag relevant value>
User/item browse<user id> <item id> <browse tag> <browse time>
User/item wish list<user id> <item id> <add-to-favorite tag> <add-to-favorite time>
User/item purchase<user id> <item id> <purchase tag> <purchase time>
User/item rating<user id> <item id> <rating value>
Note: the data table of item attributes was obtained through keywords extracted from the description of items based on word segmentation, and every word was endowed with weight; the feature tag of item review tag was extracted from the review content by using textual analysis, and the relevant values of tag are given with the range of (0, 1).

