Article

Temporal Variations in Soil Enzyme Activities and Responses to Land-Use Change in the Loess Plateau, China

1
Shaanxi Key Laboratory of Chinese Jujube, Yan’an University, Yan’an 716000, China
2
College of Life Sciences, Yan’an University, Yan’an 716000, China
3
College of Agronomy, Northwest A&F University, Yangling 712100, China
4
College of Urban and Environmental Sciences, Northwest University, Xi’an 710127, China
*
Authors to whom correspondence should be addressed.
Appl. Sci. 2019, 9(15), 3129; https://doi.org/10.3390/app9153129
Submission received: 28 May 2019 / Revised: 28 July 2019 / Accepted: 29 July 2019 / Published: 1 August 2019

Abstract

:
Variability in soil enzyme activity may have important implications for the knowledge of underground ecosystem functions driven by soil extracellular enzymes. To illustrate the temporal variation in soil enzyme activity after afforestation, we collected soil samples during different vegetative growth periods in three Caragana korshinskii Kom. stands of different ages (20, 30, and 40 years) and in a slope cropland in the Loess Plateau. These samples were used to analyze the catalase, sucrase, urease and alkaline phosphatase activities, the soil water content and the available soil nutrients (i.e., dissolved organic carbon, dissolved organic nitrogen, and available phosphorus). The results illustrated that the soil enzyme activities significantly increased following afforestation and varied with temporal variation. Overall, soil enzyme activities were higher in June and August, particularly, and both alkaline phosphatase and sucrase were more sensitive to temporal variation than the other two enzymes. In addition, redundancy analysis showed that soil enzyme activities were greatly correlated with soil nutrients, especially for dissolved organic carbon and dissolved organic nitrogen. Therefore, the results highlighted the importance of soil enzyme activities to soil nutrients under temporal variation following afforestation in the Loess Plateau, which may have practical significance for forest managers’ fertilization management of plantation in different seasons and different stand ages.

1. Introduction

Afforestation is an efficient measure to repair destroyed natural ecosystems, which occurs by converting cropland into perennial vegetation land, has great impacts on plant primary productivity and soil physicochemical properties (i.e., soil bulk density, aggregation, soil nutrient pools, and biodiversity) [1,2,3] and in turn, influences soil biological activity, such as soil enzyme activity and microbial biomass [4,5]. Soil enzyme activities in changing land-use types have attracted special attention for this topic’s relevance in soil ecosystem dynamics and ecosystem sustainability [6,7]. However, due to diverse ecological communities, environmental factors and regional variation, knowledge of soil enzymatic metabolism, such as the temporal variation in soil enzymes after afforestation, is still ambiguous [8,9]. This poses a challenge to our understanding of underground ecosystem functions that are driven by soil extracellular enzymes.
The soil enzymes play a key role in catalyzing various biological and chemical reactions in soil, especially in catalyzing the rate-limiting step of soil organic matter decomposition and the dissolved organic matter producing [10,11]. For example, soil phosphatase has been reported as an essential factor of organic P mineralization, and sucrase and urease are involved in the decomposition of soil organic matter and the transformation of soil N [12]. In addition, soil microbes can get access to the energy and nutrients in complex substrates through the extracellular enzymes [10]. Studies have shown that soil extracellular enzyme activities depend on multiple factors, such as temperature, aboveground vegetation, and soil properties [5,13,14]. Since these factors have strong variability over time (e.g., seasonal changes and inter-annual variations), the soil enzyme activities also vary with season and stand age [9]. Previous studies have shown that soil enzyme activities are highest in summer due to high soil moisture and temperature [14,15], and these studies have demonstrated that temporal analyses of various soil enzyme activities can provide key insights into the factors that influence soil enzymes and related soil microbes [8]. Hence, studies on soil enzyme activities in sites of different restoration age and in different growing seasons during the year could contribute to the understanding of soil recovery processes and the improvement of soil quality after afforestation [16].
The Loess Plateau of China (LPC) is a typical ecological fragile area and has suffered some of the worst soil and water erosion over the past fifty years [17,18]. The ecological restoration projects that were implemented in the 1950s include the “Grain to Green Project” (GTGP), which is one of the largest ecological restoration projects in the world and has created 7.47 million ha of artificial forest and 2.58 million ha of artificial grassland; additionally, these restoration efforts have greatly decreased soil and water erosion [19]. Meanwhile, afforestation has also enhanced plant productivity and transported more photosynthetically-fixed C inputs belowground, leading to changes in soil physical, chemical, and biological properties [20,21,22]. However, the diverse vegetation communities and fragmented habitats in this area pose challenges to our understanding of the metabolic functions of enzyme activity after afforestation; additionally, this region provides an opportunity to research the temporal variation in soil enzymes in different communities and habitats. Caragana korshinskii Kom. (CK), a native leguminous shrub with high N-fixing abilities and strong resistance to drought [23], is the most widespread plant species used in vegetation restoration in the LPC and other arid and semi-arid areas [24]. The complete chronological sequence of CK plantations in the LPC provides us the opportunity to explore the temporal variation in soil enzymes at sites of different succession ages.
In this study, we collected soil samples in different vegetation growth periods in three CK plantations with different stand ages and a slope cropland (as a control) in the LPC for the analysis of the catalase, sucrase, urease, alkaline phosphatase, and soil properties (mainly available nutrients). The present study focused on (1) the response of soil enzyme activities after CK plantation; (2) the temporal variation in soil enzymes based on different seasons and stand ages; and (3) the linkage between soil enzyme activities and soil properties after CK plantation. This study can contribute to the understanding of nutrient cycling process in eco-restoration forests, and to improve the restored ecosystem sustainability by scientific management.

2. Materials and Methods

2.1. Research Area

The field experiment was conducted in the Wuliwan catchment of Ansai County in the central area of the LPC (36°39′–36°52′ N, 109°20′–109°21′ E) (Figure 1). This area has a typical semi-arid climate and a hilly loess landscape. The mean annual rainfall is 505 mm with an annual average temperature of 8.8 °C. Approximately 60% of the precipitation occurs in the summer (July and September), during which the temperature is the highest in the year. The soil in this region is highly erodible Calcaric Cambisols (FAO), which developed from wind-accumulated loess. The soil texture in the 0–20 cm layer is 63.6% sand, 29.2% silt, and 7.2% clay [17], and the soil has a weak resistance to erosion (the high erosion modulus has reached 10,000 to 12,000 Mg km−2 yr−1) [25].
Large-scale vegetation restoration was implemented in recent decades and was encouraged by the government to address ecological degradation. Thus, a large area of slope cropland was replanted with forest and shrubs. The CK is the major tree species and was planted during each period of reforestation. The remnant cropland mainly planted maize (Zea mays L.), foxtail millet (Setaria italica) and broomcorn millet (Panicum miliaceum L.).

2.2. Experimental Design and Soil Sampling

To explore the temporal variation in soil enzymes in the present study, we use the stand age to represent the inter-annual variation, and the different plant growth stages represent the intra-annual variation. Based on the land-use history, three age classes of CK forests were selected in 2013, as well as one slope cropland (SC) with a low level of fertilization. The three age classes selected were CK that has been planted for 20, 30, and 40 years, all converted from cropland subjected to similar farming practices. Detailed information for each age class of CK forest and SC is shown in Table 1. We chose three independent replicate sample lands with size of 25 × 50 m sample lands for each of the three age classes of CK forests and the SC (Figure 1). The three sample lands for each age class were within 1 km of each other to ensure consistent climatic and environmental conditions. Three sample plots (with the size of 10 × 10 m) were selected in each sample land for sampling. All plots were topographically similar (i.e., slope aspect, slope degree) with similar elevation. Thus, a total of 36 sampling plots were established (four land use types × three sample lands × three replicate plots).
The soil samples were collected in April, June, August, and October in 2014 for laboratory analyses. In each plot, we selected nine sample points to collect soil samples. Soil samples at each point were collected from 0–10, 10–20, and 20–30 cm soil layers using a soil auger (4 cm in diameter). The soil samples from the same depth in each plot were completely mixed and reduced by coning and quartering to appropriate quantities. Then, the soil samples were transported to the laboratory to determine water content. In the laboratory, half of each sample was sieved through a 2 mm mesh and stored at 4 °C (for about one week) for the analyses of soil enzymes and other biological properties; the other half of the sample was air-dried and stored at room temperature (for about three months) for the analysis of the soil physicochemical properties. To avoid the impact of root and litters, all samples were collected at least 80 cm from trees after the litter layer was removed. The sampling process in each period was completed in one day. The vegetation survey conducted in each plot in August 2014 used 5 randomly-selected 1 × 1 m small plots. The litters in each selected 1 × 1 m small plots were collected, dried, and weighed for calculating the litter biomass. The characteristics of each plot are shown in Table 1.

2.3. Analysis of Soil Physicochemical Properties

Soil bulk density was calculated by collecting 100 cm3 of soil with a cutting ring and weighing the soil cores before and after oven drying at 105 °C for 24 h [26]. The concentrations of dissolved organic carbon (DOC) and dissolved organic nitrogen (DON) were determined with a TOC-TN analyzer (Shimadzu Corp., Kyoto, Japan). Specifically, the DON was calculated using the difference between the value of inorganic nitrogen (NH4+ and NO3) and total dissolved N, and the detailed method can be found in Reference [15]. Soil water content (SWC) was evaluated by oven drying to a constant mass at 105 °C. Available phosphorus (AP) was determined by NaHCO3 extraction and the Mo-Sb anti-spectrophotography method by using an ultraviolet spectrometer subsystem [26].

2.4. Soil Enzyme Assay

The soil enzyme activities were determined according to [15] and [17]. Specifically, soil sucrase activity was determined using 5 g of fresh soil (sieved to <1 mm), 15 mL of 8% glucose solution as substrates, 5 mL of 0.2 M phosphate buffer (in pH 5.5), and 5 drops of toluene; this mixture was incubated at 37.7 °C for 24 h. Then, the mixture was filtered and a 1 mL aliquot was transferred to a volumetric flask with 3 mL of 3,5-dinitrylsalicylate and then heated for 5 min. After reaching room temperature, the soil solution was quantified in an ultraviolet spectrometer subsystem (UVS) at 508 nm, and finally, the soil sucrase activity was expressed as mg glucose g−1 soil h−1.
The soil catalase activity was determined by mixing 2 g of fresh soil, 5 mL of 0.3% H2O2 as substrates, and 40 mL of distilled water in a triangular flask; the flask was then shaken for 20 min at 150 rpm and filtered immediately. Then, the filtrate was titrated with 0.1 mol L−1 KMnO4 in the presence of sulfuric acid. Finally, the soil catalase activity was expressed as mL 0.1 N KMnO4 g−1 soil h−1.
The soil alkaline phosphatase activity was determined by mixing 10 g of fresh soil, 2 mL of toluene, 10 mL of 0.05 M borate buffer at pH 9.6, and 10 mL of disodium phenyl phosphate solution. After being incubated at 37.8 °C for 2 h, the solutions were filtered, 0.5 mL of 2% 4-aminoantipyrine and 8% potassium ferrocyanide were added to the filtrate for color development, and the released phenol was quantified in the UVS at 510 nm. Finally, the soil alkaline phosphatase activity was expressed as mg phenol g−1 soil h−1.
The soil urease activity was determined by adding 5 g of fresh soil and 5 mL of citrate solution (pH 6.7) to 5 mL of 10% urea solution (as substrates); this mixture was then incubated at 37.8 °C for 24 h. Afterwards, the mixtures were diluted to 50 mL with distilled water and were immediately filtered. After filtering, 1 mL of supernatant was treated with a 4 mL sodium phenol solution, and a 3 mL 0.9% sodium hypochlorite solution was used to treat 1 mL of supernatant. The released ammonium from urea hydrolysis was quantified in the UVS at 578 nm. Finally, the soil urease activity was expressed as mg NH4+-N g−1 soil h−1.

2.5. Statistical Analysis

The Kolmogorov-Smirnov test was used to test for normal distributions; all data were distributed normally (p > 0.05 for each null hypothesis). Three-way ANOVA was used to test the changes in soil properties (Table S1) and soil enzyme activities (Table S2) as a result of different treatments (temporal variations, land use and soil depths) using the software program SAS (SAS Institute Inc., Cary, NC, USA). Three-way analysis of similarity (ANOSIM) was conducted to quantify the effect of treatments on soil enzyme activities using R (v.3.1.3). The sample statistic R was proposed to measure the differences between groups; details of this calculation can be found in Clarke’s study [27]. Pearson’s correlation coefficients (Person’s R) were used to reveal the correlation between the soil enzyme activities and soil properties. The coefficient of variation (CV) was used to determine the response of enzymes to treatments. Moreover, redundancy analysis (RDA) was used to identify the relationships between the soil enzyme activities and soil properties during plant growing seasons using Canoco (version 5.0. Microcomputer Power, Ithaca, NY, USA).

3. Results

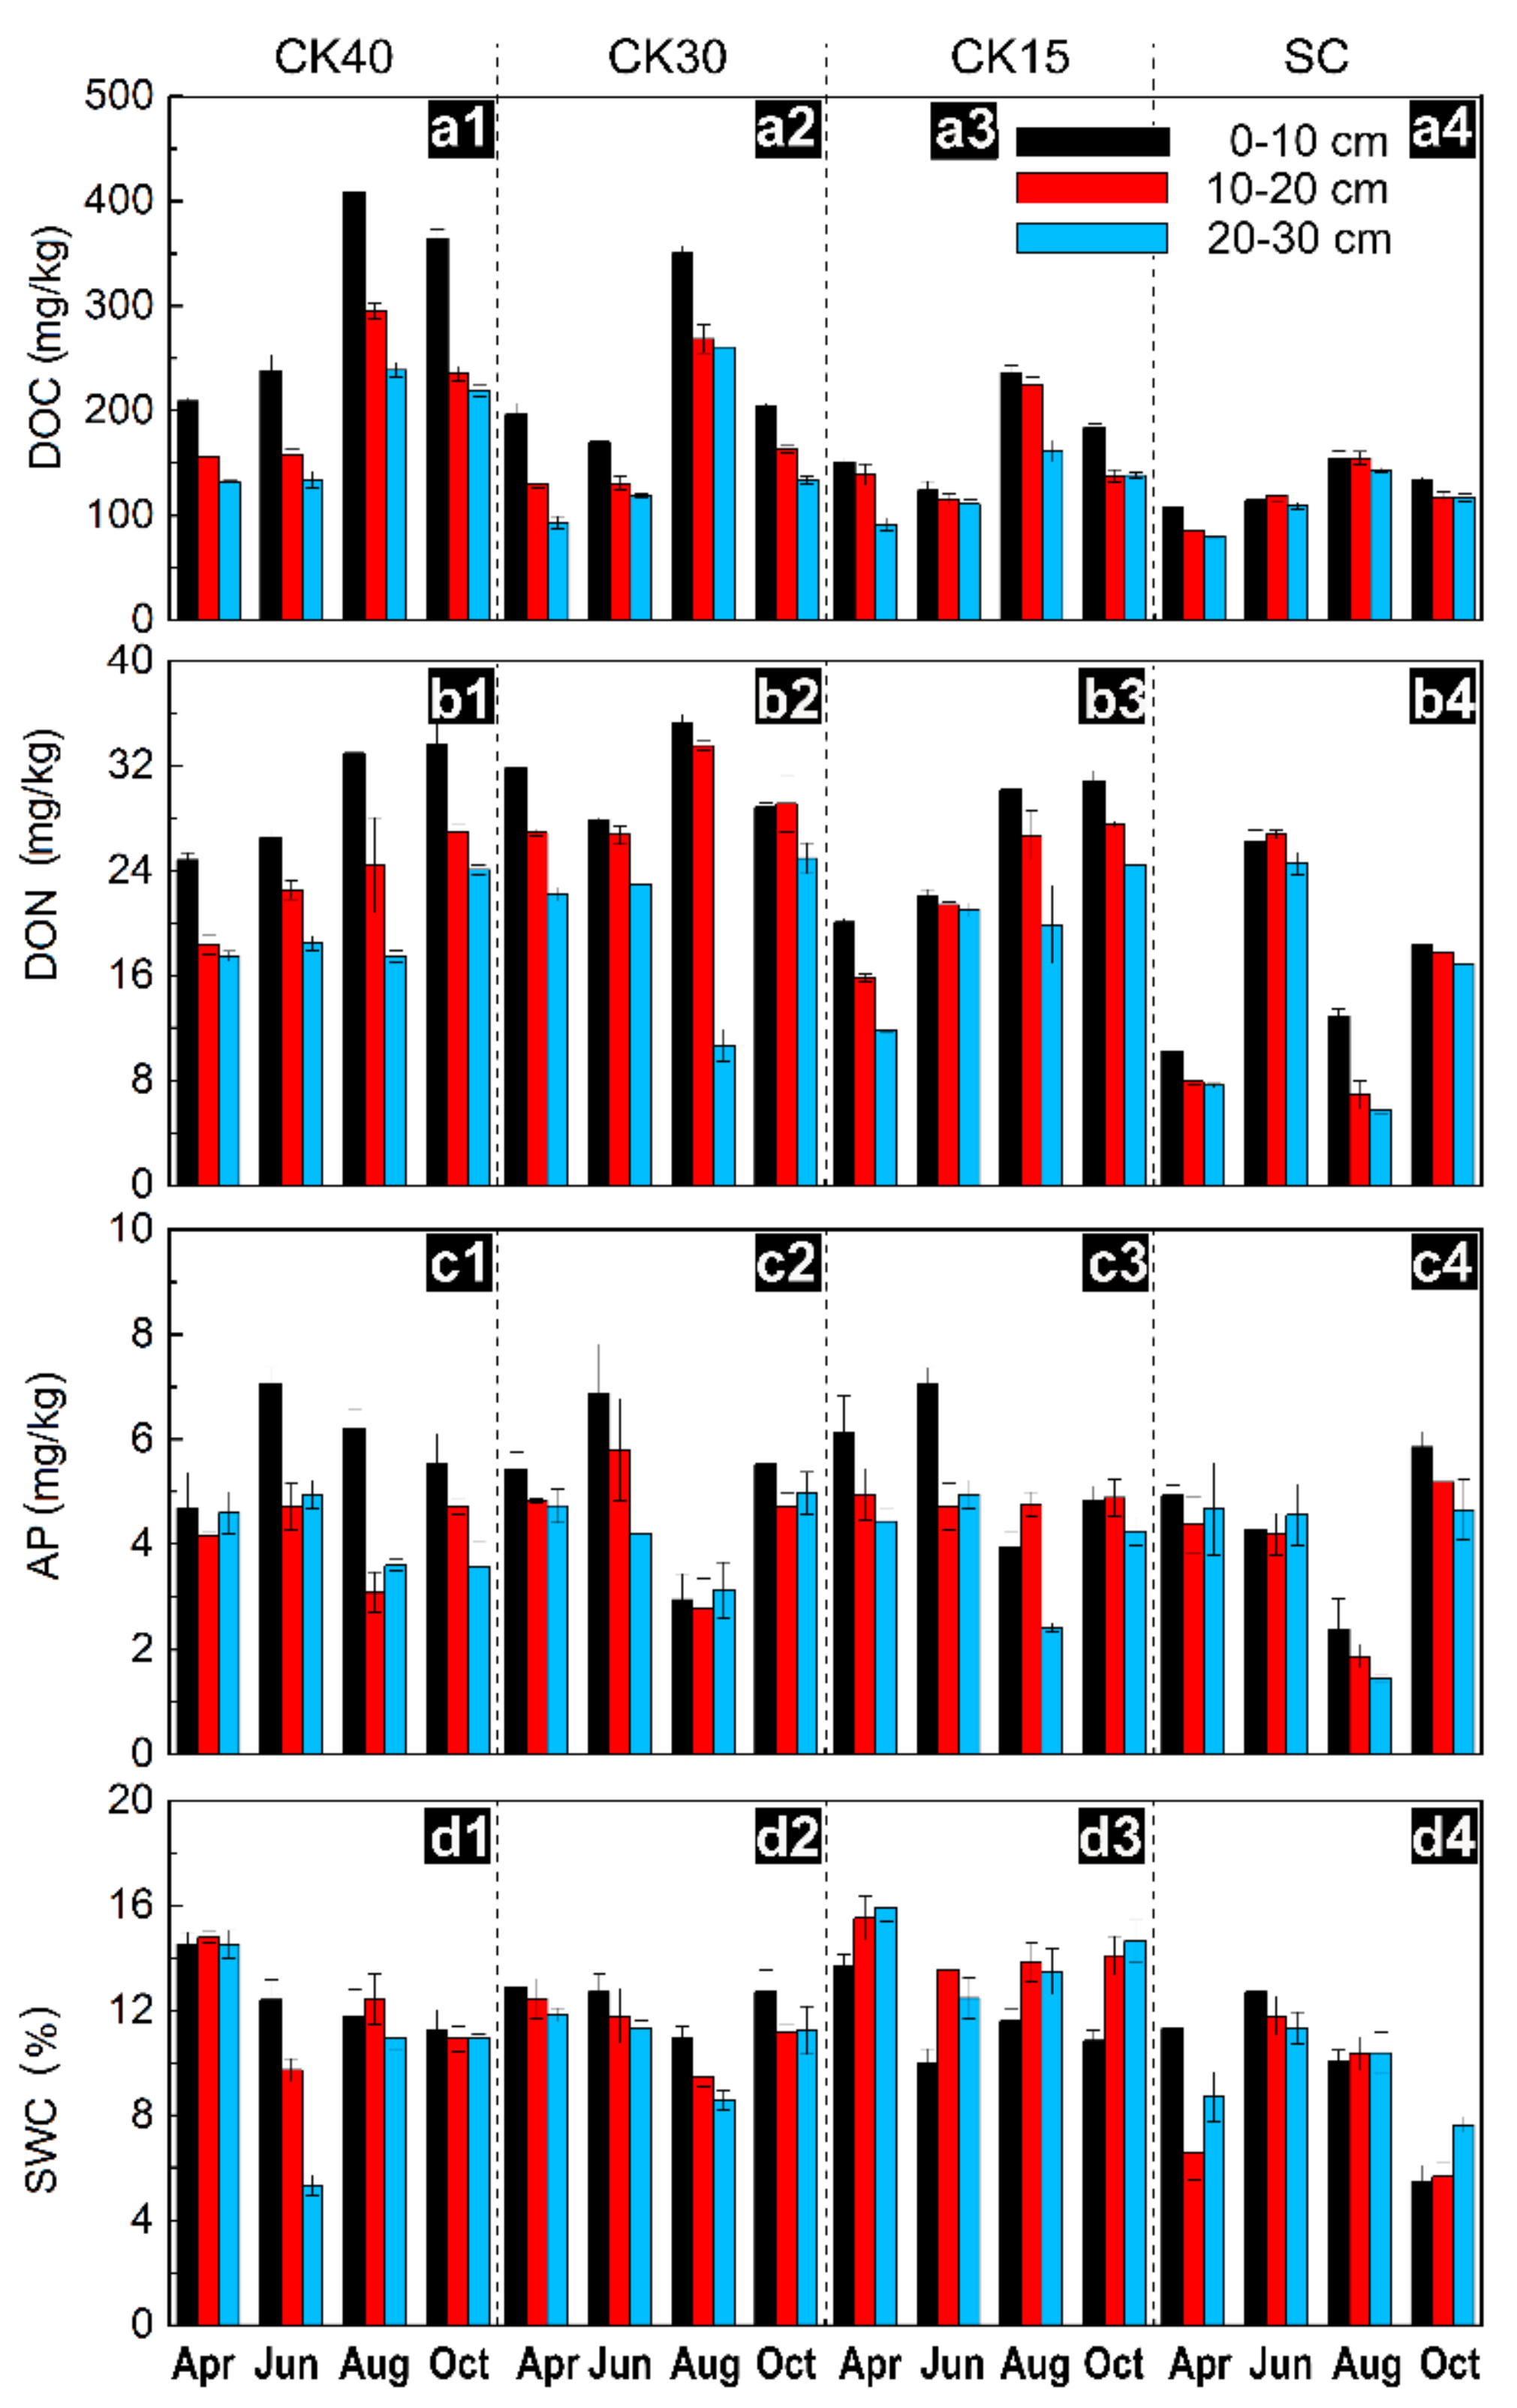
3.1. Changes in Available Nutrients and Water Content

Available soil nutrients (DOC, DON, and AP) and SWC differed with plant growing season and stand age (p < 0.01) (Figure 2, Table 2). Afforestation with CK significantly increased the DOC, DON, AP, and SWC in the soil by 26.31%–93.85%, 49.41%–92.88%, 15.51%–18.41%, and 22.36%–42.53%, respectively, compared with SC (p < 0.05). The available nutrients and SWC also changed with the plant growing seasons. The DOC and DON were highest in August, but the AP and SWC were highest in June and April, respectively. In addition, the contents of DOC, DON, AP, and SWC significantly decreased with an increase in soil depth (p < 0.05).

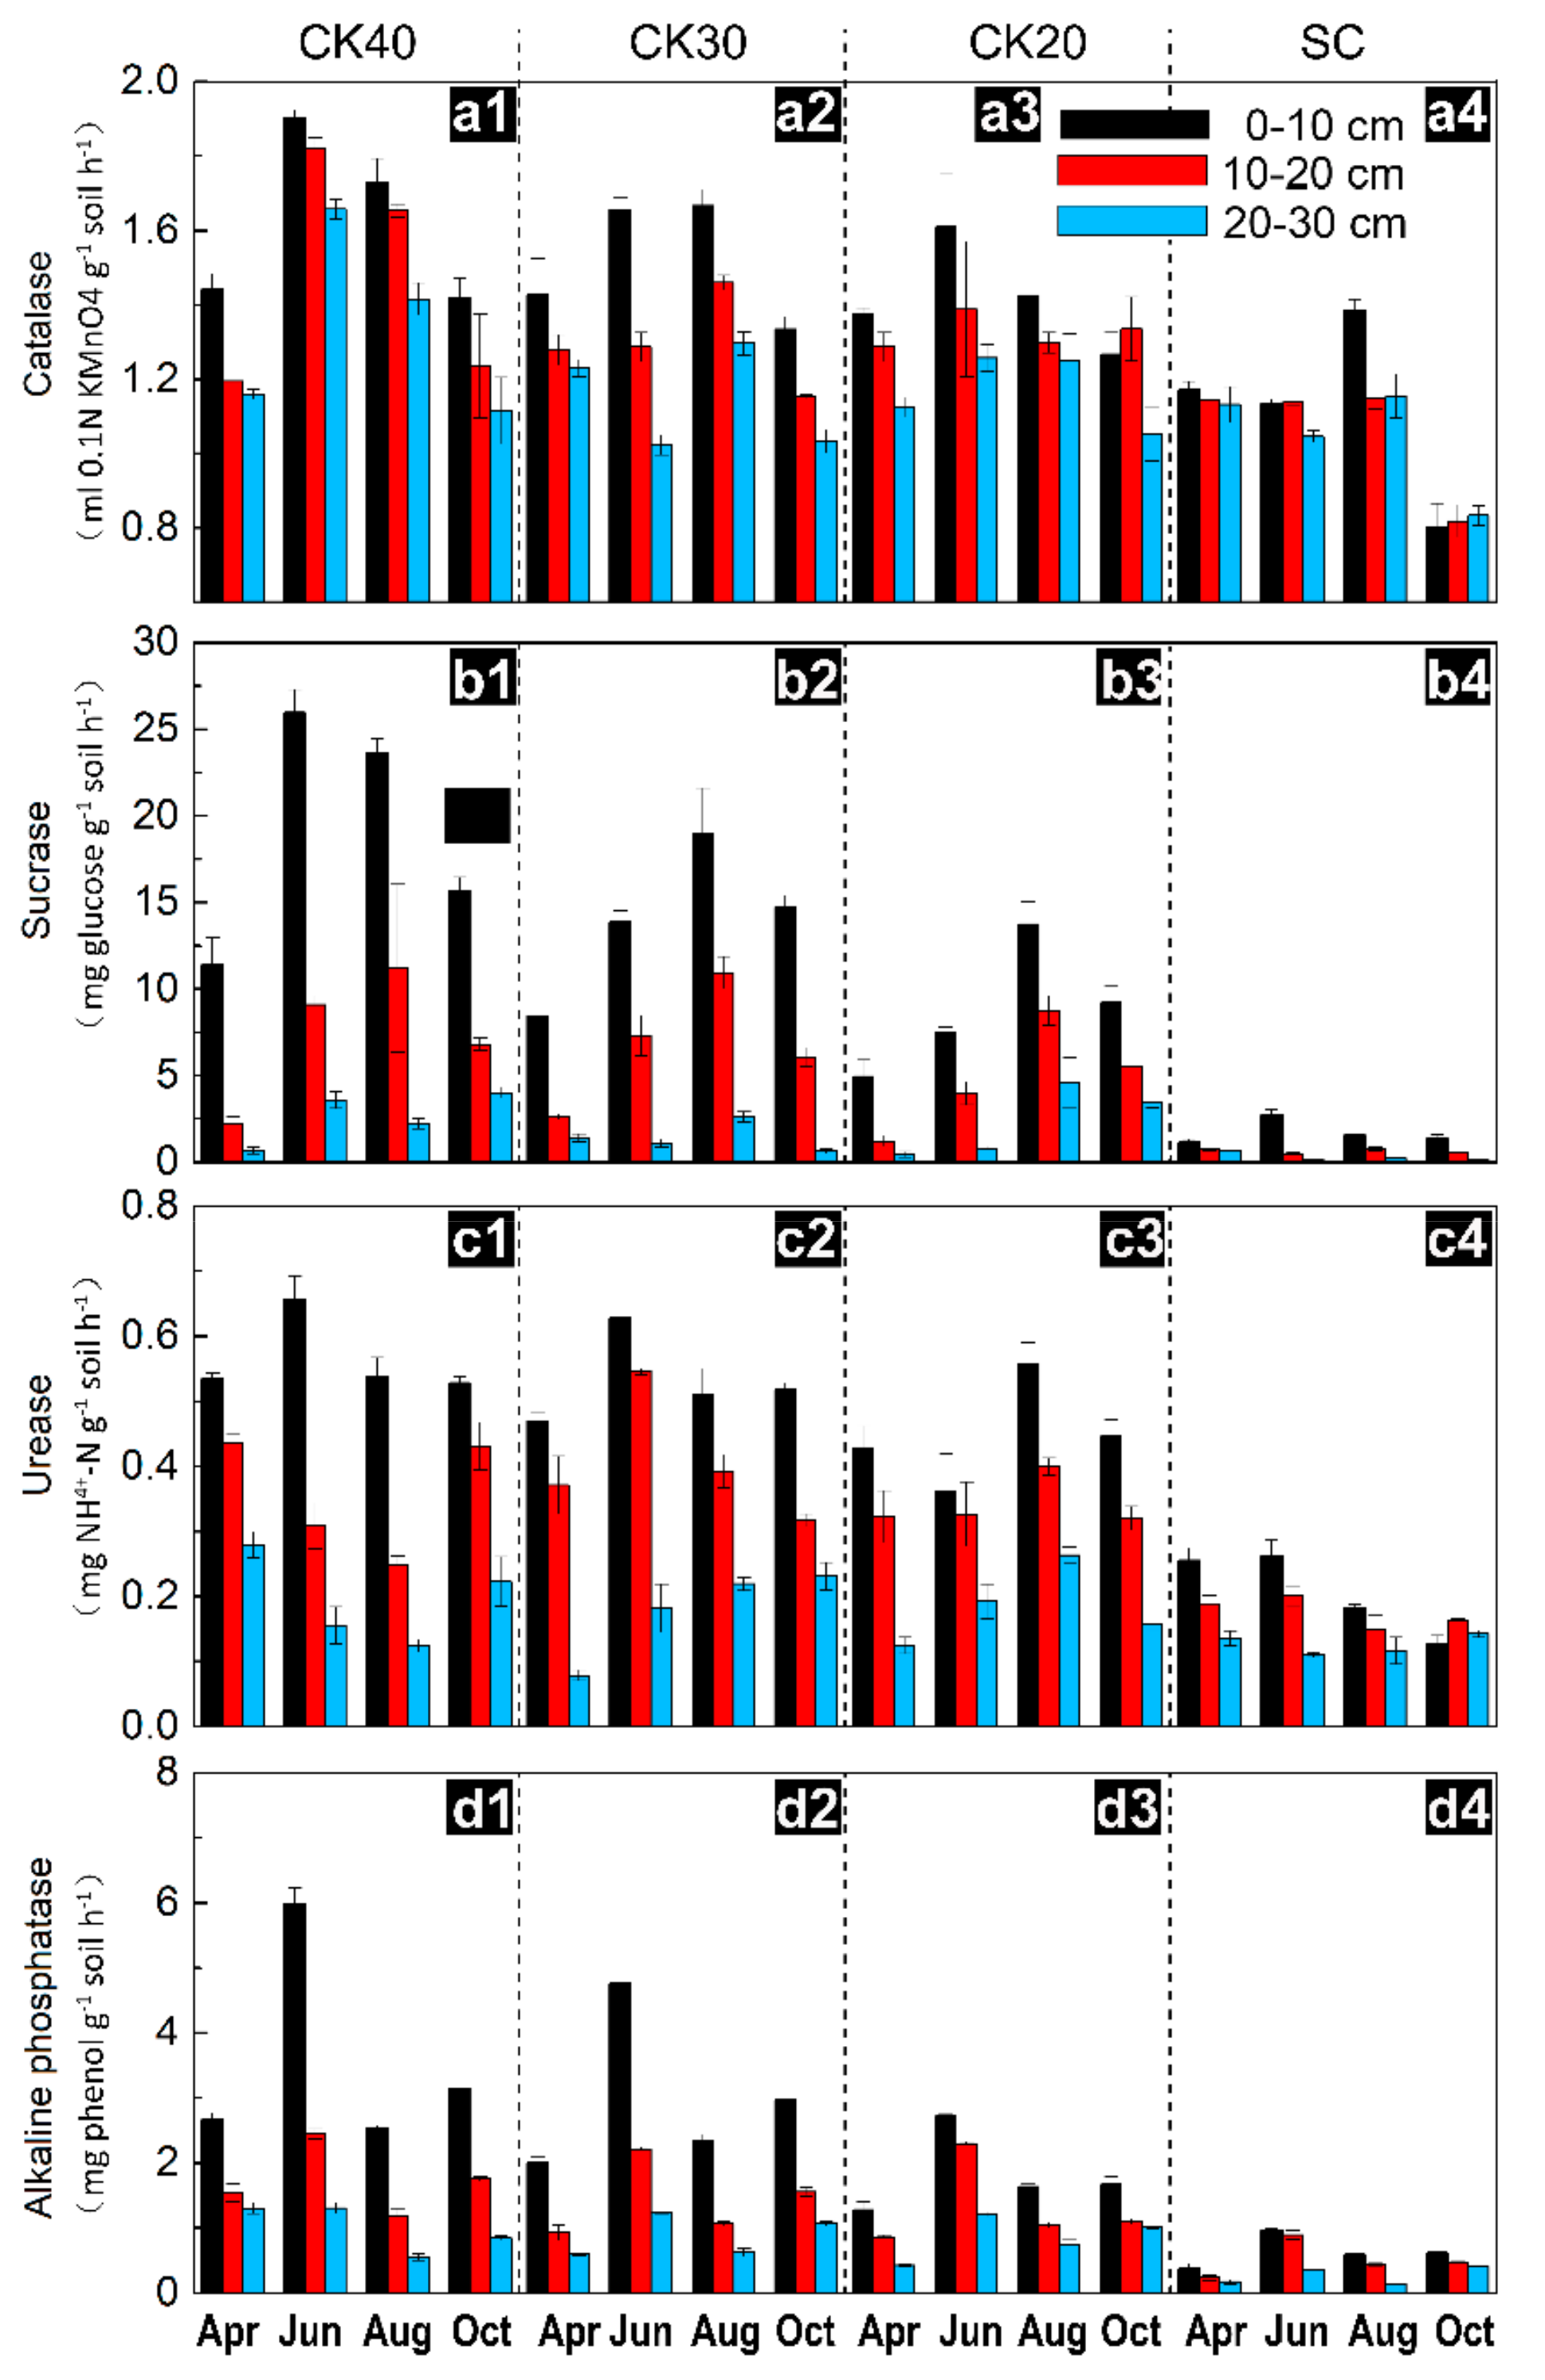
3.2. Temporal Variation in Soil Enzyme Activities after Afforestation

The changes in soil enzyme activities in response to time, stand age, and soil depth are shown in Figure 3. The activities of catalase, sucrase, urease, and alkaline phosphatase varied significantly (p < 0.01) with the plant growing season (Figure 3, Table 3). The activities of these four enzymes were highest in the summer (June or August), especially for sucrase and alkaline phosphatase. Catalase and urease activities were lowest in October, and sucrase and alkaline phosphatase activities were lowest in April (p < 0.01). In addition, the CV of catalase, sucrase, urease, and alkaline phosphatase activities among the different plant growing seasons in each plot were 0.08–0.16, 0.19–0.52, 0.13–0.19, and 0.33–0.39, respectively; this indicated that alkaline phosphatase and sucrase were more sensitive to temporal variation compared with the other two enzymes.
Moreover, the soil enzyme activities significantly (p < 0.01) increased after chronosequences of 40, 30, and 20 years of CK (Figure 3, Table S2). Specifically, the catalase, sucrase, urease, and alkaline phosphatase activities increased by 37.51% to 1000.33% in CK40, 22.79% to 738.76% in CK30, and 21.45% to 506.79% in CK20, indicating an increasing trend in soil enzyme activities with an increase in stand ages. The increments of sucrase activity in each stand age were the largest, followed by alkaline phosphatase activity. For the CV analysis in terms of land-use change, the CV of soil enzymes were ranked as alkaline phosphatase (0.37) > sucrase (0.35) > urease (0.16) > catalase (0.11), implying that soil alkaline phosphatase and sucrase were more sensitive to afforestation and stand age.
The soil enzyme activities significantly decreased with increasing soil depth (p < 0.05, Figure 3, Table S2). In detail, the catalase, sucrase, urease, and alkaline phosphatase activities decreased by 17.55%–24.75%, 73.60%–89.70%, 58.85%–66.61%, and 53.69%–72.06% in afforested lands, respectively, and 7.34%, 83.06%, 38.91%, and 58.10% in cropland, respectively, from the 0–10 cm to 20–30 cm soil profile; this suggests that sucrase was the most sensitive enzyme to soil depth and was followed by alkaline phosphatase (p < 0.05).
ANOSIM was performed to reflect the degree of influence of these two factors on soil enzyme activities (Table 4). It was shown that the catalase, sucrase, and alkaline phosphatase activities were greatly affected by stand age, while the urease activity was mainly affected by variation in soil depth. The overall degree of influence was ranked as stand age (R = 0.30), soil depth (R = 0.28), and growing season (R = 0.18).

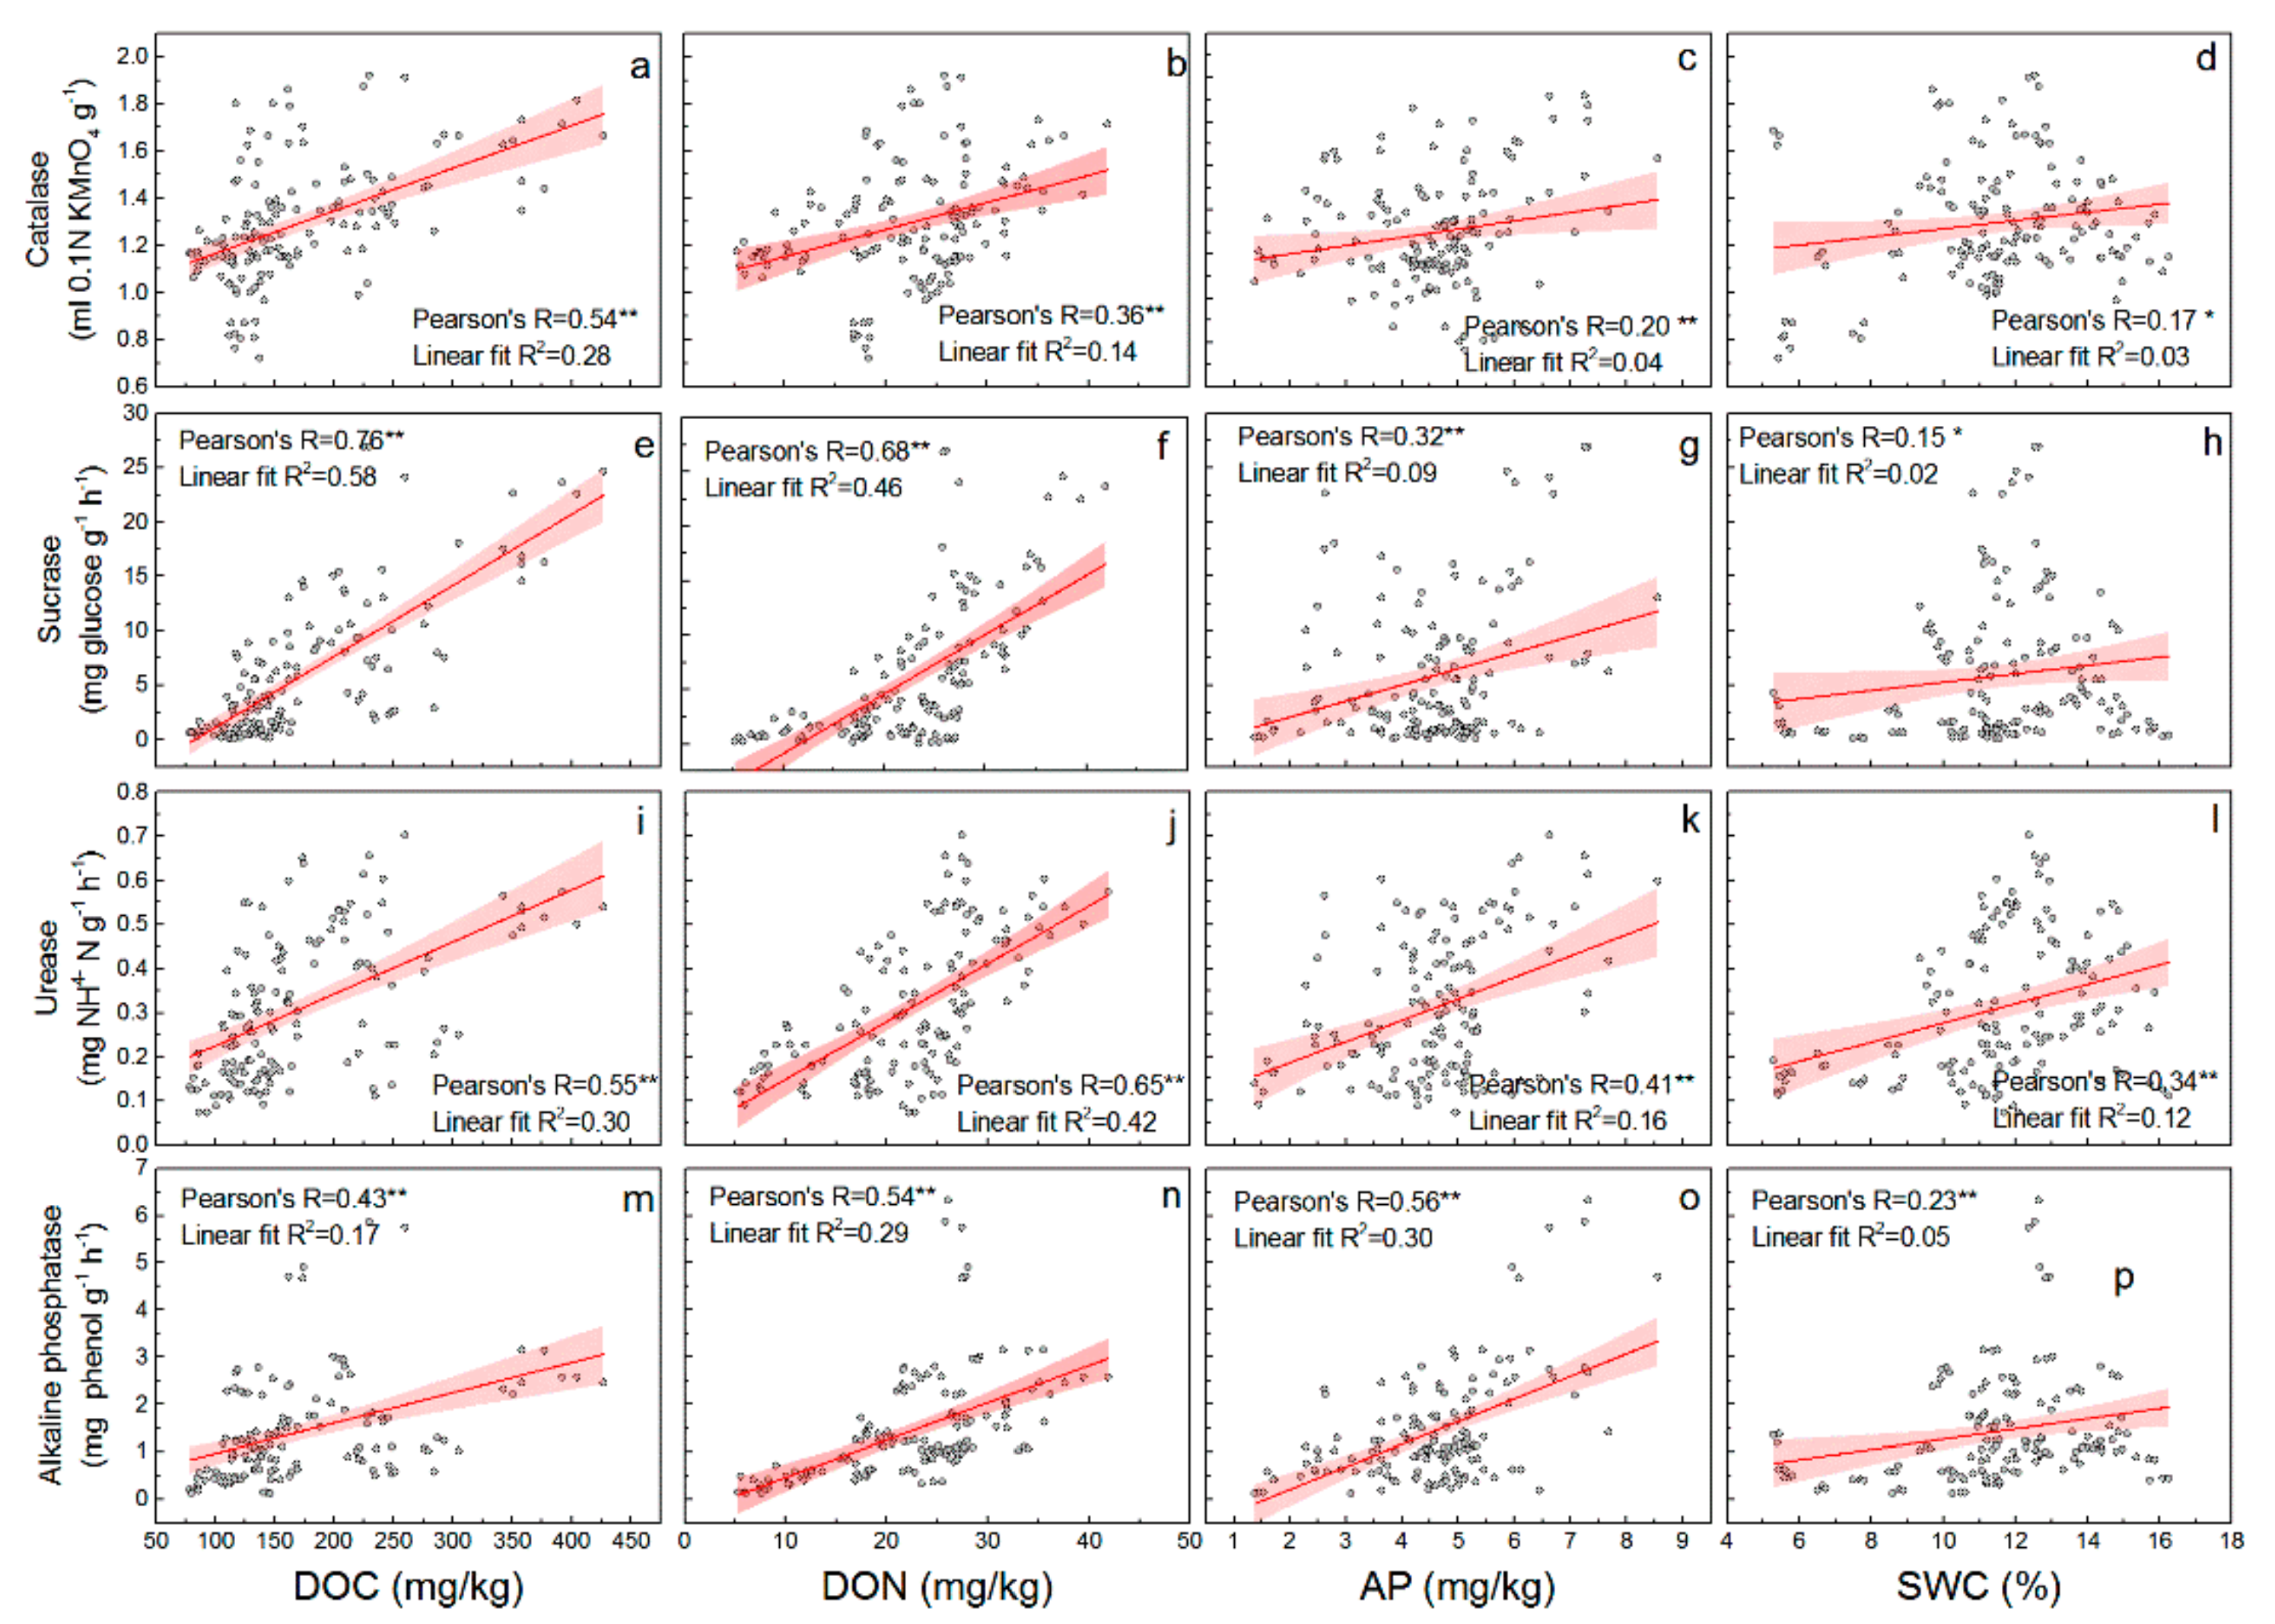
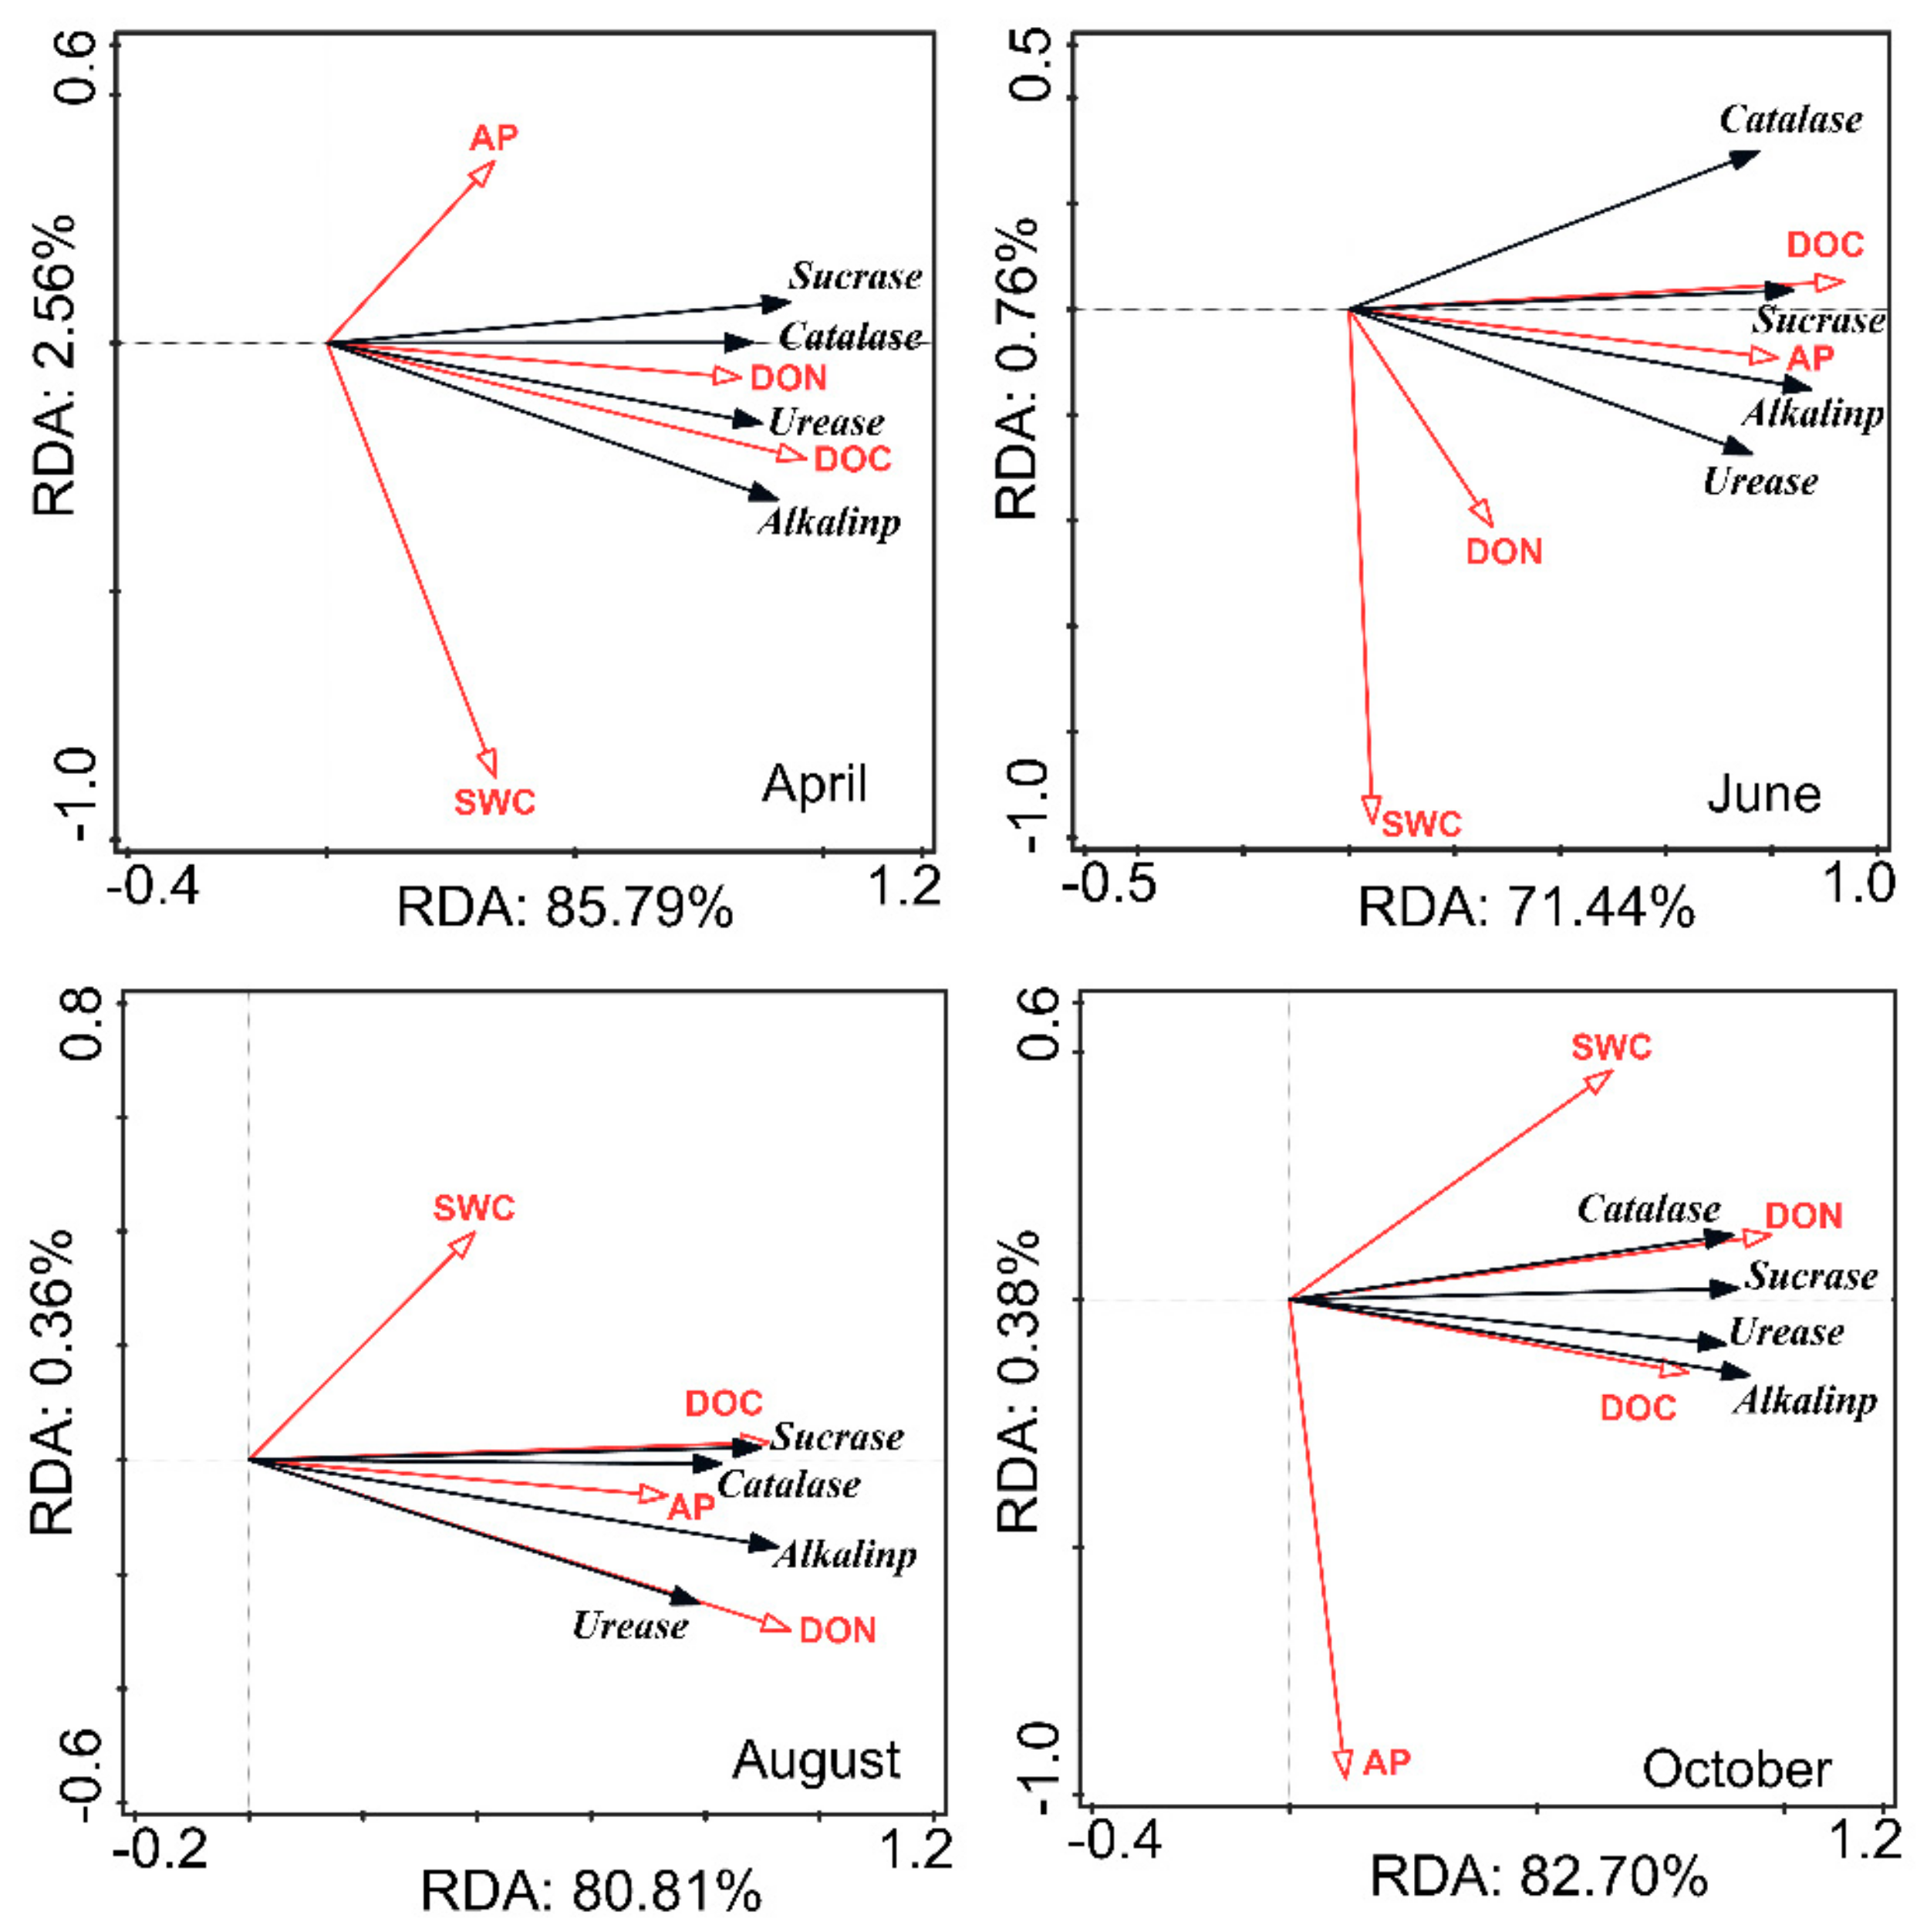
3.3. Relationship between Soil Properties and Soil Enzyme Activities in CK Lands

The Pearson’s correlation coefficients and linear fit results revealed an overall significantly positive correlation between soil enzyme activities and soil properties (p < 0.01, Figure 4). The results showed that soil enzyme activities were largely affected by DOC (Pearson’s R: 0.41–0.76, p < 0.01) and DON (Pearson’s R: 0.44–0.72, p < 0.01). Particularly, soil catalase and sucrose were highly related with DOC and DON, while soil alkaline phosphatase was more closely related with AP; however, SWC showed lower effects.
RDA showed that soil properties were significantly correlated with soil enzyme activities (together explaining more than 70% of the total variation) (Figure 5). Specifically, DOC and DON showed a closer relationship with soil enzyme activities in all seasons; in contrast, AP only showed significantly high effects on soil enzyme activities in the summer (June and August), and SWC showed a minimal relationship in all seasons. These results were also confirmed by the correlation analysis between soil enzyme activities and soil properties for each season (Table S3).

4. Discussion

Afforestation has great impacts on soil microbial activity and biodiversity; therefore, afforestation can alter the processes of soil extracellular enzyme activity and metabolism [15,28]. We also detected a significant relationship between soil enzyme activities and soil microbial carbon biomass following afforestation (Figure S1), which is likely because soil microbes can produce extracellular enzymes to degrade organic matter [29,30]; this suggests that the differential responses of soil enzyme activities following afforestation were dependent on soil microbial biomass. In addition, the above plant community may also drive the differential responses of soil enzymes to afforestation (Table 1) since enhanced plant productivity can be induced by afforestation and would transport more photosynthetically fixed C inputs belowground; this leads to increased root exudates and root biomass, which could affect a large number of microbial functions and ultimately affect soil enzyme activities [12,31]. This is in consistent with Feng et al.‘s study that soil enzyme activities were augmented in response to biomass inputs from aboveground litterfall and fine root in ecological restoration land [32]. For the specific enzymes, soil alkaline phosphatase and sucrase were more sensitive to afforestation than were the other two enzymes. The higher alkaline phosphatase was attributed to the depletion of available P (and/or inorganic P), and the sucrase activity possibly regulated the dissolved carbon [33]. Furthermore, since the surface soil layer experienced more nutrient return and better soil aeration after afforestation [34,35], as well as direct disturbances from the environment on the top layer [36], the soil enzyme responses were vertically stratified with soil depth. Altogether, these results suggested that afforestation changed the ecosystem functions (i.e., aboveground plant diversity and underground microbial diversity); hence, we observed increases in soil enzyme activities.
In addition to land-use change effects, soil enzyme activities also responded differently to temporal variability. The differences in soil conditions, which were caused by succession age and seasonal variation, may have altered the nutrient balance and thus, regulated the different enzyme processes [7,9]. The changes in soil enzyme activities were sensitive to the external environment, especially to temporal variation. For example, Criquet et al. [37] has reported the significant annual variation of endoglucanase and β-glycosidase activities in evergreen oak; the research of Yongmei et al. [38] also revealed changes in soil enzyme activities in spruce forests at different stages of restoration. Additionally, the temporal variation in soil enzyme activities and microbial function were also dependent on climatic factors [9] and plant growth [39].
Soil enzyme activities responded differently to temporal variation and were higher in June or August, which corresponds to the temperature in the research area (Figure 3 and Figure S2). This indicated that temperature may partially explain the temporal variability in soil enzyme activities. It is possible that temperature greatly affected soil enzyme activities by altering the activity of soil microbes and the decomposition of organic matter [8]; thus, it was not surprising that soil enzyme activities increased in response to higher temperatures, as was also suggested by previous studies [11,15]. In contrast, the alkaline phosphatase and sucrase activities were more sensitive to temporal variation than were the other two enzymes. This may be caused by the great demand of available P and dissolved carbon by plants and microbes after afforestation, thereby causing the changes in alkaline phosphatase and sucrase activities [15,33]. These results revealed that afforestation dynamically influenced the ecosystem nutrient circulation process, and in addition, suggested that studies of soil enzyme activities should mind the sampling time, since sampling in different seasons may get different results.
The soil properties also determined the soil enzyme activities under temporal variation, particularly for soil dissolved organic matter (DOM, mainly referred to as DOC and DON) (Figure 4). This has also been reported in previous field manipulation experiments [40] and in consistent with our previous study [41]. The DOM will stimulate the plants and soil microbes to release more enzymes that promote the decomposition process and eventually lead to the temporal variation in soil enzyme activities [7,42]. Conversely, the enzymatic reactions can catalyze the process of organic matter releasing soil nutrients and thus can affect nutrient availability. For example, soil enzymes can promote the degrading of complex insoluble polymers (e.g., proteins, nucleic acids, and chitin), and in turn enhance the release of DON from organic residuals [5]. Furthermore, among these four enzyme activities, the activities of sucrase and urease showed the strongest relationship with DOC and DON, respectively. One possible explanation is that the sucrase and urease were pivotal in the decomposition of soil organic matter and the transformation of soil C and N after afforestation; similar results were reported in previous studies [12,15], indicating that there is a strong temporal correlation between soil enzymes and soil properties. The relationship between soil enzyme activities and SWC varied in different seasons. Our results showed that there was no significant correlation between SWC and soil enzyme activity in summer (June and August), but there was significant correlation between SWC and most of the soil enzyme activity in April and October. We suppose that this may be due to low precipitation in winter (especially in October) resulting in soil water contents becoming a limiting factor for soil microbial activities, and the high precipitation in summer (60% of the precipitation occurs in the summer) resulting in less restriction of soil water on soil microbial activities, thus leading to weak correlation between soil enzyme activity and SWC throughout the year, and this has also been observed in our previous study in different forest lands [15]. Therefore, these results provide further evidence of temporal variation in soil enzymes, and this change is tightly coupled with soil properties, especially DOM. The close relationship between soil enzyme activities and other soil properties suggesting that soil enzyme activities can be used to discriminate how management effects may also affect soil properties.

5. Conclusions

Our research concluded that the activities of catalase, sucrase, urease, and alkaline phosphatase in afforestation land soil were jointly driven by temporal variation and land-use change in the LPC. Particularly, soil enzyme activities varied with plant growing season and stand ages due to microbial biomass and soil properties. The alkaline phosphatase and sucrase were more sensitive to temporal variation and land-use change than the other two enzymes. Moreover, in terms of temporal effects, soil enzyme activities showed close relationships with soil properties, particularly for DOC and DON, suggesting that the soil enzyme activities can be considered as indicators for temporal variation in soil fertility after afforestation in the LPC. This may have practical significance for forest land managers, especially for their fertilization management of plantation in different season and different stand ages, and may further improve the restored ecosystem sustainability.

Supplementary Materials

The following are available online at https://www.mdpi.com/2076-3417/9/15/3129/s1, Figure S1: Linear fitting and Pearson’s correlation coefficients (Pearson’s R) between soil enzyme activities and soil microbial biomass carbon (MBC); Figure S2: The average temperature and precipitation in the research area in sampling year (2014); Table S1: ANOVA of available nutrients and water content; Table S2: ANOVA of soil enzyme activities; Table S3: Correlation analysis of soil enzyme activities and soil properties for each season.

Author Contributions

Conceptualization, J.D., C.R. and F.Z.; data curation, X.Z.; formal analysis, Y.C. and F.Z.; funding acquisition, G.Y.; investigation, Y.C., F.Z. and X.Z.; methodology, J.D. and Y.C.; software, D.Z.; supervision, X.H. and G.Y.; writing—original draft, J.D. and C.R.; writing—review and editing, D.Z., C.R., X.Z., X.H. and G.Y.

Funding

This research was funded by Young Talent fund of University Association for Science and Technology in Shaanxi (2018); the Natural Science Basic Research Program of Shaanxi Province, China (2018JQ3041); Scientific Research Program Funded by Shaanxi Provincial Education Department (18JK0871), and Undergraduate students Innovation and entrepreneurship Training Program of Shaanxi Province (201910719003).

Conflicts of Interest

The authors declare no conflicts of interest. The founding sponsors had no role in the design of the study; in the collection, analyses, or interpretation of data; in the writing of the manuscript, and in the decision to publish the results.

References

  1. Laganière, J.; Angers, D.A.; Paré, D. Carbon accumulation in agricultural soils after afforestation: A meta-analysis. Glob. Chang. Biol. 2010, 16, 439–453. [Google Scholar] [CrossRef]
  2. Kou, M.; Garcia-Fayos, P.; Hu, S.; Jiao, J. The effect of Robinia pseudoacacia afforestation on soil and vegetation properties in the Loess Plateau (China): A chronosequence approach. For. Ecol. Manag. 2016, 375, 146–158. [Google Scholar] [CrossRef]
  3. Falcão, J.C.F.; Dáttilo, W.; Izzo, T.J. Efficiency of different planted forests in recovering biodiversity and ecological interactions in Brazilian Amazon. For. Ecol. Manag. 2015, 339, 105–111. [Google Scholar] [CrossRef]
  4. Ren, C.; Zhao, F.; Kang, D.; Yang, G.; Han, X.; Tong, X.; Feng, Y.; Ren, G. Linkages of C:N:P stoichiometry and bacterial community in soil following afforestation of former farmland. For. Ecol. Manag. 2016, 376, 59–66. [Google Scholar] [CrossRef]
  5. Caldwell, B.A. Enzyme activities as a component of soil biodiversity: A review. Pedobiologia 2005, 49, 637–644. [Google Scholar] [CrossRef]
  6. Gispert, M.; Emran, M.; Pardini, G.; Doni, S.; Ceccanti, B. The impact of land management and abandonment on soil enzymatic activity, glomalin content and aggregate stability. Geoderma 2013, 202, 51–61. [Google Scholar] [CrossRef]
  7. Burns, R.G.; DeForest, J.L.; Marxsen, J.; Sinsabaugh, R.L.; Stromberger, M.E.; Wallenstein, M.D.; Weintraub, M.N.; Zoppini, A. Soil enzymes in a changing environment: Current knowledge and future directions. Soil Biol. Biochem. 2013, 58, 216–234. [Google Scholar] [CrossRef]
  8. Wallenstein, M.D.; Mcmahon, S.K.; Schimel, J.P. Seasonal variation in enzyme activities and temperature sensitivities in Arctic tundra soils. Glob. Chang. Biol. 2009, 15, 1631–1639. [Google Scholar] [CrossRef]
  9. Baldrian, P.; Šnajdr, J.; Merhautová, V.; Dobiášová, P.; Cajthaml, T.; Valášková, V. Responses of the extracellular enzyme activities in hardwood forest to soil temperature and seasonality and the potential effects of climate change. Soil Biol. Biochem. 2013, 56, 60–68. [Google Scholar] [CrossRef]
  10. Allison, S.D.; Vitousek, P.M. Responses of extracellular enzymes to simple and complex nutrient inputs. Soil Biol. Biochem. 2005, 37, 937–944. [Google Scholar] [CrossRef]
  11. Stone, M.M.; Weiss, M.S.; Goodale, C.L.; Adams, M.B.; Fernandez, I.J.; German, D.P.; Allison, S.D. Temperature sensitivity of soil enzyme kinetics under N-fertilization in two temperate forests. Glob. Chang. Biol. 2012, 18, 1173–1184. [Google Scholar] [CrossRef]
  12. Adamczyk, B.; Kilpeläinen, P.; Kitunen, V.; Smolander, A. Potential activities of enzymes involved in N, C, P and S cycling in boreal forest soil under different tree species. Pedobiologia 2014, 57, 97–102. [Google Scholar] [CrossRef]
  13. Lauber, C.L.; Ramirez, K.S.; Aanderud, Z.; Lennon, J.; Fierer, N. Temporal variability in soil microbial communities across land-use types. ISME J. 2013, 7, 1641–1650. [Google Scholar] [CrossRef]
  14. Niemi, R.M.; Vepsäläinen, M.; Wallenius, K.; Simpanen, S.; Alakukku, L.; Pietola, L. Temporal and soil depth-related variation in soil enzyme activities and in root growth of red clover (Trifolium pratense) and timothy (Phleum pratense) in the field. Appl. Soil Ecol. 2005, 30, 113–125. [Google Scholar] [CrossRef]
  15. Ren, C.; Kang, D.; Wu, J.P.; Zhao, F.; Yang, G.; Han, X.; Feng, Y.; Ren, G. Temporal variation in soil enzyme activities after afforestation in the Loess Plateau, China. Geoderma 2016, 282, 103–111. [Google Scholar] [CrossRef]
  16. Dick, R.P. Soil enzyme activities as indicators of soil quality. Soil Sci. Soc. Am. J. 1994, 58, 107–124. [Google Scholar]
  17. Zhang, C.; Xue, S.; Liu, G.-B.; Song, Z.-L. A comparison of soil qualities of different revegetation types in the Loess Plateau, China. Plant Soil 2011, 347, 163–178. [Google Scholar] [CrossRef]
  18. Fu, B.; Chen, L.; Ma, K.; Zhou, H.; Wang, J. The relationships between land use and soil conditions in the hilly area of the loess plateau in northern Shaanxi, China. Catena 2000, 39, 69–78. [Google Scholar] [CrossRef]
  19. Liu, G.; Shangguan, Z.; Yao, W.; Yang, Q.; Zhao, M.; Dang, X.; Guo, M.; Wang, H.; Wang, B. Ecological Effects of Soil Conservation in Loess Plateau. Bull. Chin. Acad. Sci. 2017, 32, 11–19. [Google Scholar]
  20. Deng, J.; Sun, P.; Zhao, F.; Han, X.; Yang, G.; Feng, Y.; Ren, G. Soil C, N, P and Its Stratification Ratio Affected by Artificial Vegetation in Subsoil, Loess Plateau China. PLoS ONE 2016, 11, e0151446. [Google Scholar] [CrossRef]
  21. Zhao, F.; Kang, D.; Han, X.; Yang, G.; Feng, Y.; Ren, G. Soil stoichiometry and carbon storage in long-term afforestation soil affected by understory vegetation diversity. Ecol. Eng. 2015, 74, 415–422. [Google Scholar] [CrossRef]
  22. Lai, Z.; Zhang, Y.; Liu, J.; Wu, B.; Qin, S.; Fa, K. Fine-root distribution, production, decomposition, and effect on soil organic carbon of three revegetation shrub species in northwest China. For. Ecol. Manag. 2016, 359, 381–388. [Google Scholar] [CrossRef]
  23. Li, X.-Y.; Gao, S.-Y.; Xu, H.-Y.; Liu, L.-Y. Growth of Caragana korshinskii using runoff-collecting microcatchments under semiarid condition. J. Hydrol. 2006, 328, 338–346. [Google Scholar] [CrossRef]
  24. Zhang, Z.; Li, X.; Liu, L.; Jia, R.; Zhang, J.; Wang, T. Distribution, biomass, and dynamics of roots in a revegetated stand of Caragana korshinskii in the Tengger Desert, northwestern China. J. Plant Res. 2009, 122, 109–119. [Google Scholar] [CrossRef]
  25. Liu, G. Soil conservation and sustainable agriculture on the Loess Plateau: Challenges and prospects. Ambio 1999, 28, 663–668. [Google Scholar]
  26. Bao, S. Soil and Agricultural Chemistry Analysis; China Agriculture Press: Beijing, China, 2000. [Google Scholar]
  27. Clarke, K.R. Non-parametric multivariate analyses of changes in community structure. Austral Ecol. 1993, 18, 117–143. [Google Scholar] [CrossRef]
  28. Liu, J.; Li, S.; Ouyang, Z.; Tam, C.; Chen, X. Ecological and socioeconomic effects of China’s policies for ecosystem services. Proc. Natl. Acad. Sci. USA 2008, 105, 9477–9482. [Google Scholar] [CrossRef]
  29. Schimel, J.P.; Bennett, J. Nitrogen mineralization: Challenges of a changing paradigm. Ecology 2004, 85, 591–602. [Google Scholar] [CrossRef]
  30. Van Der Heijden, M.G.A.; Bardgett, R.D.; Van Straalen, N.M. The unseen majority: Soil microbes as drivers of plant diversity and productivity in terrestrial ecosystems. Ecol. Lett. 2008, 11, 296–310. [Google Scholar] [CrossRef]
  31. Meier, C.L.; Bowman, W.D. Links between plant litter chemistry, species diversity, and below-ground ecosystem function. Proc. Natl. Acad. Sci. USA 2008, 105, 19780–19785. [Google Scholar] [CrossRef] [Green Version]
  32. Feng, C.; Ma, Y.; Jin, X.; Wang, Z.; Ma, Y.; Fu, S.; Chen, H.Y.H. Soil enzyme activities increase following restoration of degraded subtropical forests. Geoderma 2019, 351, 180–187. [Google Scholar] [CrossRef]
  33. Garcia, C.; Roldan, A.; Hernandez, T. Ability of different plant species to promote microbiological processes in semiarid soil. Geoderma 2005, 124, 193–202. [Google Scholar] [CrossRef]
  34. Cao, C.; Jiang, S.; Ying, Z.; Zhang, F.; Han, X. Spatial variability of soil nutrients and microbiological properties after the establishment of leguminous shrub Caragana microphylla Lam. plantation on sand dune in the Horqin Sandy Land of Northeast China. Ecol. Eng. 2011, 37, 1467–1475. [Google Scholar] [CrossRef]
  35. Sardans, J.; Peñuelas, J. Drought decreases soil enzyme activity in a Mediterranean Quercus ilex L. forest. Soil Biol. Biochem. 2005, 37, 455–461. [Google Scholar] [CrossRef]
  36. Xu, X.; Liu, W.; Kiely, G. Modeling the change in soil organic carbon of grassland in response to climate change: Effects of measured versus modelled carbon pools for initializing the Rothamsted Carbon model. Agric. Ecosyst. Environ. 2011, 140, 372–381. [Google Scholar] [CrossRef]
  37. Criquet, S.; Tagger, S.; Vogt, G.; Petit, J.L. Endoglucanase and β-glycosidase activities in an evergreen oak litter: Annual variation and regulating factors. Soil Biol. Biochem. 2002, 34, 1111–1120. [Google Scholar] [CrossRef]
  38. Zhang, Y.; Bao, W.; Pang, X.; Wu, N.; Zhou, G. Changes of Soil Enzyme Activities in Different Restoration Ages of Spruce Forests on the Eastern Qinghai-Tibet Plateau. Wuhan Univ. J. Nat. Sci. 2005, 10, 701–706. [Google Scholar]
  39. Nannipieri, P.; Giagnoni, L.; Renella, G.; Puglisi, E.; Ceccanti, B.; Masciandaro, G.; Fornasier, F.; Moscatelli, M.C.; Marinari, S. Soil enzymology: Classical and molecular approaches. Biol. Fertil. Soils 2012, 48, 743–762. [Google Scholar] [CrossRef]
  40. Xiao, W.; Chen, X.; Jing, X.; Zhu, B. A meta-analysis of soil extracellular enzyme activities in response to global change. Soil Biol. Biochem. 2018, 123, 21–32. [Google Scholar] [CrossRef]
  41. Zhang, W.; Xu, Y.; Gao, D.; Wang, X.; Liu, W.; Deng, J.; Han, X.; Yang, G.; Feng, Y.; Ren, G. Ecoenzymatic stoichiometry and nutrient dynamics along a revegetation chronosequence in the soils of abandoned land and Robinia pseudoacacia plantation on the Loess Plateau, China. Soil Biol. Biochem. 2019, 134, 1–14. [Google Scholar] [CrossRef]
  42. Ajwa, H.A.; Dell, C.J.; Rice, C.W. Changes in enzyme activities and microbial biomass of tallgrass prairie soil as related to burning and nitrogen fertilization. Soil Biol. Biochem. 1999, 31, 769–777. [Google Scholar] [CrossRef]
Figure 1. Location of the study area and experimental design.
Applsci 09 03129 g001
Figure 2. Soil dissolved organic carbon (DOC, a1–a4), dissolved organic nitrogen (DON, b1–b4), available phosphorus (AP, c1–c4), and water content (SWC, d1–d4) in different soil layers (0–10, 10–20, and 20–30 cm) under different land-use types in four months. Each bar has nine replicates (three sample lands × three replicate plots). The error bar is the standard error. CK40, CK30, CK20, and SC represent 40-, 30-, and 20-year old Caragana korshinskii Kom. lands and slope cropland, respectively. The detailed ANOVA results of the significant effects of the different treatments on the soil properties are shown in Table S1.
Applsci 09 03129 g002
Figure 3. Soil enzyme activities (catalase, a1–a4; sucrase, b1–b4; urease, c1–c4; and alkaline phosphatase, d1–d4) in different soil layers (0–10, 10–20, and 20–30 cm) under different land-use types in four months. Each bar has nine replicates (three sample lands × three replicate plots). The error bar is the standard error. CK40, CK30, CK20, and SC represent 40-, 30-, and 20-year-old Caragana korshinskii Kom. lands and slope cropland, respectively. The detailed ANOVA results of the significant effects of the different treatments on the soil properties are shown in Table S2.
Applsci 09 03129 g003
Figure 4. Linear fitting and Pearson’s correlation coefficients (Pearson’s R) between soil properties and soil enzyme activities across all treatments. For each subfigure, n (144) = four seasons × four land-use types × three soil depths × three replications. The line is the linear fitting line, and the shaded bands delineate the 95% confidence interval of the regressions. ** and * correspond to the statistically significant levels of p < 0.01 and p < 0.05, respectively. DOC, DON, AP, and SWC represent dissolved organic carbon, dissolved organic nitrogen, available phosphorus, and soil water content, respectively.
Applsci 09 03129 g004
Figure 5. The results of redundancy analysis (RDA) to identify the relationships between the soil enzyme activities (black arrows) and soil properties (red arrows) in different months (marked in each part of the figure) across all land-use types and soil depths. For each subfigure, n (36) = four land-use types × three soil depth × three replications. The percentages on the x-axis and y-axis reflect the response rate of the soil properties to the changes in soil enzyme activities in different dimensions. DOC, DON, AP, and SWC represent dissolved organic carbon, dissolved organic nitrogen, available phosphorus, and soil water content, respectively.
Applsci 09 03129 g005
Table 1. Characteristics of the sampling lands.
Sample SitesCK20CK30CK40SC
Location36°52′ N 109°21′ E36°53′ N 109°21′ E36°52′ N 109°21′ E36°52′ N 109°21′ E
Slope aspect (°)18151015
Slope degree (°)NbyW10SbyW60NbyE12SbyW50
Elevation (m)1258126013181263
pH8.30 ± 0.138.41 ± 0.108.33 ± 0.068.48 ± 0.17
SBD (g/cm3)1.04 ± 0.021.12 ± 0.031.15 ± 0.021.17 ± 0.03
SOC (g/kg)3.94 ± 0.463.73 ± 0.412.73 ± 0.241.39 ± 0.22
TN (g/kg)0.49 ± 0.060.46 ± 0.060.44 ± 0.050.19 ± 0.05
TP (g/kg)0.55 ± 0.040.54 ± 0.020.46 ± 0.020.47 ± 0.03
FRB (kg/hm2)1518 ± 47.122448 ± 40.382605 ± 32.74-
LB (kg/hm2)1233 ± 23.65990 ± 8.77719 ± 10.09-
Gleason SR2.17 ± 0.043.22 ± 0.033.50 ± 0.13-
CD (%)71.12 ± 3.8278.22 ± 1.3280.44 ± 2.9640.29 ± 4.05
AGB (kg/hm2)11023 ± 271.2115130 ± 103.1214500 ± 341.21900 ± 23.25
CK and SC represent the Caragana korshinskii Kom and slope cropland. NbyW, SbyW, and NbyE represent North by West, South by West and North by east, respectively. SBD, SOC, TN, TP, FRB, Gleason SR, CD, and AGB represent soil bulk density, soil organic carbon, soil total nitrogen concentration, soil total phosphorus concentration, fine root biomass, litter biomass, species richness, canopy density, and aboveground biomass, respectively. All these indexes were measured in June, and soil properties were measured from the average of 0–20 cm soil layer.
Table 2. ANOVA tables of available nutrients and water content. Factors include years (April, June, August, and October), lands (CK40, CK30, CK15, and SC) and soil depth (0–10, 10–20, and 20–30 cm).
SourceDfSum of SquaresMean SquareF valuePr > F
DOCModel79776313.479826.75130.46<0.0001
Error644820.6675.32
Total143781134.13
DONModel7920312.92257.13108.86<0.0001
Error64151.162.36
Total14320464.08
APModel79224.202.848.52<0.0001
Error6421.320.33
Total143245.52
SWCModel79869.4611.013717.37<0.0001
Error640.190.01
Total143869.65
DOC, DON, AP, and SWC represent soil dissolved organic carbon, dissolved organic nitrogen, available phosphorus, and water content, respectively.
Table 3. ANOVA tables of soil enzyme activities. Factors include years (April, June, August, and October), lands (CK40, CK30, CK15, and SC) and soil depth (0–10, 10–20, and 20–30 cm).
SourceDFSum of SquaresMean SquareF valuePr > F
CatalaseModel798.700.1125.64<0.0001
Error640.270.00
Total1438.97
SucraseModel795645.8971.4749.65<0.0001
Error6492.131.44
Total1435738.02
UreaseModel793.570.0565.90<0.0001
Error640.040.00
Total1433.62
Alkaline phosphataseModel79187.662.38304.84<0.0001
Error640.500.01
Total143188.16
Table 4. The R value from the analysis of similarities (ANOSIM).
EnzymeGrowing SeasonStand AgeDepth
Total0.18 *0.30 **0.28 **
Catalase0.25 **0.58 **0.23 *
Sucrase0.16 *0.40 **0.32 **
Urease0.09 NS0.34 **0.48 **
Alkaline phosphatase0.17 *0.40 **0.32 **
* significant in p < 0.05; ** significant in p < 0.01; NS means no significance.

