Article

Smart Fault-Tolerant Control System Based on Chaos Theory and Extension Theory for Locating Faults in a Three-Level T-Type Inverter

Department of Electrical Engineering, National Chin-Yi University of Technology, No. 57, Sec. 2, Zhongshan Rd., Taiping Dist., Taichung 41170, Taiwan
*
Author to whom correspondence should be addressed.
Appl. Sci. 2019, 9(15), 3071; https://doi.org/10.3390/app9153071
Submission received: 27 March 2019 / Revised: 18 July 2019 / Accepted: 20 July 2019 / Published: 30 July 2019
(This article belongs to the Special Issue Applied Sciences Based on and Related to Computer and Control)

Abstract

:
This study proposes a smart fault-tolerant control system based on the theory of Lorenz chaotic system and extension theory for locating faults and executing tolerant control in a three-level T-type inverter. First, the system constantly monitors the fault states of the 12 power transistor switches of the three-level T-type inverter; if a power transistor fails, the corresponding output phase voltage waveform is converted by a Lorenz chaotic system. Chaos eye coordinates are then extracted from a scatter diagram of chaotic dynamic states and considered as fault characteristics. The system then executes fault diagnosis based on extension theory. The fault characteristic value is used as the input signal for correlation analysis; thus, the faulty power transistor can be located and the fault diagnosis can be achieved for the inverter. The fault-tolerant control system can maintain the three-phase balanced output of the three-level T-type inverter, thereby improving the reliability of the motor drive system. The feasibility of the proposed smart fault-tolerant control system was assessed by conducting simulations in this study, and the results verified its feasibility. Accordingly, after the occurrence of the fault in power switches, the balanced three-phase output line voltage remained unchanged, and the quality of the output voltage was not reduced by using the integration of the proposed fault diagnosis system and fault-tolerant control system for a three-level T-type Inverter.

1. Introduction

Recent advances in renewable energy and electric vehicle technology have prompted the development of multilevel inverters [1,2,3,4,5]. Compared with that of a two-level inverter, the switch of a multilevel inverter is subjected to lower voltage stress and is associated with a lower output voltage change rate (dv/dt). Accordingly, multilevel inverters are suitable for applications requiring high power consumption. Such applications require a relatively high number of power transistors, thus increasing the difficulty of fault detection in inverters. The traditional fault diagnosis procedure for inverters entails the use of information (numeric or waveform) directly measured by instruments. The information is examined by on-site personnel, who subsequently conduct fault diagnosis for the inverters, repair the inverters, and replace components on the basis of their experience. However, this traditional fault diagnosis procedure is prone to erroneous fault point detections, causing unnecessary waste of labor and time for component repair and replacement [6,7,8]. To improve the reliability of equipment using motor drive systems, researchers have invested considerable effort in exploring fault detection mechanisms [9,10,11,12,13,14,15,16,17,18,19] and fault-tolerant control strategies [20,21,22,23] for multilevel inverters in order to enable early fault detection when inverter power semiconductor components fail; this can thus maintain the inverter operation and minimize damage.
Currently, primary techniques for smart fault diagnosis in inverters include model-based methods, expert systems, and machine learning systems. Although model-based methods are useful [9], they require the establishment of various fault-state models in advance. Moreover, such models should consider the values of snubber capacitance and balance resistor in inverters, which are difficult to obtain. The models comprise various parasitic elements that would inevitably require some assumptions and thus impose limitations to the general applicability of the models [10,11]. In addition, expert systems can modify themselves. Nevertheless, the entire systems should still be established by experts; therefore, such systems are associated with relatively high costs [12]. Finally, machine learning systems [13] notably mimic the neural network of the human brain. Through such neural connections, data models can be updated using backpropagation, and hidden layers can reduce the dependence of machine learning algorithms on feature engineering. However, a large body of data is required for neural network learning to make accurate judgments, and the corresponding operating time is long [14,15,16,17]. Therefore, developing new smart fault diagnosis systems with high accuracy, easy implementation, and fast response is imperative. The first author has previously used the extension theory to diagnose the type and number of fault modules in a photovoltaic module array [24]. This method measures the voltages, currents and powers of the photovoltaic module array at each moment, and then accordingly estimates the type and number of faulted modules in the photovoltaic module array. Although its fault diagnosis accuracy is very high, the input of this evaluation method must be a fixed single point value. Therefore, this method is not suitable for fault diagnosis where the input variables are continuous functions or waveforms. Based on this, we must first use another intelligent method like chaos theory to convert the three-phase voltage waveforms obtained in T-type multilevel inverters into equivalent characteristic values (chaos eye coordinates), where the fault diagnosis can be made by the extension theory.
Multilevel inverters exhibit numerous advantages, such as various control modes, relatively low transistor withstand voltage levels, low current harmonics, and high frequency conversion efficiency. Such inverters have been widely used in high-voltage and high-power applications, including high-voltage dc transmission, superconducting energy storage, and motor frequency control. However, applications, such as military equipment, power systems, steel mills, and electric vehicles have particularly high requirements for continuous equipment operation. Consequently, inverter failure during operation would engender severe economic losses and even casualties. Improving inverter system reliability is thus imperative. Fault-tolerant control is among the primary methods for improving inverter system reliability. However, after prolonged use, multilevel inverters may break down because of switch damage induced by overcurrent (or high temperature) operation [18], component aging, and drive circuit failure. Multilevel inverter systems must thus be equipped with fault detection mechanisms and fault-tolerant control capabilities to ensure continued operation in failure events [8,20,21]. The fault-tolerant control strategies proposed in [22,23] showed that the maximum renewable energy capture can be achieved. However, these methods are only applicable to power systems. However, the purpose of the fault-tolerant control system for multilevel inverters is to ensure continued inverter operation in the event of power transistor failure. Therefore, to maintain the three-phase balance of the output voltage of the inverter, the power transistor switching state and the phase angle of the reference voltage in the pulse width modulation (PWM) control mechanism must be modified simultaneously. However, this process would increase the difficulty of designing and controlling the fault tolerance of a multilevel inverter in a failure event. In addition, the maximum output voltage amplitude of current fault-tolerant control systems is only 0.577 times that achieved under normal operation [6].
This study proposes a smart fault-tolerant control system for locating faults in a three-level T-type inverter; the system is based on an artificial intelligence algorithm incorporated with chaos theory [25] and extension theory [26]. First, the output phase voltage waveform observed during an event of power transistor failure is converted according to the dynamic states of Lorenz chaotic system; chaos eye coordinates are extracted from a scatter diagram of chaotic states and used as feature values for fault detection. Extension theory is applied to locate a faulty power transistor. Subsequently, an external backup power transistor (leg) and 3 three-pole ac semiconductor switches (triode AC, TRAIC) are used for fault-tolerant control to maintain the three-phase balanced line voltage output, thereby maintaining the normal voltage amplitude if any power semiconductor switch of the inverter fails. Figure 1 illustrates the overall architecture of the proposed fault-diagnosis and fault-tolerant control system.
This paper is organized as follows. In Section 2, the concepts of Chaos and Extension theory are described in detail, and how to use them for fault diagnosis of a three-level T-type inverter is explained. Then, the simulation is made in Section 3 to demonstrate the effectiveness of the proposed fault diagnosis method based on Chaos and Extension theory. Final, in Section 4, the fault-tolerant control in the event of any power switch failure in the three-level T-type inverter is analyzed, and then the simulation is used to prove its feasibility.

2. Materials and Methods

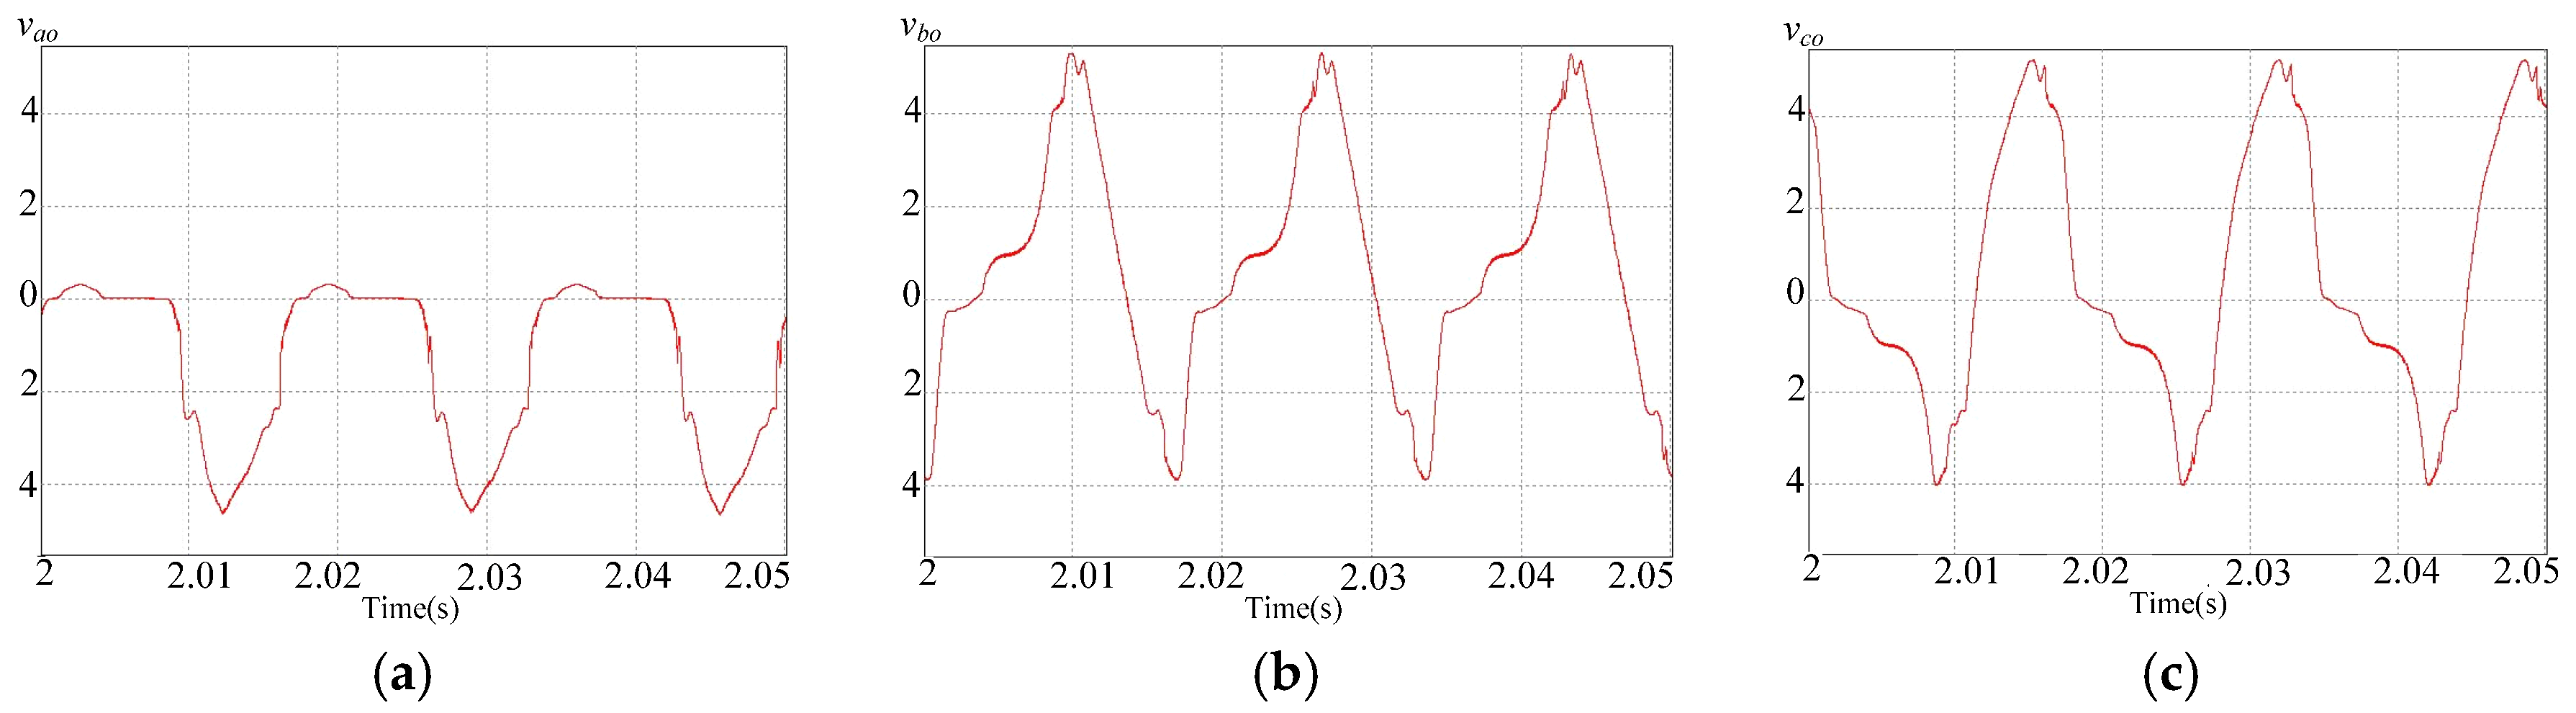
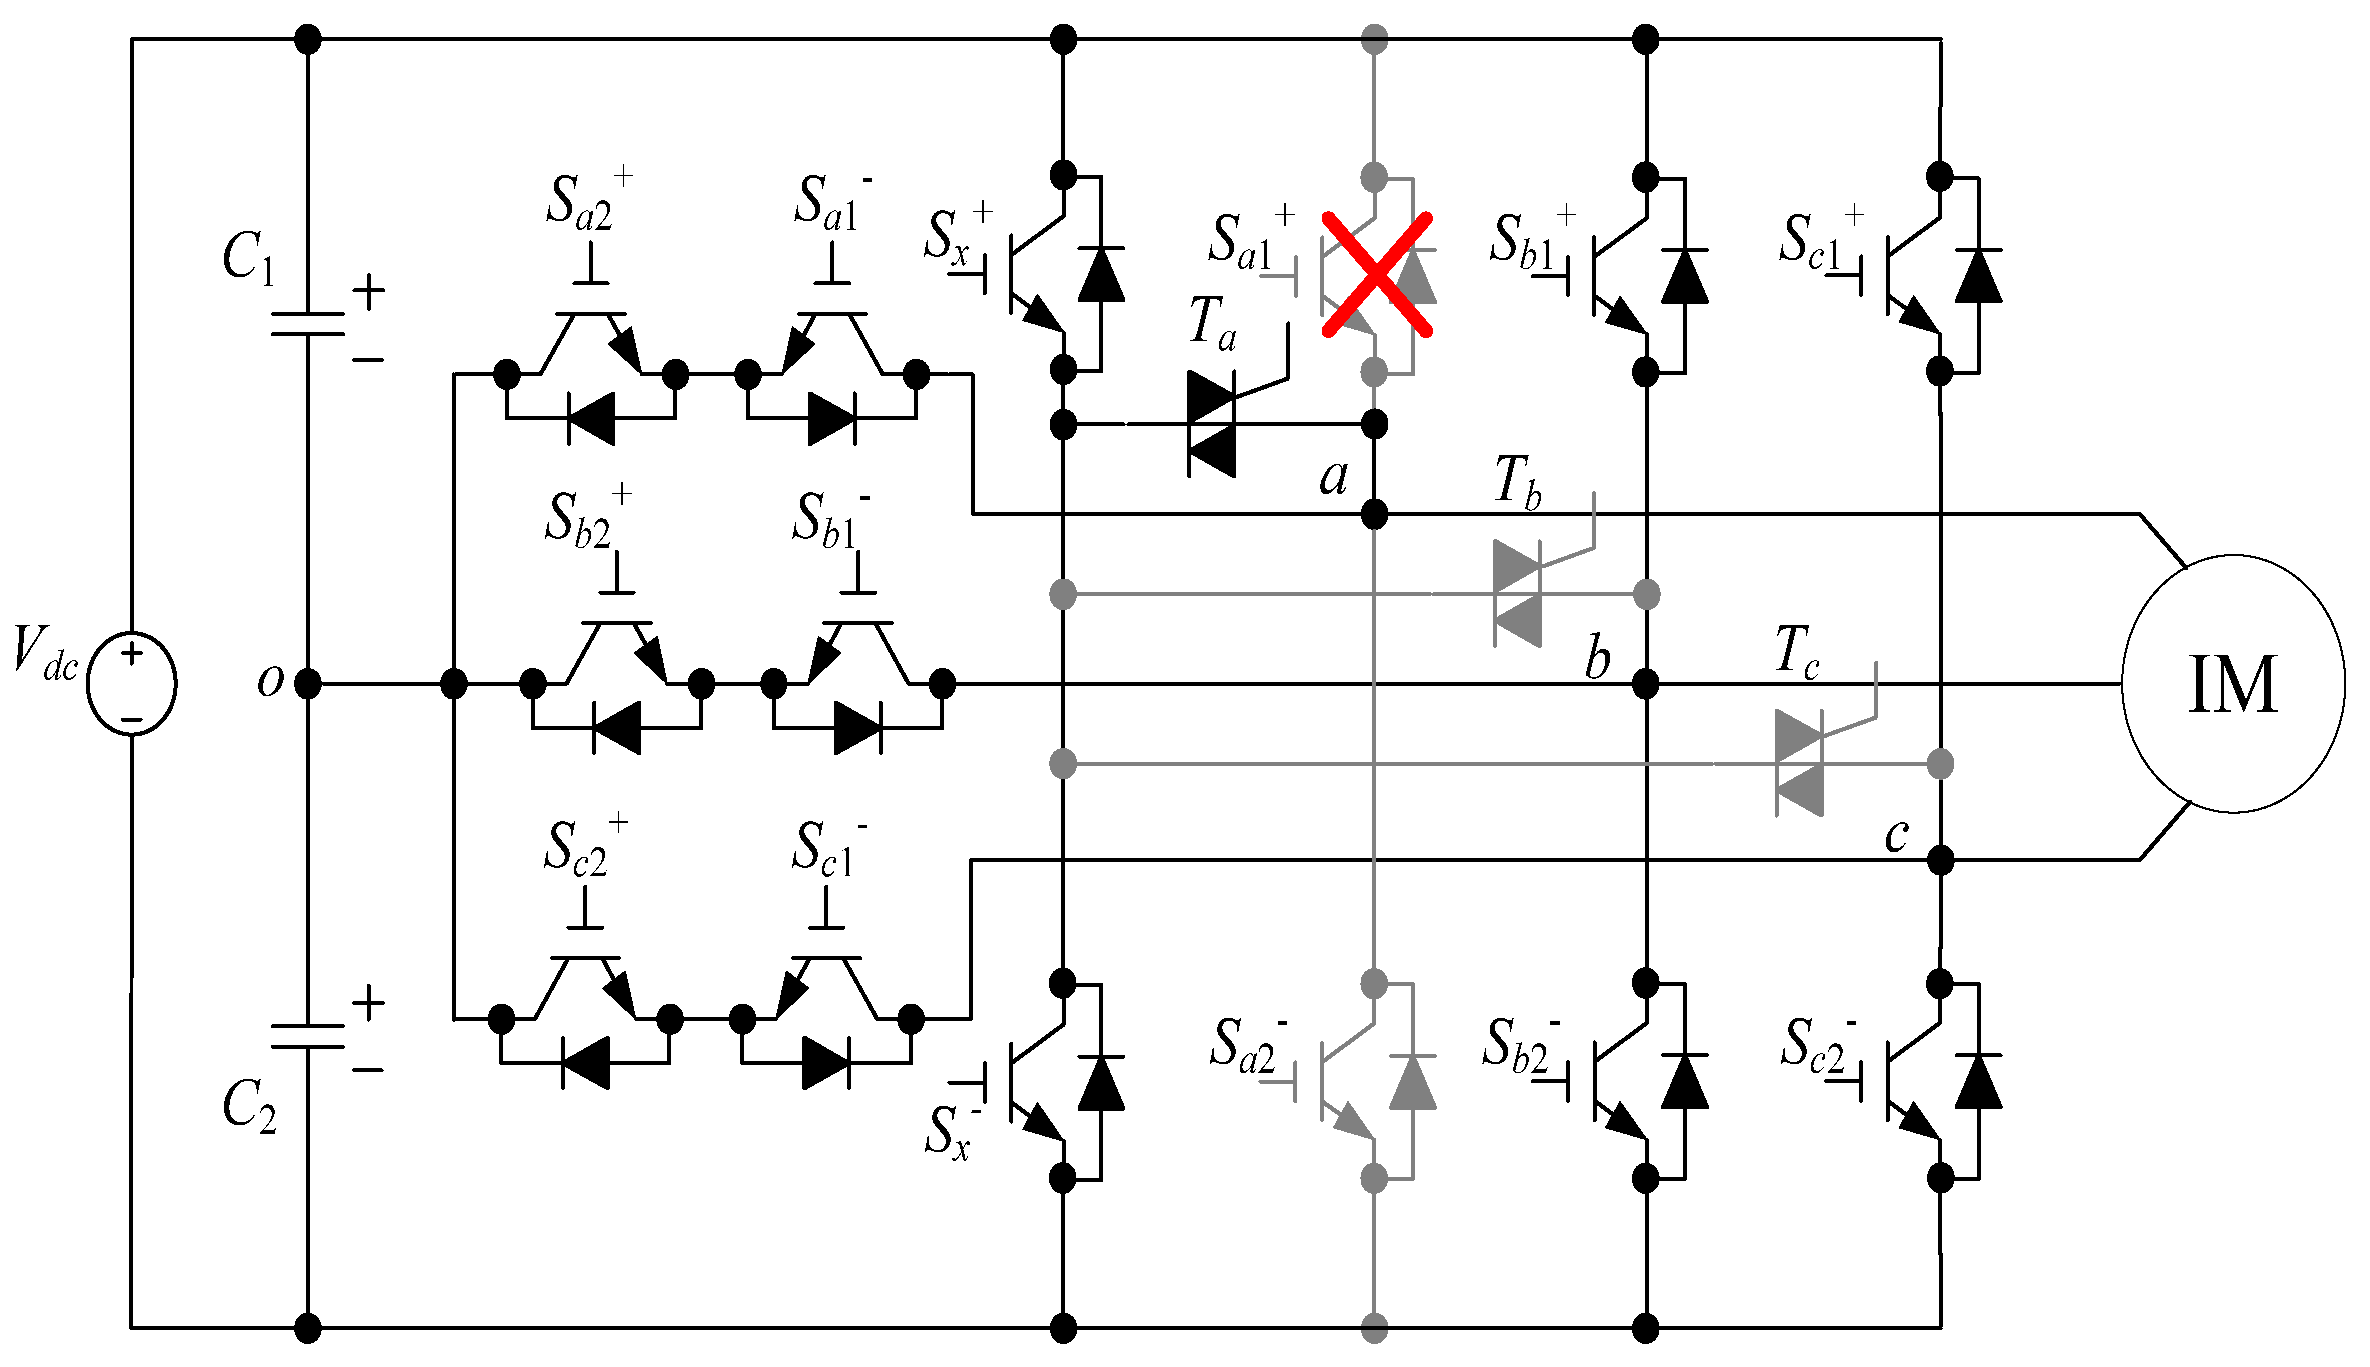
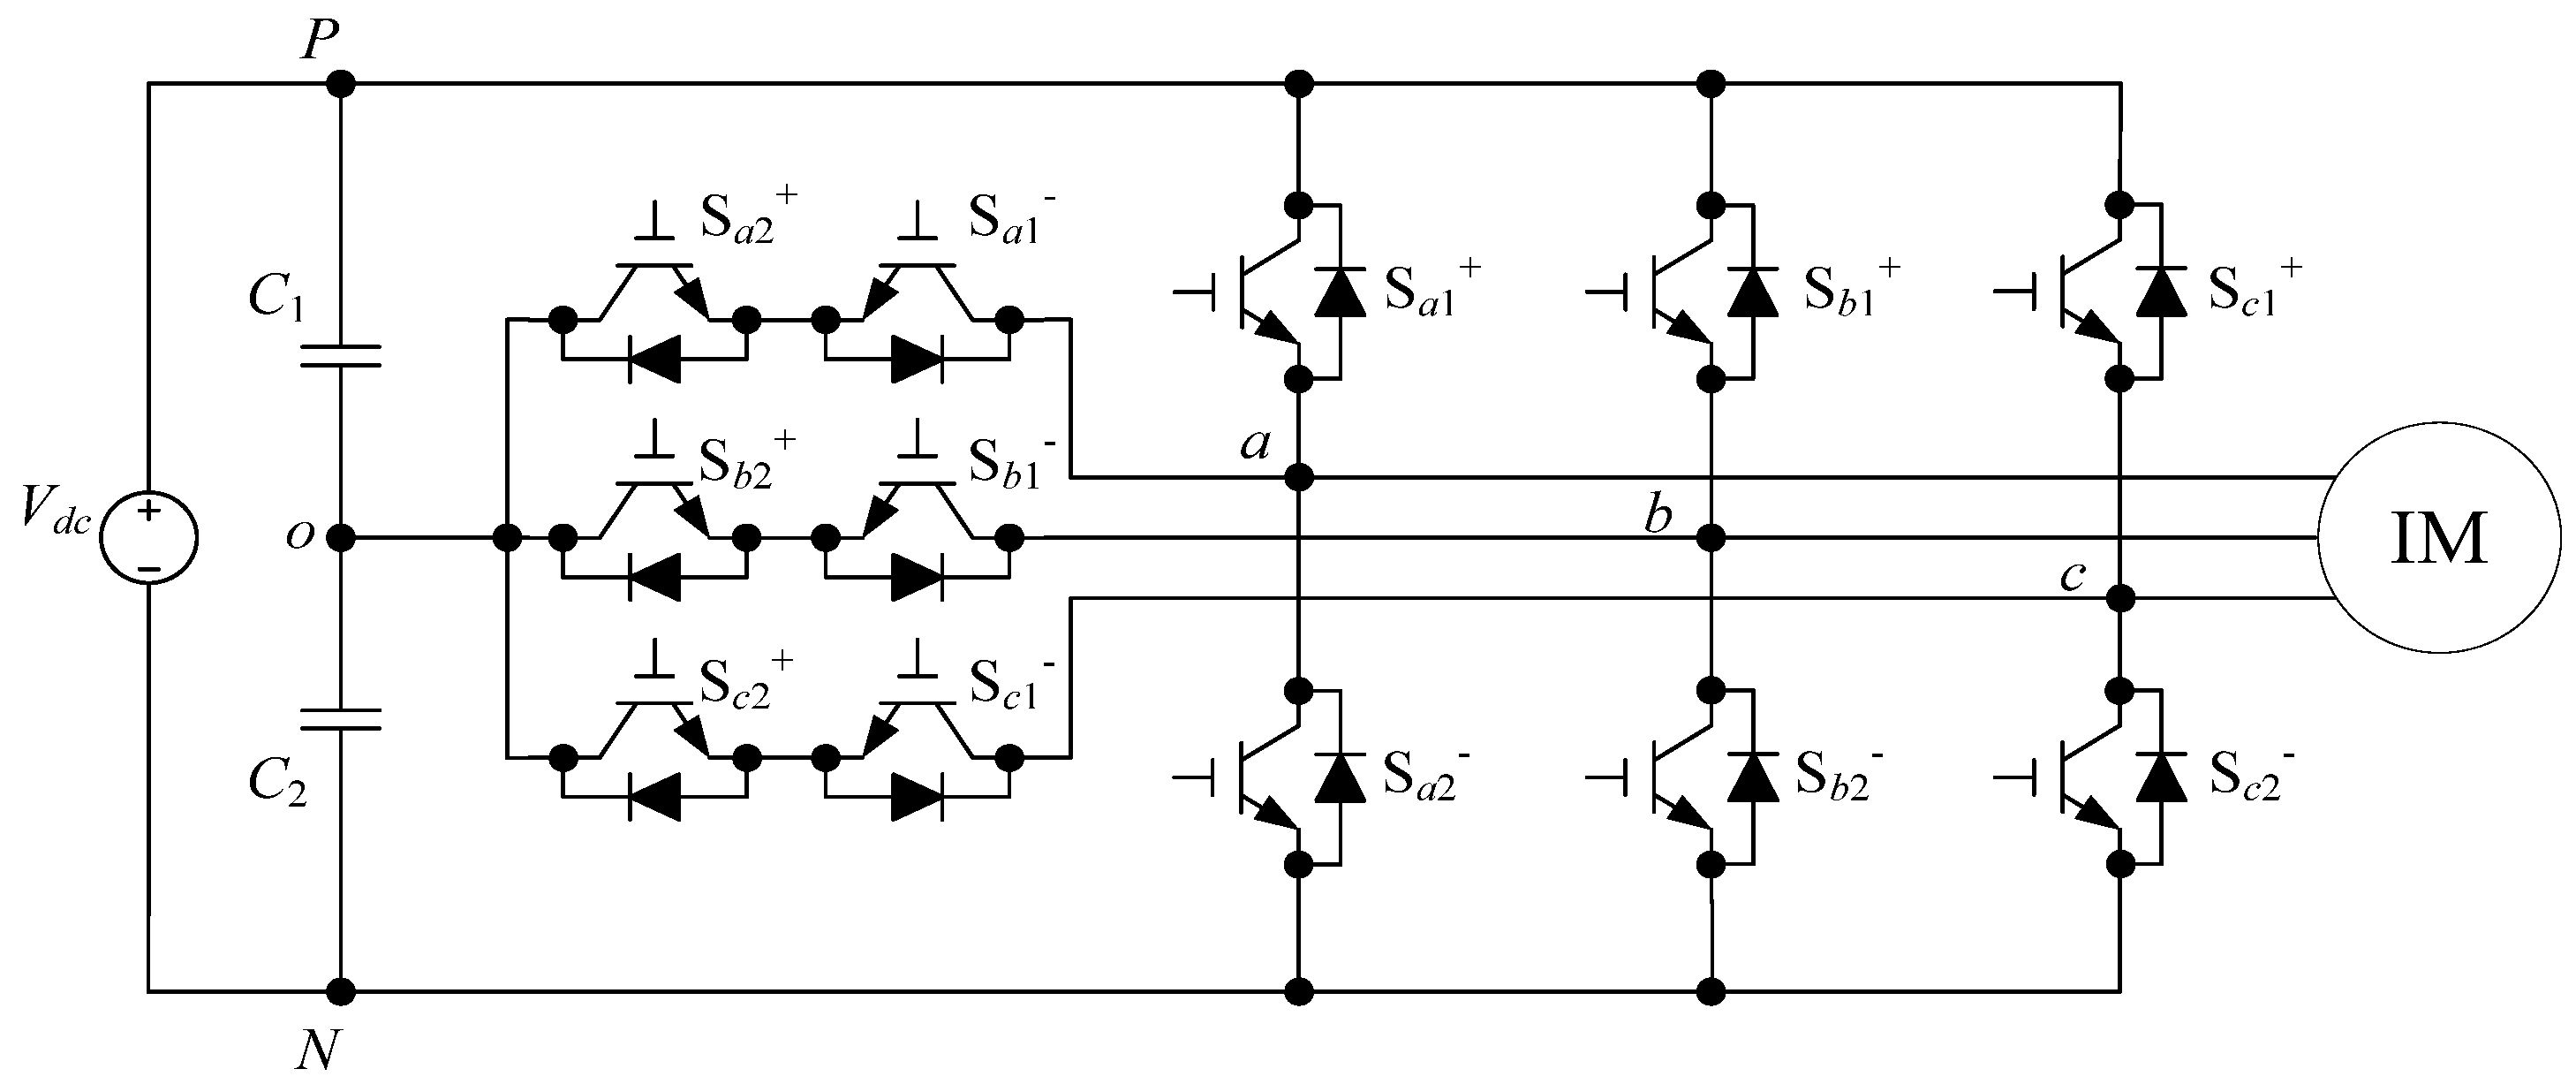
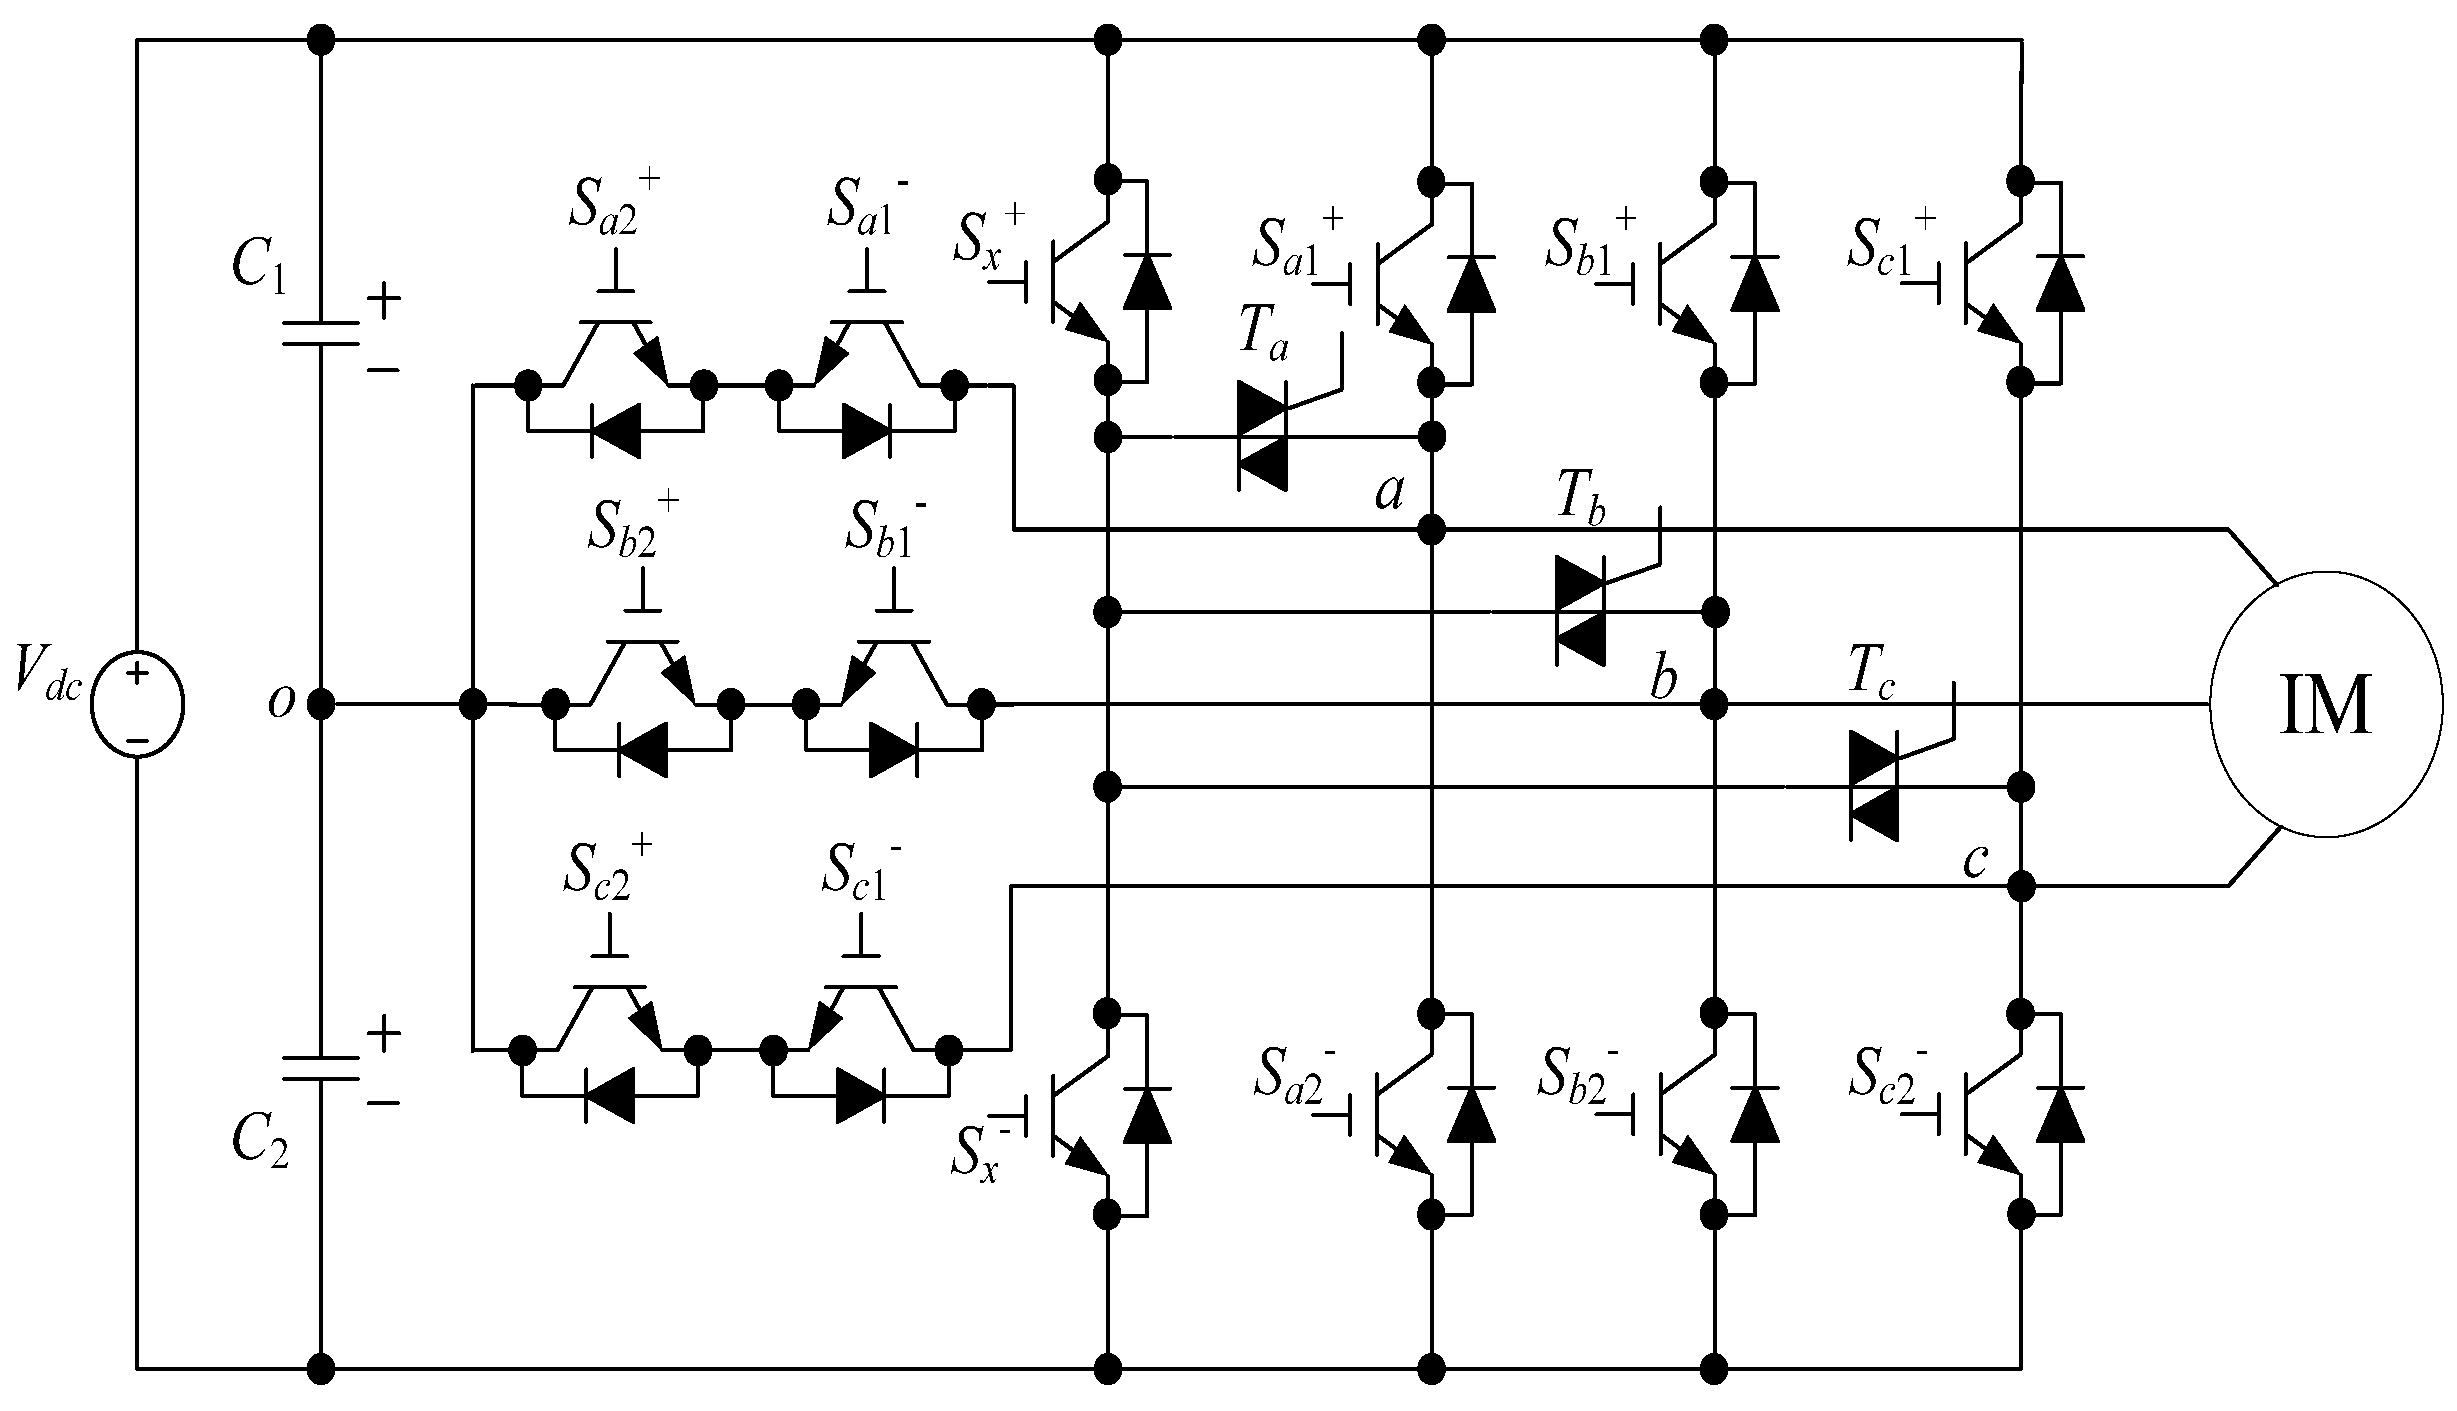
2.1. Fault Characteristics of Three-Level Inverter

To explore inverter fault diagnosis, this study considered a three-level T-type inverter, as shown in Figure 2. The faults of such an inverter can be divided into three types: Short-circuit fault, open-circuit fault, and an erroneous trigger signal. A short-circuit fault occurs when switching elements break down, due to excessive voltages across the switch. Moreover, an open-circuit fault occurs when switches cannot be activated, due to the lack of trigger signals for the power transistor. Finally, an erroneous trigger signal occurs when switching elements receive incorrect trigger signals.
This study established a simulation environment for the three-level T-type inverter by using PSIM software and monitored the failure of the inverter switches constantly. Consider, for example, an output voltage frequency of 60 Hz. The simulated waveform for a normally operating inverter should exhibit a three-phase balanced structure, and the output voltage waveform of each phase is presented in Figure 3. The voltage waveforms of the three phases have the same shape and size, and the phase difference between them is 120°, which is an inherent characteristic of a three-phase balanced structure. This balanced structure would be distorted in the event of inverter switch failure. For example, if the inverter switch Sa1+ fails, the waveform of the a-phase output voltage (vao) is distorted (Figure 4). Similarly, if the inverter switch Sb2 or Sc1+ fails, the waveforms of the phase voltage vbo and vco would substantially differ from those observed under normal inverter switch operation. According to these observations, the output voltage waveform would be distorted when a fault occurs in an inverter.

2.2. Theory of the Lorenz Chaotic System

A Lorenz chaotic system is considered in the proposed system [25], which is presented in Equation (1).
S c s = { x ˙ 1 = α ( x 2 x 1 ) x ˙ 2 = β x 1 x 1 x 3 x 2 x ˙ n = x 1 x 2 γ x 3 } ,
where x represents the initial value of the system and can be used as the input value to be tested. α , β , and γ represent adjustment coefficients.
The three-phase voltage waveforms shown in Figure 3 and Figure 4 are measured with voltage sensors. At the same time, the sampling time is 5 us and 10,000 data have been obtained within 0.05 s and then input into the Lorenz chaotic system in Equation (1). The adjustment coefficients α , β , and γ in Equation (1) are set to 10, 28, and 8/3, respectively. Through the aforementioned Lorenz chaotic system, x ˙ 1 , x ˙ 2 , and x ˙ 3 can be obtained. In the proposed system, x ˙ 1 and x ˙ 2 are used to generate a chaotic states scatter diagram, as illustrated in Figure 5, with the two centroid points in the scatter diagram serving as chaos eyes. The coordinates of the chaos eyes can serve as feature values for inverter fault diagnosis.
For the conditions described in Figure 3 and Figure 4, the corresponding waveforms can be converted through the Lorenz chaotic system to yield the chaotic scatter states diagrams displayed in Figure 6 and Figure 7, respectively. The chaos eye coordinates in Figure 6a are C 1 (−0.0462, −6.0298) and C 2 (0.0464, −7.0853), whereas those in Figure 7a are C 1 (−0.0493, −39.9884) and C 2 (0.0456, −42.5835). After the occurrence of a fault, the Y-axis coordinates of the chaos eye are considerably different from those (vao) observed before the fault; thus, Sa1+ can be suspected to be faulty. The proposed system can consider values of voltage waveforms of equal frequencies as the input for fault detection. After the use of the Lorenz chaotic system to convert the waveforms, the chaos eye coordinates ( C 1 and C 2 ) in the resulting chaotic states scatter diagrams can be considered as the fault characteristic values. However, because of the failure of other transistors, chaos eye coordinates of vao observed before the occurrence of a fault might differ from those observed after the occurrence of the fault. The chaos eye coordinates are not fixed values; instead, they are distributed in a range. Therefore, the extension method is used for fault diagnosis to locate a fault in transistor switches.

2.3. Inverter Fault Diagnosis Based on Extension Theory

In 1983, the Chinese scholar Wen Cai proposed extension theory. The concept is to investigate the extension and contradictions of a matter from qualitative and quantitative perspectives. Matter element theory and extension mathematics constitute the two core components of extension theory. Matter element theory primarily describes the extension and transformation characteristics of matter elements, whereas extension mathematics comprises the core concepts of extension set and correlation function for calculation [26]. Extension theory expresses the information of matter through the matter element model and illustrates the relationship between matter quality and quantity through matter element transformation. Subsequently, the effects of quality and quantity on the matter are investigated using the correlation function to demonstrate the degree of influence of matter characteristics.

2.3.1. Concept of Extension Matter

In extension theory, a matter-element R contains three fundamental elements: matter name (N), matter characteristic (C), and values of matter characteristic (V). The model can be mathematically represented as follows:
R = (N, C, V),
where R is the basic element describing the matter (i.e., the matter element); N, C, and V are three elements that constitute the matter element. N represents the name of the matter, C represents the characteristic of the matter, and V represents the characteristic value of the matter. In extension matter element theory, if the matter element characteristic is not a single item, it is represented by x characteristics and x corresponding characteristic values. Accordingly, the characteristic can be expressed in vector form as C = [c1, c2, …, cx], and the corresponding characteristic value can be expressed as V = [v1, v2, …, vx]. Therefore, Equation (2) can be rewritten as follows.
R = [ R 1 R 2 R x ] = [ N , c 1 v 1 c 2 v 2 c x v x ] .
If the characteristic value is in a certain interval, the interval is defined as a classical domain and is included in a neighborhood domain. Assume the following intervals: F0 = <a, b>, F = <d, e>, and F 0 F ; point f is any point in the interval F. Therefore, the matter element corresponding to F0 = <a, b> can be expressed as follows:
R 0 = ( F 0 , C i , V i ) = [ F 0 , c 1 , < a 1   , b 1 > c 2 , < a 2   , b 2 > c x , < a x   , b x > ] ,
where Ci is the characteristic of F 0 , and Vi is the characteristic value of Ci (i.e., its classical domain). The matter element RF corresponding to F is presented in Equation (5), where Cj is the characteristic value of F and Vj is the characteristic value of Cj (i.e., its neighborhood domain).
R F = ( F , C j , V j ) = [ F , c 1 , < d 1   , e 1 > c 2 , < d 2   , e 2 > c x , < d x   , e x > ] .

2.3.2. Distance and Position Value

Classical mathematics explores the distance relationship between points, and extension theory describes the relationship between a point and an interval in the real domain, as expressed in the following equation:
Φ ( f , F 0 ) = | f v a + v b 2 | v b v a 2 .
In addition to considering the relationship between a point and an interval, the relationship between a point and two intervals or between intervals should be considered. Therefore, if F0 = <va, vb> and F = <vd, ve> are assumed to constitute two intervals in the real domain, and F0 is in F, the position values of point f, F0, and F can be expressed as follows:
D ( f , F 0 , F ) = { Φ ( f , F ) Φ ( f , F 0 ) , f F 0 1 , f F 0 .

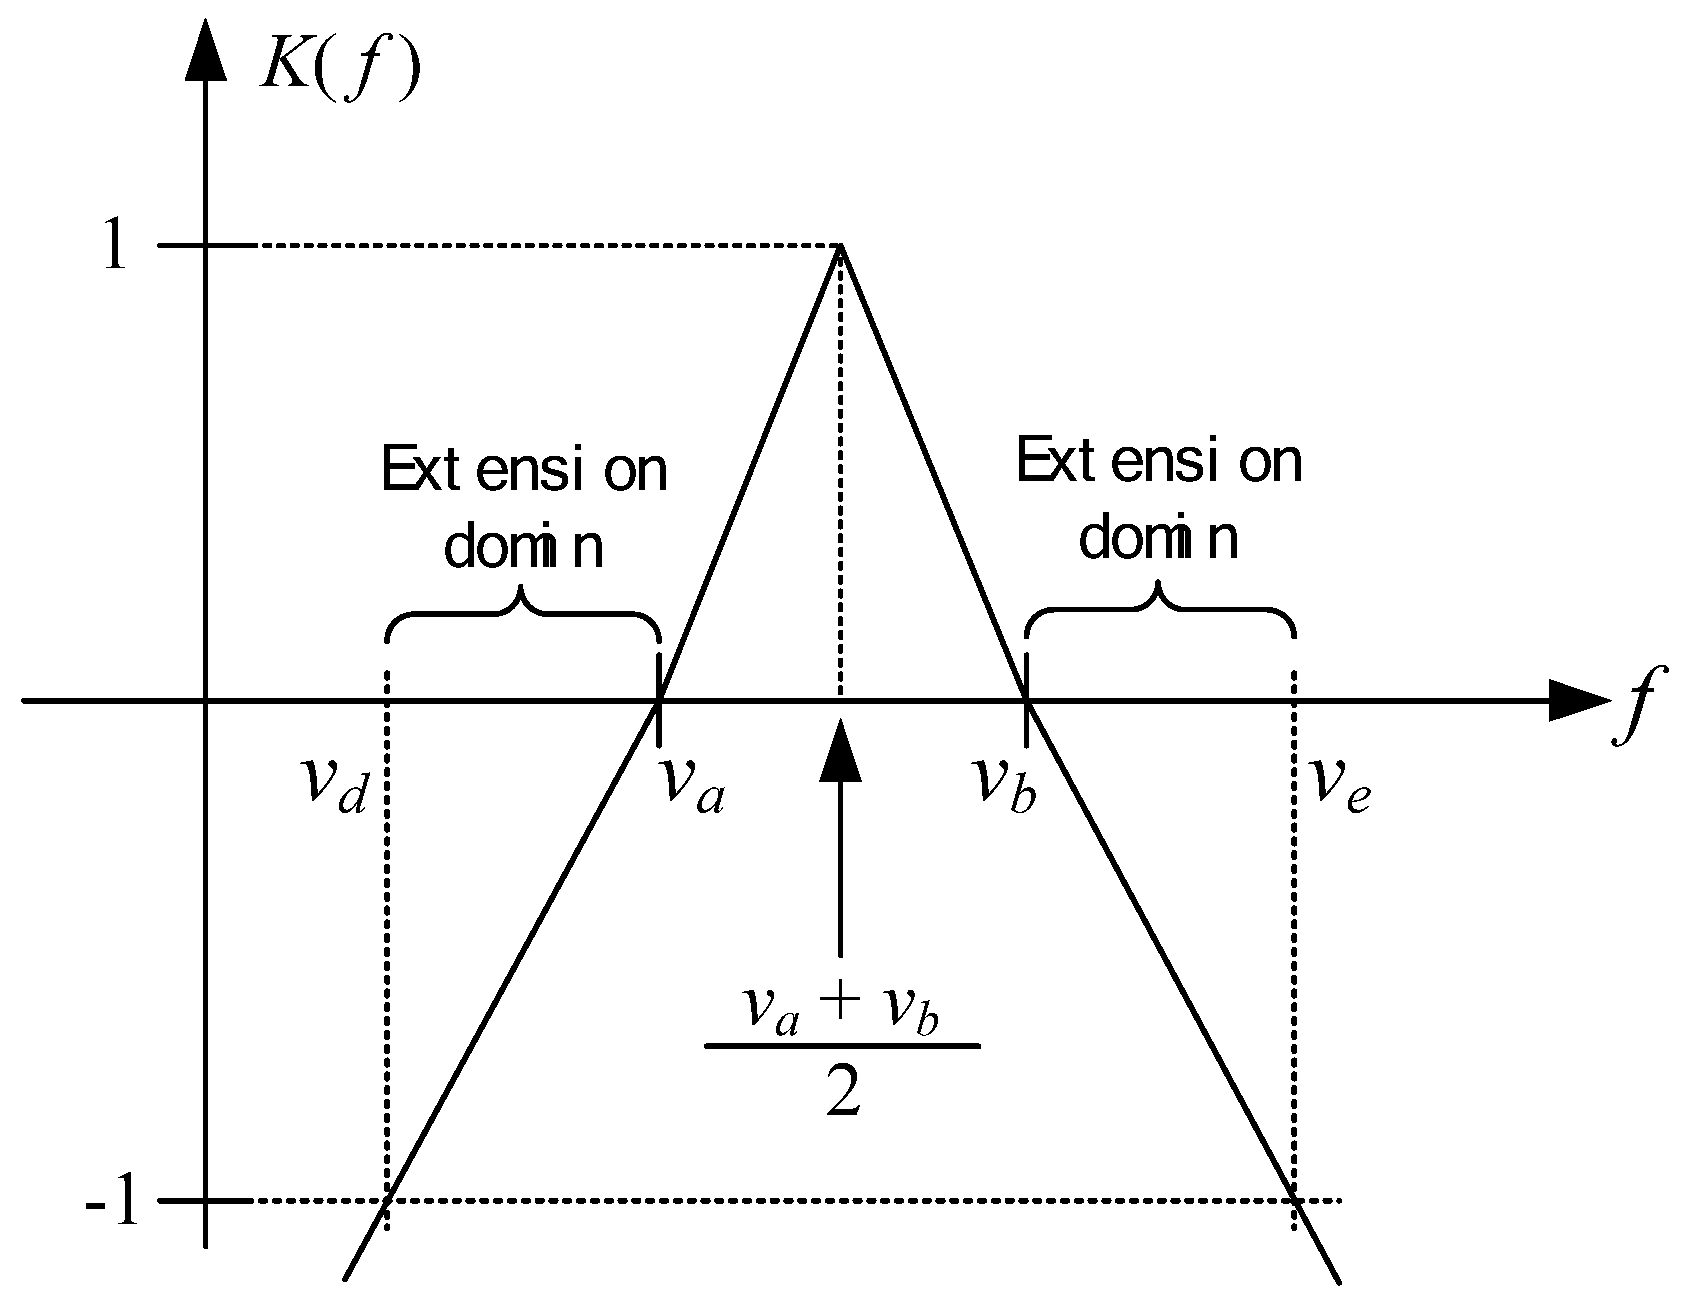
2.3.3. Correlation Function

The correlation function, derived by dividing the distance by the position value, can be expressed as follows:
K ( f ) = Φ ( f , F 0 ) D ( f , F 0 , F ) .
If f = (va + vb)/2, the correlation function has a maximum value and is called an elementary correlation function (Figure 8). In addition, if K(f) < −1, point f is outside the interval F. If K(f) > 0, point f is within the interval F0. If −1 < K(f) < 0, point f is within the extension domain.
The fault diagnosis steps involved in the extension method are described as follows.
Step 1.
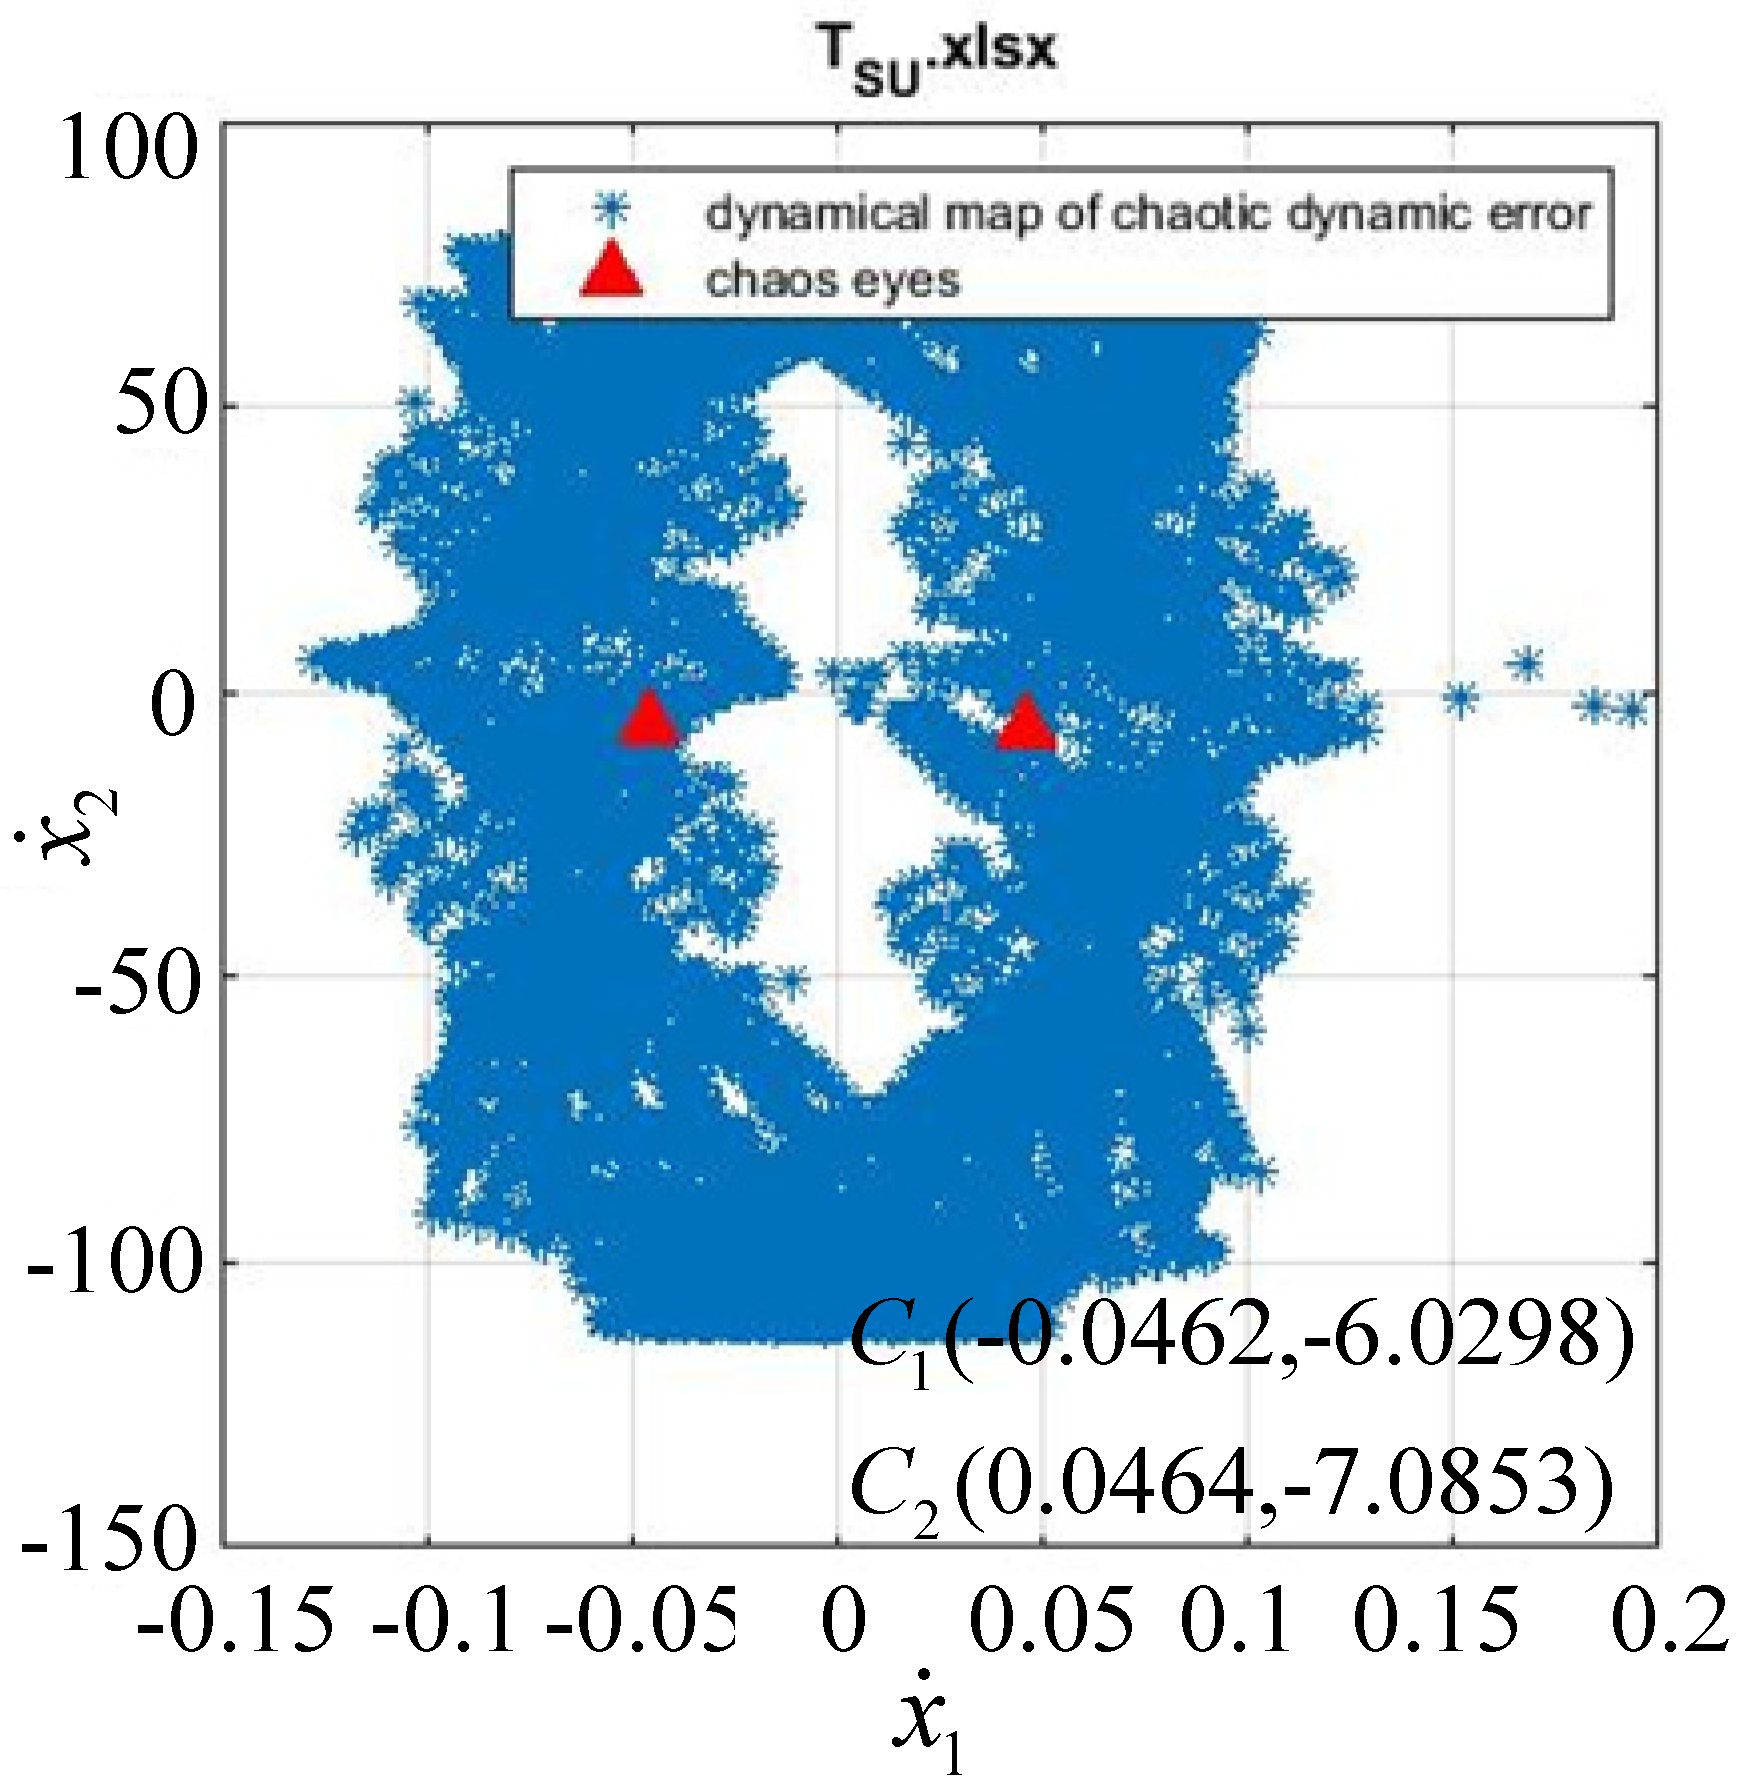
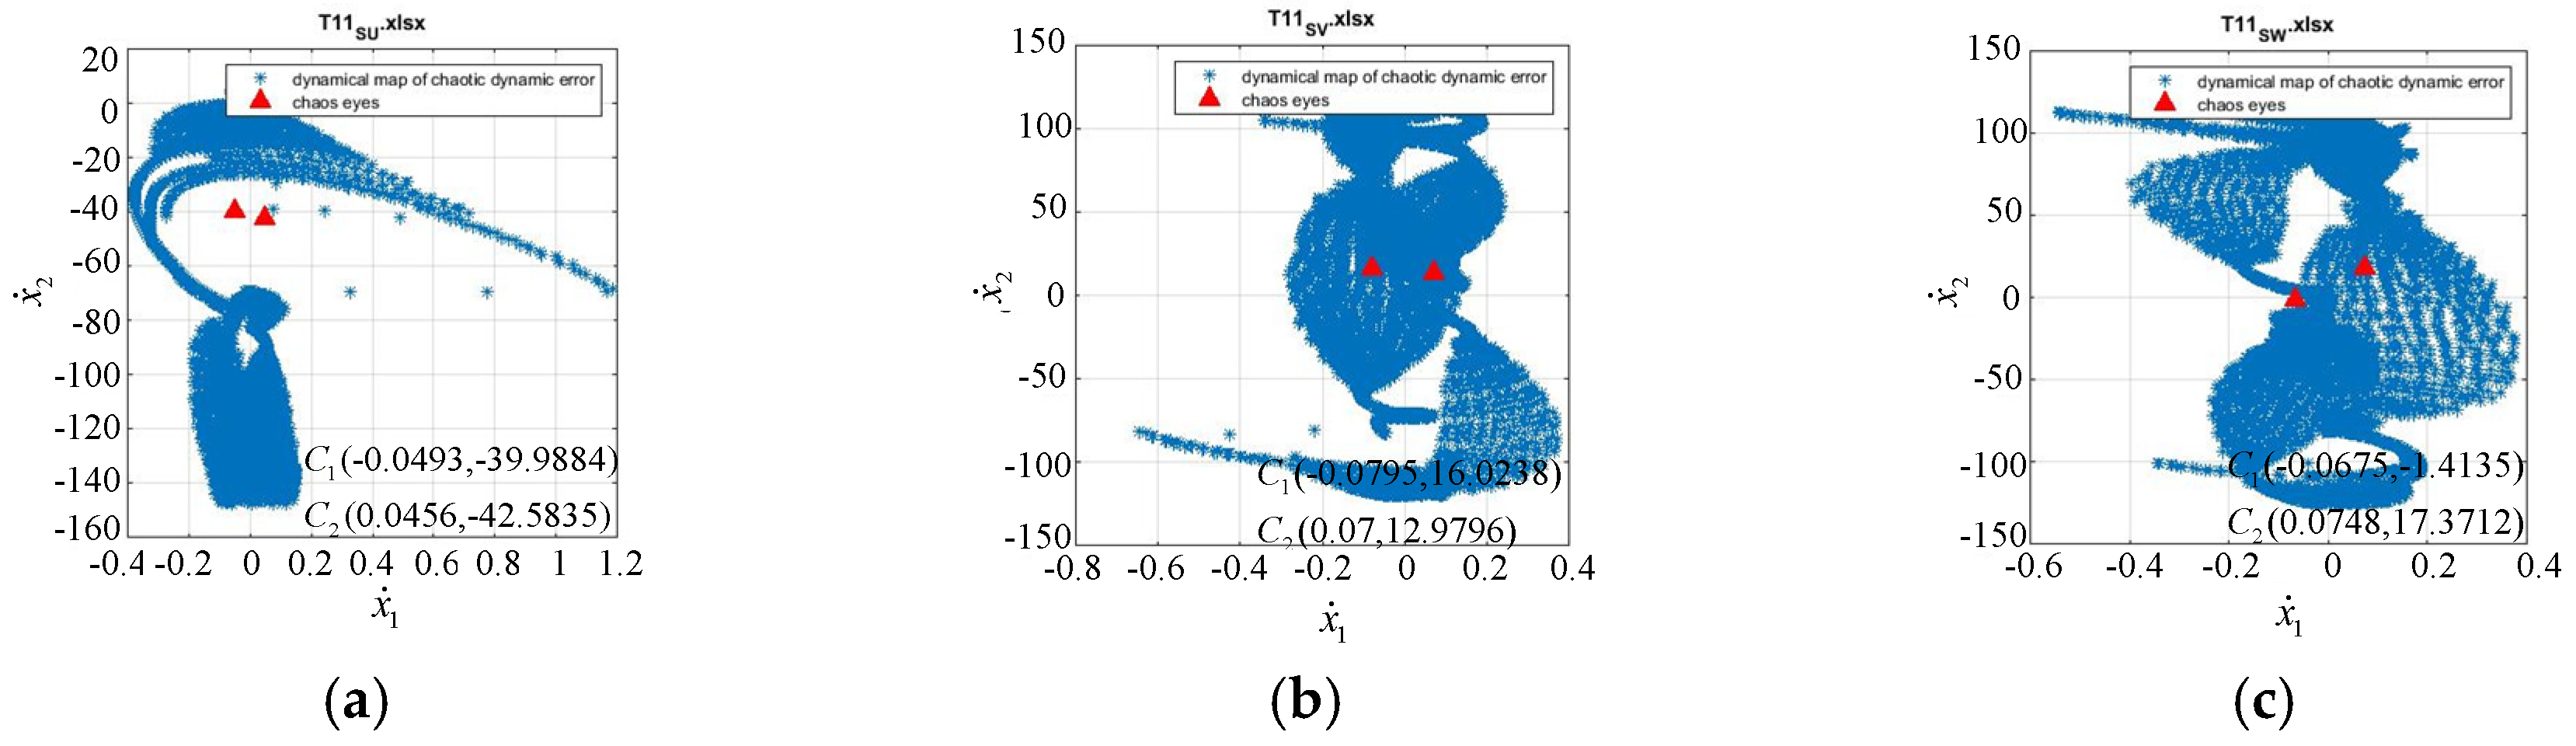
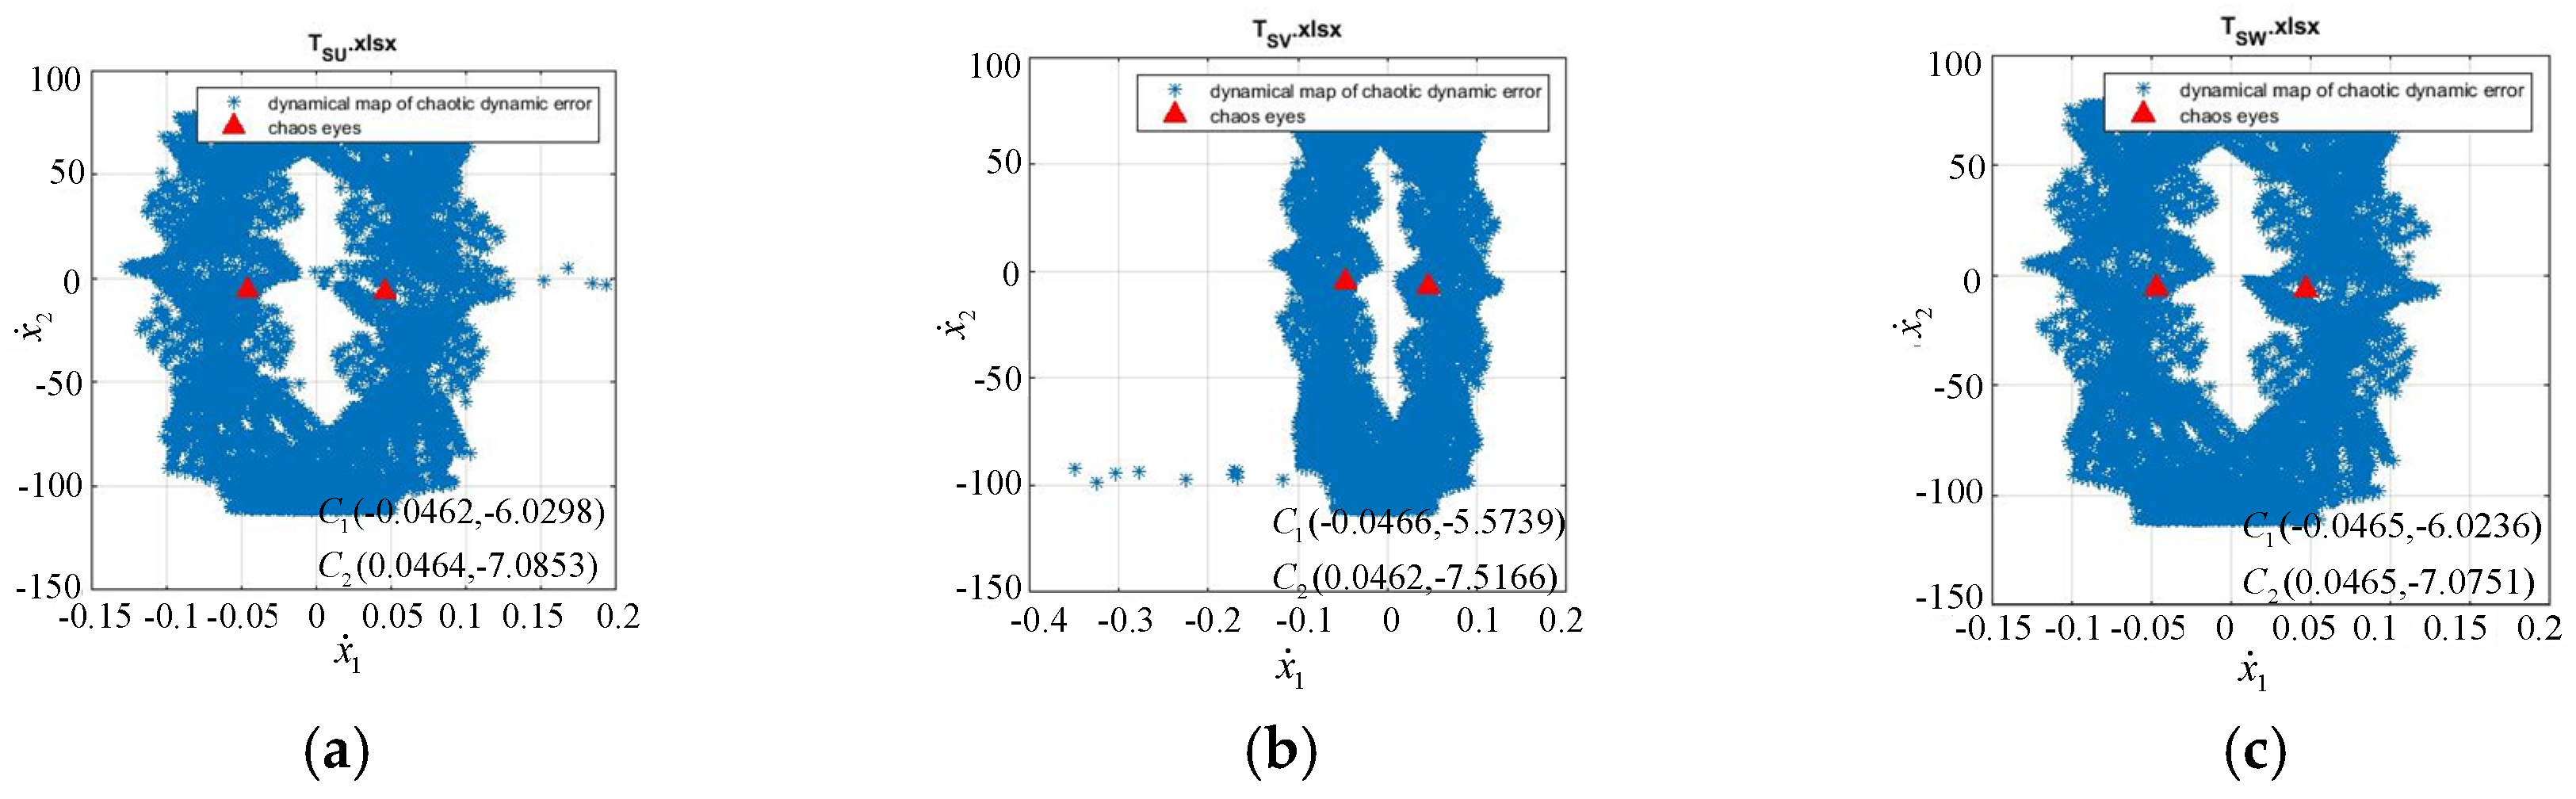
For each transistor failure, the chaos eye coordinates C1 and C2 on the chaos scatter diagram are used to establish the matter element model.
R g = ( F , C , V p ) = [ F 0 C 1 x 1 , y 1 C 2 x 2 , y 2 ] , g = 1 , 2 , , 12
Step 2.
The chaos eye coordinates of the faulty transistor to be determined, namely C1 and C2, are input into the model, and the resulting matter element model can be expressed as follows:
R n e w = [ F n e w C 1 V n e w 1 C 2 V n e w 2 ]
Step 3.
The characteristics (C1 and C2) and their corresponding weights W1 and W2 (representing the relative importance of the characteristics) are determined. Here, W1 = W2 = 0.5.
Step 4.
The degree of correlation between the fault categories of characteristics to be tested is calculated.
λ g = j = 1 2 W j K g j , g = 1 , 2 , , 12
Step 5.
The largest correlation value of each fault category derived from the calculation represents the fault category to which a fault characteristic belongs. Therefore, the faulty transistor can be determined according to the category.

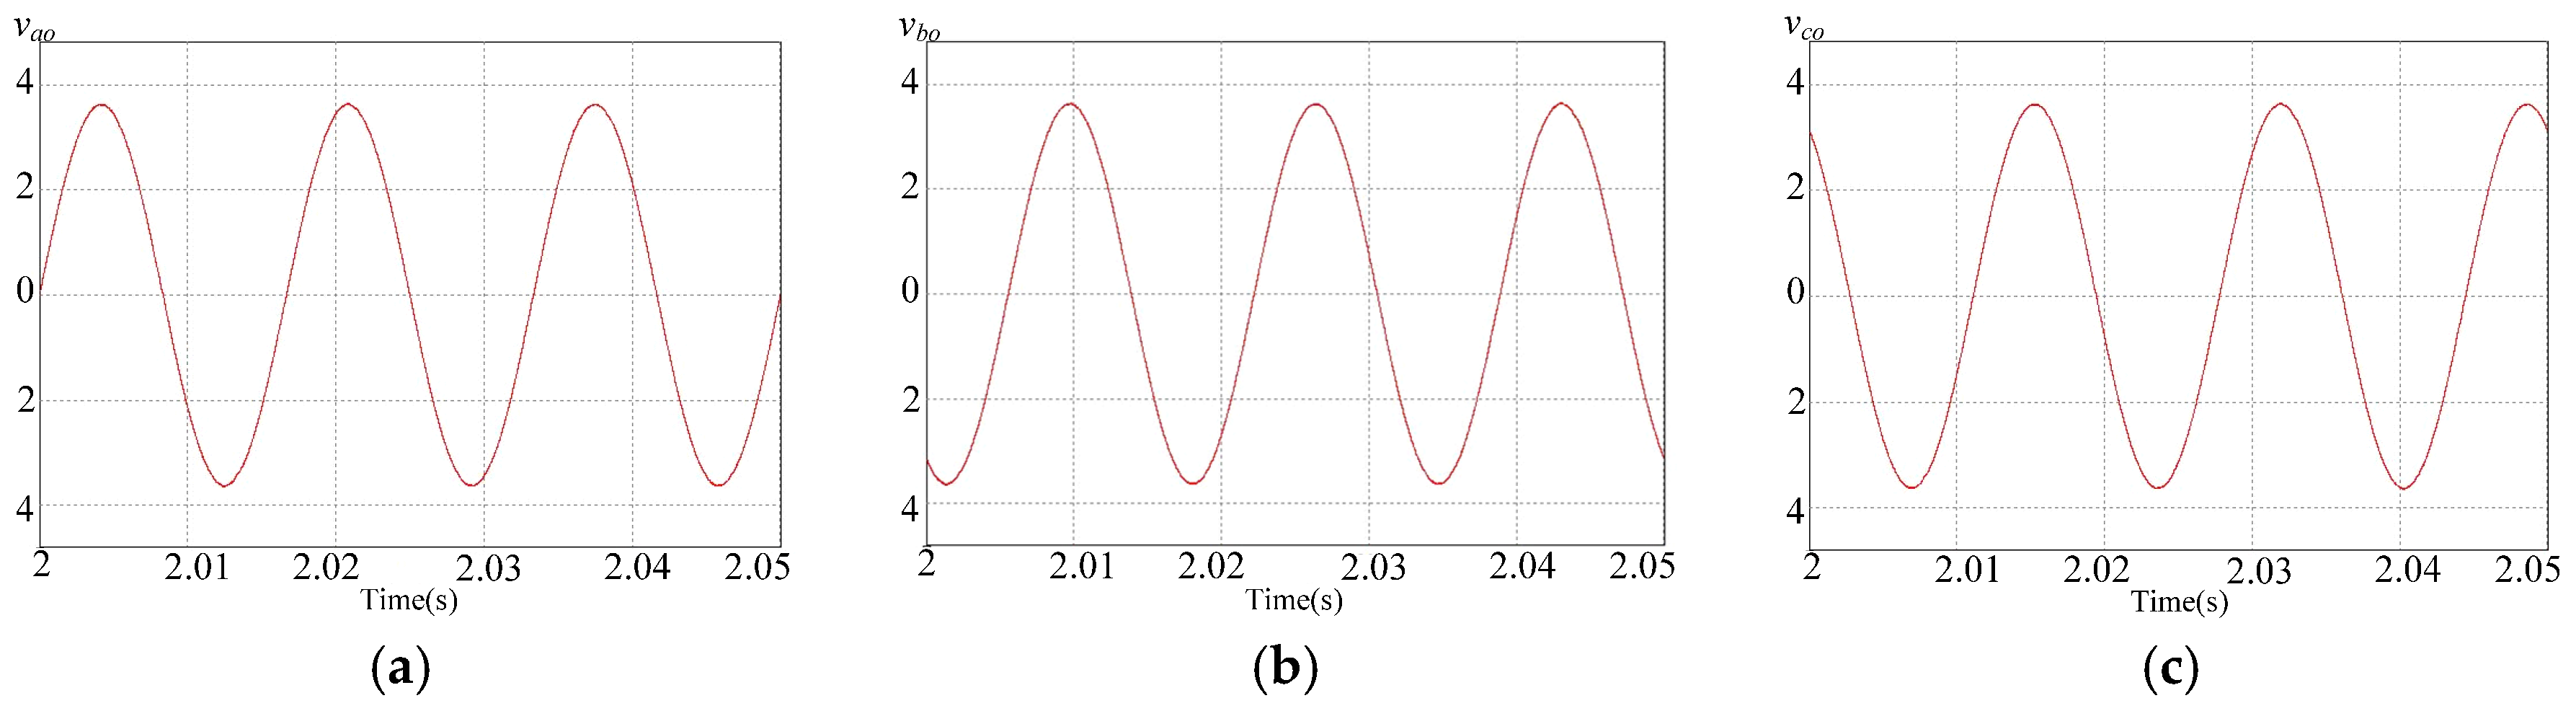
3. Simulation Results

To identify faulty power transistors, fault states were divided into nine categories in this study: Failure of Sa1+; Sa2; Sb1+; Sb2; Sc1+; Sc2; (Sa1 or Sa2+); (Sb1+ or Sb2+); and (Sc1+ or Sc2+). The principles underlying the categorization are described as follows. When Sa1 or Sa2+ is faulty, the current path and voltage waveform are considered to be the same; thus, Sa1 and Sa2+ are categorized under the same category. The same principle applies to the categories Sb1+ or Sb2+ and Sc1+ or Sc2+. Table 1 lists the fault categories.
Table 2 presents the feature values of the chaos eyes for each phase under the switch failure state at an operating frequency of 60 Hz. The data in Table 2 were used as inputs in the established fault diagnosis system to execute fault detection. Table 3, Table 4 and Table 5 present the fault detection results, indicating that all faults could be correctly detected by the system. Consider, for example, the category F2 (Table 2): The output weight determined for F2 was the highest weight value (0.861617) (Table 3); thus, the fault was correctly identified to belong to F2. To demonstrate the robustness of the proposed diagnostic system against interference, erroneous ( ± 5 % ) test samples were considered at an operating frequency of 60 Hz, and the corresponding fault detection results are presented in Table 6, Table 7 and Table 8. The results indicated that after the consideration of errors, the proposed system could still correctly detect the fault category. Therefore, regardless of whether accurate or erroneous test data are used, the proposed system can correctly detect the fault category.

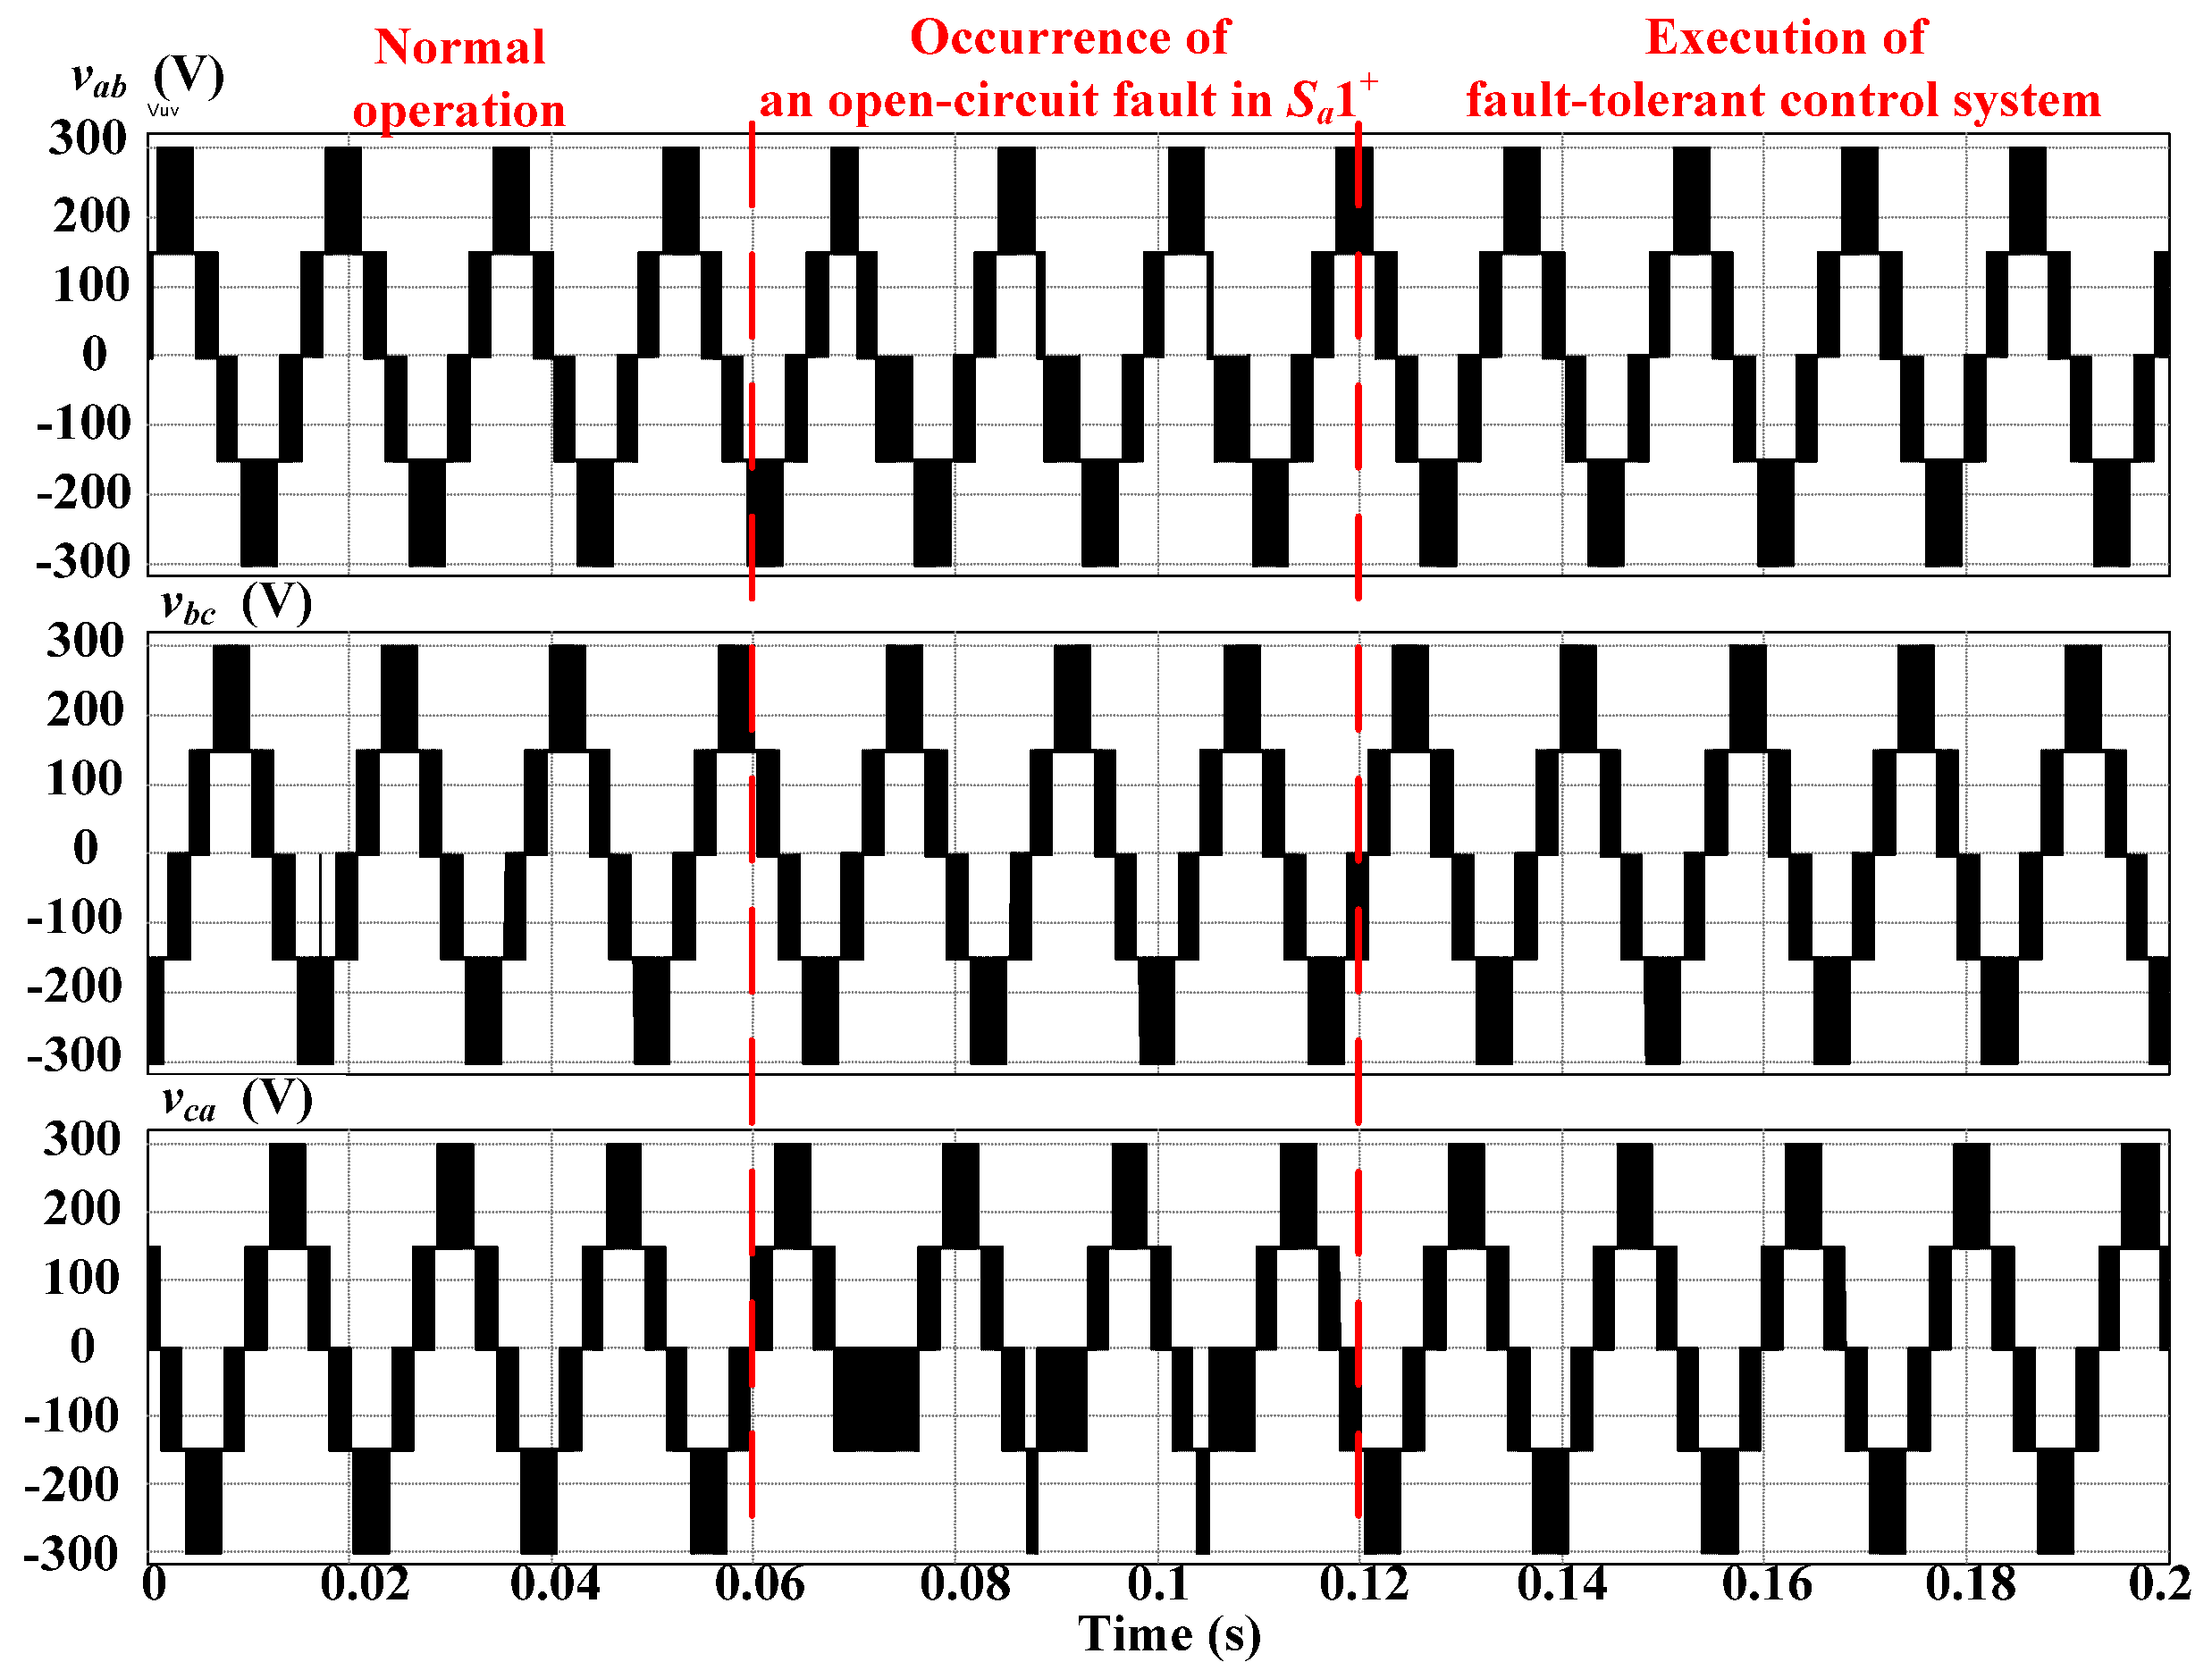
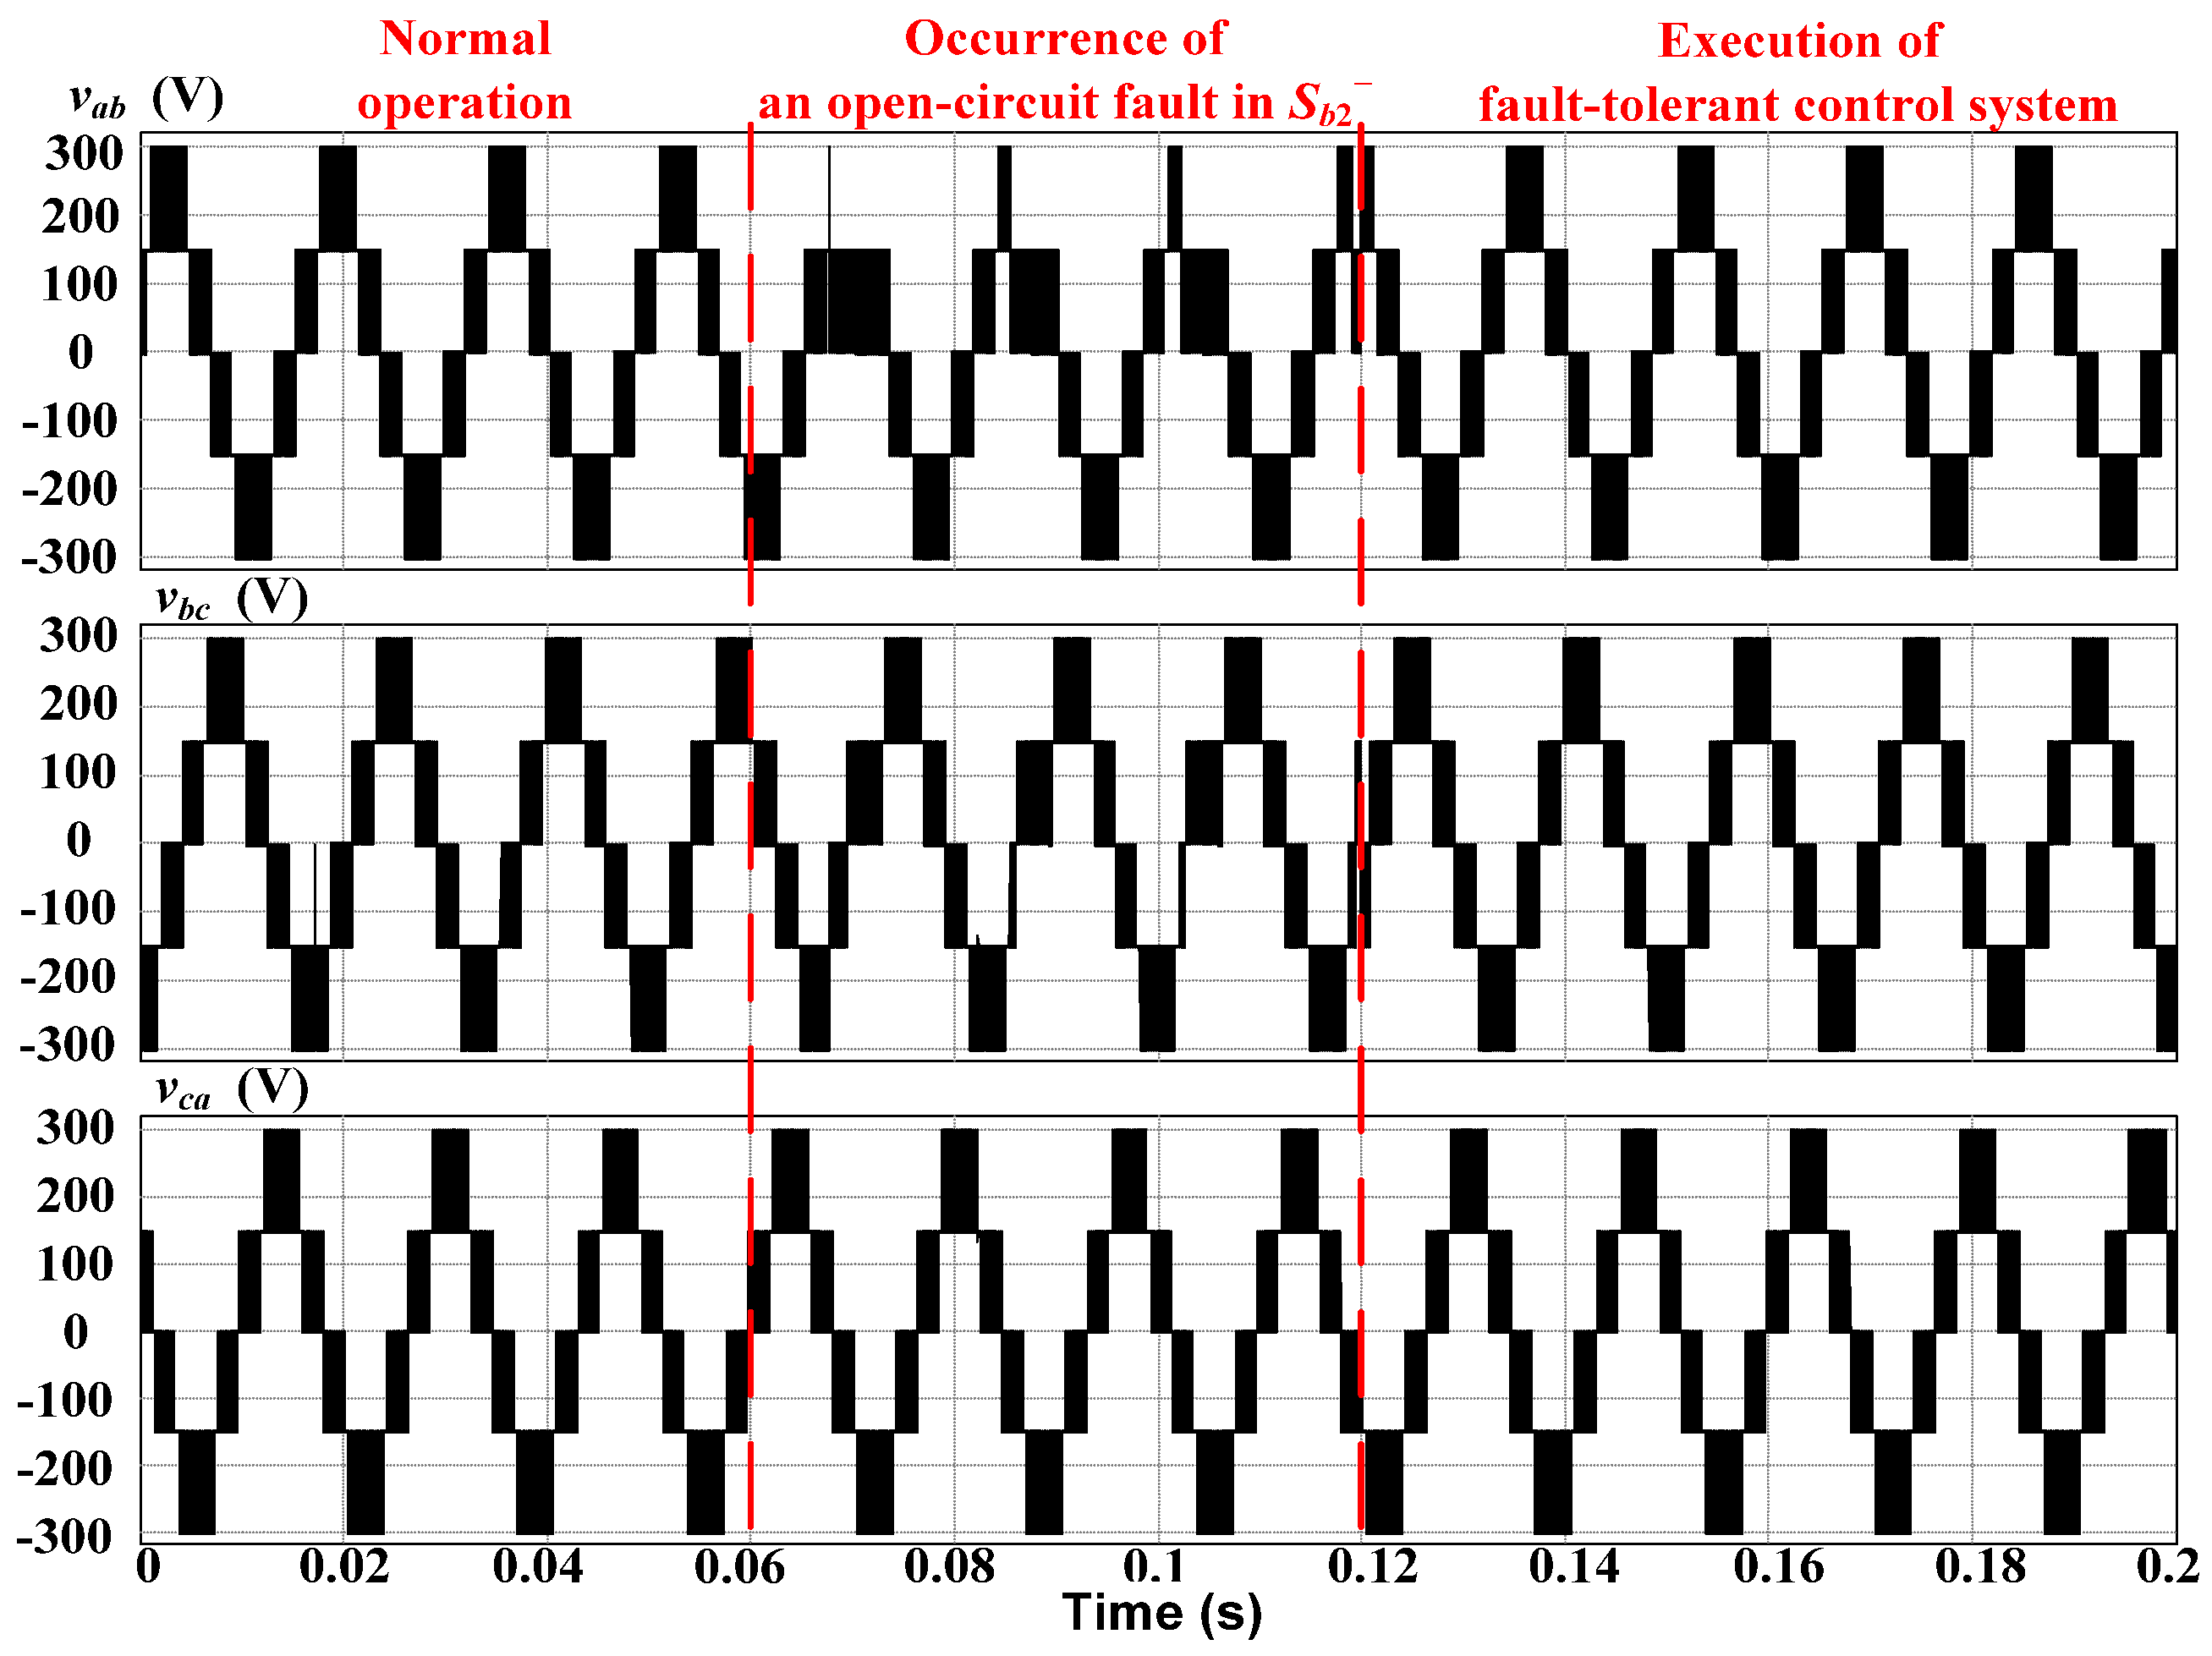
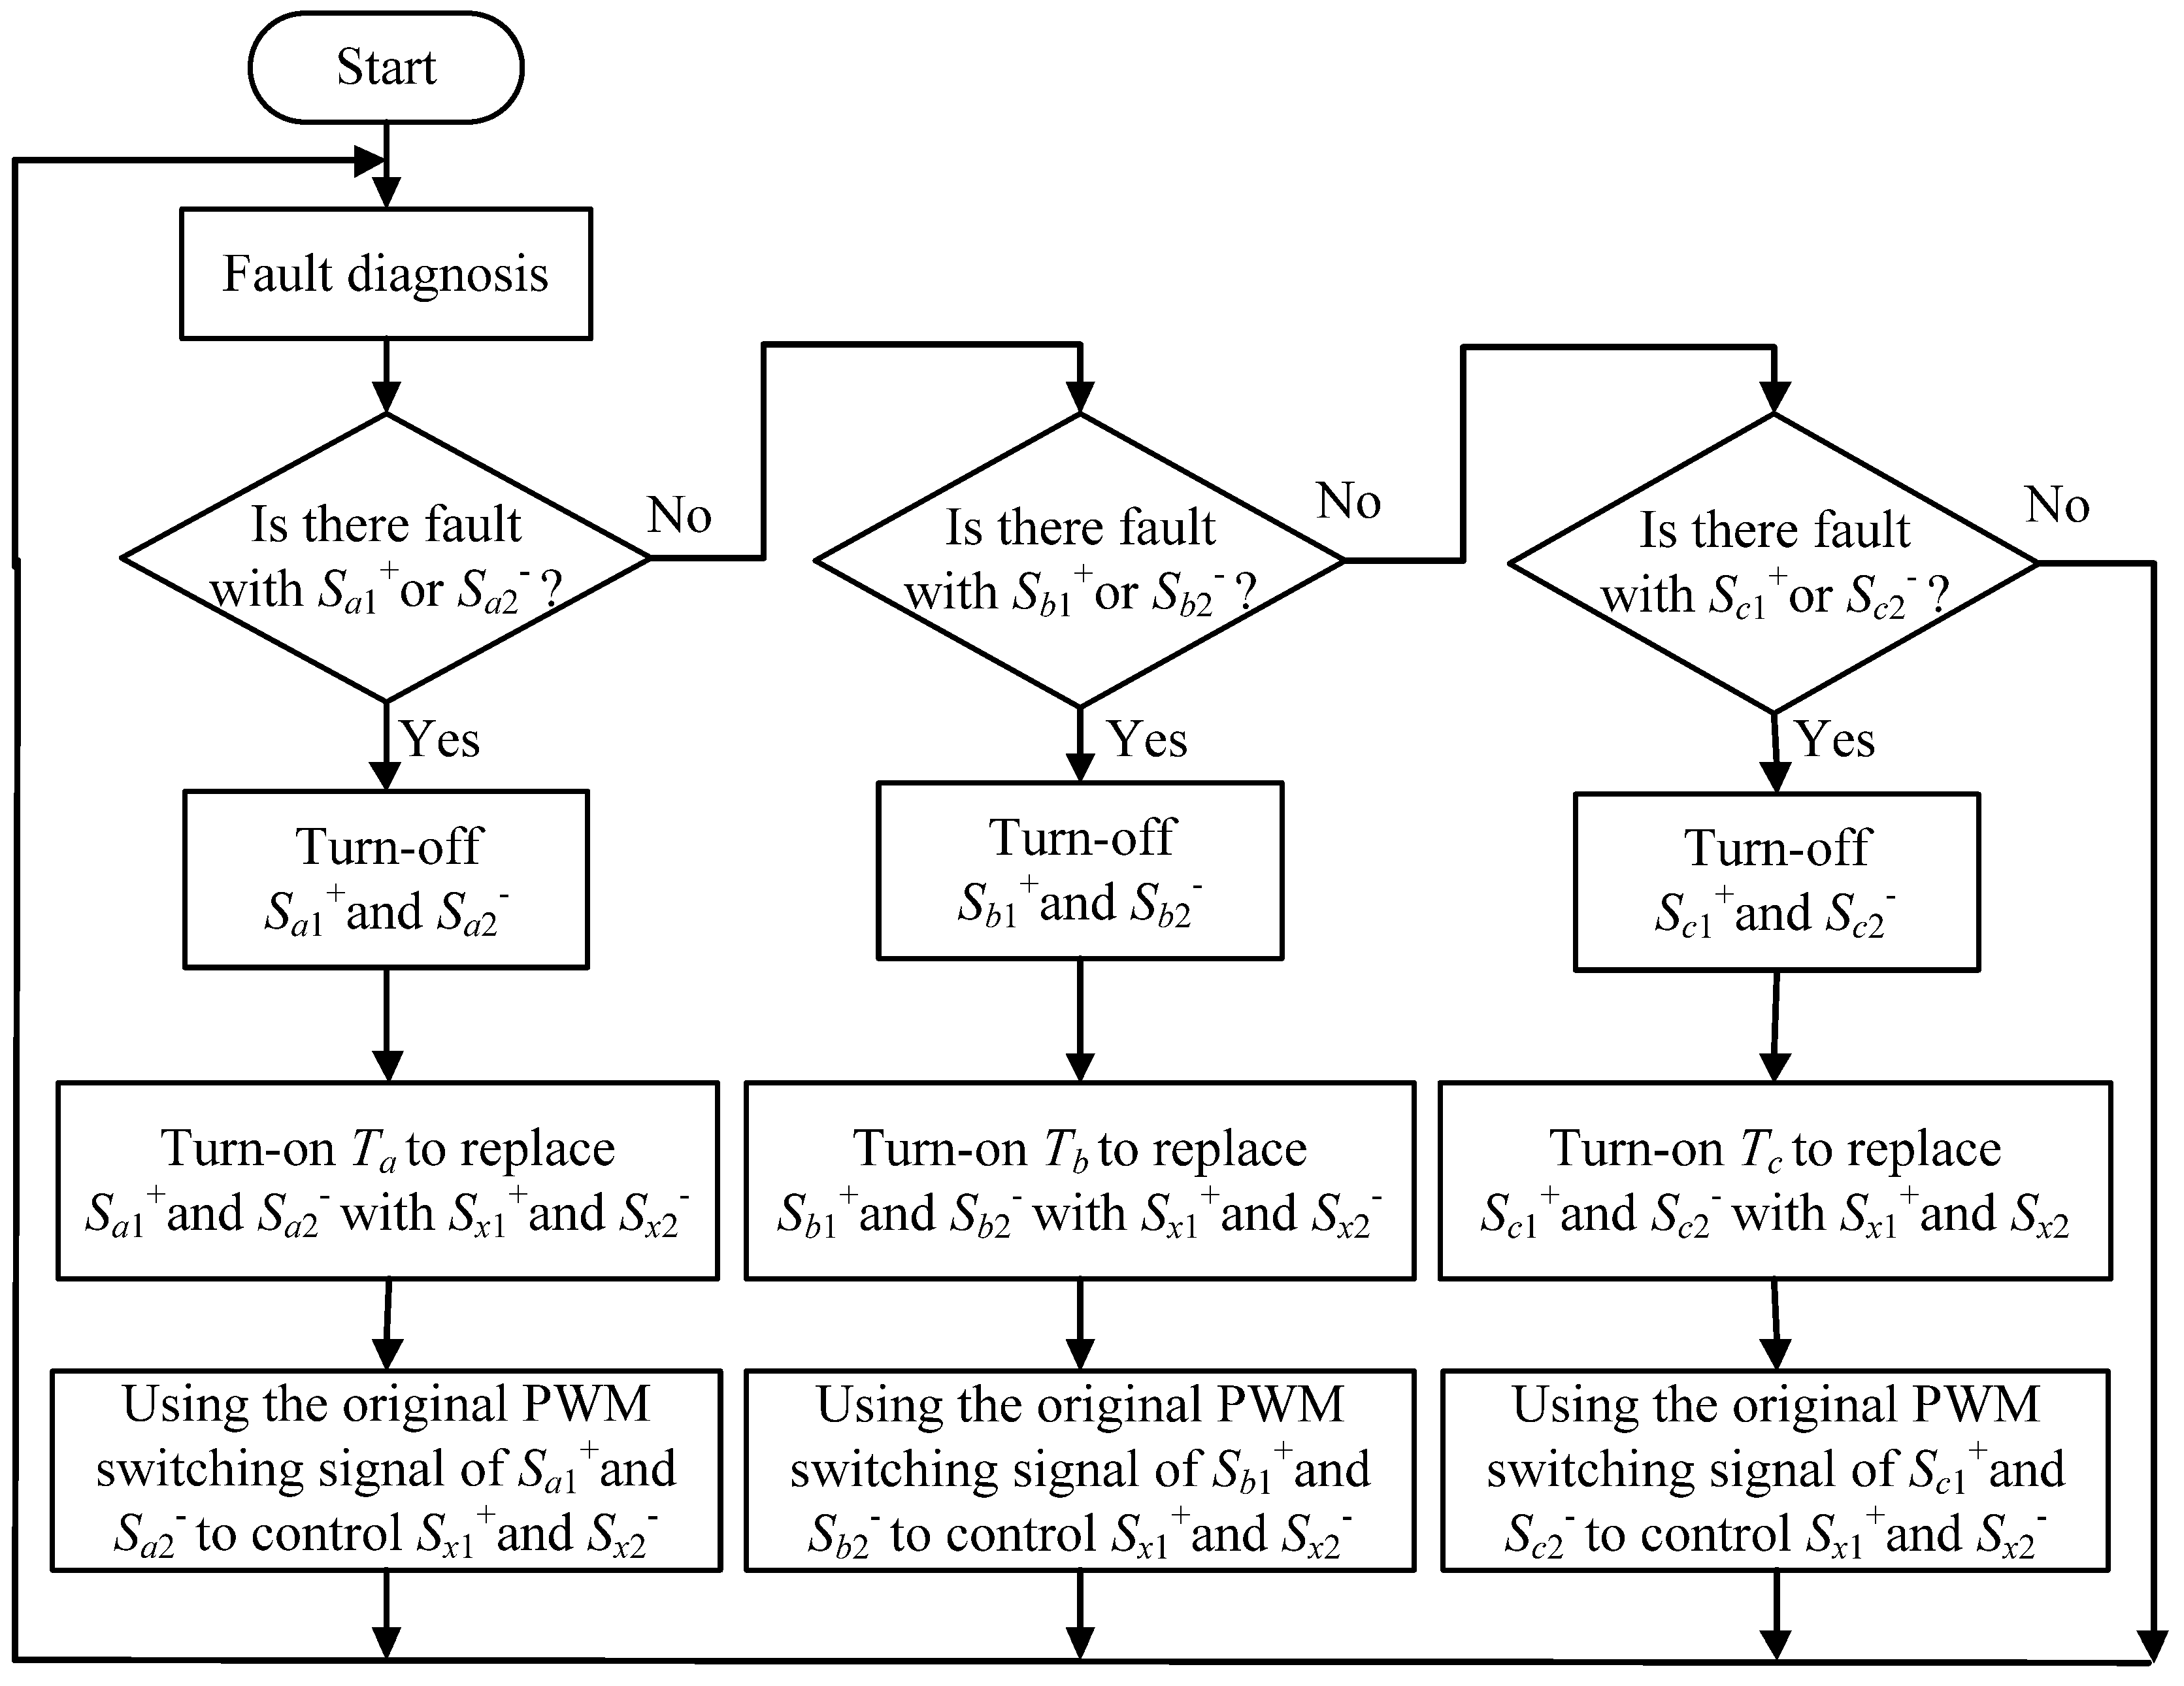
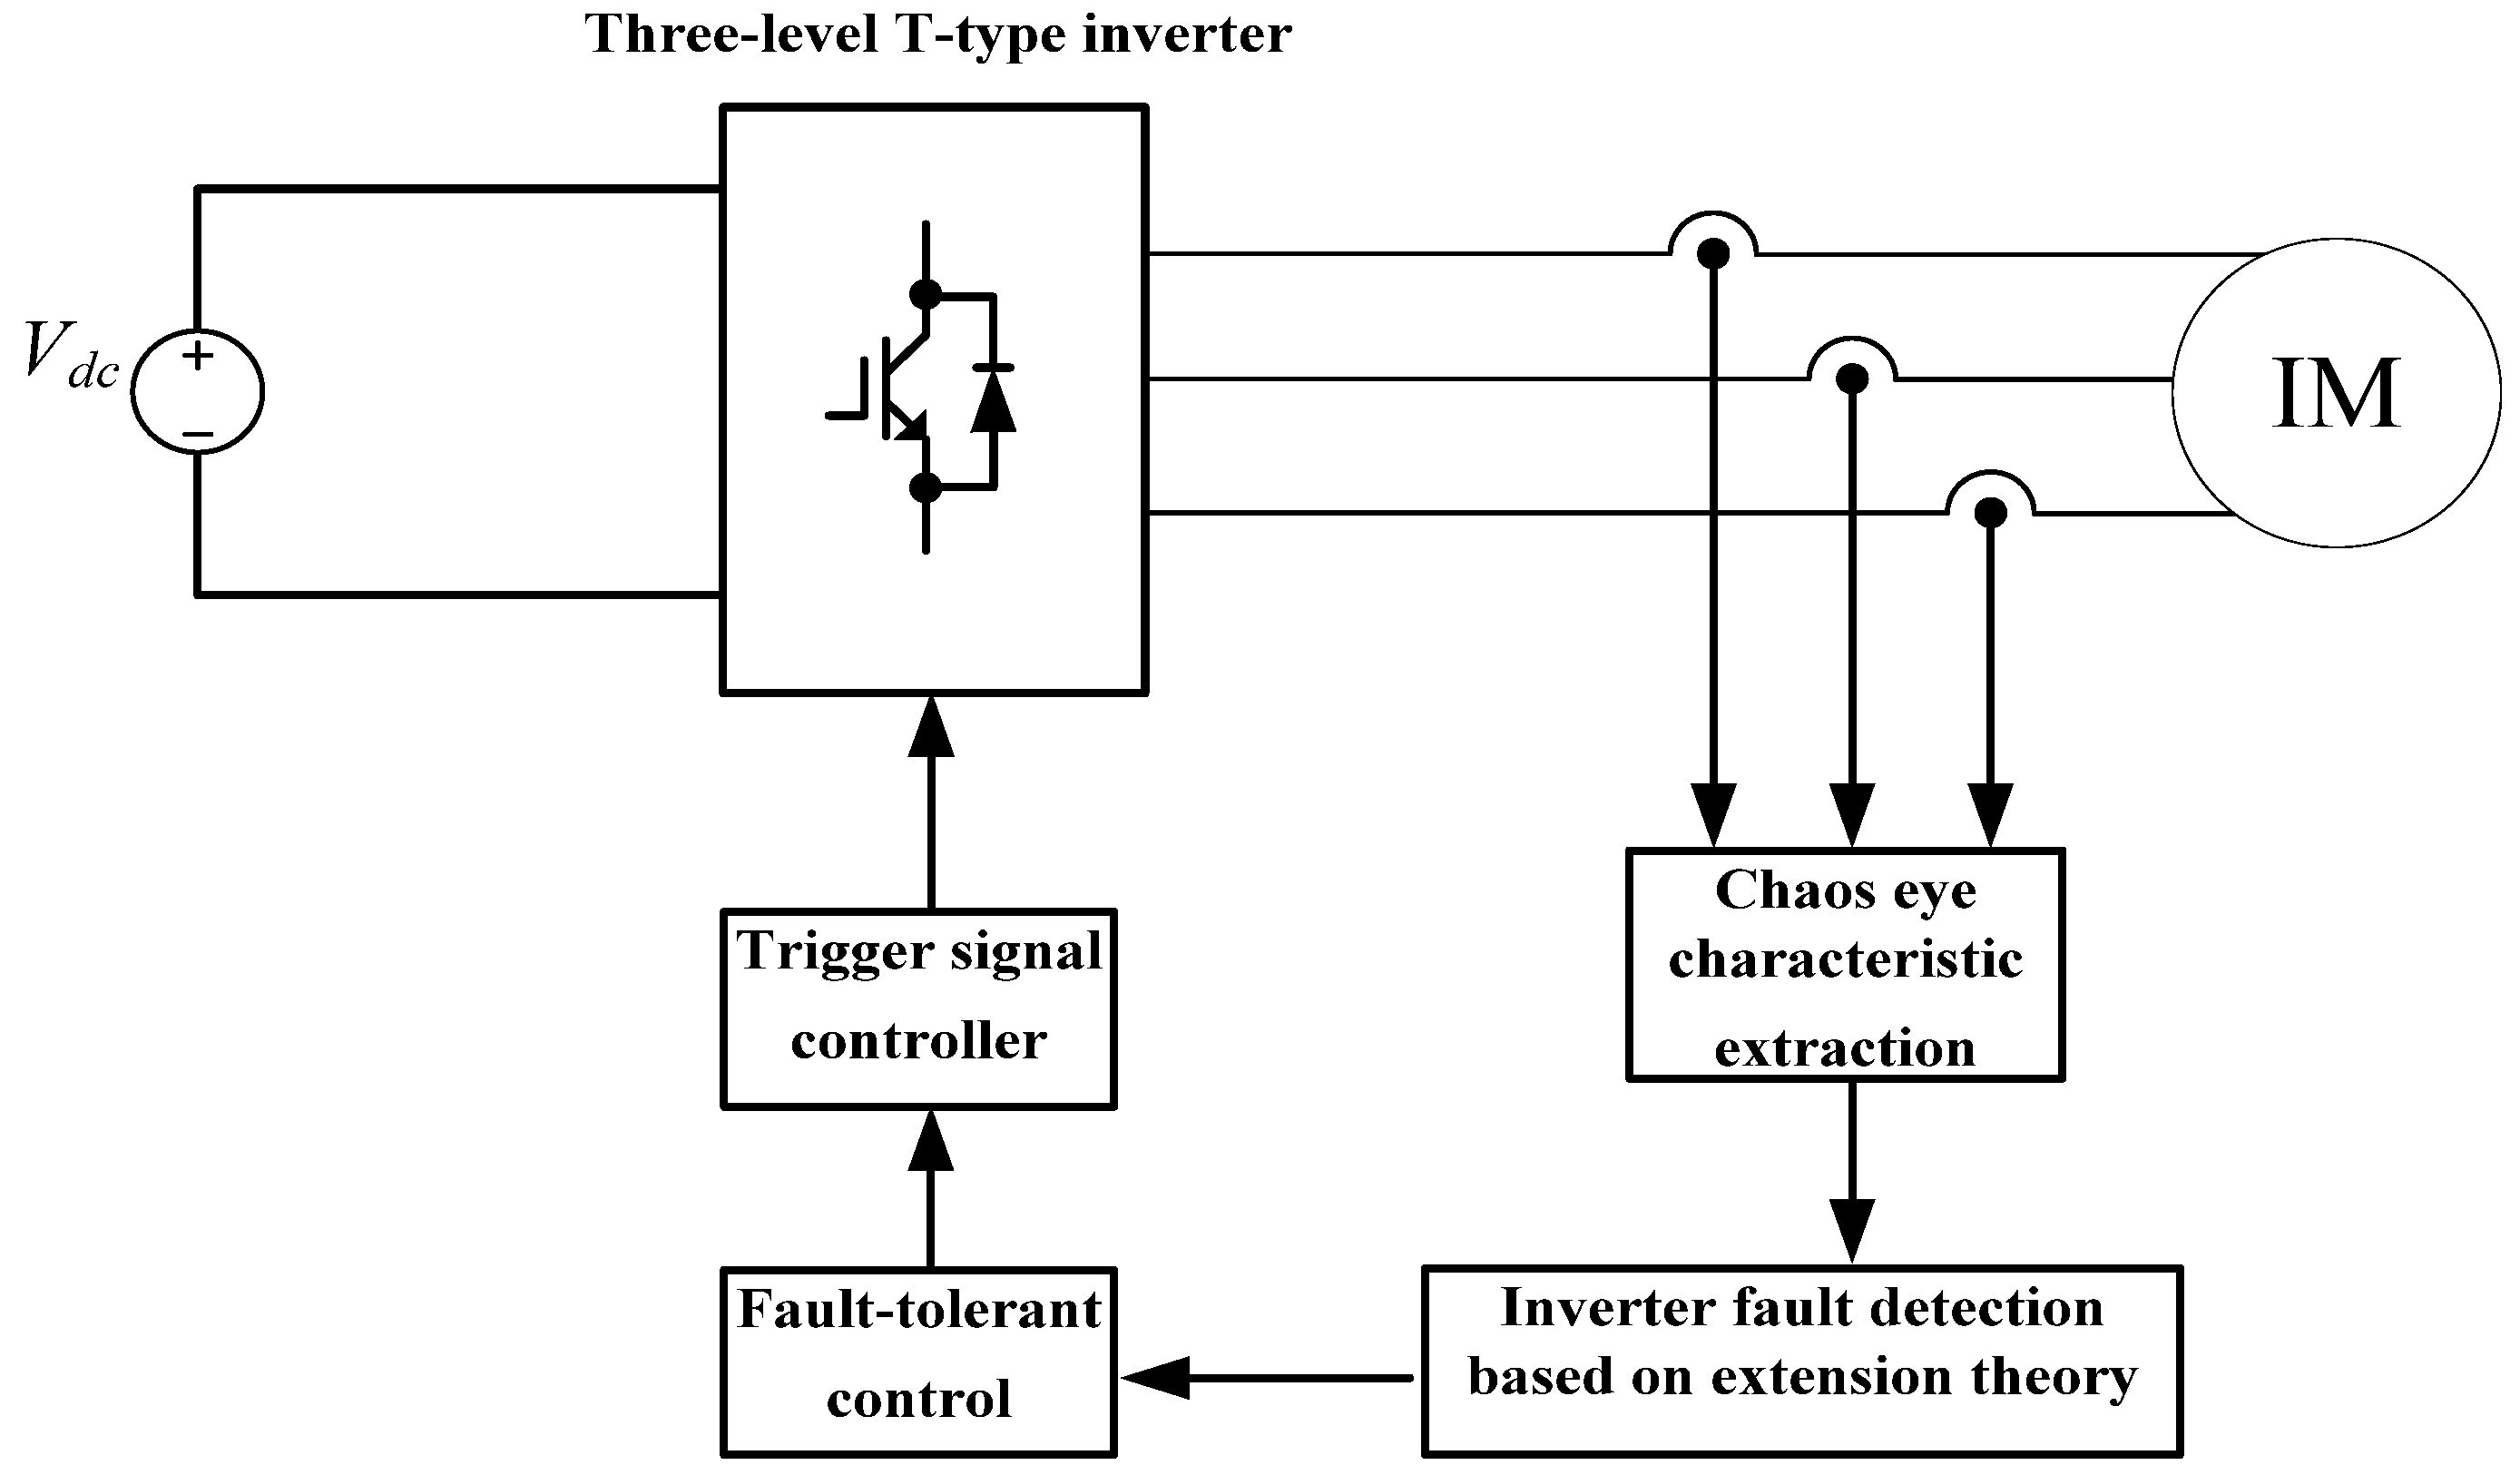
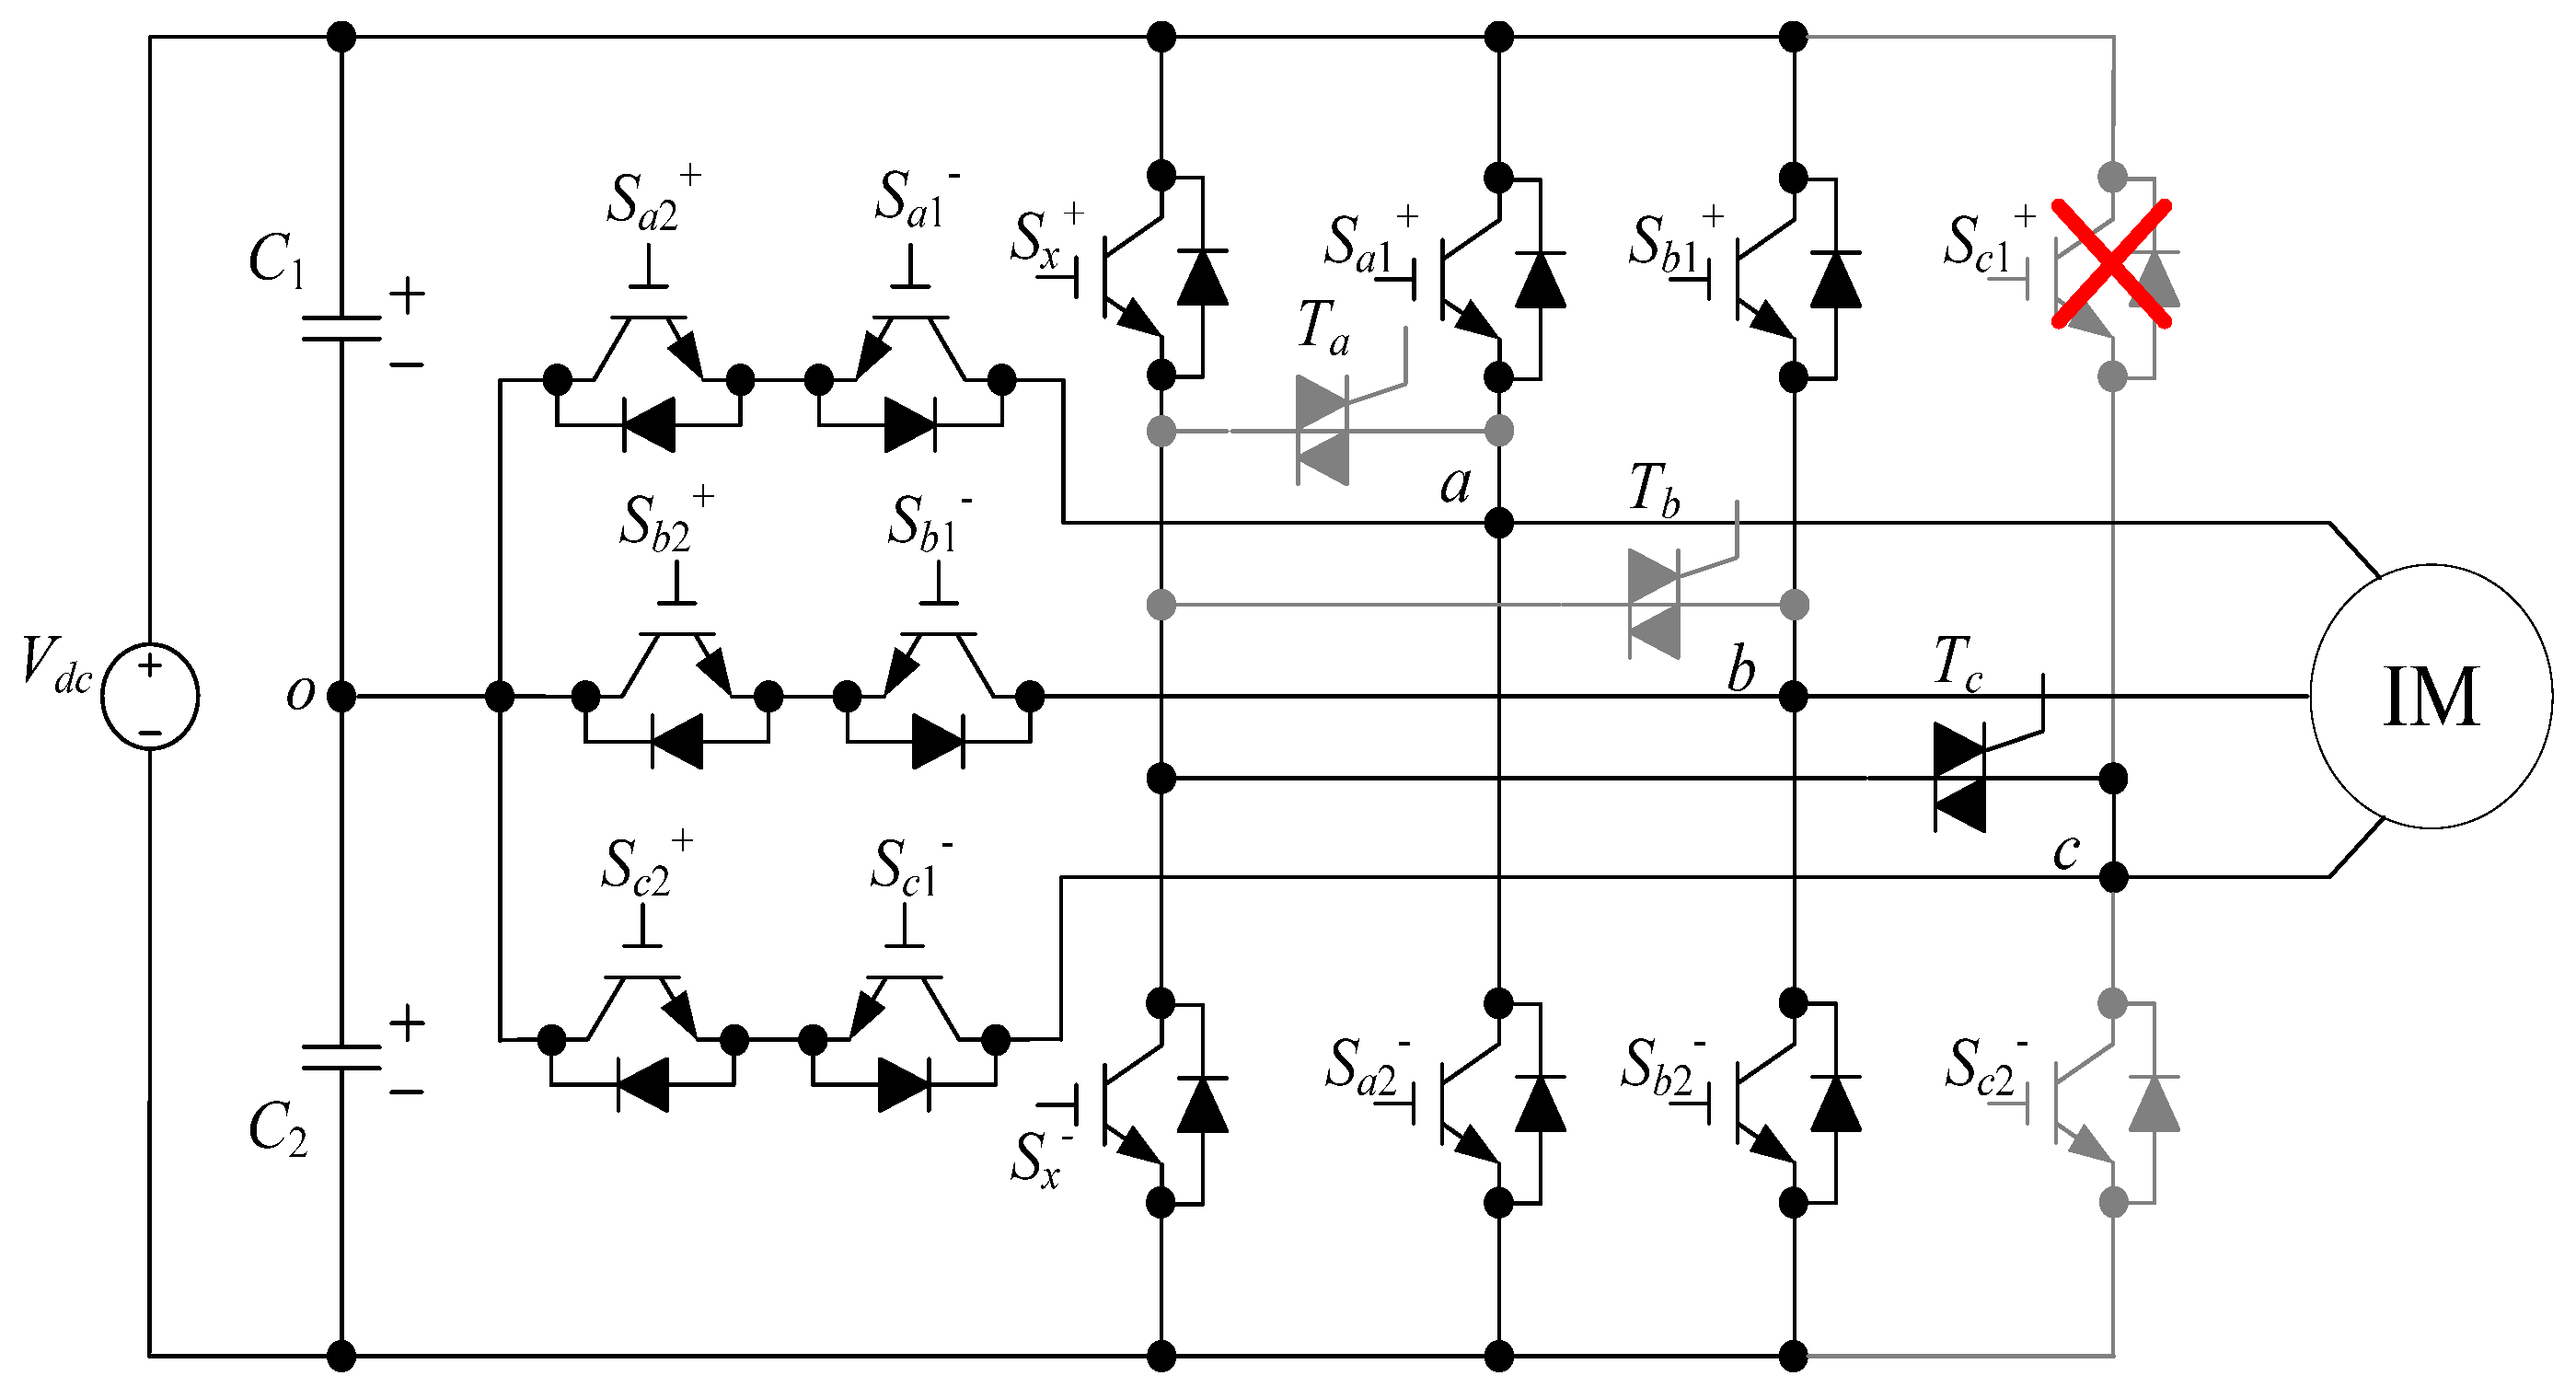
4. Fault-Tolerant Control of Three-Level T-Type Inverter

Most applications have particularly high requirements for equipment reliability. Accordingly, the reliability of inverter systems can be improved by equipping such systems with fault-tolerant control mechanisms that can enable them to maintain a stable output voltage. Figure 9 presents the architecture of the three-level T-type inverter proposed in this study. Compared with conventional three-level T-type inverters, the proposed inverter includes two additional insulated gate bipolar transistors and 3 three-pole ac semiconductor switches (Triode AC, TRIAC). The spare leg comprises the insulated gate bipolar transistors (IGBT) Sx+ and Sx, which can be used to replace those in the faulty phase to maintain circuit operation. The 3 three-pole ac semiconductor switches Ta, Tb, and Tc connect the spare legs and a-, b-, and c-legs. When a fault occurs, the spare leg is connected with the faulty leg so that the spare leg can replace the function of the faulty leg, thus achieving fault tolerance.

4.1. Fault-Tolerant Control Analysis

The proposed fault-tolerant control system deactivates the a-phase half-bridge switches (Sa1+ and Sa2) when an open-circuit fault occurs in Sa1+ or Sa2. The b-phase, c-phase, and neutral-point switches still operate normally, and switch Ta in the three three-pole ac semiconductor switches are activated to replace the faulty a-phase leg with the spare leg. The spare leg adopts the switching mode of the original a-phase leg to maintain the three-phase balanced output voltage. If an open-circuit fault occurs in Sb1+ or Sb2, the b-phase half-bridge switches (Sb1+ and Sb2) are deactivated. The a-phase, c-phase, and neutral-point switches still operate normally, and switch Tb in the three three-pole ac semiconductor switches are activated to replace the faulty b-phase leg with the spare leg. The spare leg adopts the switching mode of the original b-phase leg to maintain the three-phase balanced output voltage. Similarly, if an open-circuit fault occurs in Sc1+ or Sc2, the c-phase half-bridge switches (Sc1+ and Sc2) are deactivated. The a-phase, b-phase, and neutral-point switches still operate normally, and switch Tc of the three three-pole ac semiconductor switches are activated to replace the faulty c-phase leg with the spare leg. The spare leg adopts the switching mode of the original c-phase leg to maintain the three-phase balanced output voltage. Consider, for example, the occurrence of an open-circuit fault in Sa1+, Sb2, and Sc1+; the corresponding switching states induced by the fault-tolerant control system for the three-level inverter are shown in Figure 10, Figure 11 and Figure 12, respectively.

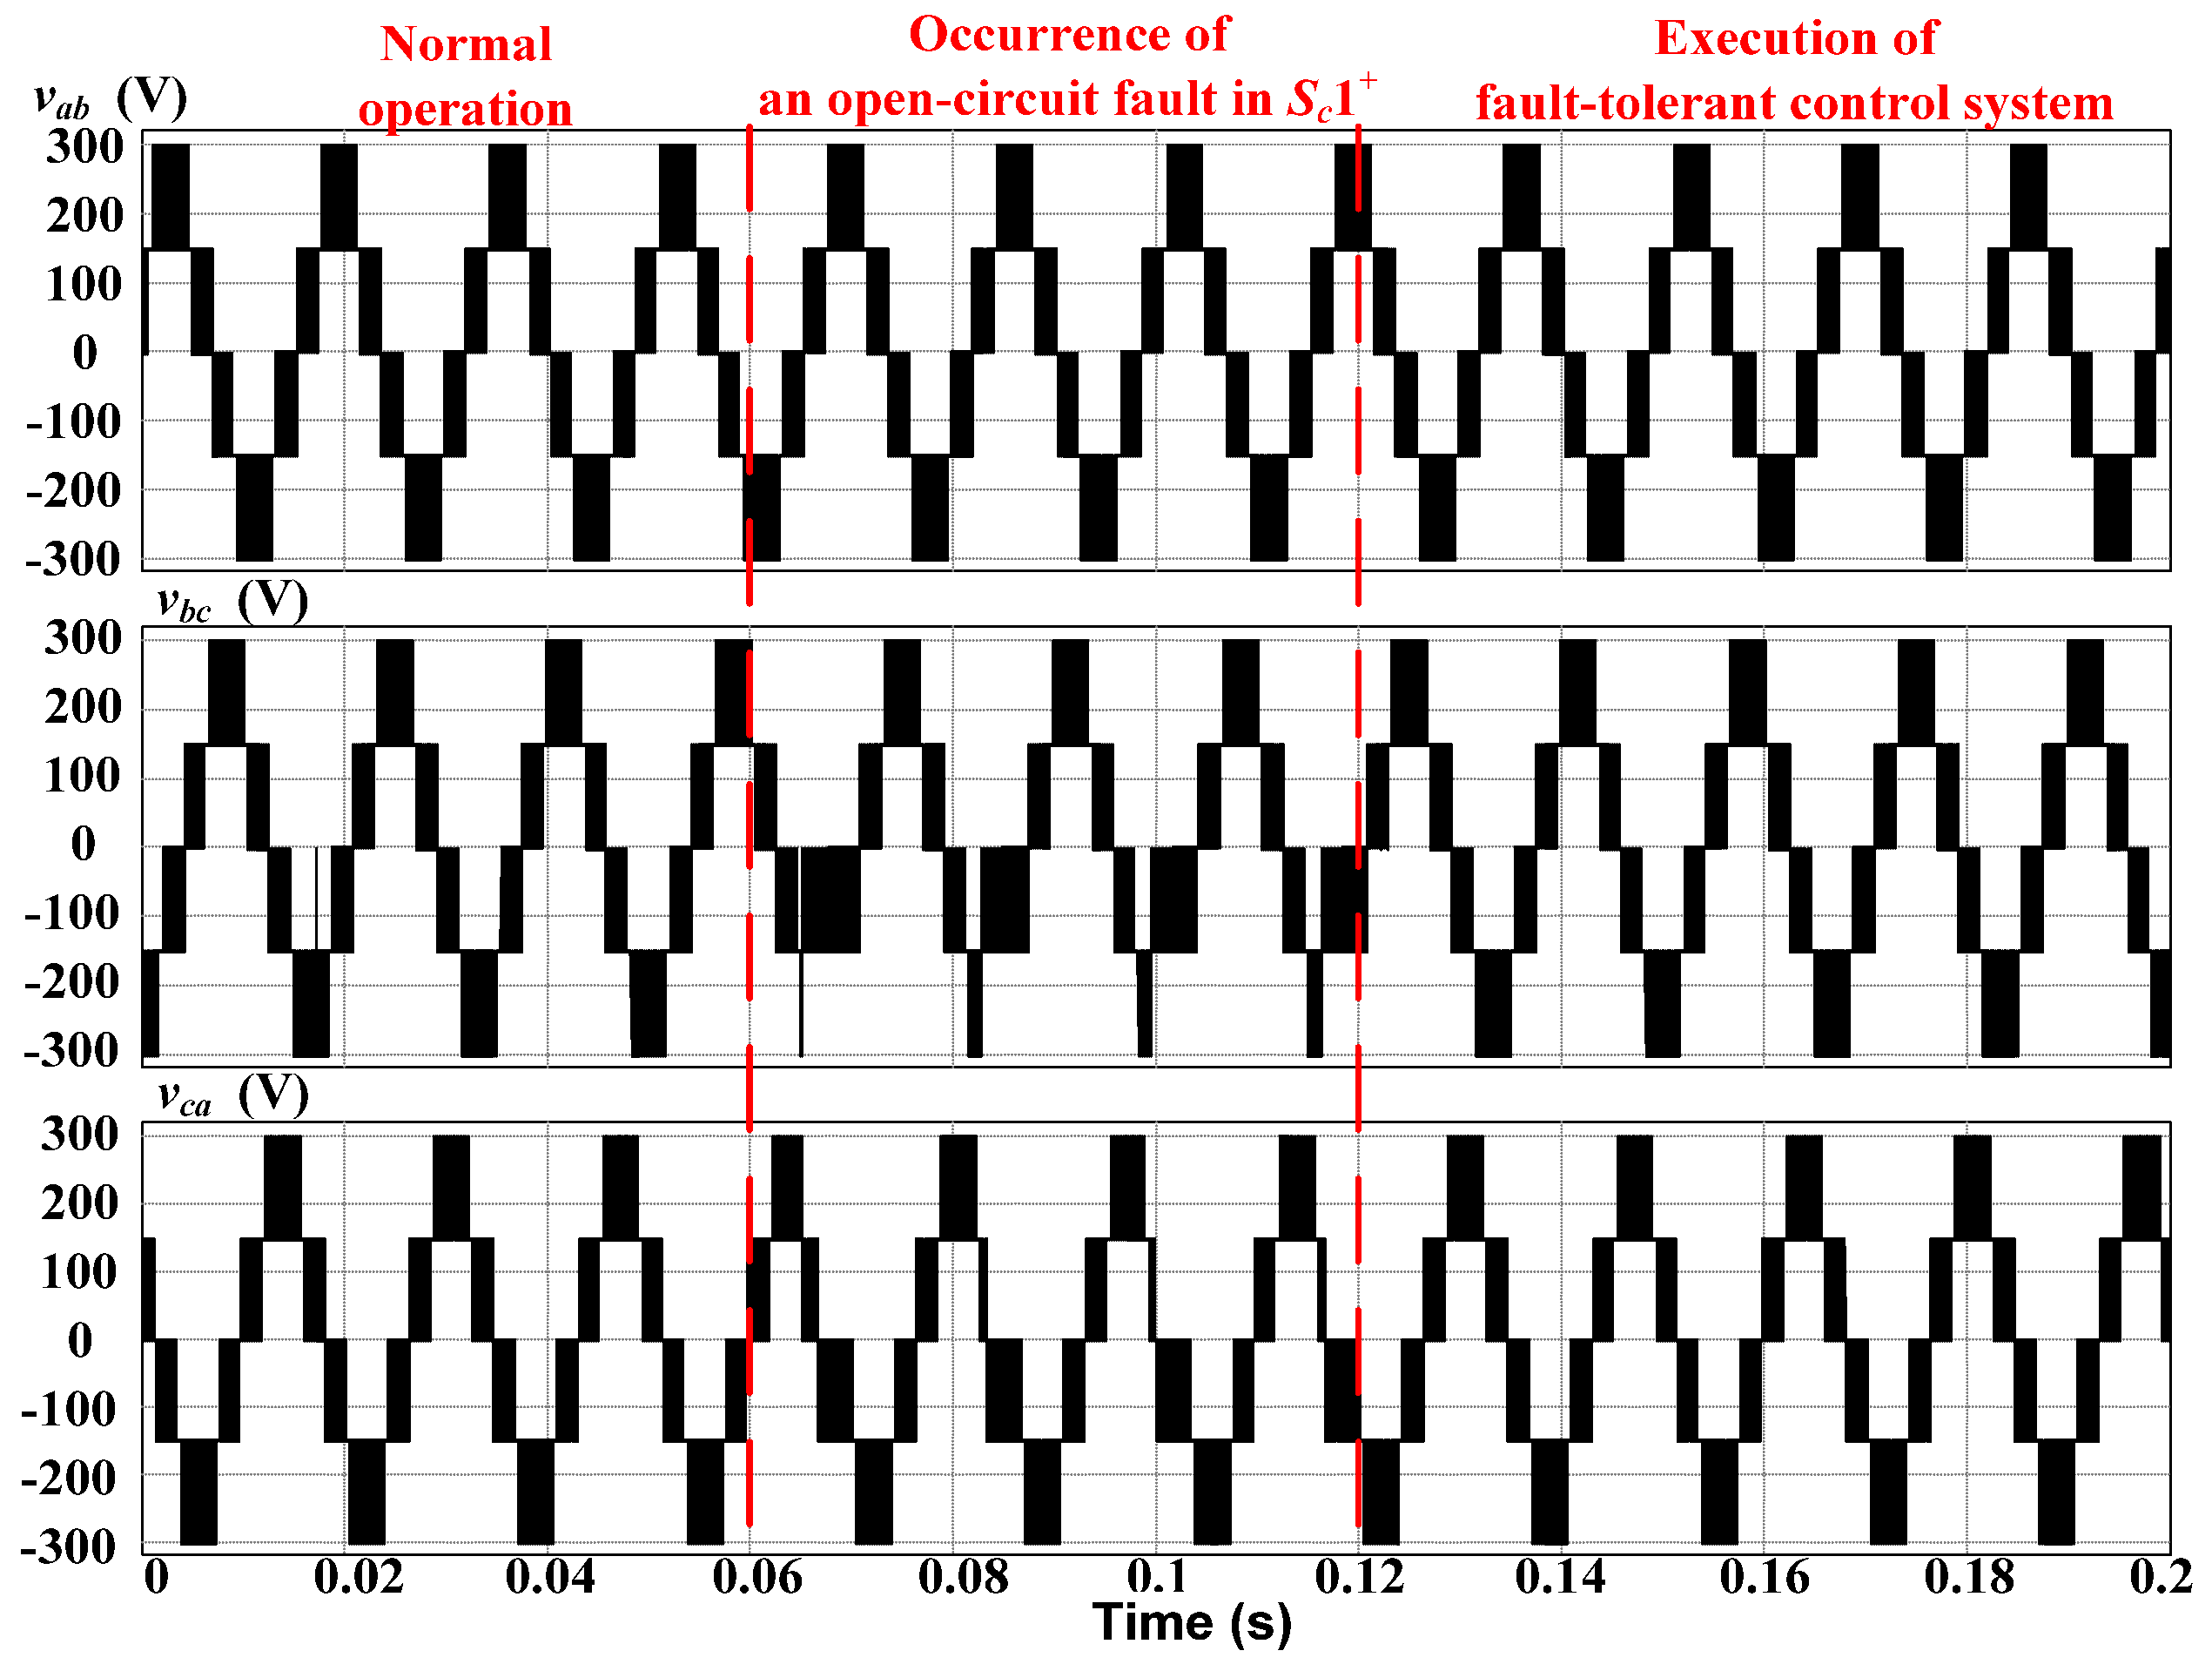
4.2. Fault-Tolerant Control Simulation

This study conducted a simulation of fault-tolerant control by using PSIM software. In the simulation, an open-circuit fault was considered to occur in Sa1+, Sb2, and Sc1+. The simulation results revealed changes in the output line voltage under three conditions, namely conditions of normal inverter operation, faulty switch operation, and fault-tolerant control execution. As shown in Figure 13, at 0.06 s, an open-circuit fault occurred in switch Sa1+ and distorted the three-phase output line voltage. The fault-tolerant control system was launched at 0.12 s. The a-phase half-bridge switches (Sa1+ and Sa2) were deactivated, but the b-phase, c-phase, and neutral-point switches still operated normally. Switch Ta in the 3 three-pole ac semiconductor switches was activated to replace the faulty a-phase leg with the spare leg, and the spare leg adopted the switching mode of the original a-phase leg to maintain a balanced three-phase output voltage. As shown in Figure 13, after the execution of the fault-tolerant control system, the three-phase output line voltage remained to be five levels. Accordingly, after the occurrence of the fault, the balanced three-phase output line voltage remained unchanged, and the quality of the output voltage was not reduced.
As presented in Figure 14, at 0.06 s, an open-circuit fault occurred in switch Sb2 and distorted the three-phase output line voltage. The fault-tolerant control system was launched at 0.12 s. The b-phase half-bridge switches (Sb1+ and Sb2) were deactivated, but the a-phase, c-phase, and neutral-point switches still operated normally. Switch Tb of the 3 three-pole ac semiconductor switches was activated to replace the faulty b-phase leg with the spare leg, and the spare leg adopted the switching mode of the original b-phase leg to maintain a balanced three-phase output voltage. After the launching of the fault-tolerant control system, the three-phase output line voltage remained to be five levels. Hence, after the occurrence of the fault, the balanced three-phase output line voltage remained unchanged, and the quality of the output voltage was not reduced.
As illustrated in Figure 15, at 0.06 s, an open-circuit fault occurred in switch Sc1+ and distorted the three-phase output line voltage. The tolerant control system was launched at 0.12 s. The c-phase half-bridge switches (Sc1+ and Sc2) were deactivated, but the a-phase, b-phase, and neutral-point switches still operated normally. Switch Tc of the 3 three-pole ac semiconductor switches was activated to replace the faulty c-phase leg with the spare leg, and the spare leg adopted the switching mode of the original c-phase leg to maintain the balanced three-phase output voltage. After the launching of the fault-tolerant control system, the three-phase output line voltage remained to be five levels. Accordingly, after the occurrence of the fault, the balanced three-phase output line voltage remained unchanged, and the quality of the output voltage was not reduced.
As shown in Figure 13, at 0.06 s, an open-circuit fault occurred in switch Sa1+ and distorted the output line voltage vab and vca. The fault-tolerant control system was launched at 0.12 s. As shown in Figure 13, after the execution of the fault-tolerant control system, the three-phase output line voltage waveforms remained to be five levels. Accordingly, after the occurrence of the fault, the balanced three-phase output line voltage remained unchanged, and the quality of the output voltage was not reduced. The same results are obtained by using the proposed fault-tolerant control system for an open-circuit fault occurred in switch Sb2 and Sc1+. As shown in Figure 14 and Figure 15, when the occurrence of the fault, by using the proposed fault-tolerant control system, the balanced three-phase output line voltage still remained unchanged, and the quality of the output voltage was not reduced.
The fault-tolerant control system can replace the faulty leg of any switch with a spare leg. Thus, after the occurrence of a fault, the three-phase output voltage is unaffected and a loading reduction is not required. The operating mode of the fault-tolerant control system is simple. Therefore, if a fault occurs, apart from changing the switching state of the switches, it is not necessary to adjust the phase angle of the reference voltage signal in a pulse width modulation (PWM) mechanism to maintain a balanced three-phase system. The proposed fault-tolerant control system can prevent economic losses and even casualties caused by faults and can substantially increase system utilization rates and expand system applications. In order to make the process of the proposed fault-tolerant control clearer, use the flow chart, shown in Figure 16, to explain.

5. Conclusions

This study proposes a fault-tolerant diagnosis system based on chaos theory and extension theory for locating a faulty power transistor in a three-level T-type inverter. The proposed system not only obviates the necessity of learning but also has the capability of generating fault tolerance. Therefore, it can reduce the influence of interference signals. In addition, the proposed system can perform control procedures immediately after any inverter switch fails, thus providing continuous power supply to and improving the power supply reliability of the three-level T-type inverter. The test results showed that the proposed fault diagnosis method can detect open-circuit faults in 12 power transistor switches by using only low-cost voltage sensors, and the final accuracy rate is 100%, demonstrating that the proposed fault diagnosis method has a good effect on three-level T-type inverters. The results also indicated that after the consideration of errors, the proposed fault diagnosis system could still correctly detect the fault category. Therefore, regardless of whether accurate or erroneous test data are used, the proposed system can correctly detect the fault category. After the failure of any switch, the proposed fault-tolerant control system can still control the output line voltage and maintain the three-phase balance; this thus verifies the feasibility of the proposed system. Therefore, the proposed fault-tolerant control system can prevent economic losses and even casualties caused by faults and can substantially increase system utilization rates and expand system applications.

Author Contributions

The conceptualization was proposed by K.-H.C., who also was responsible for writing-review and editing this paper. L.-Y.C. completed the formal analysis of the fault detection based on chaos theory and extension theory. F.-Q.X. carried out the data curation, software program and experimental validation. K.-H.C. completed the formal analysis of tolerant control and was in charge of project administration.

Funding

This research was funded by the Ministry of Science and Technology, Taiwan, under the Grant Number MOST 103-2221-E-167-015-MY3.

Acknowledgments

The authors gratefully acknowledge the support of the Ministry of Science and Technology, Taiwan, under the Grant Number MOST 103-2221-E-167-015-MY3.

Conflicts of Interest

The authors of the manuscript declare that there is no conflict of interest with any of the commercial identities mentioned in the manuscript.

References

  1. Schweizer, M.; Kolar, J.W. Design and implementation of a highly efficient three-level T-type converter for low-voltage applications. IEEE Trans. Power Electron. 2013, 28, 899–907. [Google Scholar] [CrossRef]
  2. Escalante, M.F.; Vannier, J.C.; Arzande, A. Flying capacitor multilevel inverters and DTC motor drive applications. IEEE Trans. Ind. Electron. 2002, 49, 809–815. [Google Scholar] [CrossRef]
  3. Rodriguez, J.I.; Leeb, S.B. A multilevel inverter topology for inductively coupled power transfer. IEEE Trans. Power Electron. 2006, 21, 1607–1617. [Google Scholar] [CrossRef]
  4. Daher, S.; Schmid, J.; Antunes, F.L.M. Multilevel inverter topologies for stand-alone PV systems. IEEE Trans. Ind. Electron. 2008, 55, 2703–2712. [Google Scholar] [CrossRef]
  5. Naik, R.L.; Udaya, K.R.Y. A novel technique for control of cascaded multilevel inverter for photovoltaic power supplies. In Proceedings of the 2005 European Conference on Power Electronics and Applications, Dresden, Germany, 11–14 September 2005; pp. 1–9. [Google Scholar]
  6. Chen, L.; Hu, L.; Chen, L.F.; Deng, Y.; He, X.N. A multilevel converter topology with fault-tolerant ability. IEEE Trans. Power Electron. 2005, 20, 405–415. [Google Scholar] [CrossRef]
  7. Khomfoi, S.; Tolbert, L.M. Fault diagnostic system for a multilevel inverter using a neural network. IEEE Trans. Power Electron. 2007, 22, 1062–1069. [Google Scholar] [CrossRef]
  8. Choi, U.; Lee, K.; Blaabjerg, F. Diagnosis and tolerant strategy of an open-switch fault for T-type three-level inverter systems. IEEE Trans. Ind. Appl. 2014, 50, 495–508. [Google Scholar] [CrossRef]
  9. Topcu, A.; Sozer, Y. Multiple device open circuit fault diagnosis for T-Type multilevel inverters. In Proceedings of the 2018 IEEE Energy Conversion Congress and Exposition (ECCE), Portland, OR, USA, 23–27 September 2018; pp. 4056–4061. [Google Scholar]
  10. Wang, K.; Tang, Y.; Zhang, C. Open-circuit fault diagnosis and tolerance strategy applied to four-wire T-type converter systems. IEEE Trans. Power Electron. 2019, 34, 5764–5778. [Google Scholar] [CrossRef]
  11. Peuget, R.; Courtine, S.; Rognon, J. Fault detection and isolation on a PWM inverter by knowledge-based model. IEEE Trans. Ind. Appl. 1998, 34, 1318–1326. [Google Scholar] [CrossRef]
  12. Kato, T.; Nagata, M.; Maki, K.; Kojima, H.; Souma, K.; Iwaji, Y. Motor insulation aging diagnosis with pre-installed current sensors for inverter control. In Proceedings of the 2018 XIII International Conference on Electrical Machines (ICEM), Alexandroupoli, Greece, 3–6 September 2018; pp. 1894–1899. [Google Scholar]
  13. Martin-Diaz, I.; Morinigo-Sotelo, D.; Duque-Perez, O.; Romero-Troncoso, R.J. An experimental comparative evaluation of machine learning techniques for motor fault diagnosis under various operating conditions. IEEE Trans. Ind. Appl. 2018, 54, 2215–2224. [Google Scholar] [CrossRef]
  14. Torabi, N.; Sundaram, V.M.; Toliyat, H.A. On-line fault diagnosis of multi-phase drives using self-recurrent wavelet neural networks with adaptive learning rates. In Proceedings of the IEEE Applied Power Electronics Conference and Exposition (APEC), Tampa, FL, USA, 26–30 March 2017; pp. 570–577. [Google Scholar]
  15. Chowdhury, D.; Bhattacharya, M.; Khan, D.; Saha, S.; Dasgupta, A. Wavelet decomposition based fault detection in cascaded H-bridge multilevel inverter using artificial neural network. In Proceedings of the 2nd IEEE International Conference on Recent Trends in Electronics, Information Communication Technology (RTEICT), Bangalore, India, 19–20 May 2017; pp. 1931–1935. [Google Scholar]
  16. Xu, J.; Song, B.; Zhang, J.; Xu, L. A new approach to fault diagnosis of multilevel inverter. In Proceedings of the Chinese Control and Decision Conference (CCDC), Shenyang, China, 9–11 June 2018; pp. 1054–1058. [Google Scholar]
  17. Awadallah, M.A.; Morcos, M.M. Diagnosis of switch open-circuit fault in PM brushless DC motor drives. In Proceedings of the Large Engineering Systems Conference on Power Engineering, Montreal, QC, Canada, 7–9 May 2003; pp. 69–73. [Google Scholar]
  18. Song, Y.; Wang, B. Survey on reliability of power electronic systems. IEEE Trans. Power Electron. 2013, 28, 591–604. [Google Scholar] [CrossRef]
  19. Zhang, T.; Wang, F.; Fu, W. Fault detection and isolation for redundant inertial measurement unit under quantization. Appl. Sci. 2018, 8, 865. [Google Scholar] [CrossRef]
  20. Aleenejad, M.; Mahmoudi, H.; Moamaei, P.; Ahmadi, R. A new fault-tolerant strategy based on a modified selective harmonic technique for three-phase multilevel converters with a single faulty cell. IEEE Trans. Power Electron. 2016, 31, 3141–3150. [Google Scholar] [CrossRef]
  21. Xu, S.; Zhang, J.; Hang, J. Investigation of a fault-tolerant three-level T-type inverter system. IEEE Trans. Ind. Appl. 2017, 53, 4613–4623. [Google Scholar] [CrossRef]
  22. Wang, X.; Shen, Y. Fault-Tolerant Control strategy of a wind energy conversion system considering multiple fault reconstruction. Appl. Sci. 2018, 8, 794. [Google Scholar] [CrossRef]
  23. Hosseinzadeh, M.; Salmasi, F.R. Fault-tolerant supervisory controller for a hybrid AC/DC micro-grid. IEEE Trans. Smart Grid 2018, 9, 2809–2823. [Google Scholar] [CrossRef]
  24. Chao, K.H.; Ho, S.H.; Wang, M.H. Modeling and fault diagnosis of a photovoltaic system. Electr. Power Syst. Res. 2008, 78, 97–105. [Google Scholar] [CrossRef]
  25. Li, Y.; Yuan, C.; Huang, Y. A novel watermarking technology based on Lorenz chaotic attractor. In Proceedings of the 2009 International Conference on Computational Intelligence and Natural Computing, Wuhan, China, 6–7 June 2009; Volume 2, pp. 330–332. [Google Scholar]
  26. Li, M.; Li, G. Based on theory of extenics research assessment and classification of soil erosion. In Proceedings of the World Automation Congress, Puerto Vallarta, Mexico, 24–28 June 2012; pp. 1–6. [Google Scholar]
Figure 1. The architecture of fault-tolerant control system for a three-level T-type inverter.
Applsci 09 03071 g001
Figure 2. The architecture of three-level T-type inverter.
Applsci 09 03071 g002
Figure 3. The output voltage waveforms of three phases of inverter operating at output voltage frequency of 60 Hz and under conditions of normal switch operation: (a) Phase voltage vao; (b) phase voltage vbo; (c) phase voltage vco.
Applsci 09 03071 g003
Figure 4. The output voltage waveform of three phases of inverter operating at 60 Hz and under conditions of faulty Sa1+ operation: (a) Phase voltage vao; (b) phase voltage vbo; (c) phase voltage vco.
Applsci 09 03071 g004
Figure 5. Chaotic states scatter diagram and corresponding chaos eyes.
Applsci 09 03071 g005
Figure 6. Chaotic scatter diagrams of each phase voltage of the inverter operating at 60 Hz and under normal switch operation: (a) Phase voltage vao; (b) phase voltage vbo; (c) phase voltage vco.
Applsci 09 03071 g006
Figure 7. Chaotic scatter diagrams of each phase voltage of the inverter operating at 60 Hz and under conditions of a faulty Sa1+: (a) Phase voltage vao; (b) phase voltage vbo; (c) phase voltage vco.
Applsci 09 03071 g007
Figure 8. Schematic of the elementary correlation function.
Applsci 09 03071 g008
Figure 9. The architecture of proposed three-level T-type inverter.
Applsci 09 03071 g009
Figure 10. Tolerant control state when an open-circuit fault occurs in inverter switch Sa1+.
Applsci 09 03071 g010
Figure 11. Tolerant control state when an open-circuit fault occurs in inverter switch Sb2.
Applsci 09 03071 g011
Figure 12. Fault-tolerant control state for an open-circuit fault occurring in Sc1+.
Applsci 09 03071 g012
Figure 13. The output voltage of Sa1+ after the occurrence of an open-circuit fault and the activation of fault-tolerant control.
Applsci 09 03071 g013
Figure 14. The output voltage of Sb2 after the occurrence of an open-circuit fault and the activation of fault-tolerant control.
Applsci 09 03071 g014
Figure 15. The output voltage of Sc1+ after the occurrence of an open-circuit fault and the activation of fault-tolerant control.
Applsci 09 03071 g015
Figure 16. The flow chart of the proposed fault-tolerant control system in case of any power switch fault.
Applsci 09 03071 g016
Table 1. Power transistor fault categories.
Fault StateCategory
Switch Sa1+ failsF1
Switch Sa1 or Sa2+ failsF2
Switch Sa2 failsF3
Switch Sb1+ failsF4
Switch Sb1 or Sb2+ failsF5
Switch Sb2 failsF6
Switch Sc1+ failsF7
Switch Sc1 or Sc2+ failsF8
Switch Sc2 failsF9
Table 2. Feature values of chaos eyes under various fault states (inverter frequency = 60 Hz).
PhaseFault CategoryC1X axisC1Y axisC2X axisC2Y axis
a-phase
chaos eye
feature value
F1−0.049−39.9880.046−42.584
F2−0.04632.7890.04930.448
F3−0.068−1.4290.07517.557
F4−0.074−36.2220.067−11.218
F5−0.07915.8430.06913.017
F6−0.07−24.9130.08−31.164
F7−0.06−8.1530.057−4.901
F8−0.0815.6310.0713.255
F9−0.052−6.240.051−6.531
b-phase
chaos eye
feature value
F1−0.08−0.08−0.08−0.08
F2−0.07−0.07−0.07−0.07
F3−0.049−0.049−0.049−0.049
F4−0.045−0.045−0.045−0.045
F5−0.067−0.067−0.067−0.067
F6−0.075−0.075−0.075−0.075
F7−0.052−0.052−0.052−0.052
F8−0.058−0.058−0.058−0.058
F9−0.053−0.053−0.053−0.053
c-phase
chaos eye
feature value
F1−0.068−0.068−0.068−0.068
F2−0.075−0.075−0.075−0.075
F3−0.08−0.08−0.08−0.08
F4−0.069−0.069−0.069−0.069
F5−0.049−0.049−0.049−0.049
F6−0.046−0.046−0.046−0.046
F7−0.052−0.052−0.052−0.052
F8−0.052−0.052−0.052−0.052
F9−0.058−0.058−0.058−0.058
Table 3. Fault detection results under the failure of different switches in a-phase (inverter frequency = 60 Hz).
Fault CategoryOutput Weight ValueDetection Result
F1F2F3
F10.782085−0.564565−0.591532F1
F2−0.5448650.861617−0.629411F2
F3−0.037735−0.3785460.553326F3
Table 4. Fault detection results under the failure of different switches in b-phase (inverter frequency = 60 Hz).
Fault CategoryOutput Weight ValueDetection Result
F4F5F6
F40.780133−0.549192−0.594745F4
F5−0.5723780.872429−0.648071F5
F6−0.225007−0.3466860.701689F6
Table 5. Fault detection results under the failure of different switches in c-phase (inverter frequency = 60 Hz).
Fault CategoryOutput Weight ValueDetection Result
F7F8F9
F70.813761−0.569932−0.600617F7
F8−0.5497370.884781−0.62921F8
F9−0.253144−0.3519580.521521F9
Table 6. Fault detection results under the failure of different switches in a-phase and addition of ±5% erroneous data (inverter frequency = 60 Hz).
Fault CategoryError PercentageOutput Weight ValueDetection Result
F1F2F3
F15%0.227338−0.577322−0.589176F1
F1−5%0.563368−0.512827−0.593788F1
F25%−0.5549980.442223−0.617735F2
F2−5%−0.5142440.598609−0.653885F2
F35%0.0491609−0.396360.37029F3
F3−5%−0.124961−0.3610710.709824F3
Table 7. Fault detection results under the failure of different switches fail in b-phase and addition of ±5% erroneous data (inverter frequency = 60 Hz).
Fault CategoryError PercentageOutput Weight ValueDetection Result
F4F5F6
F45%0.225285−0.581416−0.59255F4
F4−5%0.565218−0.498222−0.59684F4
F55%−0.5555540.510485−0.629454F5
F5−5%−0.5420880.536848−0.665188F5
F65%−0.147346−0.3629080.727323F6
F6−5%−0.30369−0.3317950.639154F6
Table 8. Fault detection results under the failure of different switches in c-phase and addition of ±5% erroneous data (inverter frequency = 60 Hz).
Fault CategoryError PercentageOutput Weight ValueDetection Result
F7F8F9
F75%0.281603−0.581739−0.598714F7
F7−5%0.51428−0.517926−0.602419F7
F85%−0.5510610.455688−0.617525F8
F8−5%−0.5223040.586427−0.654039F8
F95%−0.17552−0.3670970.50828F9
F9−5%−0.330461−0.3368160.514661F9

