Occam’s Razor for Big Data? On Detecting Quality in Large Unstructured Datasets
 ,
, 
 and
and 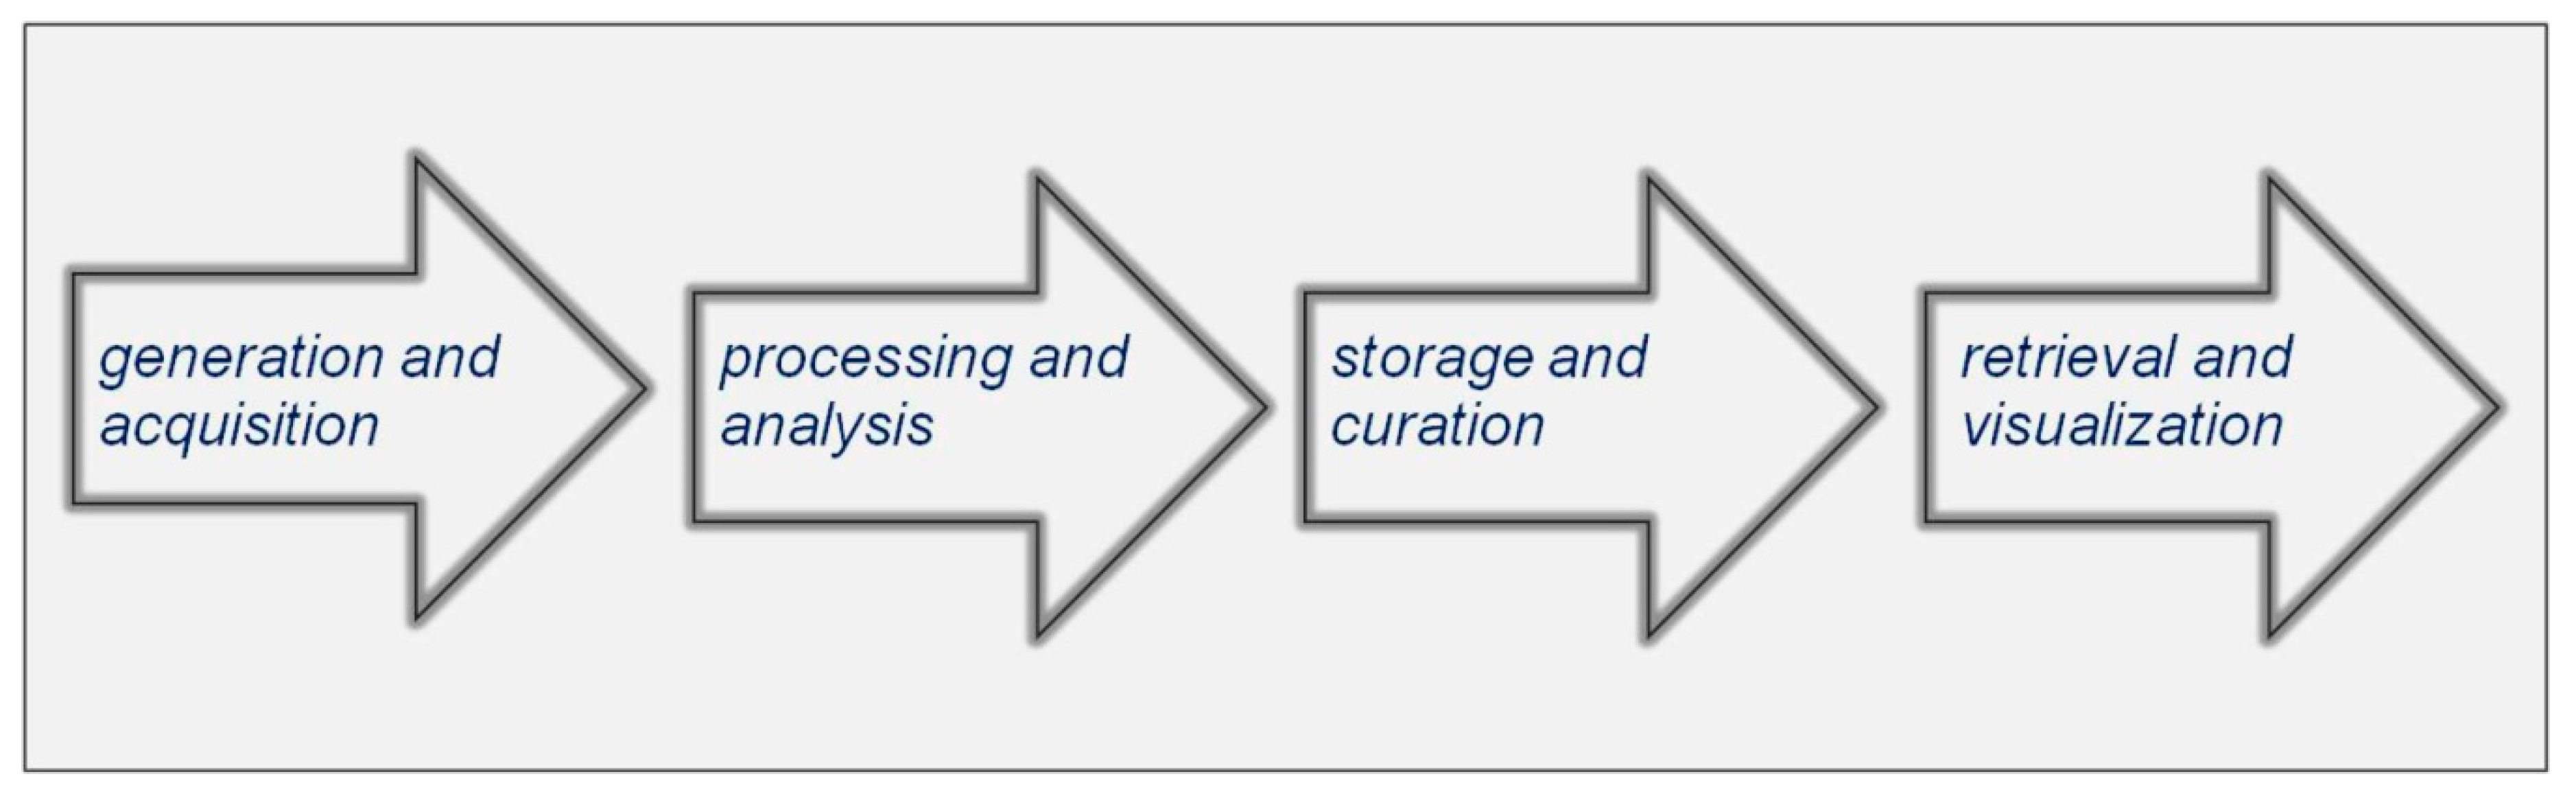
Abstract
1. Introduction
2. Testing Big Data Quality: Potential and Limitations
- (a)
- Uniqueness—the volumes of big datasets are mainly presented in the scale of EXA, PETA, or ZETA bytes [8]. This means that such datasets are retrieved from many specific unique sources, which cannot be easily exchanged by other optional e. q. values from sensor networks located in a specific area. Another reason for is related to the time necessary for the data production and the collection time, and it is not rare that these move into the range of tens of months or more [9].
- (b)
- A-dimensionality—big data mostly have no concrete structure, are unsorted, and their value distribution functions are typically unknown [10]. For many big data types, it is impossible to sort the data according to the value of a specific parameter (e.g., speech samples, pictures), because they are not straightforwardly comparable.
- (c)
- Specificity—this feature has much in common with data uniqueness. In general, the datasets are retrieved from many sources, and their content is quite specific. This means that what is valid for one dataset need not be for another. This specificity can have many different reasons—like the data type, resource type, geographical context [11], or other.
- (d)
- Cost—their storing and processing requires large and expensive, high-capacity data stores and powerful distributed computing systems.
- (e)
- Unpredictability—it is mostly unknown which are the “correct” or “expected” data values. This implies that the data optimization cannot be performed at the same time as the data collection. To predict the data quality, it is mostly necessary to analyze the entire dataset.
2.1. Big Data Reading and Storing
2.2. Ecosystem and Tools for Big Data Processing
- (a)
- MapReduce [16] (Hadoop v2)—allows the storing of files via HDFS or the processing of stored data values. This solution uses an efficiently scalable distributed architecture.
- (b)
- Computing Engines [17] (Spark, Storm)—approximately 100x faster than traditional MapReduce, used in many solutions.
- (c)
- Processing Pipelines [18] (Kafka, Samza)—basically targeted on efficient caching of procedures that allow further processing.
- (d)
- Databases [19] (Cassandra, Hive)—allow multiple-times faster data search in comparison to the traditional SQL-based approach.
- (e)
- AI-based frameworks [19] (Mahout, ML over Spark)—help to use the traditional machine learning methods on big datasets.
2.3. The Problem of Big Data Quality Evaluation
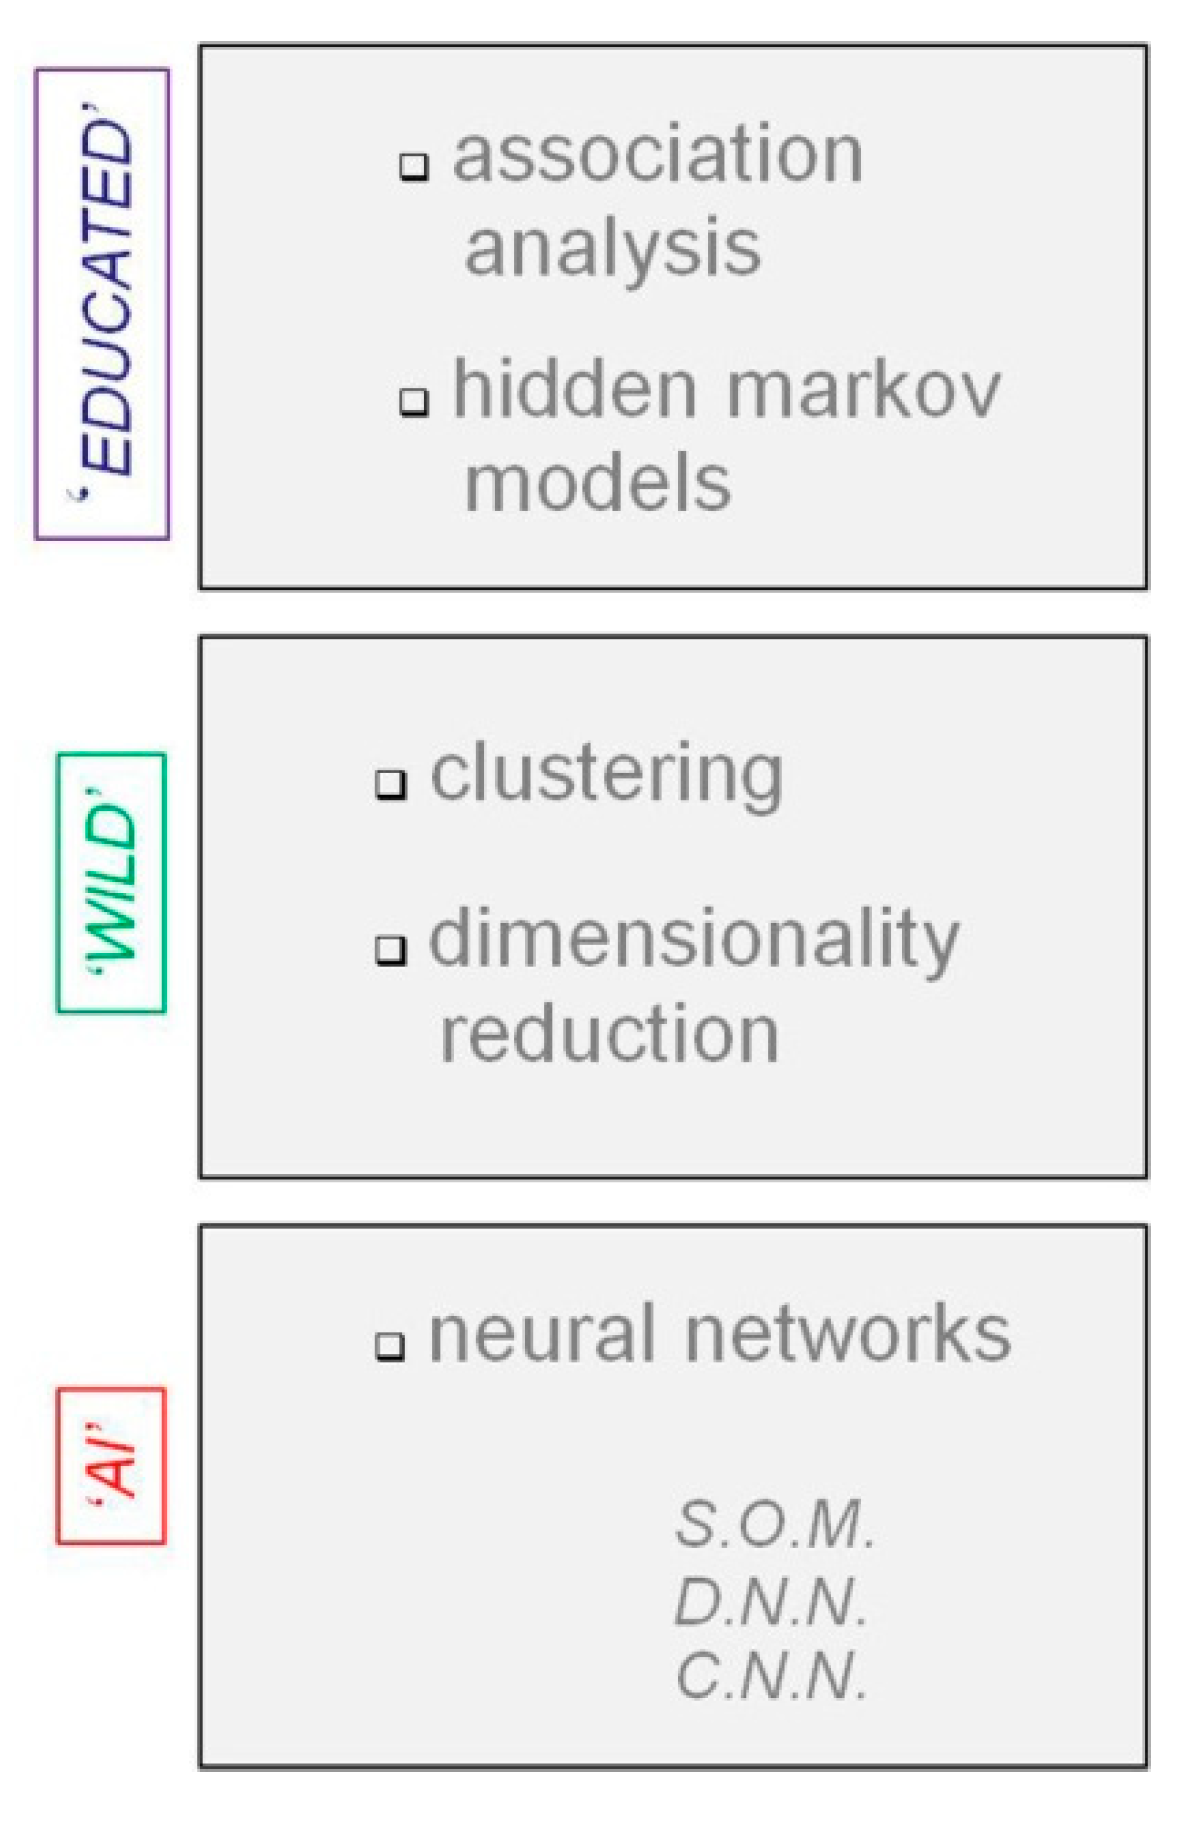
3. Big Data Analytics: From Machine Learning to Artificial Intelligence
3.1. Clustering Algorithms: Old Dogs for New Tricks
- (1)
- Using building blocks from the parameterization of a large number of cluster algorithms to optimize the clustering accuracy,
- (2)
- A combination of local and global heuristics that outperforms the speedups enabled by any single clustering algorithm, and
- (3)
- An unsupervised automated (machine learning) procedure to construct many new clustering algorithms from the training data.
3.2. SOM for Single-Pixel Change Detection in Large Sets of Image Data
4. Can Cities Become Really “Smart” or Will the Big Data Jungle Continue to Proliferate?
- The variety of different types of data and the common unstructured nature of data arising from (i) different application domains, (ii) different devices delivering the data, and (iii) proprietary solutions;
- The fact that there is not “the one big data” algorithm—artificial intelligence as a research field provides a lot of different algorithmic and technical approaches; nevertheless, all of them are application-specific;
- That data could be error-prone;
- Data could simply be misused (i.e., using data in a “wrong” way or within the wrong context or domain);
- Computing resources and tools are not braced for coping with massive amounts of data.
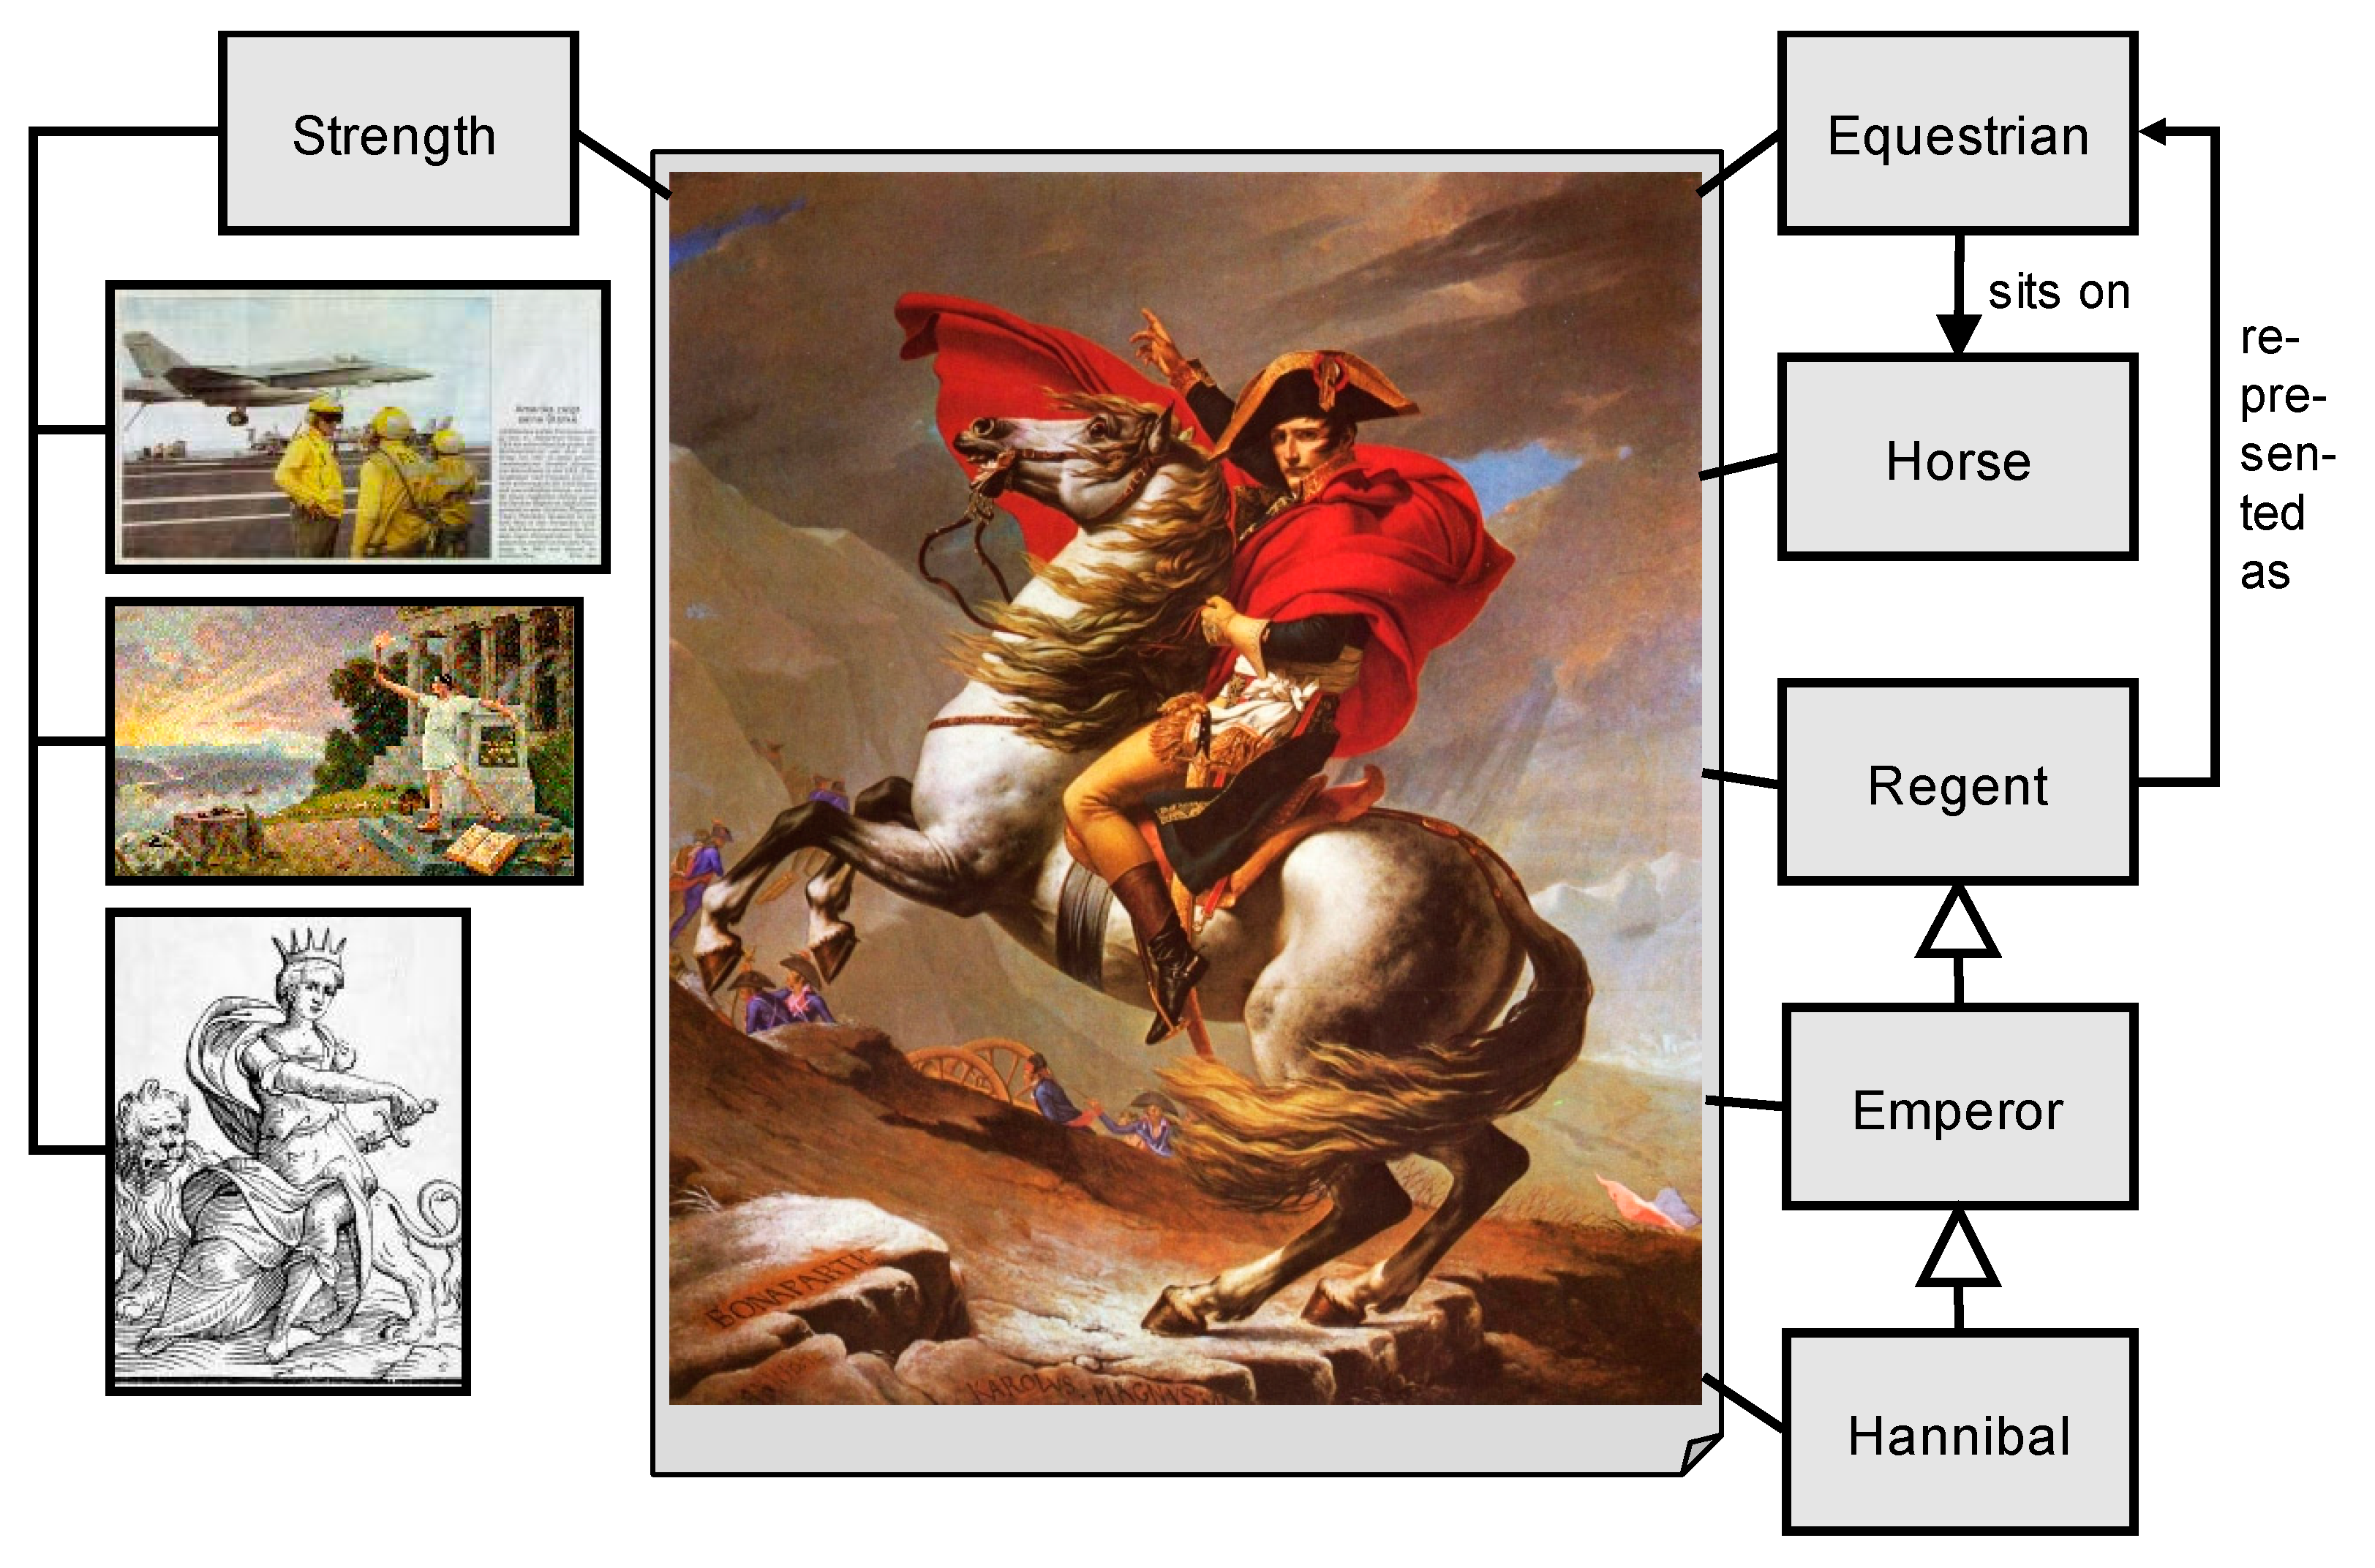
5. The Chicken-or-the-Egg Paradoxon of Model Building or Why We Need Subjective Views and Pragmatic Methods to Analyze Big Data Contents
A is a Model {NapoleonCrossingTheAlps is a HannibalPicture}
B is a Model {NapoleonCrossingTheAlps is an EquestrianStatue}
A2 is an A {NapoleonCrossingTheAlps is an ImageOfStrength}
6. Science and Culture from West to East or How We Relate Emotionally to Big Data and Artificial Intelligence
7. Conclusions
- Start by asking the right question(s);
- Look for the right clues;
- Draw the right conclusions from the clues available.
Funding
Acknowledgments
Conflicts of Interest
References
- Cisco Global Cloud Index Methodology and Forecast 2016–2021; Cisco Systems: San Jose, CA, USA, 2018.
- Kitchin, R. Big data, new epistemologies and paradigm shifts. Big Data Soc. 2014, 1, 1–12. [Google Scholar] [CrossRef]
- Anderson, C. The end of theory: The data deluge makes the scientific method obsolete. Wired Magazine. 23 June 2008. Available online: http://www.wired.com/science/discoveries/magazine/16-07/pb_theory (accessed on 25 July 2019).
- Ockham, W. Theory of Terms: Part 1 of the Summa Logicae; University of Notre Dame Press: Notre Dame, IN, USA, 1974. [Google Scholar]
- Seni, G.; Elder, J. Ensemble Methods in Data Mining: Improving Accuracy through Combining Predictions; Morgan and Claypool: San Rafael, CA, USA, 2010. [Google Scholar]
- Zikopoulos, P.C.; Eaton, C.; DeRoos, D.; Deutsch, T.; Lapis, G. Understanding Big Data; McGraw Hill: New York, NY, USA, 2012. [Google Scholar]
- Sehring, W.; Kurz, M.; Fesl, J.; Ekseth, O.K.; Dresp-Langley, B.; Gohshi, S. On the perception of meaning in big data. In Proceedings of the 11 International Conference on Advanced Cognitive Technologies and Applications, Venice, Italy, 5–9 May 2019. [Google Scholar]
- Liu, W.; Park, E.K. Big Data as an e-Health Service. In Proceedings of the International Conference on Computing, Networking and Communications (ICNC), Honolulu, HI, USA, 3–6 February 2014; IEEE: Piscataway, NJ, USA, 2014. [Google Scholar]
- Sivarajah, U.; Kamal, M.M.; Irani, Z.; Weerakkody, V. Critical analysis of Big Data challenges and analytical methods. J. Bus. Res. 2017, 70, 263–286. [Google Scholar] [CrossRef]
- Sabharwal, S.; Gupta, S.; Thirunavukka, K. Insight of big data analytics in healthcare industry. In Proceedings of the International Conference on Computing, Communication and Automation (ICCCA), Noida, India, 29–30 April 2016. [Google Scholar]
- Thanh, T.D.; Mohan, S.; Choi, E.; Kim, S.; Kim, P. A Taxonomy and Survey on Distributed File Systems. In Proceedings of the Fourth International Conference on Networked Computing and Advanced Information Management, Gyeongju, Korea, 2–4 September 2008. [Google Scholar]
- Sarkar, D.; Rakesh, N.; Mishra, K.K. Content delivery networks: Insights and recent advancement. In Proceedings of the Fourth International Conference on Parallel, Distributed and Grid Computing (PDGC), Waknaghat, India, 22–24 December 2016. [Google Scholar]
- Diogo, M.; Cabral, B.; Bernardino, J. Consistency Models of NoSQL Databases. Future Internet 2019, 11, 43. [Google Scholar] [CrossRef]
- Nereu, J.; Almeida, A.; Bernardino, J. Big Data Analytics: A Preliminary Study of Open Source Platforms. In Proceedings of the ICSOFT 2017-12th International Conference on Software Technologies, Madrid, Spain, 26–28 July 2017. [Google Scholar]
- Dean, J.; Ghemawat, S. MapReduce: Simplified Data Processing on Large Clusters. Mag. Commun. ACM 2008, 51, 107–113. [Google Scholar] [CrossRef]
- Hedjazi, M.A.; Kourbane, I.; Genc, Y.; Ali, B. A comparison of Hadoop, Spark and Storm for the task of large scale image classification. In Proceedings of the 26th Signal Processing and Communications Applications Conference (SIU), Izmir, Turkey, 2–5 May 2018. [Google Scholar]
- Gürcan, F.; Berigel, M. Real-Time Processing of Big Data Streams: Lifecycle, Tools, Tasks, and Challenges. In Proceedings of the 2nd International Symposium on Multidisciplinary Studies and Innovative Technologies (ISMSIT), Ankara, Turkey, 19–21 October 2018. [Google Scholar]
- Chacko, A.M.; Basheer, A.; Kumar, S.D. Capturing provenance for big data analytics done using SQL interface. In Proceedings of the IEEE Conference on Electrical Computer and Electronics (UPCON), Allahabad, India, 4–6 December 2015. [Google Scholar]
- Srinivasulu, A.; Subbarao, C.D.V.; Kumar, J. High dimensional datasets using hadoop mahout machine learning algorithms. In Proceedings of the International Conference on Computing and Communication Technologies, Hyderabad, India, 11–13 December 2014. [Google Scholar]
- Cai, L.; Zhu, Y. The Challenges of Data Quality and Data Quality Assessment in the Big Data Era. Data Sci. J. 2015, 14, 1–10. [Google Scholar] [CrossRef]
- Holder, L.B.; Haque, M.M.; Skinner, M.K. Machine learning for epigenetics and future medical applications. Epigenetics 2017, 12, 505–514. [Google Scholar] [CrossRef] [PubMed]
- Lv, Q.; Qiao, Y.; Ansari, N.; Jun, L.; Yang, J. Big data driven hidden markov model based individual mobility prediction at points of interest. IEEE Trans. Veh. Technol. 2017, 66, 5204–5216. [Google Scholar] [CrossRef]
- Abdel-Basset, M.; Mohamed, M.; Smarandache, F.; Chang, V. Neurotrophic association rule mining algorithm for big data analysis. Symmetry 2018, 10, 106. [Google Scholar] [CrossRef]
- Feldman, D.; Schmidt, M.; Sohler, C. Turning big data into tiny data: Constant-size core sets for k-means, PCA, and projective clustering. arXiv 2018, arXiv:1807.04518v1. [Google Scholar]
- Kendall, M.G. Rank Correlation Methods; American Psychological Association: Washington, DC, USA, 1948. [Google Scholar]
- Le Cun, Y.; Bengio, Y.; Hinton, G. Deep Learning. Nature 2015, 215, 437. [Google Scholar] [CrossRef]
- Krizhevsky, A.; Sutskever, I.; Hinton, G.E. ImageNet Classification with Deep Convolutional Neural Networks. In Advances in Neural Information Processing Systems; Pereira, F., Burges, C.J.C., Bottou, L., Weinberger, K.Q., Eds.; Curran Associates: Red Hook, NY, USA, 2012. [Google Scholar]
- Pliner, H.A.; Shendure, J.; Trapnell, C. Supervised classification enables rapid annotation of cell atlases. bioRxiv 2019. [Google Scholar] [CrossRef]
- Smith, A.M.; Walsh, J.R.; Long, J.; Davis, C.B.; Henstock, P.; Hodge, M.R.; Maciejewski, M.; Mu, X.J.; Ra, S.; Zhang, S.; et al. Deep learning of representations for transcriptomics-based phenotype prediction. bioRxiv 2019. [Google Scholar] [CrossRef]
- Wenliang, L.K.; Seitz, A.R. Deep Neural Networks for Modeling Visual Perceptual Learning. J. Neurosci. 2018, 38, 1617–1620. [Google Scholar] [CrossRef] [PubMed]
- Kohonen, T. Analysis of a simple self-organizing process. Biol. Cybern. 1982, 44, 135e140. [Google Scholar] [CrossRef]
- Kohonen, T. Self-organized formation of topologically correct feature maps. Biol. Cybern. 1982, 43, 59e69. [Google Scholar] [CrossRef]
- Kohonen, T. Self-Organizing Maps; Springer: Berlin/Heidelberg, Germany, 2001. [Google Scholar]
- Binder, H.; Hopp, L.; Lembcke, K.; Löffler-Wirth, H. Personalized Disease Phenotypes from Massive OMICs Data. In Artificial Intelligence: Concepts, Methodologies, Tools, and Applications; IGI Global: Hershey, PA, USA, 2017. [Google Scholar] [CrossRef]
- Clauset, A.; Moore, C.; Newman, M.E. Hierarchical structure and the prediction of missing links in networks. Nature 2008, 453, 98–101. [Google Scholar] [CrossRef] [PubMed]
- Lloyd, S. Least squares quantization in pcm. IEEE Trans. Inf. Theory 1982, 28, 129–137. [Google Scholar] [CrossRef]
- Pelleg, D.; Moore, A. Accelerating exact k-means algorithms with geometric reasoning. In Proceedings of the Fifth ACM SIGKDD International Conference on Knowledge Discovery and Data Mining, San Diego, CA, USA, 15–18 August 1999; pp. 277–281. [Google Scholar]
- Pelleg, D.; Moore, A.W. X-means: Extending k-means with efficient estimation of the number of clusters. In ICML; Carnegie Mellon University: Pittsburgh, PA, USA, 2000; Volume 1, pp. 727–734. [Google Scholar]
- Arthur, D.; Vassilvitskii, S. K-means++: The advantages of careful seeding. In Proceedings of the Eighteenth Annual ACM-SIAM Symposium on Discrete Algorithms, New Orleans, LA, USA, 7–9 January 2007; Society for Industrial and Applied Mathematics: Philadelphia, PA, USA; pp. 1027–1035. [Google Scholar]
- Yau, C.; žurauskienė, J. Pcareduce: Hierarchical clustering of single cell transcriptional profiles. BMC Bioinform. 2016, 17, 140. [Google Scholar]
- Bezdek, J.C.; Pal, N.R. Some new indexes of cluster validity. IEEE Trans. Syst. Man Cybern. Part B 1998, 28, 301–315. [Google Scholar] [CrossRef]
- Gasch, A.P.; Eisen, M.B. Exploring the conditional co-regulation of yeast gene expression through fuzzy k-means clustering. Genome Biol. 2002, 3, 0059-1. [Google Scholar] [CrossRef]
- Yeung, K.Y.; Ruzzo, W.L. Principal component analysis for clustering gene expression data. Bioinformatics 2001, 17, 763–774. [Google Scholar] [CrossRef] [PubMed]
- Kanungo, T.; Mount, D.M.; Netanyahu, N.S.; Piatko, C.D.; Silverman, R.; Wu, A.Y. An efficient k-means clustering algorithm: Analysis and implementation. IEEE Trans. Pattern Anal. Mach. Intell. 2002, 24, 881–892. [Google Scholar] [CrossRef]
- Vendramin, L.; Campello, R.J.; Hruschka, E.R. On the comparison of relative clustering validity criteria. In Proceedings of the SIAM International Conference on Data Mining, Calgary, AL, Canada, 2–4 May 2019; pp. 733–744. [Google Scholar]
- Kockara, S.; Mete, M.; Chen, B.; Aydin, K. Analysis of density based and fuzzy c-means clustering methods on lesion border extraction in dermoscopy images. BMC Bioinform. 2010, 11, 26. [Google Scholar] [CrossRef] [PubMed]
- Otair, M. Approximate k-nearest neighbor based spatial clustering using kd tree. Int. J. Database Manag. Syst. 2013, 5, 97. [Google Scholar] [CrossRef]
- Sibson, R. Slink: An optimally efficient algorithm for the single-link cluster method. Comput. J. 1973, 16, 30–34. [Google Scholar] [CrossRef]
- Ekseth, O.K.; Hvasshovd, S.-O. How an optimized DBSCAN implementation reduces execution-time and memory-requirements for large data-sets. In Proceedings of the Patterns 2019, Barcelona, Spain, 18–22 February 2018; Department of Computer Science (IDI), NTNU: Trondheim, Norway, 2018; pp. 6–11. [Google Scholar]
- Ekseth, O.K.; Hvasshovd, S.O. An empirical study of strategies boosts performance of mutual information similarity. In Proceedings of the International Conference on Artificial Intelligence and Soft Computing, Zakopane, Poland, 16–20 June 2019; pp. 321–332. Available online: http://www.wikicfp.com/cfp/servlet/event.showcfp?eventid=88588©ownerid=46167 (accessed on 29 June 2019).
- Ester, M.; Kriegel, H.P.; Sander, J.; Xu, X. A density-based algorithm for discovering clusters in large spatial databases with noise. In Proceedings of the KDD-96, Portland, Oregon, 2–4 August 1996; Institute for ComputerS cience, University of Munich: Miinchen, Germany, 1996; Volume 96, pp. 226–231. [Google Scholar]
- Jain, A.K.; Dubes, R.C. Algorithms for Clustering Data; Prentice-Hall Incorporated: Upper Saddle River, NJ, USA, 1988. [Google Scholar]
- Ole Kristian Ekseth. Hplysis: A High-Performance Software Library for Big-Data Machine-Learning. Available online: https://bitbucket.org/oekseth/hplysis-cluster-analysis-software/ (accessed on 6 June 2017).
- Changyong, F.; Hongyue, W.; Naiji, L.; Tian, C.; Hua, H.; Ying, L. Log-transformation and its implications for data analysis. Shanghai Arch. Psychiatry 2014, 26, 105. [Google Scholar]
- Qiu, X.; Wu, H.; Hu, R. The impact of quantile and rank normalization procedures on the testing power of gene differential expression analysis. BMC Bioinform. 2013, 14, 124. [Google Scholar] [CrossRef]
- Varoquaux, G.; Buitinck, L.; Louppe, G.; Grisel, O.; Pedregosa, F.; Mueller, A. Scikit-learn: Machine learning without learning the machinery. GetMobile: Mob. Comput. Commun. 2015, 19, 29–33. [Google Scholar] [CrossRef]
- Wu, J.; Xiong, H.; Chen, J. Adapting the right measures for k-means clustering. In Proceedings of the 15th ACM SIGKDD International Conference on Knowledge Discovery and Data Mining, Paris, France, 28 June–1 July 2009; pp. 877–886. [Google Scholar]
- Guo, M.; Wang, H.; Potter, S.S.; Whitsett, J.A.; Xu, Y. Sincera: A pipeline for single-cell rna-seq profiling analysis. PLoS Comput. Biol. 2015, 11, 1004575. [Google Scholar] [CrossRef]
- Mazandu, G.K.; Chimusa, E.R.; Mulder, N.J. Gene ontology semantic similarity tools: Survey on features and challenges for biological knowledge discovery. Brief. Bioinform. 2016, 18, 886–901. [Google Scholar] [CrossRef]
- Jain, A.K. Data clustering: 50 years beyond k-means. Pattern Recognit. Lett. 2010, 31, 651–666. [Google Scholar] [CrossRef]
- Ben-Hur, A.; Guyon, I. Detecting stable clusters using principal component analysis. In Functional Genomics: Methods and Protocols; Humana Press: New York, NY, USA, 2003; pp. 159–182. [Google Scholar]
- Hennig, C. Cluster-wise assessment of cluster stability. Comput. Stat. Data Anal. 2007, 52, 258–271. [Google Scholar] [CrossRef]
- Lawson, D.J.; Falush, D. Similarity Matrices and Clustering Algorithms for Population Identification Using Genetic Data; Department of Mathematics, University of Bristol: Bristol, UK, 2012. [Google Scholar]
- Valafar, F. Pattern recognition techniques in microarray data analysis. Ann. N. Y. Acad. Sci. 2002, 980, 41–64. [Google Scholar] [CrossRef] [PubMed]
- Patra, B.K.; Nandi, S.; Viswanath, P. A distance based clustering method for arbitrary shaped clusters in large datasets. Pattern Recognit. 2011, 44, 2862–2870. [Google Scholar] [CrossRef]
- Yeung, K.Y.; Haynor, D.R.; Ruzzo, W.L. Validating clustering for gene expression data. Bioinformatics 2001, 17, 309–318, PMID: 11301299. [Google Scholar] [CrossRef] [PubMed]
- Rousseeuw, P.J. Silhouettes: A graphical aid to the interpretation and validation of cluster analysis. J. Comput. Appl. Math. 1987, 20, 53–65. [Google Scholar] [CrossRef]
- Mallick, P.K.; Mihir, N.M.; Kumar, S. White Patch Detection in Brain MRI Image Using Evolutionary Clustering Algorithm. In Research Advances in the Integration of Big Data and Smart Computing; IGI Global: Hershey, PA, USA, 2016; pp. 323–339. [Google Scholar]
- Kim, K.; Hyunchul, A. Recommender systems using cluster-indexing collaborative filtering and social data analytics. Int. J. Prod. Res. 2017, 55, 5037–5049. [Google Scholar] [CrossRef]
- Marung, U.; Nipon, T.; Auephanwiriyakul, S. Top-N recommender systems using genetic algorithm-based visual-clustering methods. Symmetry 2016, 8, 54. [Google Scholar] [CrossRef]
- Kapil, S.; Meenu, C.; Ansari, M.D. On K-means data clustering algorithm with genetic algorithm. In Proceedings of the Fourth International Conference on Parallel, Distributed and Grid Computing (PDGC), Waknaghat, India, 22–24 December 2016. [Google Scholar]
- Kim, K.; Hyunchul, A. A recommender system using GA K-means clustering in an online shopping market. Expert Syst. Appl. 2008, 34, 1200–1209. [Google Scholar] [CrossRef]
- Ekseth, O.K.; Gribbestad, M.; Hvasshovd, S.O. Inventing wheels: Why improvements to established cluster algorithms fails to catch the wheel. In DISP—FCA Handbook; St. Huge College: Oxford, UK, 2019. [Google Scholar]
- Evolutionary Algorithms. In Encyclopedia of Machine Learning; Sammut, C., Webb, G.I., Eds.; Springer: Boston, MA, USA, 2011. [Google Scholar]
- Hakrabarti, D.; Kumar, R.; Tomkins, A. Evolutionary clustering. In Proceedings of the 12th ACM SIGKDD International Conference on Knowledge Discovery and Data Mining, Philadelphia, PA, USA, 20–23 August 2006. [Google Scholar]
- Hua, C.; Li, F.; Zhang, C.; Yang, J.; Wu, W. A Genetic XK-Means Algorithm with Empty Cluster Reassignment. Symmetry 2019, 11, 744. [Google Scholar] [CrossRef]
- Ahmed, M.N.; Yamany, S.M.; Mohamed, N.; Farag, A.A.; Moriarty, T. A modified fuzzy c-means algorithm for bias field estimation and segmentation of MRI data. IEEE Trans. Med. Imaging 2002, 21, 193–199. [Google Scholar] [CrossRef] [PubMed]
- Yang, Y. Image segmentation based on fuzzy clustering with neighborhood information. Opt. Appl. 2009, 39, 136–146. [Google Scholar]
- Legacy Documentation. Fuzzy Logic. 2004. Available online: https://reference.wolfram.com/legacy/applications/fuzzylogic/TOC.html (accessed on 25 July 2019).
- Cowgill, M.C.; Harvey, R.J.; Watson, L.T. A genetic algorithm approach to cluster analysis. Comput. Math. Appl. 1999, 37, 99–108. [Google Scholar] [CrossRef]
- De Hoon, M.J.; Imoto, S.; Nolan, J.; Miyano, S. Open source clustering software. Bioinformatics 2004, 20, 1453–1454. [Google Scholar] [CrossRef] [PubMed]
- Charrad, M.; Ghazzali, N.; Boiteau, V.; Niknafs, A.; Charrad, M.M. Package ‘nbclust’. J. Stat. Softw. 2014, 61, 1–36. [Google Scholar]
- Pedregosa, F.; Varoquaux, G.; Gramfort, A.; Michel, V.; Thirion, B.; Grisel, O.; Blondel, M.; Prettenhofer, P.; Weiss, R.; Dubourg, V.; et al. Scikit-learn: Machine learning in Python. J. Mach. Learn. Res. 2011, 12, 2825–2830. [Google Scholar]
- Narain, A.; Chandra, D.; Singh, R.K. Model order reduction using Fuzzy C-Means clustering. Trans. Inst. Meas. Control. 2014, 36, 992–998. [Google Scholar] [CrossRef]
- Sakthi, M.; Thanamani, A.S. An Effective Determination of Initial Centroids in K-Means Clustering Using Kernel PCA. Int. J. Comput. Sci. Inf. Technol. 2011, 2, 955–959. [Google Scholar]
- Kohonen, T. Automatic formation of topological maps of patterns in a self-organizing system. In Proceedings of the 2nd Scandinavian Conference on Image Analysis, Espoo, Finland, 15–17 June 1981; pp. 214–220. [Google Scholar]
- Kohonen. MATLAB Implementations and Applications of the Self-Organizing Map. 2014. Available online: http://docs.unigrafia.fi/publications/kohonen_teuvo/MATLAB_implementations_and_applications_of_the_self_organizing_map.pdf (accessed on 25 July 2019).
- Hubel, D.H.; Wiesel, T.N. Receptive fields of single neurons in the cat’s striate cortex. J. Physiol. 1959, 148, 574–591. [Google Scholar] [CrossRef]
- Hubel, D.H. Integrative processes in central visual pathways of the cat. J. Opt. Soc. Am. 1963, 53, 58–66. [Google Scholar] [CrossRef]
- Hubel, D.H.; Wiesel, T.N. Receptive fields and functional architecture in two non-striate visual areas (18 and 19) of the cat. J. Neurophysiol. 1965, 28, 229–289. [Google Scholar] [CrossRef] [PubMed]
- Hubel, D.H.; Wiesel, T.N. Receptive fields and functional architecture of monkey striate cortex. J. Physiol. 1968, 195, 215–243. [Google Scholar] [CrossRef] [PubMed]
- Dresp, B. The effect of practice on the visual detection of near-threshold lines. Spat. Vis. 1998, 11, 1–13. [Google Scholar] [CrossRef]
- Dresp, B. Do positional thresholds define a critical boundary in long-range detection facilitation with co-linear lines? Spat. Vis. 2000, 13, 343–357. [Google Scholar] [CrossRef] [PubMed]
- Fischer, S.; Dresp, B. A neural network for long-range contour diffusion by visual cortex. Lect. Notes Comput. Sci. 2000, 1811, 336–342. [Google Scholar]
- Dresp, B.; Fischer, S. Asymmetrical contrast effects induced by luminance and colour configurations. Percept. Psychophys. 2000, 63, 1262–1270. [Google Scholar] [CrossRef]
- Tzvetanov, T.; Dresp, B. Short- and long-range effects in line contrast detection. Vis. Res. 2002, 42, 2493–2498. [Google Scholar] [CrossRef]
- Spillmann, L.; Dresp-Langley, B.; Tseng, C.H. Beyond the classic receptive field: The effect of contextual stimuli. J. Vis. 2015, 15, 7. [Google Scholar] [CrossRef]
- Dresp, B.; Grossberg, S. Contour integration across polarities and spatial gaps: From local contrast filtering to global grouping. Vis. Res. 1997, 37, 913–924. [Google Scholar] [CrossRef]
- Carandini, M.; Demb, J.B.; Mante, V.; Tolhurst, D.J.; Dan, Y.; Olshausen, B.A.; Gallant, J.L.; Rust, N.C. Do we know what the early visual system does? J. Neurosci. 2005, 25, 10577–10597. [Google Scholar] [CrossRef]
- Kapadia, M.K.; Westheimer, G.; Gilbert, C.D. Spatial contribution of contextual interactions in primary visual cortex and in visual perception. J. Neurophysiol. 2000, 84, 2048–2062. [Google Scholar] [CrossRef]
- David, J.A.S.; Green, M. Signal Detection Theory and Psychophysics; John Wiley & Sons Inc.: New York, NY, USA, 1966. [Google Scholar]
- Wandeto, J.M.; Dresp-Langley, B. Ultrafast automatic classification of SEM image sets showing CD4 + cells with varying extent of HIV virion infection. In Proceedings of the 7ièmes Journées de la Fédération de Médecine Translationnelle de Strasbourg, Strasbourg, France, 25–26 May 2019. [Google Scholar]
- Wandeto, J.M.; Nyongesa, H.; Remond, Y.; Dresp-Langley, B. Detection of smallest changes in medical and random-dot images comparing self-organizing map performance to human detection. Inform. Med. Unlocked 2017, 7, 39–45. [Google Scholar] [CrossRef]
- Wandeto, J.M.; Nyongesa, H.; Remond, Y.; Dresp-Langley, B. Detection of smallest changes in medical and random-dot images comparing self-organizing map performance and expert performance. In Proceedings of the European Conference on Visual Perception (ECVP), Berlin, Germany, 27–31 August 2017. [Google Scholar]
- Dresp-Langley, B.; Wandeto, J.M.; Nyongesa, H.K.O. Using the quantization error from Self-Organizing Map output for fast detection of critical variations in image time series. In ISTE OpenScience, Collection from Data to Decisions; Wiley & Sons: London, UK, 2018. [Google Scholar]
- Dresp-Langley, B. Principles of perceptual grouping: Implications for image-guided surgery. Front. Psychol. 2015, 6, 1565. [Google Scholar] [CrossRef]
- Wandeto, J.M.; Dresp-Langley, B. The quantization error in a Self-Organizing Map as a contrast and color specific indicator of single-pixel change in large random patterns. Neural Netw. 2019, in press. [Google Scholar]
- Kerekes, J.P.; Baum, J.E. Spectral Imaging System Analytical Model for Subpixel Object Detection. IEEE Trans. Geosci. Remote Sens. 2002, 40, 1088–1101. [Google Scholar] [CrossRef]
- Bashivan, P.; Kohitij, K.; DiCarlo, J.J. Neural population control via deep image synthesis. Science 2019, 364, eaav9436. [Google Scholar] [CrossRef]
- Weiser, M. The Computer for the 21 st Century. Sci. Am. 1991, 265, 94–105. [Google Scholar] [CrossRef]
- Gubbi, J.; Buyya, R.; Marusic, S.; Palaniswami, M. Internet of Things (IoT): A vision, architectural elements, and future directions. Future Gener. Comput. Syst. 2013, 20, 1645–1660. [Google Scholar] [CrossRef]
- Hashem, I.A.T.; Chang, V.; Anuar, N.B.; Adewole, K.; Yaqoob, I.; Gani, A.; Ahmed, E.; Chiroma, H. The role of big data in smart city. Int. J. Inf. Manag. 2016, 36, 748–758. [Google Scholar] [CrossRef]
- Kurz, M.; Ferscha, A. Sensor abstractions for opportunistic activity and context recognition systems. In European Conference on Smart Sensing and Context; Springer: Berlin/Heidelberg, Germany, 2010. [Google Scholar]
- Marx, V. Biology: The Big Challenges of Big Data. Nature 2013, 498, 255–260. [Google Scholar] [CrossRef]
- Weiser, M.; Gold, R. The origins of ubiquitous computing research at PARC in the late 1980s. IBM Syst. J. 1999, 38, 693–696. [Google Scholar] [CrossRef]
- Akter, S.; Wamba, S.F. Big data analytics in E-commerce: A systematic review and agenda for future research. Electron. Mark. 2016, 26, 173–194. [Google Scholar] [CrossRef]
- Helbing, D.; Frey, S.; Gigerenzer, G.; Hafen, E.; Hagner, M.; Hofstetter, Y.; van den Hoven, J.; Zicari, R.; Zwitter, A. Will Democracy Survive Big Data and Artificial Intelligence? Towards Digit. Enlight. 2019, 73–98. [Google Scholar] [CrossRef]
- Bishop, C.M. Pattern Recognition and Machine Learning; Springer: Berlin/Heidelberg, Germany, 2006. [Google Scholar]
- Schaller, R.R. Moore’s law: Past, present and future. IEEE Spectr. 1997, 34, 52–59. [Google Scholar] [CrossRef]
- Frangi, A.F.; Tsaftaris, S.A.; Prince, J.L. Simulation and synthesis in medical imaging. IEEE Trans. Med. Imaging 2018, 37, 673. [Google Scholar] [CrossRef]
- Brodie, M.L.; Schmidt, J.W. Final Report of the ANSI/X3/SPARC DBS-SG Relational Database Task Group. ACM Sigmod Rec. 1982, 12, 1–62. [Google Scholar]
- Schmitz-Rigal, C. Die Kunst offenen Wissens, Ernst Cassirers Epistemologie und Deutung der modernen Physik, Cassirer- Forschungen; Ernst Meiner Verlag: Hamburg, Germany, 2002; Volume 7. [Google Scholar]
- Peirce, C.S. Collected Papers of Charles Sanders Peirce; Harvard University Press: Cambridge, MA, USA, 1931. [Google Scholar]
- Firstness, Secondness, and Thirdness in Peirce|Semiotics and Visual Communication. Available online: https://undcomm504.wordpress.com/2013/02/24/firstness-secondness-and-thirdness-in-peirce/ (accessed on 7 June 2019).
- Sehring, H.-W.; Schmidt, J.W. Beyond Databases: An Asset Language for Conceptual Content Management. In Proceedings of the 8th East European Conference on Advances in Databases and Information Systems, Budapest, Hungary, 22–25 September 2004; Benczúr, A., Demetrovics, J., Gottlob, G., Eds.; Springer: Berlin/Heidelberg, Germany, 2004; pp. 99–112. [Google Scholar]
- Bergman, M. A Foundational Mindset: Firstness, Secondness, Thirdness. Available online: http://www.mkbergman.com/1932/a-foundational-mindset-firstness-secondness-thirdness/ (accessed on 7 June 2019).
- Schmidt, J.W.; Sehring, H.-W. Conceptual Content Modeling and Management. In Perspectives of Systems Informatics, 5th International Andrei Ershov Memorial Conference, Novosibirsk, Russia, 9–12 July 2003; Broy, M., Zamulin, A.V., Eds.; Springer: Berlin/Heidelberg, Germany, 2003; pp. 469–493. [Google Scholar]
- Schmidt, J.W.; Sehring, H.-W.; Warnke, M. Der Bildindex zur Politischen Ikonographie in der Warburg Electronic Library-Einsichten eines interdisziplinären Projektes. In Archivprozesse. Die Kommunikation der Aufbewahrung; Pompe, H., Scholz, L., Eds.; DuMont Television Network: Cologne, Germany, 2002; pp. 238–268. [Google Scholar]
- Cassirer, E. Die Sprache, Band 11 Philosophie der Symbolischen Formen der Reihe Gesammelte Werke; Felix Meiner Verlag GmbH: Hamburg, Germany, 2001. [Google Scholar]
- Cassirer, E. Das mythische Denken, Band 12 Philosophie der symbolischen Formen der Reihe Gesammelte Werke; Felix Meiner Verlag GmbH: Hamburg, Germany, 2002. [Google Scholar]
- Cassirer, E. Phänomenologie der Erkenntnis, Band 13 Philosophie der symbolischen Formen der Reihe Gesammelte Werke; Felix Meiner Verlag GmbH: Hamburg, Germany, 2002. [Google Scholar]
- Sehring, H.-W. Content Modeling Based on Concepts in Contexts. In Proceedings of the Third International Conference on Creative Content Technologies, Rome, Italy, 25–30 September 2011; Sehring, H.-W., Fohl, W., Eds.; ThinkMind(TM) Digital Library: Venice, Italy, 2011; pp. 18–23. [Google Scholar]
- Sehring, H.-W. Context-aware Storage and Retrieval of Digital Content: Database Model and Schema Considerations for Content Persistence. Int. J. Adv. Softw. 2018, 11, 311–322. [Google Scholar]
- IDC. The Digital Universe Decade? Are You Ready? Available online: https://www.emc.com/collateral/analyst-reports/idc-digital-universe-are-you-ready.pdf (accessed on 25 July 2019).
- Mayer-Schoenberger, V.; Cukier, K. BIG DATA; Eamon Dolan, Mariner; Houghton Mifflin Harcourt: New York, NY, USA, March 2014; reprint. [Google Scholar]
- Sutton, R.S.; Barto, A.G. Introduction to Reinforcement Learning. 1998. Available online: https://web.stanford.edu/class/psych209/Readings/SuttonBartoIPRLBook2ndEd.pdf (accessed on 25 July 2019).
- Lv, Y.; Duan, Y.; Kang, W.; Li, Z.; Wang, F. Traffic Flow Prediction with Big Data: A Deep Learning Approach. IEEE Trans. Intell. Transp. Syst. 2015, 16, 865–873. [Google Scholar] [CrossRef]
- Kurzweil Claims the Singularity Will Happen. Available online: https://www.kurzweilai.net/futurism-ray-kurzweil-claims-singularity-will-happen-by-2045 (accessed on 25 July 2019).
- Frey, C.; Osborne, M. The Future of Employment: How Susceptible are Jobs to Computerization? Available online: https://www.oxfordmartin.ox.ac.uk/downloads/academic/The_Future_of_Employment.pdf (accessed on 25 July 2019).
- What We Gain from the Digitalization of Medical Care. Available online: https://www.nii.ac.jp/en/about/upload/NIIToday_en66.pdf (accessed on 25 July 2019).
- The 21st Century’s 100 Greatest Films. Available online: http://www.bbc.com/culture/story/20160819-the-21st-centurys-100-greatest-films (accessed on 25 July 2019).
- Shelley, M. Frankenstein, Simon and Schuster Digital. Available online: https://www.simonandschuster.com/getliterary/ (accessed on 25 July 2019).
- AI Robot Astroboy. Available online: https://www.youtube.com/watch?v=XPRVj1T1zgs (accessed on 25 July 2019).
- Madoka Mirai: Creepily Human-Like Robots. Available online: https://www.cbsnews.com/pictures/creepily-human-like-robots-2/12/ (accessed on 25 July 2019).
- Japan Trends: Kyoto Temple Creates Android Version of Buddhist Goddess of Mercy. Available online: https://www.japantrends.com/kyoto-temple-android-robot-buddhist-goddess-mercy-kannon/ (accessed on 25 July 2019).
- Li, D.; Du, Y. Artificial Intelligence with Uncertainty; CRC Press: Boca Raton, FL, USA, 2017. [Google Scholar]
- Günther, W.A.; Rezazade Mehrizi, M.H.; Huysman, M.; Feldberg, F. Debating big data: A literature review on realizing value from big data. J. Strateg. Inf. Syst. 2017, 26, 191–209. [Google Scholar] [CrossRef]
- Hulsen, T.; Jamuar, S.S.; Moody, A.R.; Karnes, J.H.; Varga, O.; Hedensted, S.; Spreafico, R.; Hafler, D.A.; McKinney, E.F. From Big Data to Precision Medicine. Front. Med. 2019, 6, 34. [Google Scholar] [CrossRef]
- Ohno, N.; Katoh, M.; Saitoh, Y.; Saitoh, S. Recent advancement in the challenges to connectomics. Microscopy 2016, 65, 97–107. [Google Scholar] [CrossRef]
- Han, J.; Kamber, M. Data Mining: Concepts and Techniques, 2nd ed.; Morgan Kaufmann: Waltham, MA, USA, 2011. [Google Scholar]
- Tukey, J.W. Exploratory data analysis. Methods 1977, 2, 131–160, reprinted for sale in 2019. [Google Scholar]
- Orr, D.W. Armageddon versus extinction. Conserv. Biol. 2005, 19, 290–292. [Google Scholar] [CrossRef]


© 2019 by the authors. Licensee MDPI, Basel, Switzerland. This article is an open access article distributed under the terms and conditions of the Creative Commons Attribution (CC BY) license (http://creativecommons.org/licenses/by/4.0/).
Share and Cite
Dresp-Langley, B.; Ekseth, O.K.; Fesl, J.; Gohshi, S.; Kurz, M.; Sehring, H.-W. Occam’s Razor for Big Data? On Detecting Quality in Large Unstructured Datasets. Appl. Sci. 2019, 9, 3065. https://doi.org/10.3390/app9153065
Dresp-Langley B, Ekseth OK, Fesl J, Gohshi S, Kurz M, Sehring H-W. Occam’s Razor for Big Data? On Detecting Quality in Large Unstructured Datasets. Applied Sciences. 2019; 9(15):3065. https://doi.org/10.3390/app9153065
Chicago/Turabian StyleDresp-Langley, Birgitta, Ole Kristian Ekseth, Jan Fesl, Seiichi Gohshi, Marc Kurz, and Hans-Werner Sehring. 2019. "Occam’s Razor for Big Data? On Detecting Quality in Large Unstructured Datasets" Applied Sciences 9, no. 15: 3065. https://doi.org/10.3390/app9153065
APA StyleDresp-Langley, B., Ekseth, O. K., Fesl, J., Gohshi, S., Kurz, M., & Sehring, H.-W. (2019). Occam’s Razor for Big Data? On Detecting Quality in Large Unstructured Datasets. Applied Sciences, 9(15), 3065. https://doi.org/10.3390/app9153065