Article

THz Superradiance from a GaAs: ErAs Quantum Dot Array at Room Temperature

1
Departments of Physics and Electrical Engineering Wright State University, Dayton, OH 45435, USA
2
TeraPico, LLC, Beavercreek, OH 45431, USA
3
Applied Physics Division, National Institute of Standards and Technology, Boulder, CO 80305, USA
4
TeTech S, Suite 3, 170 Columbia, W. Waterloo, Ontario, ON N2L 3L3, Canada
*
Authors to whom correspondence should be addressed.
Appl. Sci. 2019, 9(15), 3014; https://doi.org/10.3390/app9153014
Submission received: 22 June 2019 / Revised: 21 July 2019 / Accepted: 22 July 2019 / Published: 26 July 2019
(This article belongs to the Special Issue Terahertz and Far Infrared Pulsed Devices and Systems)

Abstract

:
We report that an ErAs quantum-dot array in a GaAs matrix under 1550 nm pulsed excitation produces cooperative spontaneous emission—Dicke superradiance—in the terahertz frequency region at room temperature. Two key points pertain to the experimental evidence: (i) the pulsed THz emission power is much greater than the continuous wave (CW) photomixing power; and (ii) the ultrafast time-domain waveform displays ringing cycles. A record of ~117 μW pulsed THz power was obtained, with a 1550 nm-to-THz power conversion efficiency of ~0.2%.

Graphical Abstract

1. Introduction

In 1954 Dicke proposed that cooperative spontaneous emission could occur among a collection of dipoles through interaction with a common electromagnetic radiation field [1]. He named the phenomenon “superradiance,” which was subsequently observed in atomic/molecular and even spin systems [2,3]. One would logically deduce that superradiance may also occur in quantum dot (QD) systems as QDs are sometimes considered as artificial “atoms”. Indeed, there were numerous theoretical investigations regarding this subject [4,5,6]. To be specific, when a QD array is properly prepared, the longitudinal relaxation time of the population T1 may be limited by the lifetime of inversion of a two-energy-level QD which is in the order of 1 ns, and the homogeneous (T2) and inhomogeneous broadening lifetime (T2*) of the array is in the range of T2 ≈ T2*~0.1–1 ps (i.e., the dephasing time of the polarization). If the QD array is pumped by a short and strong external pulse, the resulting spontaneous emission from the inversion can become superradiant [6]. However, experimental evidence is rare, and only in the past decade or so has there been confirmation of radiation-field-induced cooperative behavior amongst quantum dots [7]. Here we first present measurements of THz emission from an antenna-coupled QD array pumped by an ultrashort 1550 nm laser. Then we provide evidence suggesting that the THz emission is a consequence of cooperative spontaneous emission from the QD optical dipoles. This can also help explain why these devices have displayed such high efficiency, ~0.2% [8], when used as pulsed THz emitters.

2. Materials and Methods

The ErAs QD array in GaAs was obtained by growing a GaAs epitaxial layer heavily doped with erbium on a semi-insulating GaAs substrate by molecular beam epitaxy (MBE). The thickness of the epilayer was L = 2 μm, and the Er doping ~8.8 × 1020 cm−3 such that the erbium incorporated into the GaAs in the form of ErAs quantum dots. This was proven by transmission electron microscope (TEM) imagery (Figure 1a). The most likely diameter is estimated to be d ≈ 2.0 nm, and the density of quantum dots is nQD~1 × 10¹⁸/cm3. These ErAs quantum dots contain several quasi-bound levels near the mid-gap of GaAs, allowing strong bound-to-bound, and possibly bound-to-continuum transitions as well, at around 1550 nm. This is proven by the resonant attenuation coefficient around 1550 nm, derived from the infrared transmission measurements, and plotted in Figure 1b. The peak value is α ≈ 7.4 × 103 cm−1.
Photoconductive (PC) switch devices were fabricated by patterning a self-complementary square spiral on the top of the epilayer with standard image-reversal photolithographic processing (Figure 2). The antenna has an active area at the center of 9 × 9 μm, which is compatible with the spot size of a focused 1550 nm fiber laser. The erbium-doped fiber amplifier (EDFA) laser emits 90 fs pulses at 100 MHz repetition frequency. Then we measured the waveform of the THz pulses from the PC switch with a THz time-domain spectrometer. The switch was used as transmitter, pumped separately by 1550 and 780 nm sub-picosecond pulses. Commercial InGaAs (for 1550 nm) and LT:GaAs PC switches (for 780 nm) were used as the receivers. The 780 nm result is a benchmark since it is known to produce electron-hole pairs across the GaAs bandgap, utilizing the quantum dots primarily as recombination centers.
We also conducted photomixing experiments on the gap device as well as a device with interdigital electrodes fabricated in the gap on the same photoconductive material. The fixed-wavelength (1550 nm) source was a distributed-feedback (DFB) laser diode. The tunable wavelength laser was an external cavity diode laser (ECDL) capable of sweeping from 1520 to 1570 nm. A free-space-coupled half-wave plate was inserted to rotate the polarization direction to be parallel to that of the DFB laser after combining in their outputs in a 50/50 fiber coupler. Both were then boosted by an erbium-doped fiber amplifier (EDFA) to a combined level of ~295 mW.

3. Results

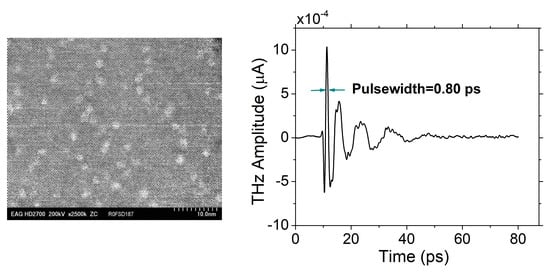
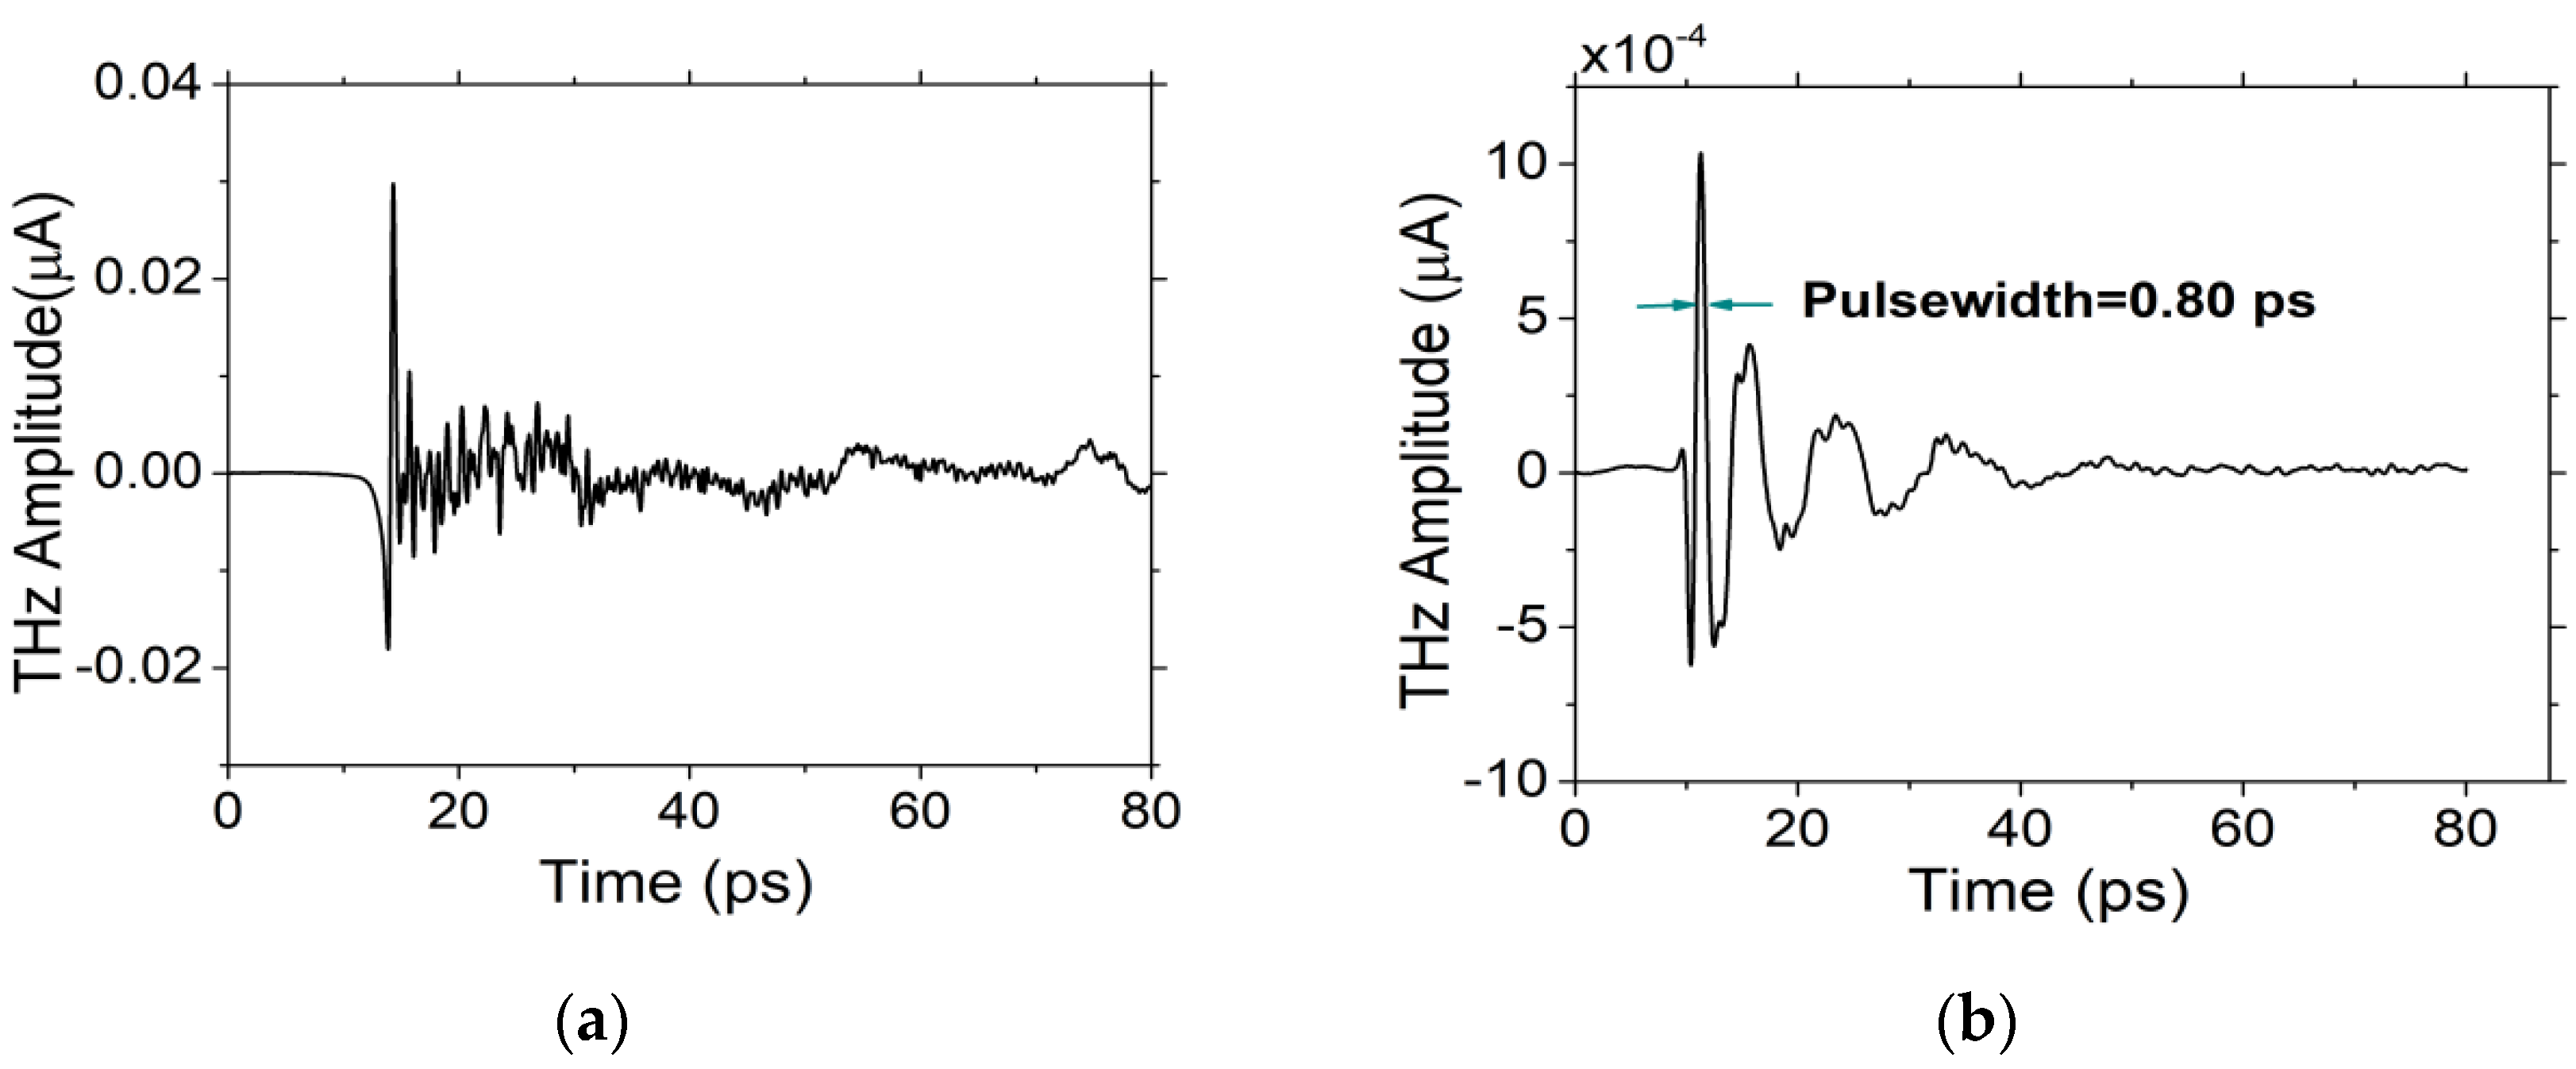
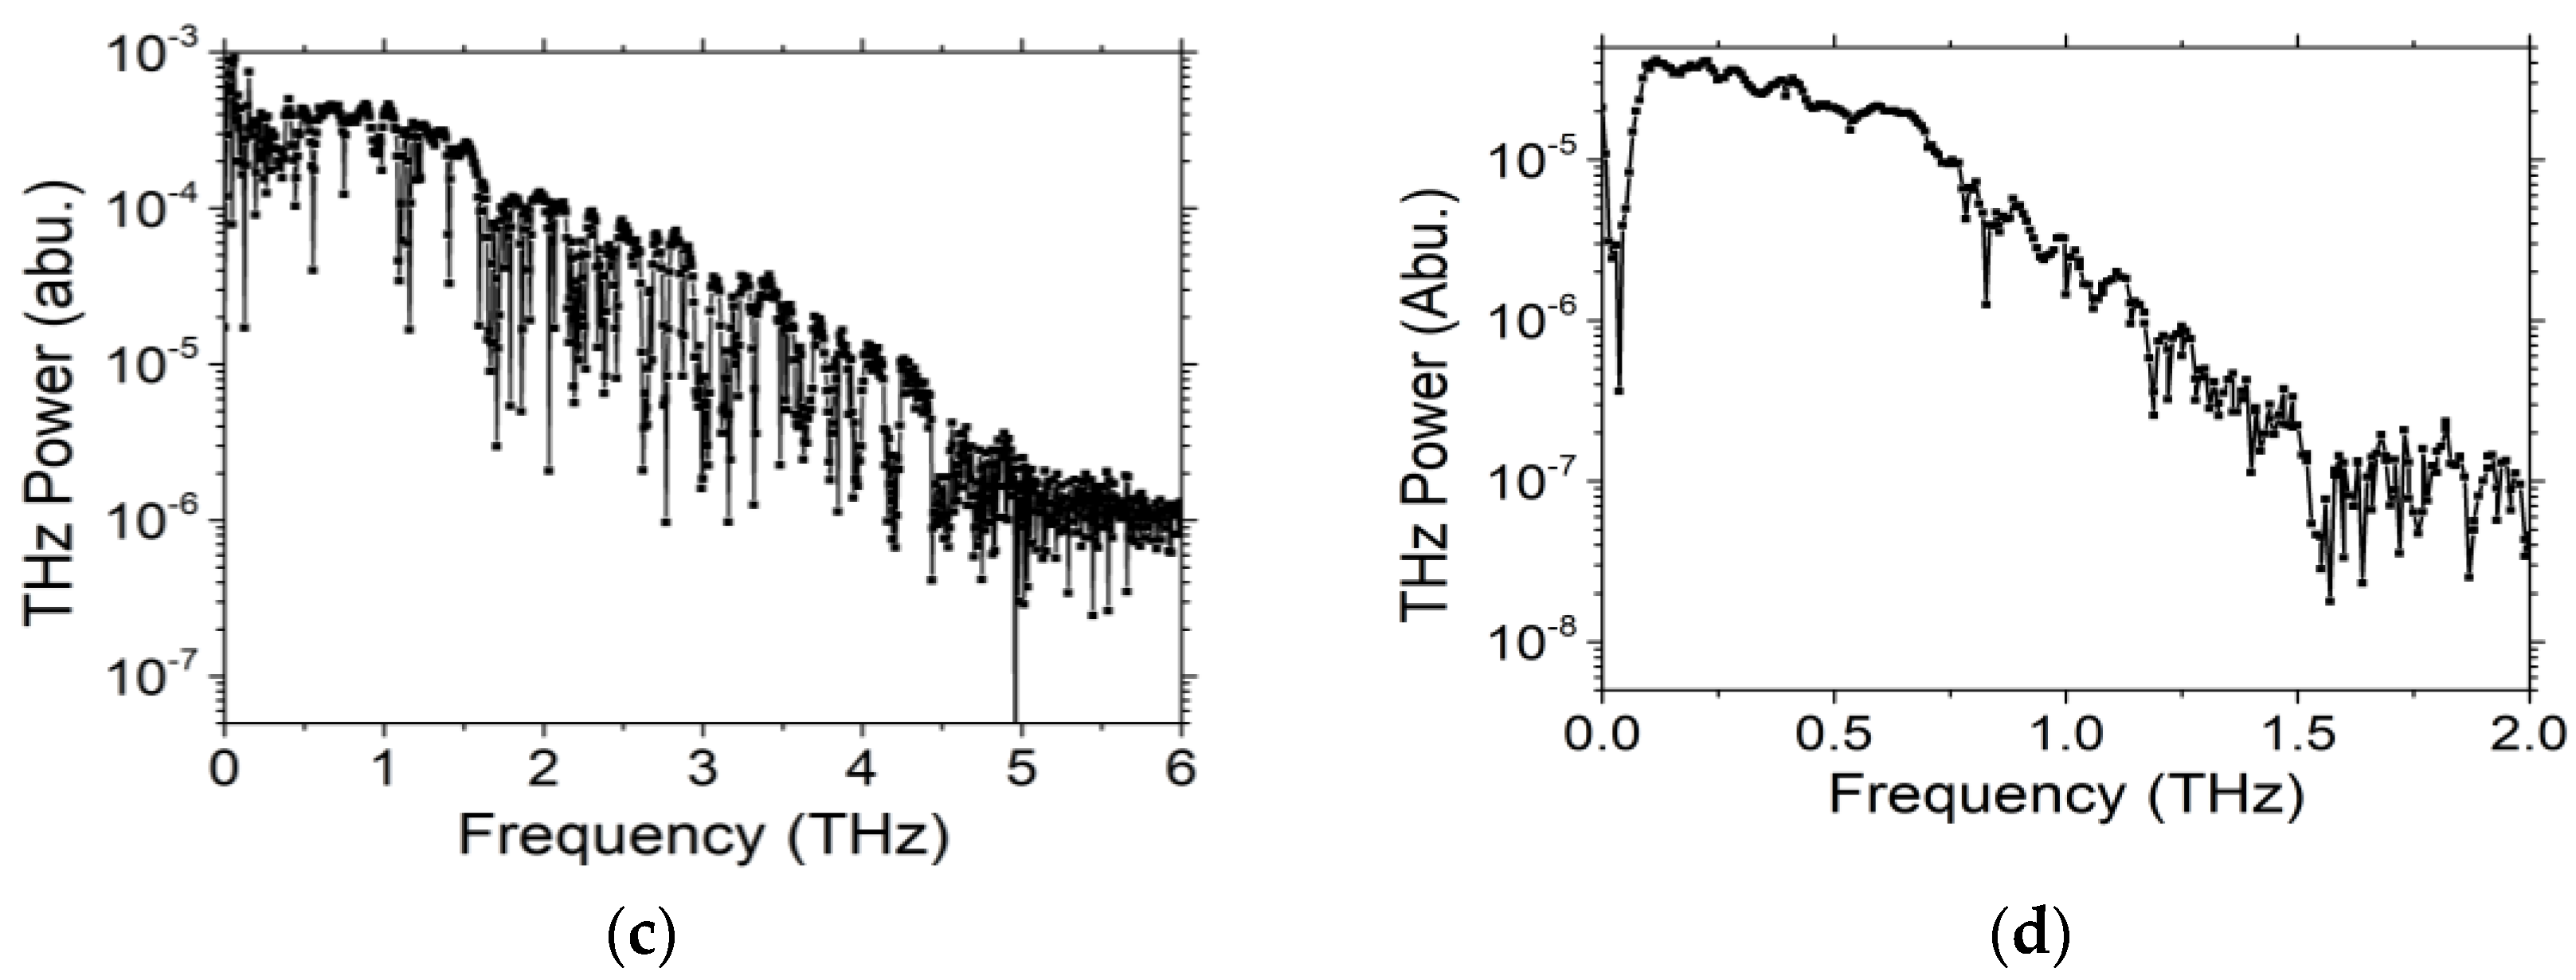
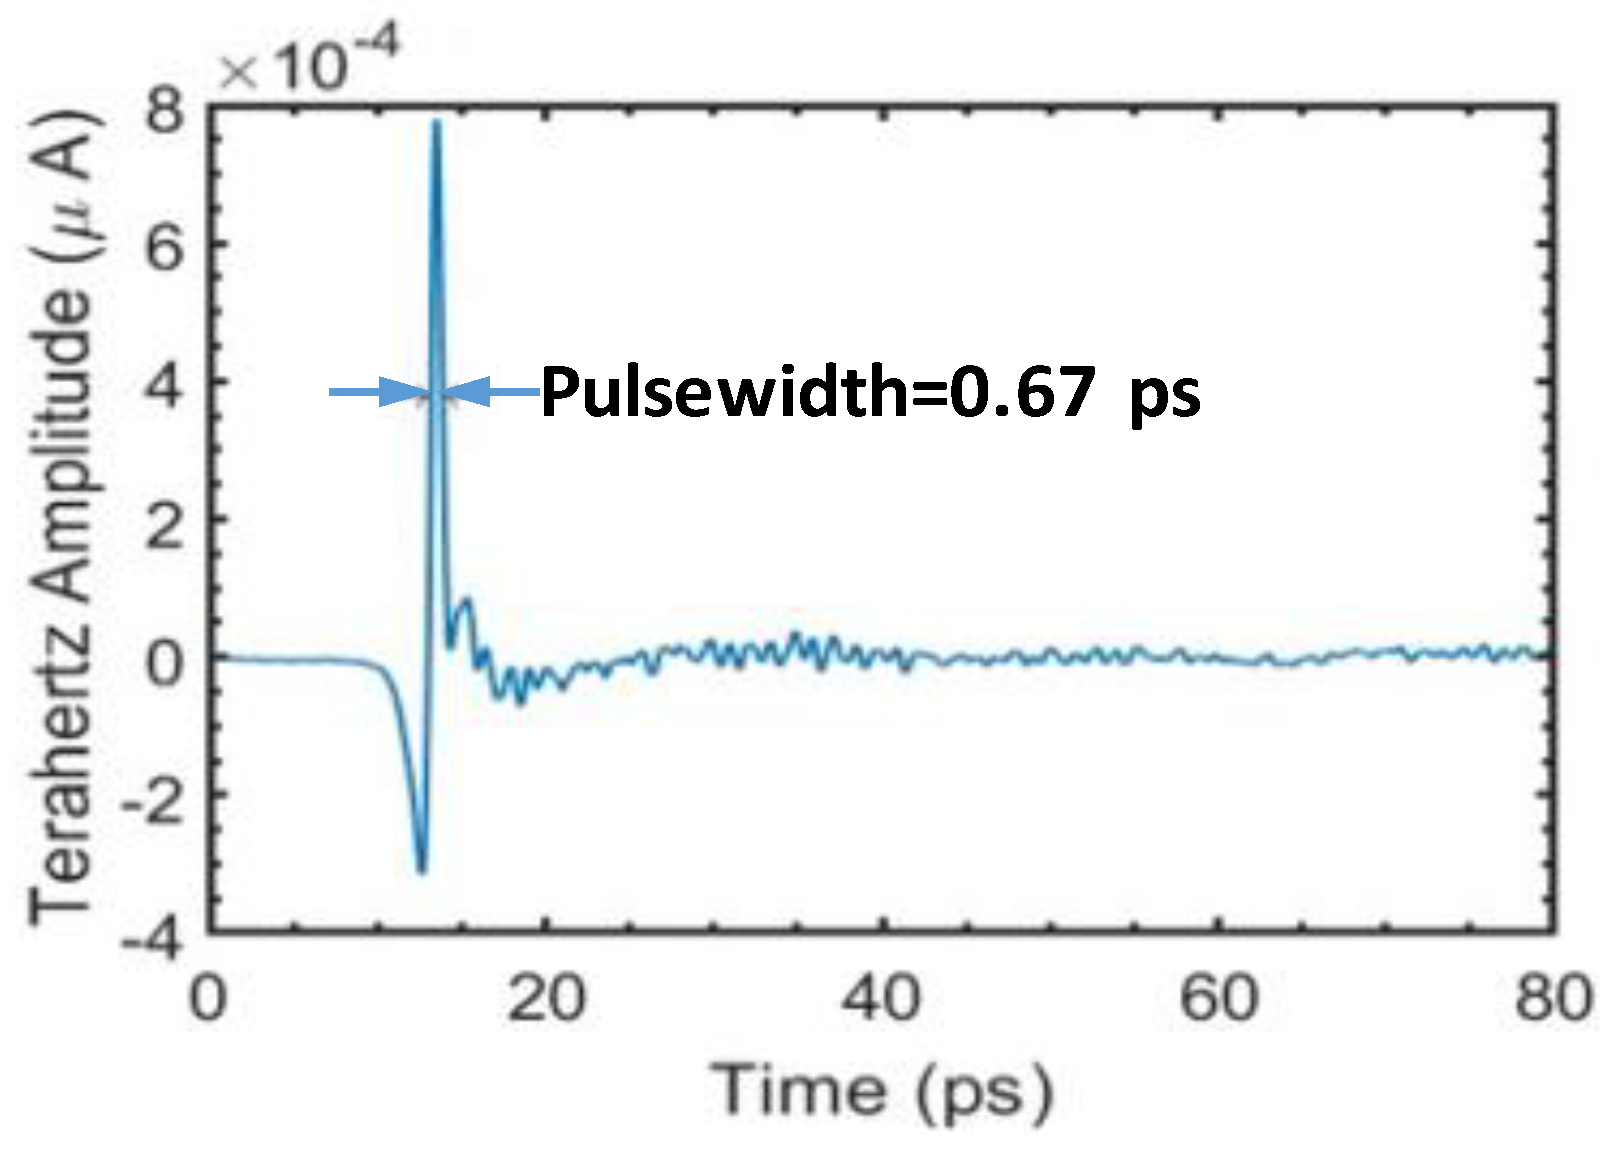
3.1. Pulsed Terahertz (THz) Emission

Figure 3a plots the average THz power vs. bias voltage at an incident 1550 fiber laser power of 65 mW. A maximum THz power of ~117 μW was measured with a cross-calibrated Golay cell detector at room temperature [8]. The curve in Figure 3a is good fit by a power law: PTHz α V1.97. Figure 3b displays the power spectrum from the FFT of the interferogram obtained with a Michelson autocorrelator. It displays a maximum spectral density around 250 GHz.
Figure 4a shows the THz time-domain waveform for 780-nm femtosecond laser pulses (obtained by frequency doubling of 1550-nm fiber laser), having an average pump power of ≈14 mW. Only one pronounced THz peak appears in the waveform as expected, indicating that the THz radiation is caused by the acceleration of the photocarriers in the large bias field along with their ultrafast recombination. This is typical behavior for cross-bandgap ultrafast photoconductive devices. In contrast, Figure 4b shows the THz waveform for the 1550-nm ultrafast pulses having an average power of ~23 mW. Unlike the 780 nm waveform, a damped ringing occurs over four cycles, with the period increasing as the waveform evolves. The radiation field swings toward both positive and negative polarities, displaying a displacement-current-like alternation, which cannot be explained as normal photoconductive relaxation. And the fact that the same device pumped at 780 nm displayed no ringing rules out other possible effects, such as resonances in the spiral antenna. Furthermore, to check for possible non-linear optical effects in the detector, or self-interference along the THz beam path, we replaced the QD emitter with a commercial In0.53Ga0.47As cross-bandgap-excited PC switch with the same 1550 nm setup and the same receiver (Figure 5). No such ringing was observed. Figure 4d shows the power spectrum of 4b after FFT. Similar to Figure 2b, most of the power occurs in a band-limited range between ~100 and 600 GHz. For the purpose of comparison, Figure 4c shows the power spectrum of 4a after FFT. As expected, the 780 nm power spectrum is broader than the 1550 nm power spectrum.

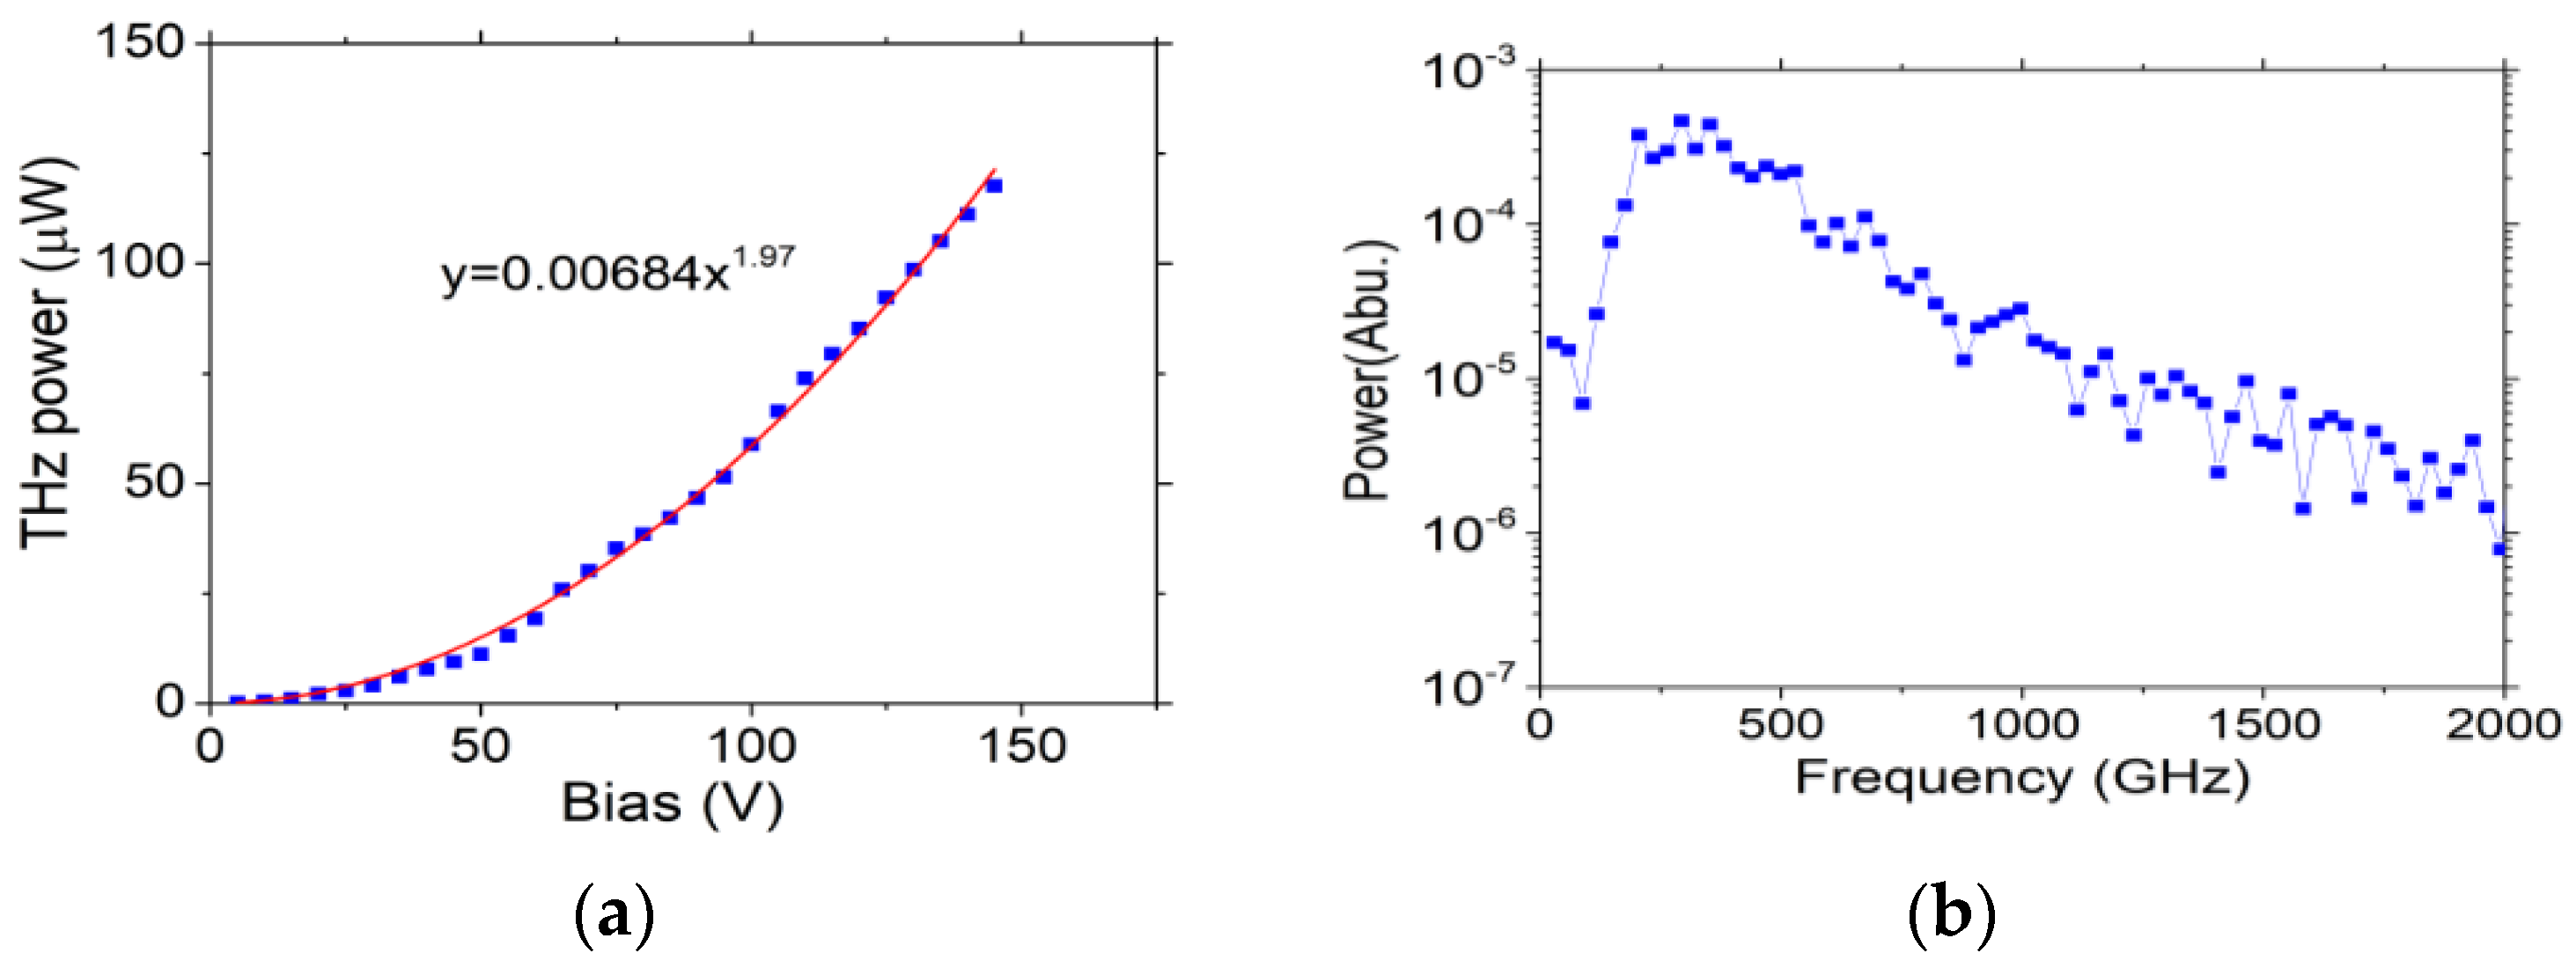
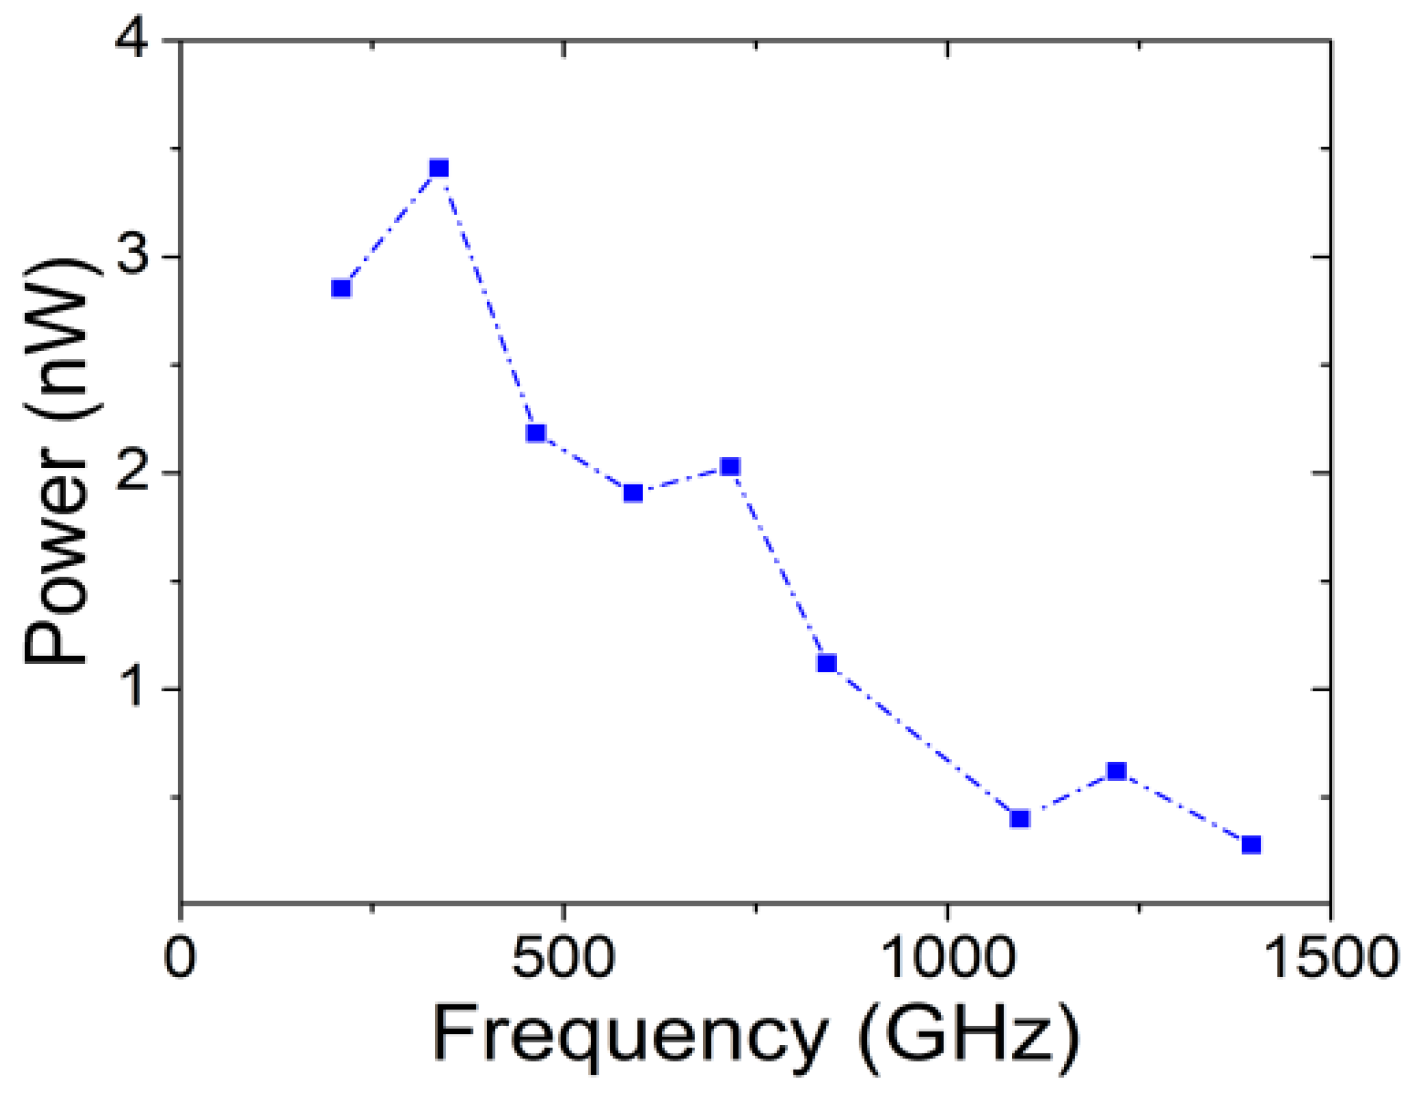
3.2. Efficiency and Photomixing Results

In a recent publication we have emphasized not only the high THz output power of the pulsed QD-array device, but also the photonic-to-THz power conversion efficiency [8]. From Figure 3a, we calculate a conversion efficiency of 117 μW/65 mW = 0.2%. The conversion efficiency has already been emphasized and improved in 1550-nm THz photoconductive devices [9], and the present results are amongst the highest 1550 nm-driven THz efficiencies ever reported. We attribute this performance in large part to the superradiance phenomenon, as supported by Figure 4b,d.
Further support for the superradiance is provided by pulsed vs. cw (photomixing) results. As described above, photomixing measurements were carried out on the same devices (Figure 2) as the pulsed measurements. Although the total 1550 nm power (295 mW) was much higher than in the pulsed experiments, the heavily infrared (IR) filtered maximum average THz power from the photomixing was only ~3.4 nW at 337 GHz as measured with the cross-calibrated Golay cell detector (Figure 6). This corresponds to a conversion efficiency of 1.2 × 10⁻⁸. The power dropped continuously as the difference frequency increased but was still detectable up to 1.2 THz, consistent with the THz signal coming from photomixing and not just heating. Thus the broadband pulsed-mode is ~1.5 × 10⁵ more efficient than the narrowband photomixing mode, which is significantly greater than in cross-bandgap-driven (e.g., 780 nm) THz photoconductive devices. Since superradiance is only expected to be significant in 1550 nm pulsed mode (see below), it is the logical discriminator.

4. Discussion

4.1. Quantum Dot (QD) Modeling

To explain the resonant absorption around the 1550 nm wavelength, we calculate the energy levels and dipole matrix elements by solving the Schrödinger equation with four essential assumptions: (1) that the quantum dots are perfect spheres, (2) that the binding energy of electrons and holes is determined by the known ErAs-GaAs band offsets, (3) that ErAs and GaAs are exactly lattice matched, and (4) there are enough ErAs unit cells in each dot that we can apply the effective-mass approximation (EMA). The ErAs-GaAs band offsets are illustrated in Figure 7a [10]. Note that ErAs is not a semiconductor in bulk form, but rather a semi-metal lacking a direct band gap with the Γ and X band overlapping in energy. We have calculated the bound energy levels for the X- and Γ-point envelope functions vs. the quantum-dot diameter d. The most probable optical dipole transition is between a Γ-point S state (quantum numbers l = 0, n = 1), and an X-point P state (l = 1, n = 2, m = −1, 0 or 1). The resulting spontaneous emission coefficient A(λ) for this transition has a maximum λp = 1476 nm (Figure 7b) which is equivalent to a photon energy of 0.84 eV, for d = 2.6 nm. Generally speaking, the absorption coefficient α(λ) is proportional to the product of N × A(λ) × g(λ), where N is the population difference between two energy levels or approximately by the number of QDs, and g(λ) is the normalized lineshape function with a fullwidth at half-maximum determined by the homogeneous and inhomogeneous broadening of the QD array [6]. Therefore, the size distribution of QD diameters can broaden the absorption spectrum around the peak wavelength λp. Nevertheless, our calculations reveal that the optical transition between two quantum-dot energy levels can explain the resonant behavior around λ = 1550 nm. Furthermore, we estimate that the spontaneous lifetime is on the order of Tsp = 1/[A(λp)] = 60 ns, which is comparable to the spontaneous lifetime for QDs reported in the literature e.g., References [5,6], and much greater than the spontaneous lifetime in typical bulk direct-bandgap semiconductors.
Next we show that the photon-excited level(s) of our QDs can be resilient to thermal de-population effects such as phonon scattering. The key ingredient is excitonic binding. Figure 7a shows the Γ-point ground level E1, the X-point upper level E2 and a bound-exciton level E3 just below it. The bound exciton should be very stable and have a large oscillator strength. It is analogous to the indirect Γ-X exciton in bulk silicon, but with a much higher binding energy and, therefore, temperature stability. As is well known in many-body theory, the energy levels obtained above through the Schrödinger equation and the EMA is not a complete picture. There is a correlative effect between an excited electron in a quantum dot and the hole that remains in the ground level that the electron started in levels. In semiconductors this correlation is associated with the fundamental quasiparticle called an exciton. The exciton binding energy in the limit of small diameter quantum dots is estimated by the famous Brus formula [11]. Strictly speaking, this is valid only for the ground state, (Γ-point) n = 1, l = 0, to (X-point) n = 1, l = 0 transition in the quantum dots. Evaluation for the 2.6 nm quantum dot (supporting the 1550 nm optical transition) yields Eex,qd = 0.132 eV, ≈18 times larger than the bulk binding energy. And remarkably, it is much greater than the thermal energy kBT = 0.025 eV (kB being Boltzmann’s constant) at T = 300 K, meaning that if such excitons were excited optically, they would be quite stable thermally even in the presence of electron-photon scattering. Not only can excitonic levels in quantum dots be thermally stable, but they have very large, resonant oscillator strength at 1550 nm, too.
Hence, the modeling explains the resonant absorption near 1550 nm of the quantum dot array, and why the switch devices can be driven with 1550 nm. However, it also suggests the long depopulation time T1 (≈Tsp = 60 ns) even at room temperature. While this sheds light on the poor performance of photomixing results, it raises question on how the lifetime of the inversion of two energy levels can be shortened sufficiently for the fast electron relaxation and then the resulted THz emission. Superradiance provides an “escape route” for this. Under ultrashort strong laser pumping, the almost immediate inversion of QDs triggers spontaneous emission and the QDs cooperate with each other through the same radiated field. This is because the QD size is in the order of ~2 nm, much shorter than the ~1550 nm wavelength, and the QDs’ distribution is dense [7]. The collective interaction of QDs with the same radiation field can reduce the spontaneous lifetime of QDs significantly, resulting in a build-up of the superradiant pulse.

4.2. Comparison of THz Data with Superradiant Theory

The full width of half maximum (FWHM) of the pulse plotted in Figure 4b is estimated to be ~0.8 ps, much shorter than the depopulation time T1 ≈ 60 ns. In addition, the modeling of Ref. [6] predicts that the FWHM is less than the dephasing time of the polarization T2 (on the order of ~1 ps) because of the radiation field-QD coupling [6].
The ringing in Figure 4b cannot be explained by the time-of-flight of the traveling wave to the contact pads, which is estimated to be ~2 × 20 = 40 ps (arm length = 2200 µm, effective refraction index neff = 2.65). It can’t be explained by the reflection of the traveling wave from each corner of the square spiral as the length difference of each turn is only ~14 µm (~0.12 ps) either. Instead, we propose that the ringing is a telltale sign of superradiance, which has been observed experimentally in several material systems, and studied theoretically. It originates from the feedback between a radiation field and a collective system of multiple optical dipoles. The radiation field swings both positive and negative, displaying a displacement current-like alternation, which cannot be explained as normal photoconductive relaxation. And the fact that the same device pumped at 780 nm displayed no ringing rules supports this proposal.
To explain the experimental ringing behavior quantitatively, we applied the sine-Gordon equation, which is an approximation of the famous Maxwell–Bloch set of equation that has been used successfully for description of superradiance of two-energy level systems [2,3,12,13]. To solve the sine-Gordon equation for the sample used for Figure 4b, we need just a few parameters. The first one is the total number of QDs under the direct illumination of the pump pulses, which we estimate by N ≈ nQDW2L = 1.62 × 10⁸ where nQD = 1 × 1018 cm−3 is the quantum dot density, W = 9 μm is the gap width (W × W = active area), and L is the quantum-dot layer thickness (2 μm). The instantaneous polarization is the summation over all available dipoles, and P(t) = i N p i Np when the dipoles are initially aligned by the strong ultrafast laser field. The initial tipping angle of the Bloch vector P is approximated by θ0 ≈ 1/ N = 7.9 × 10⁻⁵. Assuming the dipoles radiate coherently, we solved the sine-Gordon equation with this initial value and obtained the “ringing” electric field plotted in Figure 8a. Only two other quantities were required for the solution, the superradiance time constant TR of ≈201 fs, and the individual quantum-dot spontaneous lifetime Tsp ≈ 60 ns. The fact that, TR << Tsp is an essential aspect of superradiant systems. The comparison between experiment and theory, Figure 4b vs. Figure 8a, is good in the ringing behavior beyond the first peak. Namely, the polarization field oscillates about zero, and is damped over about four periods. As a telltale sign of sine-Gordon behavior, the period increases with time as the ringing evolves, which is why the waveform in Figure 8a is a “quasi-sinusoid” rather than a pure sinusoid.
The other essential aspect of the superradiant ringing is coupling to an antenna. As shown graphically in Figure 8b, this follows from Maxwell’s fourth equation, ∇ × H = JC + ∂D/dt = JC + (εre) ∂P/dt where JC is the conduction current, ∂D/dt (∂P/dt) is the displacement (polarization) current, χe is the electrical susceptibility and εr is the relative electric permittivity, and the last step follows from classical electrodynamics. In the gap region where the pulse laser is focused, the current is primarily polarization current, but automatically gets converted to a proportionate conduction current in the antenna electrodes, assuming the metal-to-gap junction is an ohmic contact, or nearly so. In fact, this is just another example of the continuity of total current which arises from conservation of total charge, and that goes on in any type of capacitor, which is how Maxwell justified his fourth and final equation.

4.3. Comparison of This Research with Previous Results

THz generation using InAs QD arrays distributed in GaAs has been reported previously [14,15,16,17]. The maximum THz power output was ~0.9 µW for pulsed InAs-QD emitters when pumped with 50 mW 800 nm laser power, and ~0.15 nW for InAs-QD photomixers when pumped with 30 mW 1200 nm laser power. While the pulsed emission has a much better conversion efficiency (~1.8 × 10⁻³%) than the photomixing (~5 × 10⁻⁷%), no ringing was observed in its time-domain profile. The working mechanism was attributed to reduction of the photocarrier recombination time by an Auger-related process [14], not the superradiance proposed in this research.

5. Conclusions

We have observed strong THz pulsed emission from an ErAs quantum-dot array in a GaAs matrix driven by a 1550 femtosecond fiber laser. The quantum-mechanical modeling shows that the resonant response to the 1550 nm is traceable bound-to-bound transitions of QDs, which have long spontaneous radiative lifetimes. The strong and short THz pulse can be explained by the collective interaction of QDs with a common radiation field, which reduces the effective spontaneous lifetime of QDs significantly. The time domain waveform also displays ringing behavior attributable to the feedback between the radiation field and the collective system with multiple optical dipoles formed by excited QDs. Our experimental results are consistent with theoretical models. Yet there are many issues remaining to be explored such as the effect of QD size, uniformity, and inhomogeneous broadening and coupling with a radiative cavity, etc. Also, more quantitative comparison between experiments and modeling needs to be performed. Nevertheless, we believe that this type of THz superradiant phenomenon may be observable in other QD systems that display resonant interaction with femtosecond pump lasers.

Author Contributions

Conceptualization, W.Z. and E.R.B.; Material Growth, R.P.M.; Device Fabrication, A.M. and W.Z.; Device Testing, W.Z., A.M., N.J. and D.S.; Composition, W.Z. and E.B.; Computation, E.B and W.Z.

Funding

This research was funded by Army Research Office, grant number W911NF-12-1-0496 and grant number SBIR W911NF-17-P-0069.

Conflicts of Interest

The authors declare no conflict of interest.

References

  1. Dicke, R.H. Coherence in spontaneous radiation process. Phys. Rev. 1954, 93, 99–110. [Google Scholar] [CrossRef]
  2. MacGillivray, J.C.; Feld, M.S. Theory of superradiance in an extended, optically thick medium. Phys. Rev. A 1976, 14, 1169–1189. [Google Scholar] [CrossRef]
  3. Benedict, M.G.; Ermolaev, A.M.; Malyshev, V.A.; Sokolov, I.V.; Trifonov, E.D. Super-Radiance: Multiatomic Coherent Emission; Institute of Physics Publishing: Bristol, UK, 1996; pp. 31–37. [Google Scholar]
  4. Parascandolo, G.; Savona, V. Long-range radiative interaction between semiconductor quantum dots. Phys. Rev. B 2005, 71, 045335. [Google Scholar] [CrossRef] [Green Version]
  5. Temnov, V.V.; Woggon, U. Superrandiance and subradiance in an inhomogeneously broadened ensemble of two-level systems coupled to a low-Q cavity. Phys. Rev. Lett. 2005, 95, 243603. [Google Scholar] [CrossRef] [PubMed]
  6. Yukalov, V.I.; Yukalova, E.P. Dynamics of quantum dot superradiance. Phys. Rev. B 2010, 81, 075308. [Google Scholar] [CrossRef] [Green Version]
  7. Scheibner, M.; Schmidt, T.; Worschech, L.; Forchel, A.; Bacher, G.; Passow, T.; Hommel, D. Superradiance of quantum dots. Nat. Phys. 2007, 3, 106–110. [Google Scholar] [CrossRef]
  8. Mingardi, A.; Zhang, W.-D.; Brown, E.R.; Feldman, A.D.; Harvey, T.E.; Mirin, R.P. High power generation of THz from 1550-nm photoconductive emitters. Opt. Express 2018, 26, 14472–14478. [Google Scholar] [CrossRef] [Green Version]
  9. Dietz, R.J.B.; Gerhard, M.; Stanze, D.; Koch, M.; Sartorius, B.; Schell, M. THz Generation at 1.55 m excitation: Six-fold increase in THz conversion efficiency by separated photoconductive and trapping regions. Opt. Express 2011, 19, 25911–25917. [Google Scholar] [CrossRef] [PubMed]
  10. Kawasaki, J.K.; Timm, R.; Delaney, K.T.; Lundgren, E.; Mikkelsen, A.; Palmstrøm, C.J. Local Density of States and Interface Effects in Semimetallic ErAs Nanoparticles Embedded in GaAs. Phys. Rev. Lett. 2011, 107, 036806. [Google Scholar] [CrossRef] [PubMed]
  11. Kayanuma, Y. Quantum-size effects of interacting electrons and holes in semiconductor microcrystals with spherical shape. Phys. Rev. B 1988, 38, 9797–9805. [Google Scholar] [CrossRef] [PubMed]
  12. Burnham, D.C.; Chao, R.Y. Coherent resonance fluorescence excited by short light pulses. Phys. Rev. 1969, 188, 667–675. [Google Scholar] [CrossRef]
  13. Bonifacio, R.; Lugiato, L.A. Cooperative radiation processes in two-level systems: Superfluorescence. Phys. Rev. A 1975, 11, 1507–1521. [Google Scholar] [CrossRef]
  14. Leyman, R.R.; Gorodetsky, A.; Bazieva, N.; Molis, G.; Krotkus, A.; Clarke, E.; Rafailov, E.U. Quantum dot materials for terahertz generation applications. Laser Photon. Rev. 2016, 10, 772–779. [Google Scholar] [CrossRef] [Green Version]
  15. Kruczek, T.; Leyman, R.; Carnegie, N.; Baziev, N.; Erbert, G.; Schulz, S.; Reardon, C.; Reynolds, S.; Rafailov, E.U. Continuous wave terahertz radiation from an InAs/GaAs quantum-dot photomixer device. Appl. Phys. Lett. 2012, 101, 0811141. [Google Scholar] [CrossRef]
  16. Fedorova, K.A.; Gorodetsky, A.; Rafailov, E.U. Compact all-quantum-fot based tunable THz laser source. IEEE J. Sel. Top. Quantum Electron. 2017, 23, 1900305. [Google Scholar] [CrossRef]
  17. Gorodetsky, A.; Yadav, A.; Avrutin, E.; Fedorova, K.A.; Rafaulov, E.U. Photoelectric properties of InAs/GaAs quantum dot photoconductive antenna wafers. IEEE J. Sel. Top. Quantum Electron. 2018, 24, 1900105. [Google Scholar] [CrossRef]
Figure 1. (a) A TEM image of ErAs quantum dots. The image was taken by an EAG Laboratory in Raleigh, NC, USA. (b) Attenuation spectrum of GaAs: ErAs sample.
Applsci 09 03014 g001
Figure 2. (a) Square spiral-antenna design, (b) fabricated square spiral antenna with photoconductive gap at the center.
Applsci 09 03014 g002
Figure 3. (a) Terahertz (THz) power vs. bias voltage at a laser power of 65 mW. (b) Power spectrum obtained from auto-correlation measurement.
Applsci 09 03014 g003
Figure 4. (a) The waveform in time domain when the pulsed device was pumped with 780 nm pulsed laser. (b) The waveform in time domain when the pulsed device was pumped with 1550 nm pulsed laser. (c) The power spectrum of the 780 nm driven radiation. (d) The power spectrum of the 1550 nm driven radiation.
Applsci 09 03014 g004aApplsci 09 03014 g004b
Figure 5. Waveform of a commercial InGaAs-based switch device under 1550 nm pump.
Applsci 09 03014 g005
Figure 6. Power spectrum of 1550 nm photomixing.
Applsci 09 03014 g006
Figure 7. (a) GaAs-ErAs band offsets and the most probable band-to-band transition between a Γ-pt S state (quantum numbers l = 0, n = 1) and a X-pt P state (l = 1, n = 2, m = −1, 0 or 1). (b) Spontaneous emission rate for transition in (a).
Applsci 09 03014 g007
Figure 8. (a) Analytic solution to sine-Gordon equation the characteristic “ringing” of superradiance. (b) The polarization current and coupling to THz antenna.
Applsci 09 03014 g008

