1. Introduction
With the growing awareness of the energy crisis and environmental pollution, electric vehicles using electricity as an energy source are gradually becoming the focus of attention. The energy source usually consists of a rechargeable lithium-ion battery (LiB).
Unlike other types of batteries, LiB offers higher energy efficiency. However, the health of a LiB and its cost of replacement have been the problems for consumers in electric vehicle applications, and the development of an accurate and quick, preferably in-situ health monitoring method is receiving significant research attention in the field of LiBs [
1]. As the discharge characteristics of a LiB vary with the composition of the electrochemistry in the battery, and the state-of-health (SoH) of a LiB is strongly affected by its composition as well as ambient environmental factors, together with variation in its usage conditions, the estimation of the LiB health can be challenging. This state-of-health is a “measurement” that reflects the general health condition of a battery in term of its ability to deliver maximum stored charge as compared to its fresh state. It depends on factors such as its maximum stored charge, internal resistance, voltage, and self-discharge. Theoretically, the SoH of a fresh battery is 100% and will decrease over time due to its usage [
2]. State-of-health is an indicator to describe the health status of a battery, and it can reflect the performance and aging of the battery. In terms of electrical quantity, SoH is an indicator of the remaining full battery capacity. SoH is generally defined as the ratio of the maximum releasable capacity of a battery to the rated capacity of the battery when it is fresh.
The two most important health conditions of a LiB are its maximum charge capacity, which is represented by SoH, and its status of safety, which is represented by state-of-safety (SoS). SoS represents the condition when the battery is in danger to use in the vehicles, and it can be estimated by several means, such as its thermal runaway, current, voltage, state-of-charge (SoC), and SoH [
3]. As SoH degrades over charge–discharge cycles, accurate estimation of its SoC can be affected if the SoH is not taken into account. This is because SoC is defined as the percentage of available stored charge with respect to the full capacity of the battery. This full capacity of the battery is sometimes its rated capacity, but more likely its current (i.e., at the latest charge–discharge cycle) capacity and this leads to an ambiguity that renders confusion and differences in the reported SoC values. During the lithiation process (charging), metal oxides break apart from the cathode side, which produces Li ions that bond with the anode side material with the addition of electrons. The opposite process where Li-ion travels back and bond with the metal oxide on the cathode side is called the de-lithiation (discharging) process. The effectiveness of the cathode material is determined based on the number of Li ions produced during the lithiation process, and the effectiveness of the anode material is verified based on the number of Li ions which migrate from cathode and bond with the anode material. This, in turn, also decides the SoC and SoH of the batteries [
4]. To estimate the maximum distance before the LiBs need to be charged again requires the knowledge of the road conditions ahead and an accurate SoC, and this can be represented by the state-of-energy (SoE) [
5,
6]. SoE indicates the remaining energy, instead of charge, that can be used from the battery, which describes a more precise state or condition of the battery. The state-of-discharge (SoD) is the percentage of the discharged capacity of a battery which is fully charged before discharging and is related to SoC as [
7].
Uncertainties in capacity estimation can cause the LiBs to be over-discharged will accelerate the degradation of LiBs. These uncertainties can also cause the users to be over-conservative and increase the number of charge–discharge cycles of LiBs and accelerate the degradation of LiB as well. In this work, we focus on the estimation of SoH as it forms the basis for accurate SoS, SoC, and SoE estimations.
There are many methods reported for measuring battery capacity. Among the electrical methods, the common methods are Coulomb counting [
8], open-circuit voltage (OCV) [
9], extended Kalman filter (EKF), and the neural network [
10]. The Coulomb counting is simple and easy to implement, but it is also easy to have accumulated error due to measurement error/uncertainty of the factors, such as current, temperature, etc. OCV is another common method, but it can only be applied in the open circuit condition. In addition, the flat portion of the OCV curve with SoC can lead to significantly inaccurate estimation. EKF is a modification of the Kalman filter to ease its implementation, and thus it offers a computationally efficient option for runtime SOC evaluation for on-board vehicles. However, the error-prone calculations of the Jacobian matrix, as well as the lack of robustness due to the linearization process and instability of the filters, are the shortcomings of the EKF method. The neural network has adaptability and a self-learning ability, but it needs large numbers of experimental data to train the network to acquire good prediction results. As battery cells are degraded, training is again required, making the training resources expensive. Many physical models based on the dynamics of the battery have been purposed recently. Xia et al. [
11] and Jiang et al. [
12] developed an equivalent circuit based model to estimate battery dynamics. Huang et al. [
13] defined a new variable for the variation of the potential to perform data regression on SoC and SoH estimation. The electrochemistry-based electrical (ECBE) model that was developed in our previous work is an electrical model developed based on the first principle of electrochemistry [
9,
14]. This model can compute the internal parameters of a cell, such as Q
m,
, m
2, and, k, from its discharge curve and the change in these parameters, can be used to describe the degradation (including SoH degradation) of an LiB. Here Q
m is the maximum charge storage of a battery, and it is an important factor for calculating the SoH. The total amount of charge extracted by the external circuit is not equal to the maximum charge stored due to the non-zero cut-off voltage for safety consideration and the electrochemical impedance inside a battery caused by cycle aging.
expresses the effectiveness of a cathode in storing Li-ions and its decrease indicates a degradation in the ability of the cathode to effectively accept Li-ions.
expresses the effectiveness of the graphite anode to providing its stored Li-ions, and its decrease indicates degradation in the ability of the anode to effectively deliver Li-ions. k is the rate of charge transfer from electrodes to the electrolyte, and it can be used to measure microscopic polarization properties, and its reduction represents degradation at the electrodes’ interface that affects the kinetics of electrochemical reactions at the electrodes [
15].
While the ECBE model is accurate and comprehensive, the required computation time to obtain the values of the model parameters is excessive and renders its unsuitability for in-situ SoH estimation. In this work, a semi-empirical capacity fading model [
16] is investigated to determine the SoH of the cells under cycle aging test. This model can describe the cell’s degradation behavior due to discharge rate, temperature, and cycle numbers. We use the ECBE model as a reference to assess the accuracy of the semi-empirical model in this work. In other words, the ECBE model has a more complex structure and requires longer computation time, rendering it difficult to implement practically. On the contrary, the semi-empirical model is presented by a closed-form formula, and thus, the required computation time is much reduced as compared to the ECBE model. Another advantage of the semi-empirical method is the ease of obtaining parameters, such as k1, k2, and k3, which describes the internal state of the battery by implementing a single formula. The parameters (k1, k2, and k3) calculated in the work can also be used to study the changes in battery internal structure, such as capacity losses at normal conditions, as well as cycling at high temperatures. In this work, we use the ECBE model as a reference.
Several empirical prediction models have been proposed in recent years. R.B. Wright et al. developed a calendar and cycle life model, which account for the time, temperature, and SoC of batteries [
17]. J. Wang established the cycle-life models that followed capacity loss related to time or charge to estimate the capacity fade of LiFePO4 [
18]. The mechanical-fatigue method adopts damage-accumulation relationships to evaluate the capacity fade [
19]. And some studies use a coupled model to achieve life-prediction [
20,
21]. However, these prediction models consider several factors, such as temperature, depth of discharge (DOD), current rate, etc., rendering their applications to describe capacity fade complicated as temperature, DOD, and current are independent variables. In contrast, the semi-empirical model chosen in this work eliminates the dependency of these factors, making it more practical to the estimation of SoH. In this work, we simplify this semi-empirical model so that it can be presented by a closed-form equation, reducing the required computation time significantly as compared to ECBE and other models. The parameters of this equation can also be obtained easily, and these parameters describe the internal states of the battery.
The present paper is organized as follows: The experimental settings and approach are given in
Section 2, and an introduction of the principle and architecture of the semi-empirical capacity fading model is discussed in the subsequent Section. The differences in the estimation results with ECBE are presented from our experimental results. Conclusions and future works are given in the last Section.
3. Results and Discussion
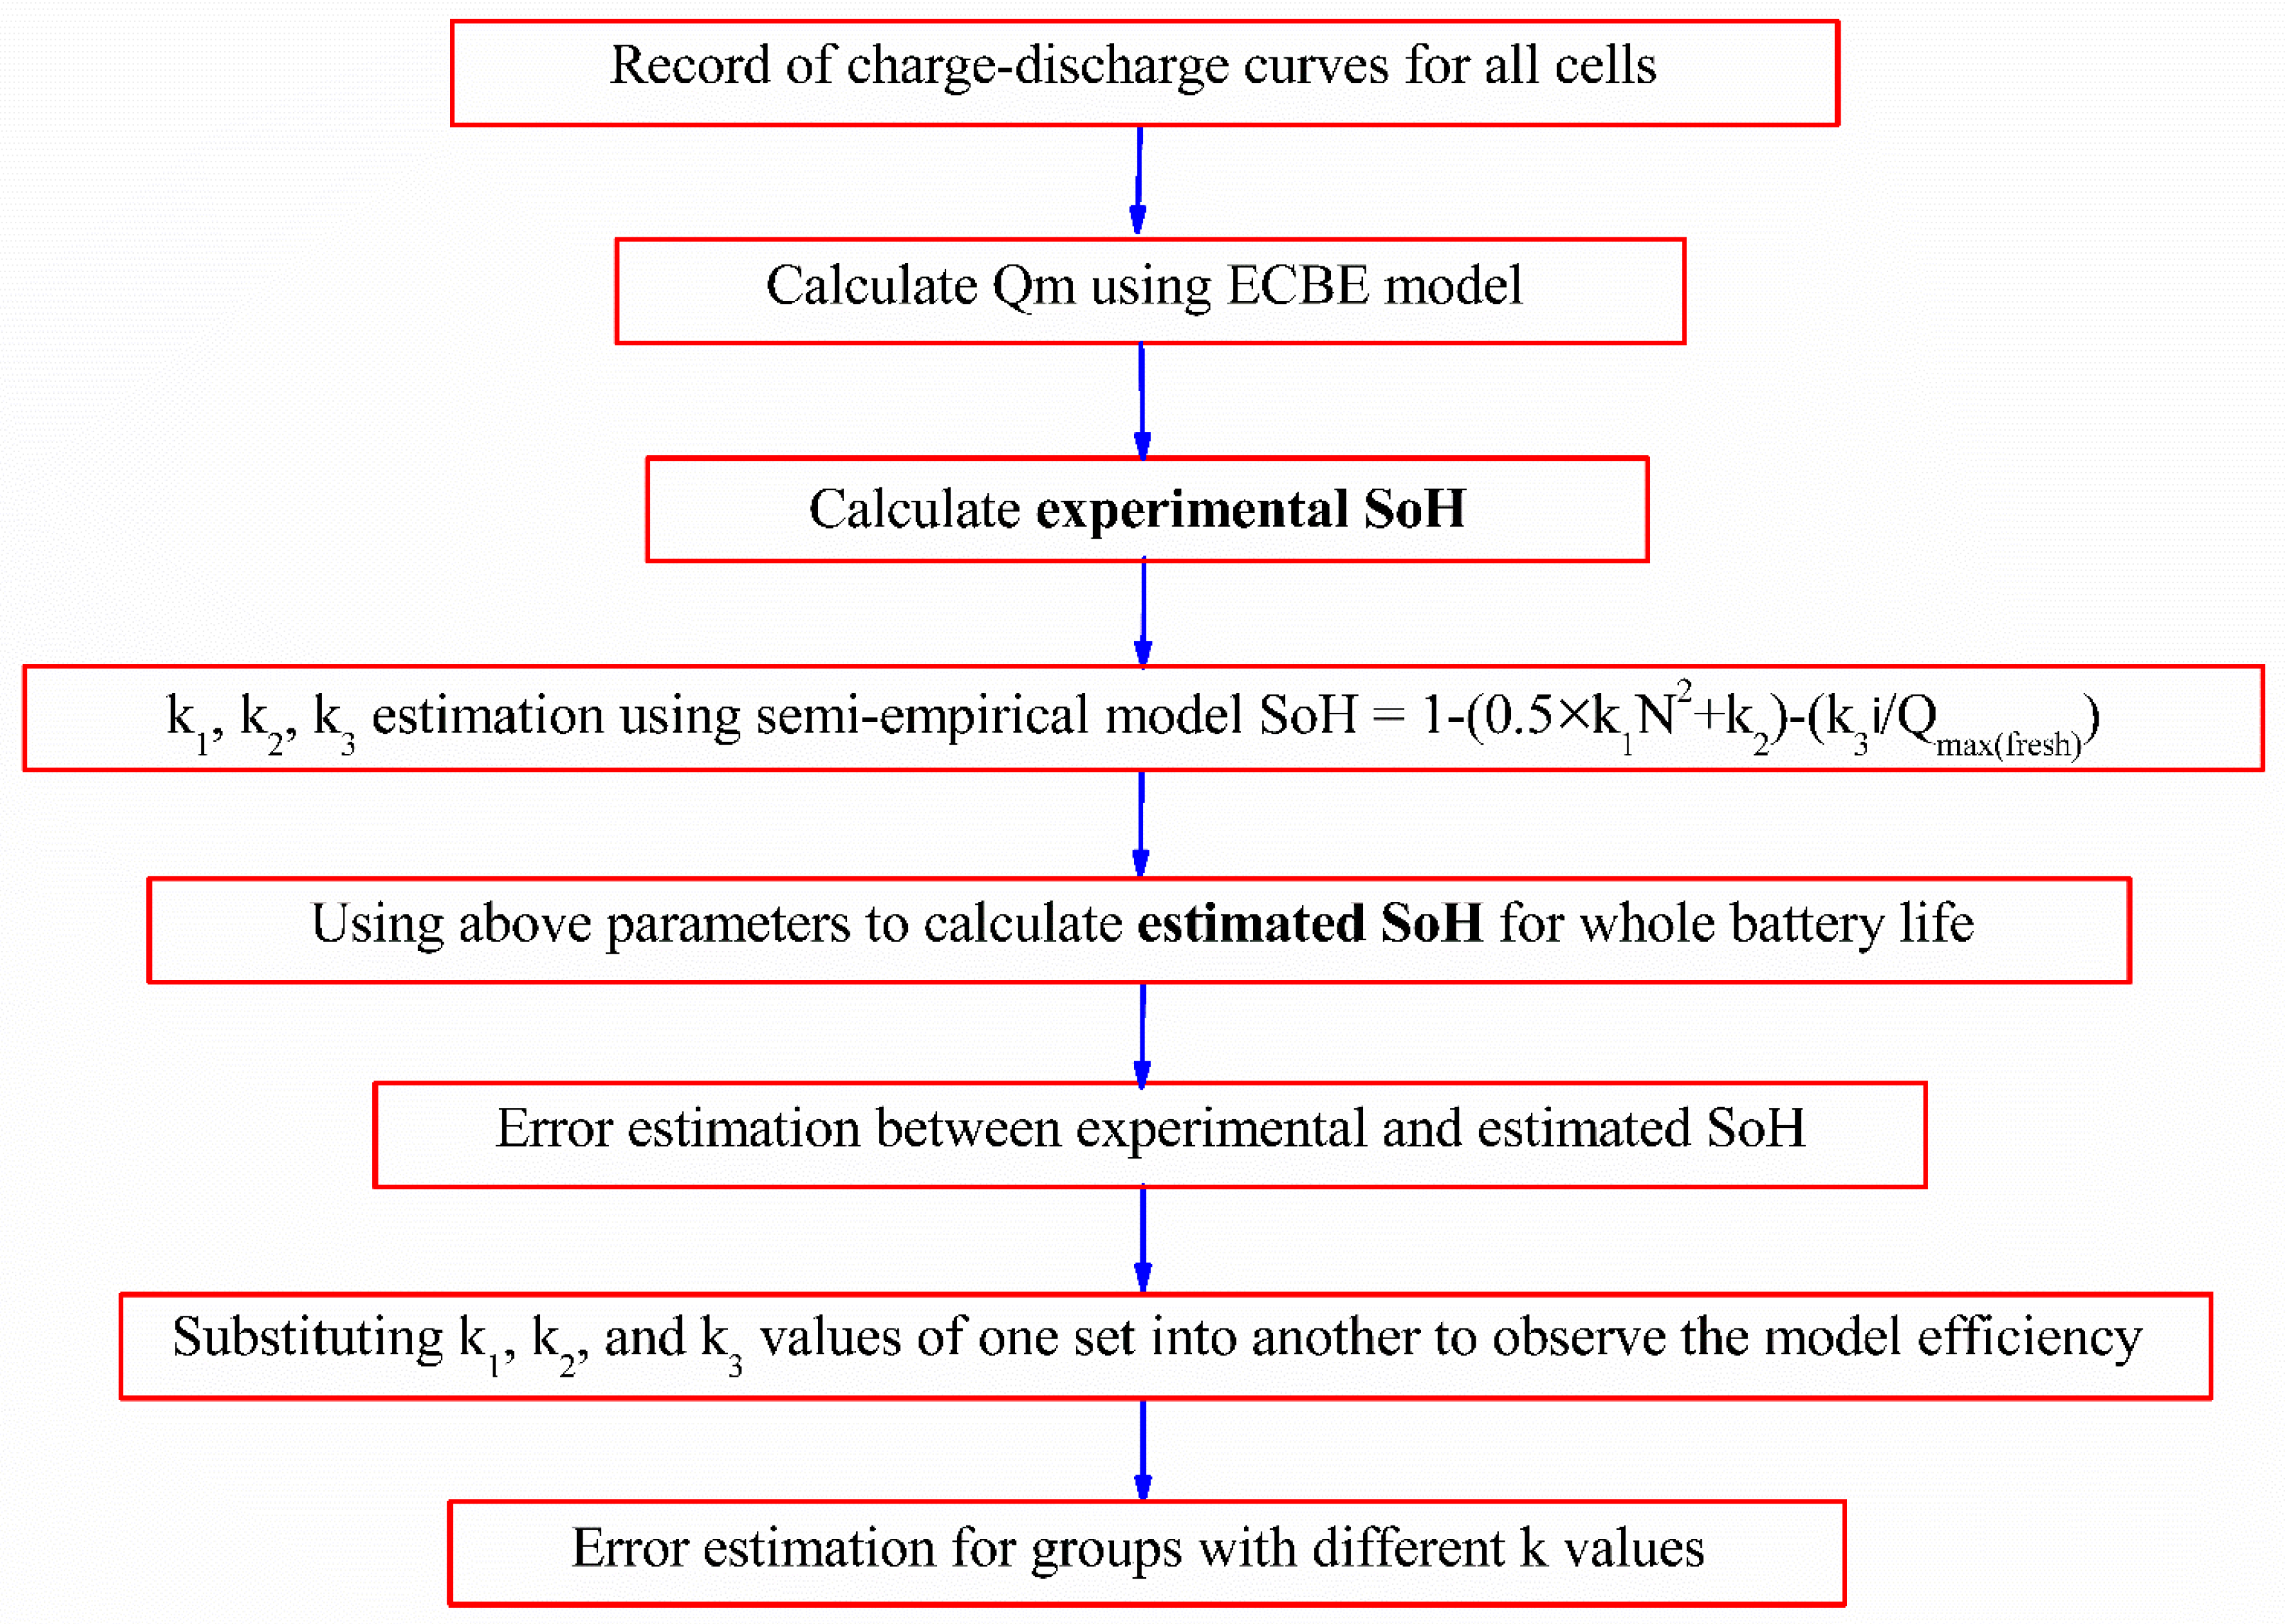
Calculation of experimental SoH was performed using the Qm value obtained from the ECBE model for each cell tested for a different number of cycles, and the results are shown in
Table 2. The SoH drops as the cycle number increases as expected. Two decimals point were used inconsistently with the accuracy of the SoH values obtained using the ECBE model as verified in our previous work (its accuracy is better than 99.6%) [
9].
An interesting observation from our experiments is that batteries tested for a similar number of cycles under the same stress conditions show a difference in SoH drop, which signifies variation among the batteries. This could be due to the different imbalance in the internal state for an individual battery [
25]. This renders it difficult to estimate single battery life, but users need to know the degradation of each of their batteries, instead of the entire population of batteries. Furthermore, a large number of battery samples is needed to estimate the population of the batteries, and this can be costly. Furthermore, one would expect a large standard deviation of the batteries degradation rate as electrochemistry degradation cannot be tuned as precisely as electronic components, in general.
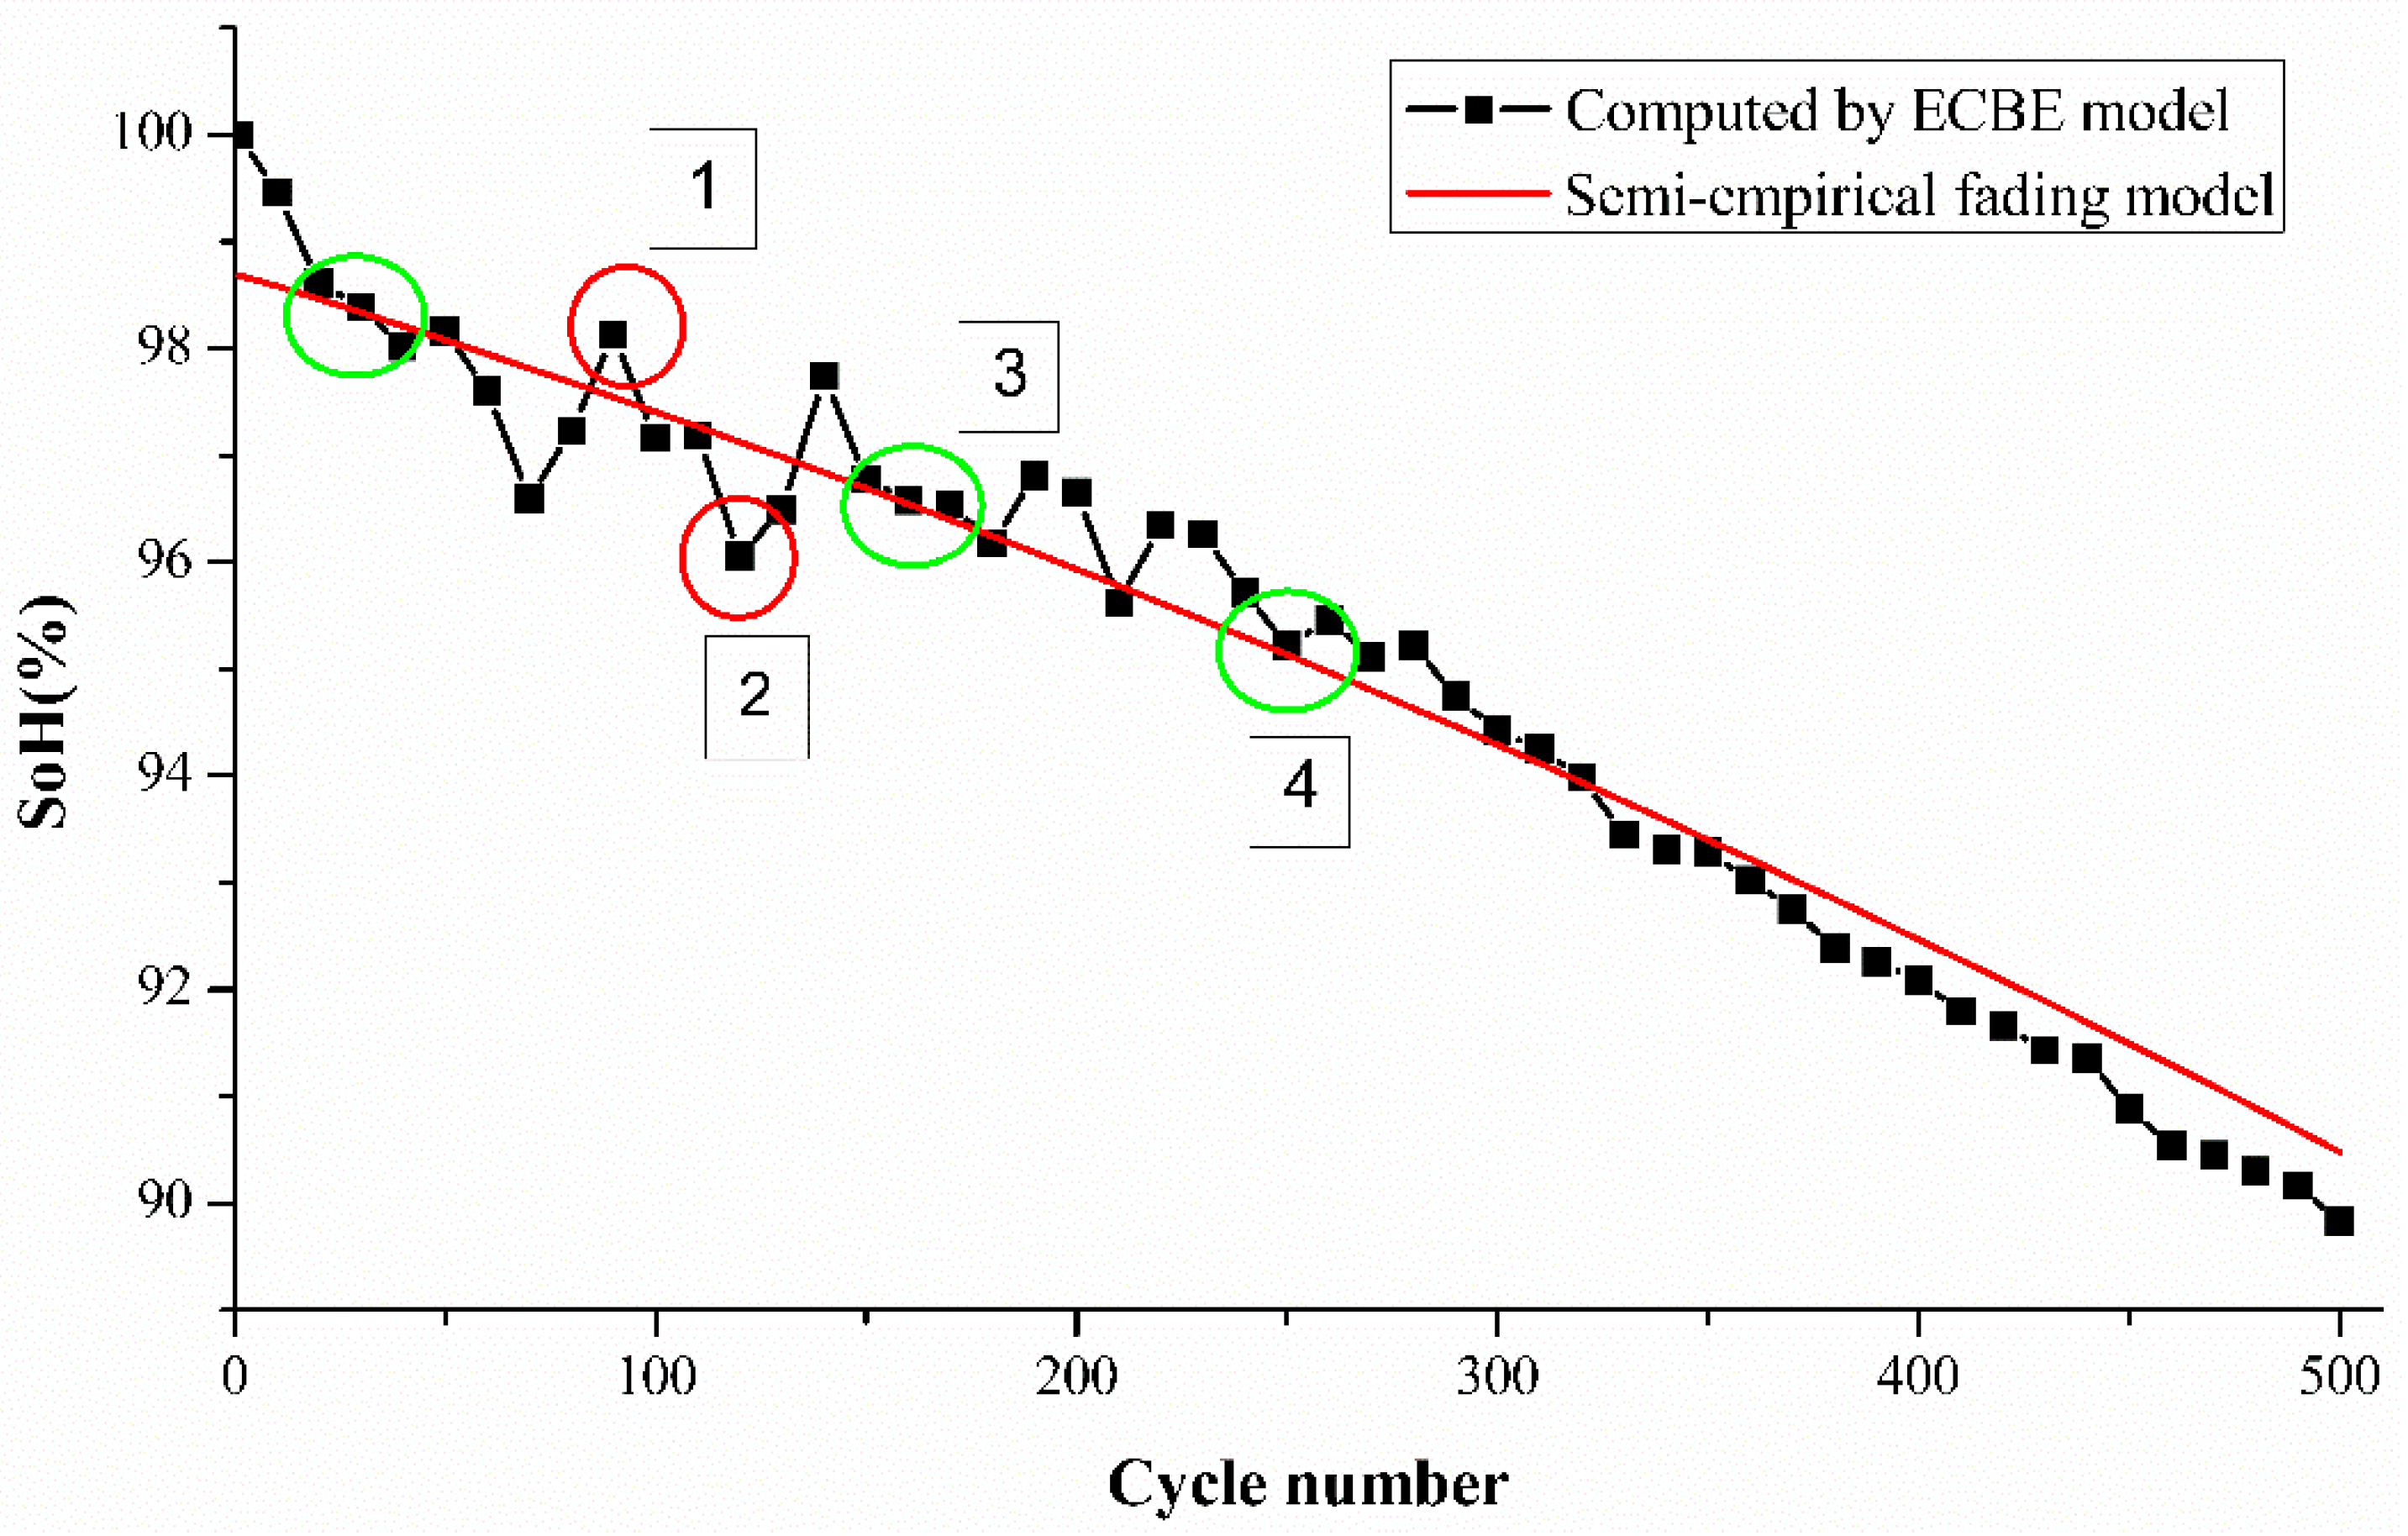
The computed SoH values were used to obtain the k1, k2, and k3 values using the above-mentioned semi-empirical capacity fading model with three different cycle numbers. We arbitrarily chose data of the
,
, and
cycle for all the batteries which are marked by a green circle in
Figure 3. The computed values are shown in
Table 3, and again, it is observed that the k values vary among the batteries from the same set tested under the same conditions for an equal number of cycles. This is in correlation with the SoH results which could be due to the difference in capacity degradation [
26,
27]. In other words, assessing the SoH of batteries tested from the same batch under the same working conditions for companies’ quality and reliability check can be difficult. It is also interesting to note that a few of the parameters have negative values. The negative k1 and k2 values were observed for the batteries with higher SoH which shows that there is an improvement in battery health. Some of the defects arising during the battery lifetime can enhance the battery lifetime due to improvement in the overall speed at which Li ion travels as published by Hong et. al. [
28]. Researchers believe that an electrode’s lithium transport properties are fundamentally changed due to particle defects and this can enable lithium ions to penetrate inside the cathode in multiple directions. The reactive surface area increases in this process and more efficient exchange of Li ions is possible between the two electrodes [
29]. However, more negative values were observed for k3 but the values are very close to 0 and thus can be ignored. These negative values could also be a result of a measurement error, thus we used two batteries at varying discharged cycle numbers and found that the negative values arise only for two batteries except for parameter k3. This shows the efficiency of the model used in this work.
We use the computed k values for each cell to determine the SoH of the cell over the number of tested cycles, as shown in
Figure 3, where Cell A2 is used for demonstration. Green circles indicate the points (the range of the half-cycle period) which were used to find the k values in the last step. The values of k1 and k2 were severely affected by the ambient temperature, while k3 was affected by the discharge current. The operating conditions of this experiment were room temperature and 1 C-rate discharge current, so we can observe that the difference between k-values of all cells is not large, but there is still a gap between individual samples.
From
Figure 3, it is evident that the differences between the experimental SoH and estimated SoH vary over their lifetime for the tested cells. The estimation differences are higher for cycle numbers from 1 to 60. The rapid degradation of SoH from 1 to 60 cycles is likely to be attributed to the transformation of the hexagonal structure to a cubic spinel structure of the electrode which occurs via an intermediate phase as observed previously by Tan et al. [
15].
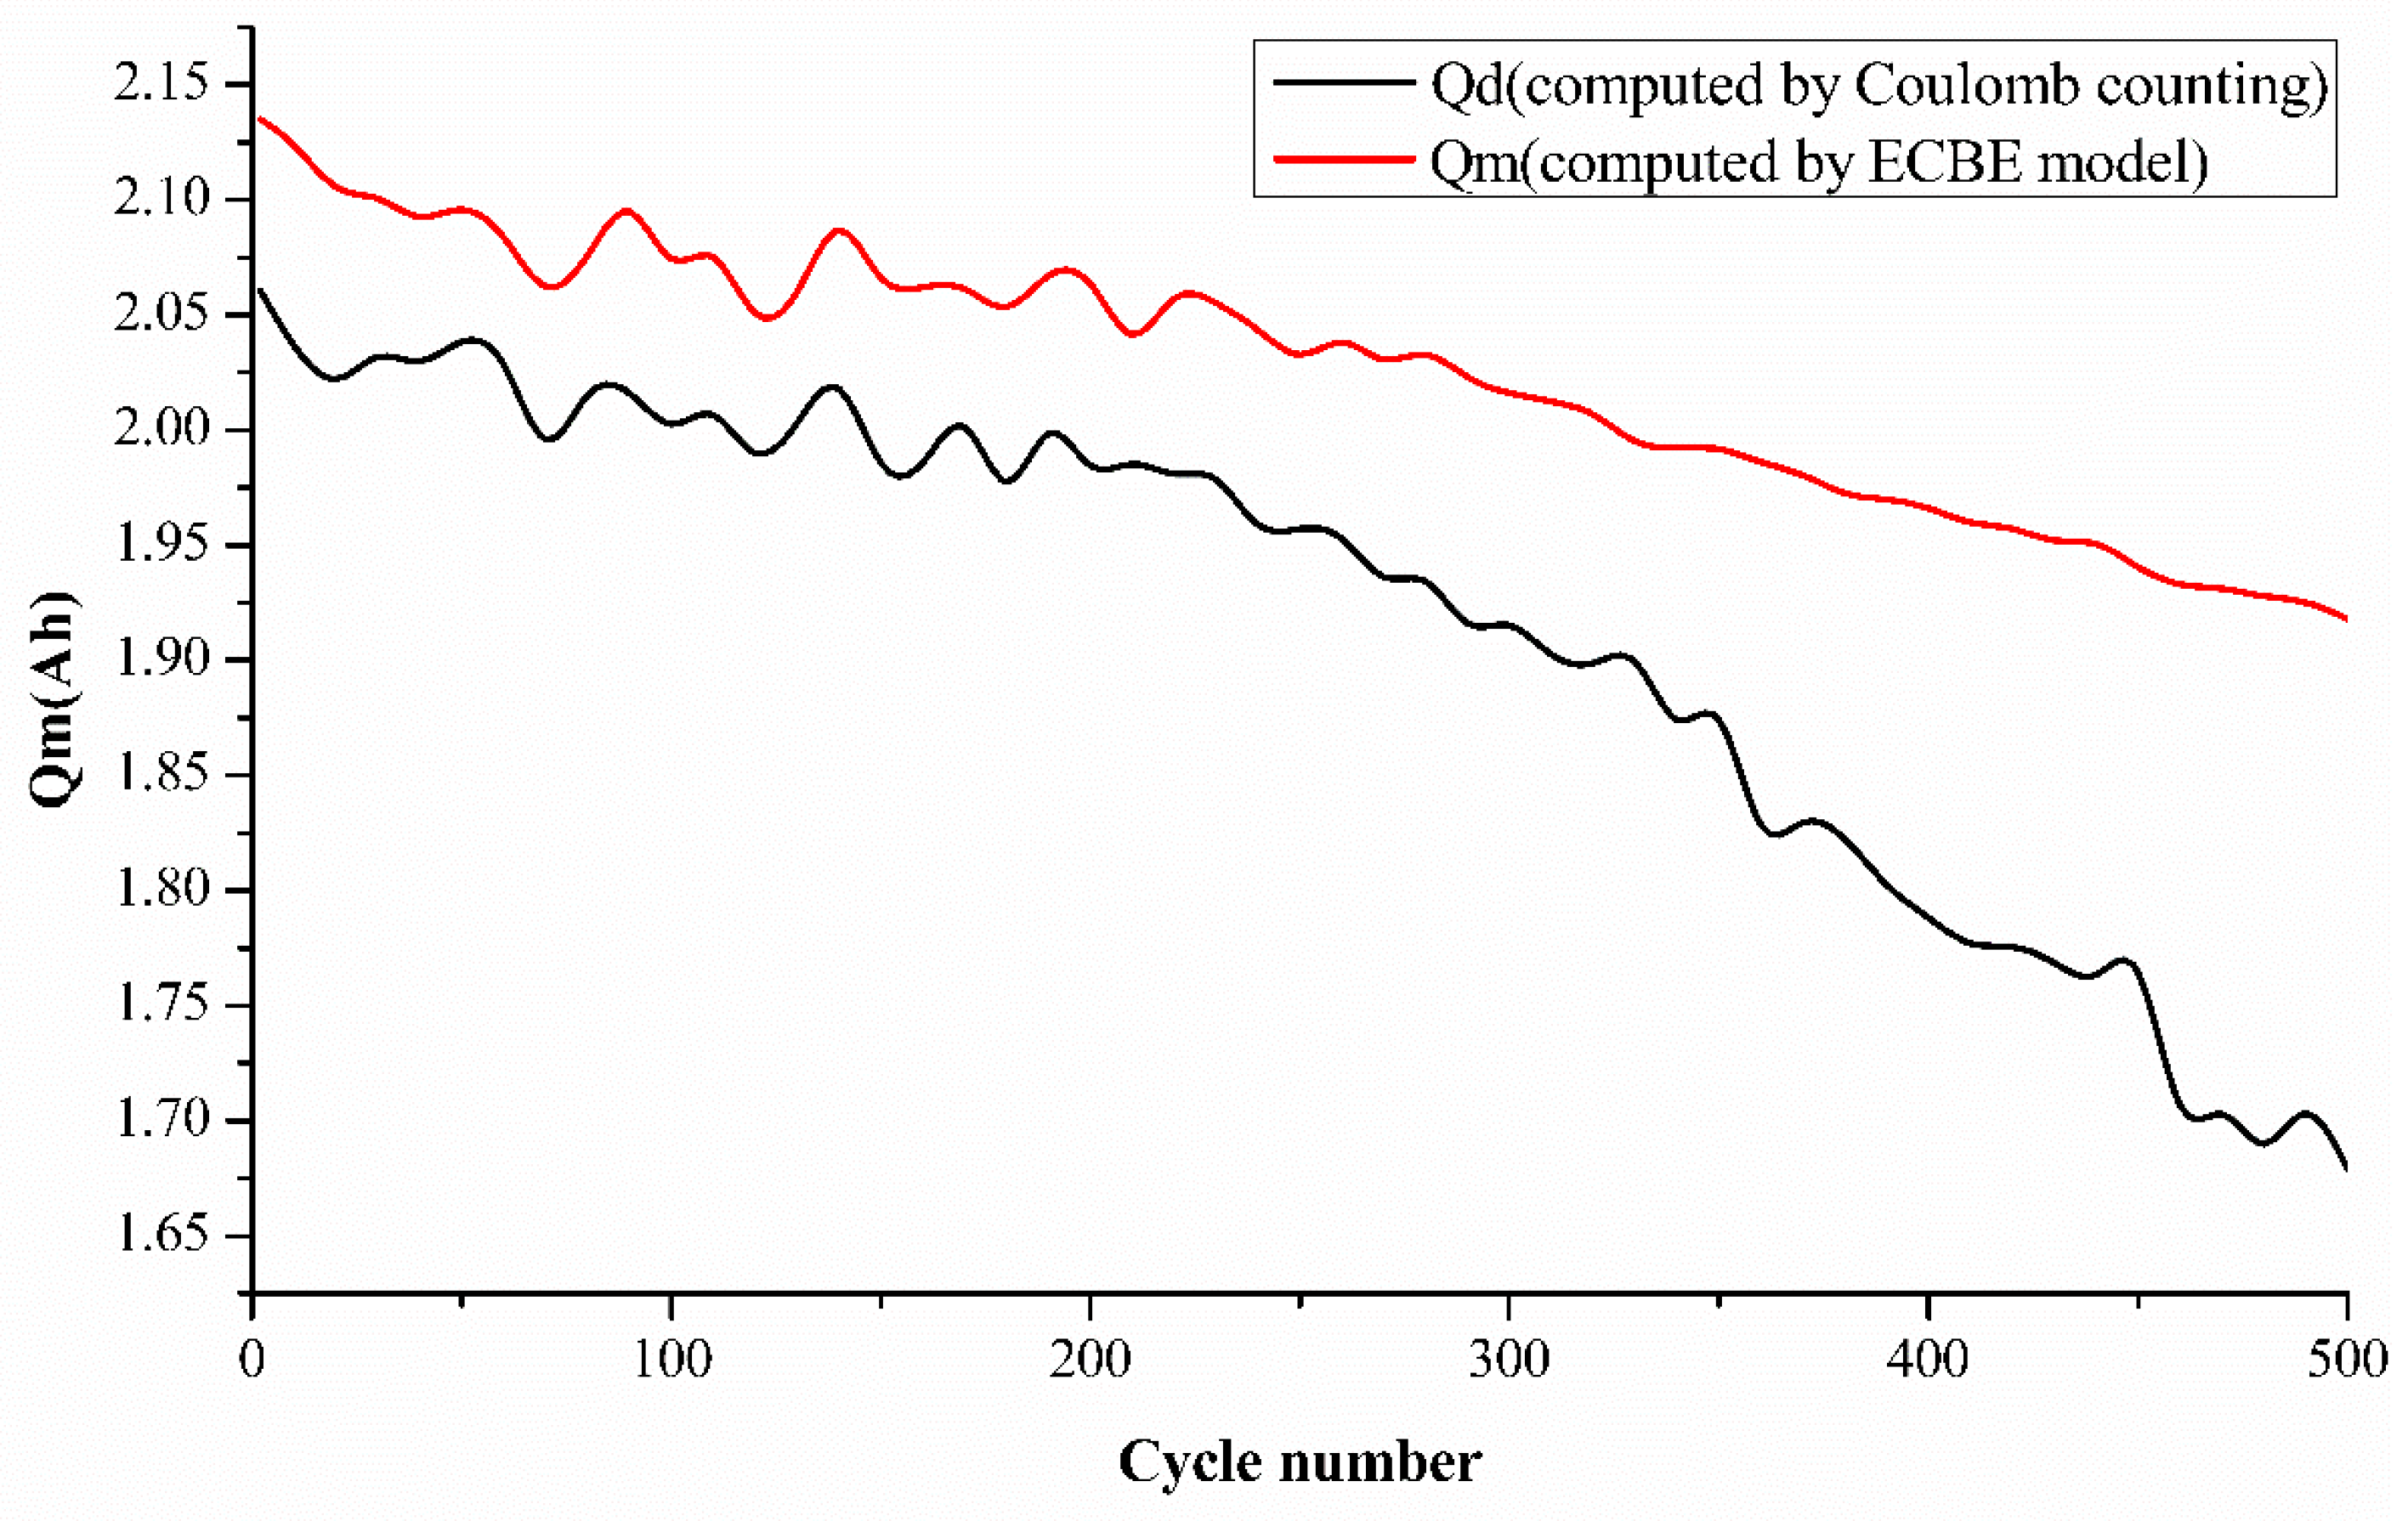
To further validate our ECBE model results, we have also added the Coulomb counting result in
Figure 4. However, it was mentioned in the introduction that there are many disadvantages to employing the Coulomb counting method, as mentioned by researchers. Coulomb counting employs an open-loop estimator, which generates larger cumulative errors. It also does not take a change in the battery’s capacity into account as the battery ages [
30]. Other disadvantages of the open-loop are its sensitivity to the current sensor precision and uncertainty of initial SoC [
31]. It also shows an increase in charge at certain cycles, as observed during the ECBE charge estimation results. The higher value of Qm over Qd is expected, as explained in Leng et al.’s work [
15]. A very interesting point is observed from
Figure 4 regarding the charge increase at various aging cycles. This is an unusual phenomenon observed in our results, and we would like to investigate it further by performing a charge cycle-dependent test for batteries. This will be our future work, and we would hope to share our findings from our test with the scientific community very soon.
To probe further into the differences in the estimation to investigate the usefulness of the model for SoH estimation, a comparison of the differences between the estimated and experimental SoH over the battery lifetime was performed.
3.1. Comparison of Estimation Difference for the Case of an Individual Cell
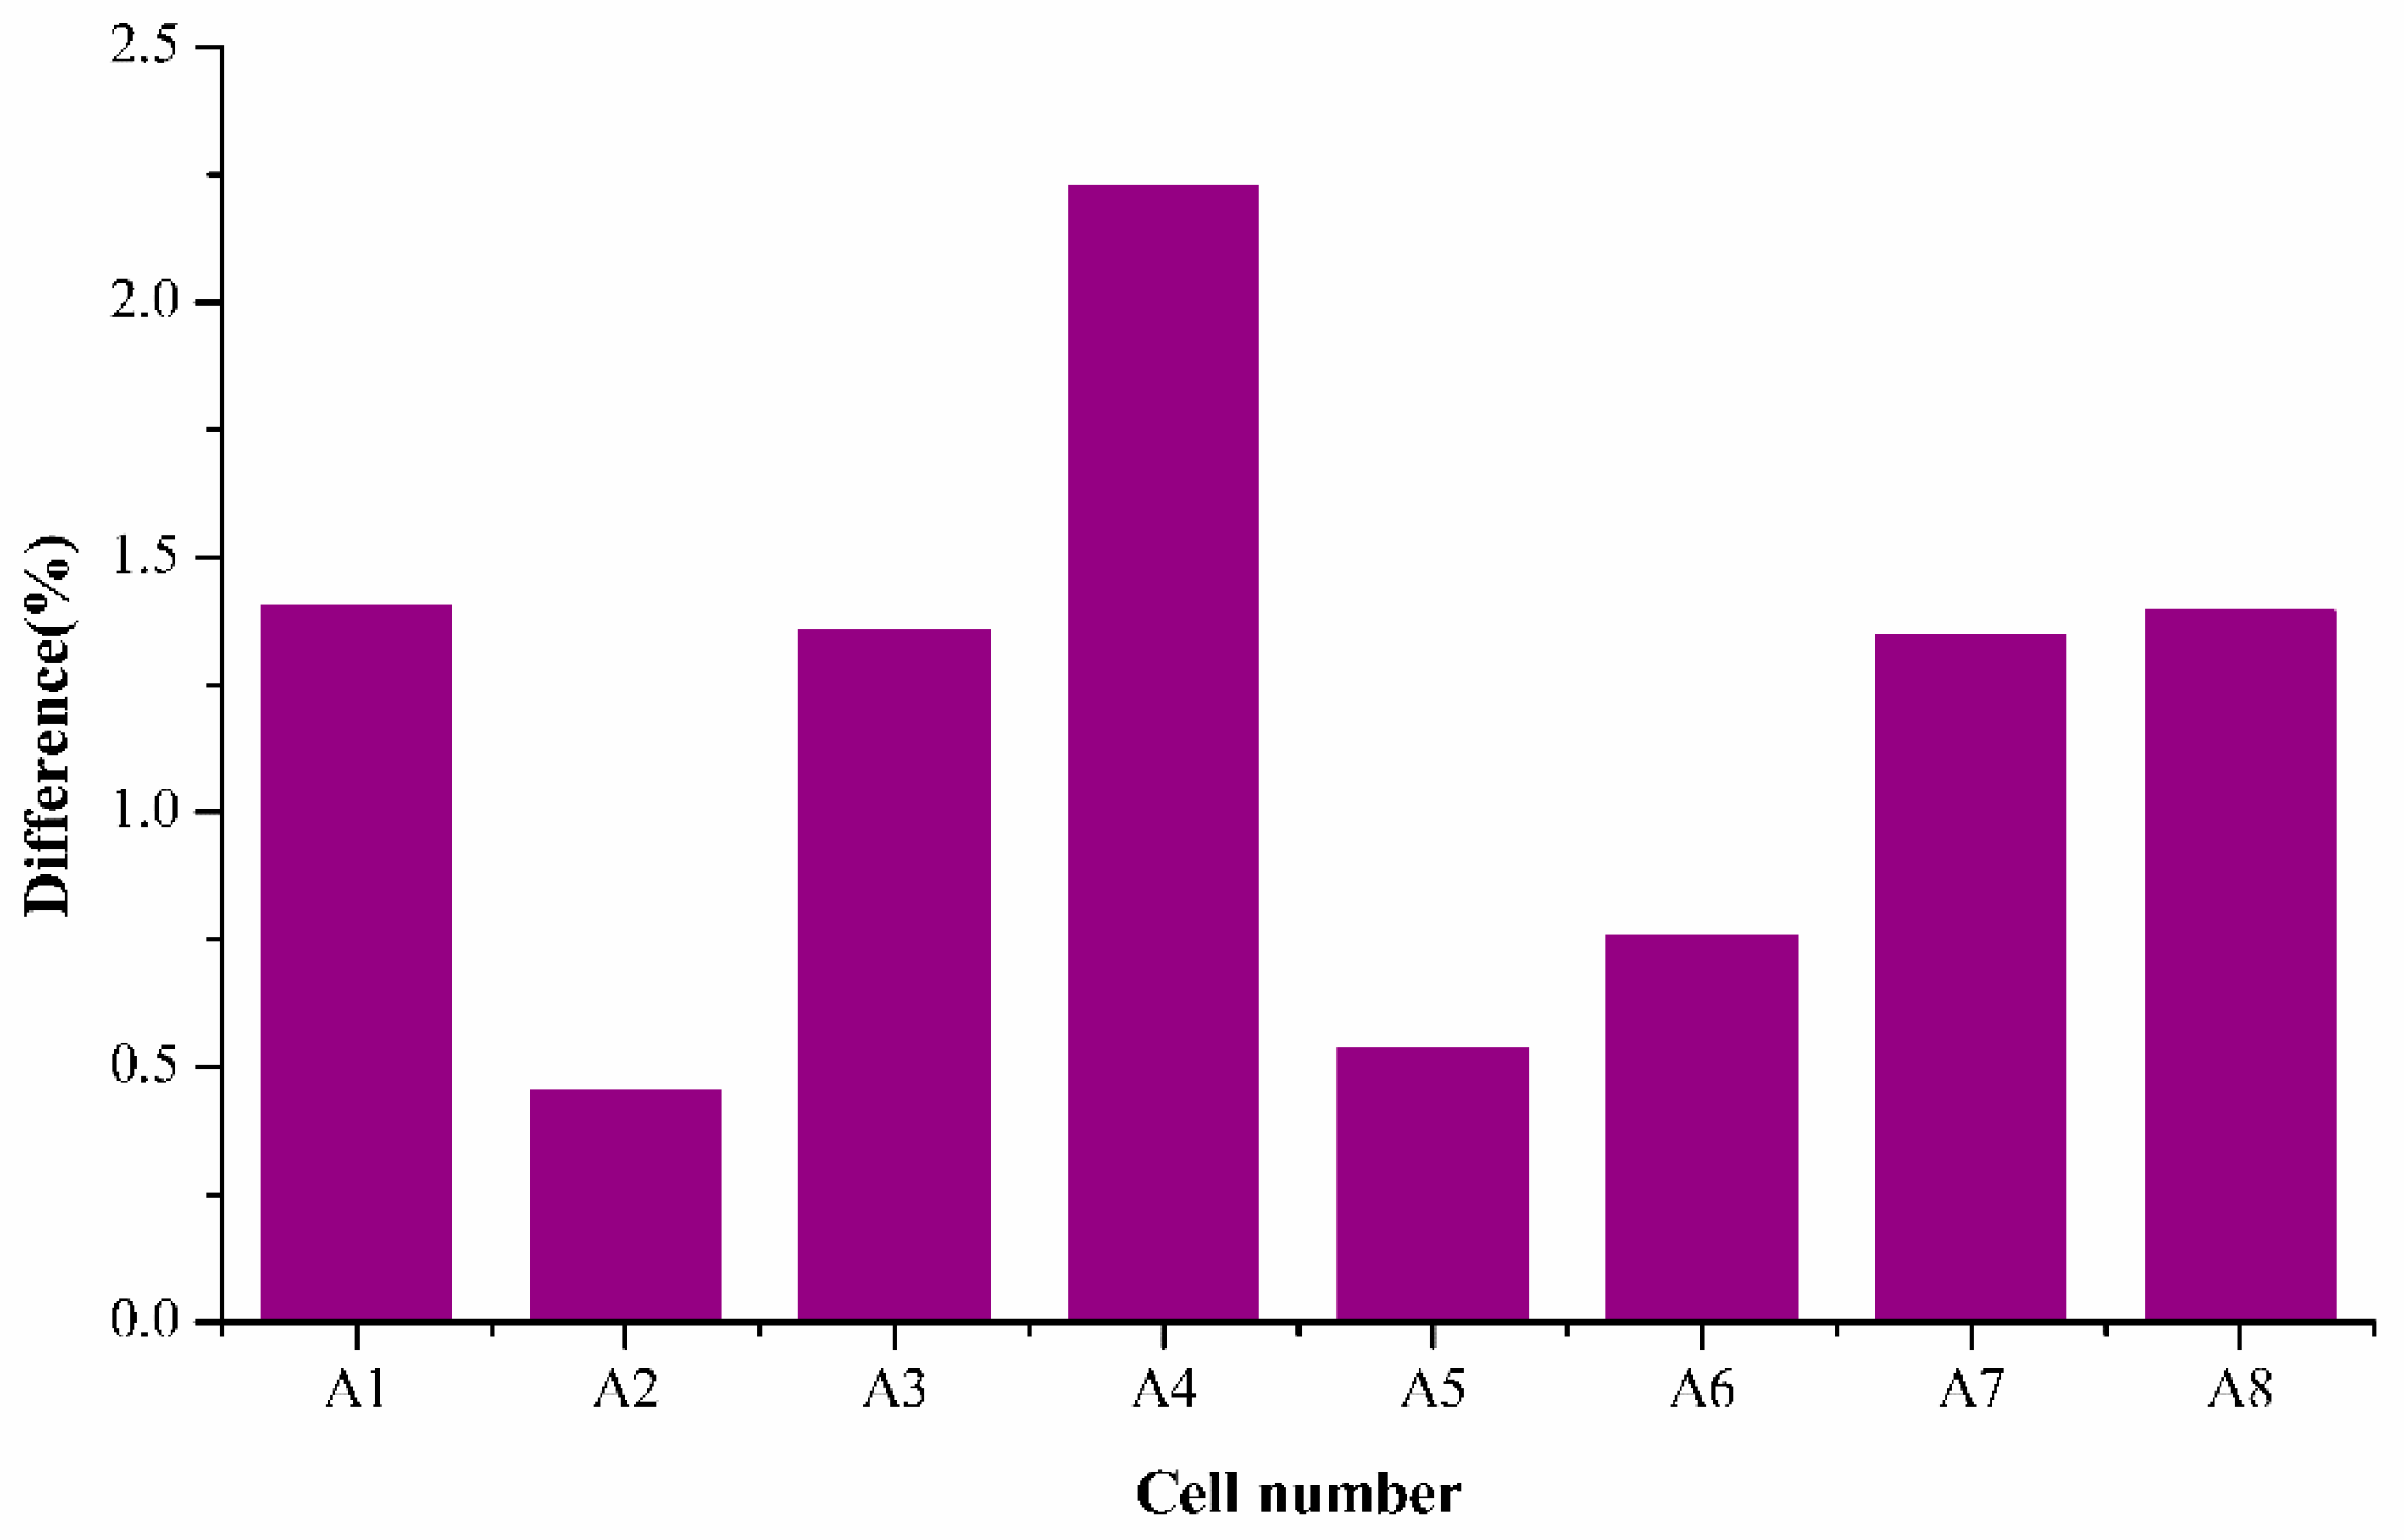
To verify the ability of the semi-empirical fading model for estimating the SoH of batteries over the number of cycles tested as shown previously, the percentage difference (which will be termed as difference hereafter) was calculated for each cell between the experimental and estimated SoH and the results are shown in
Figure 5.
It is noticed that the average mean difference was around 1.2%, which is an acceptable difference according to literature. The highest percentage difference was found to be 2.22% of A4, and the remaining samples were all within the acceptable range of 1.5% which demonstrates the capability of the semi-empirical fading model in accurately estimating the decrease of SoH for all the cells tested for whole cycles ranging. It is also interesting to note that difference for cells A2, A5, and A6 are very low (around 0.5%), which represents the model’s effectiveness in determining accurate SoH.
After verifying the ability of the semi-empirical fading model of a LiB cell, we examined the ability of the extracted k values to estimate the SoH of other cells from the same batch. To verify this, average, k values obtained in our previous steps were calculated, as shown in
Table 4, and they were used to estimate the SoH of the batteries over the number of cycles tested.
The average values in
Table 4 were used to estimate the SoH of the batteries over the number of cycles tested, and the comparison results are shown in
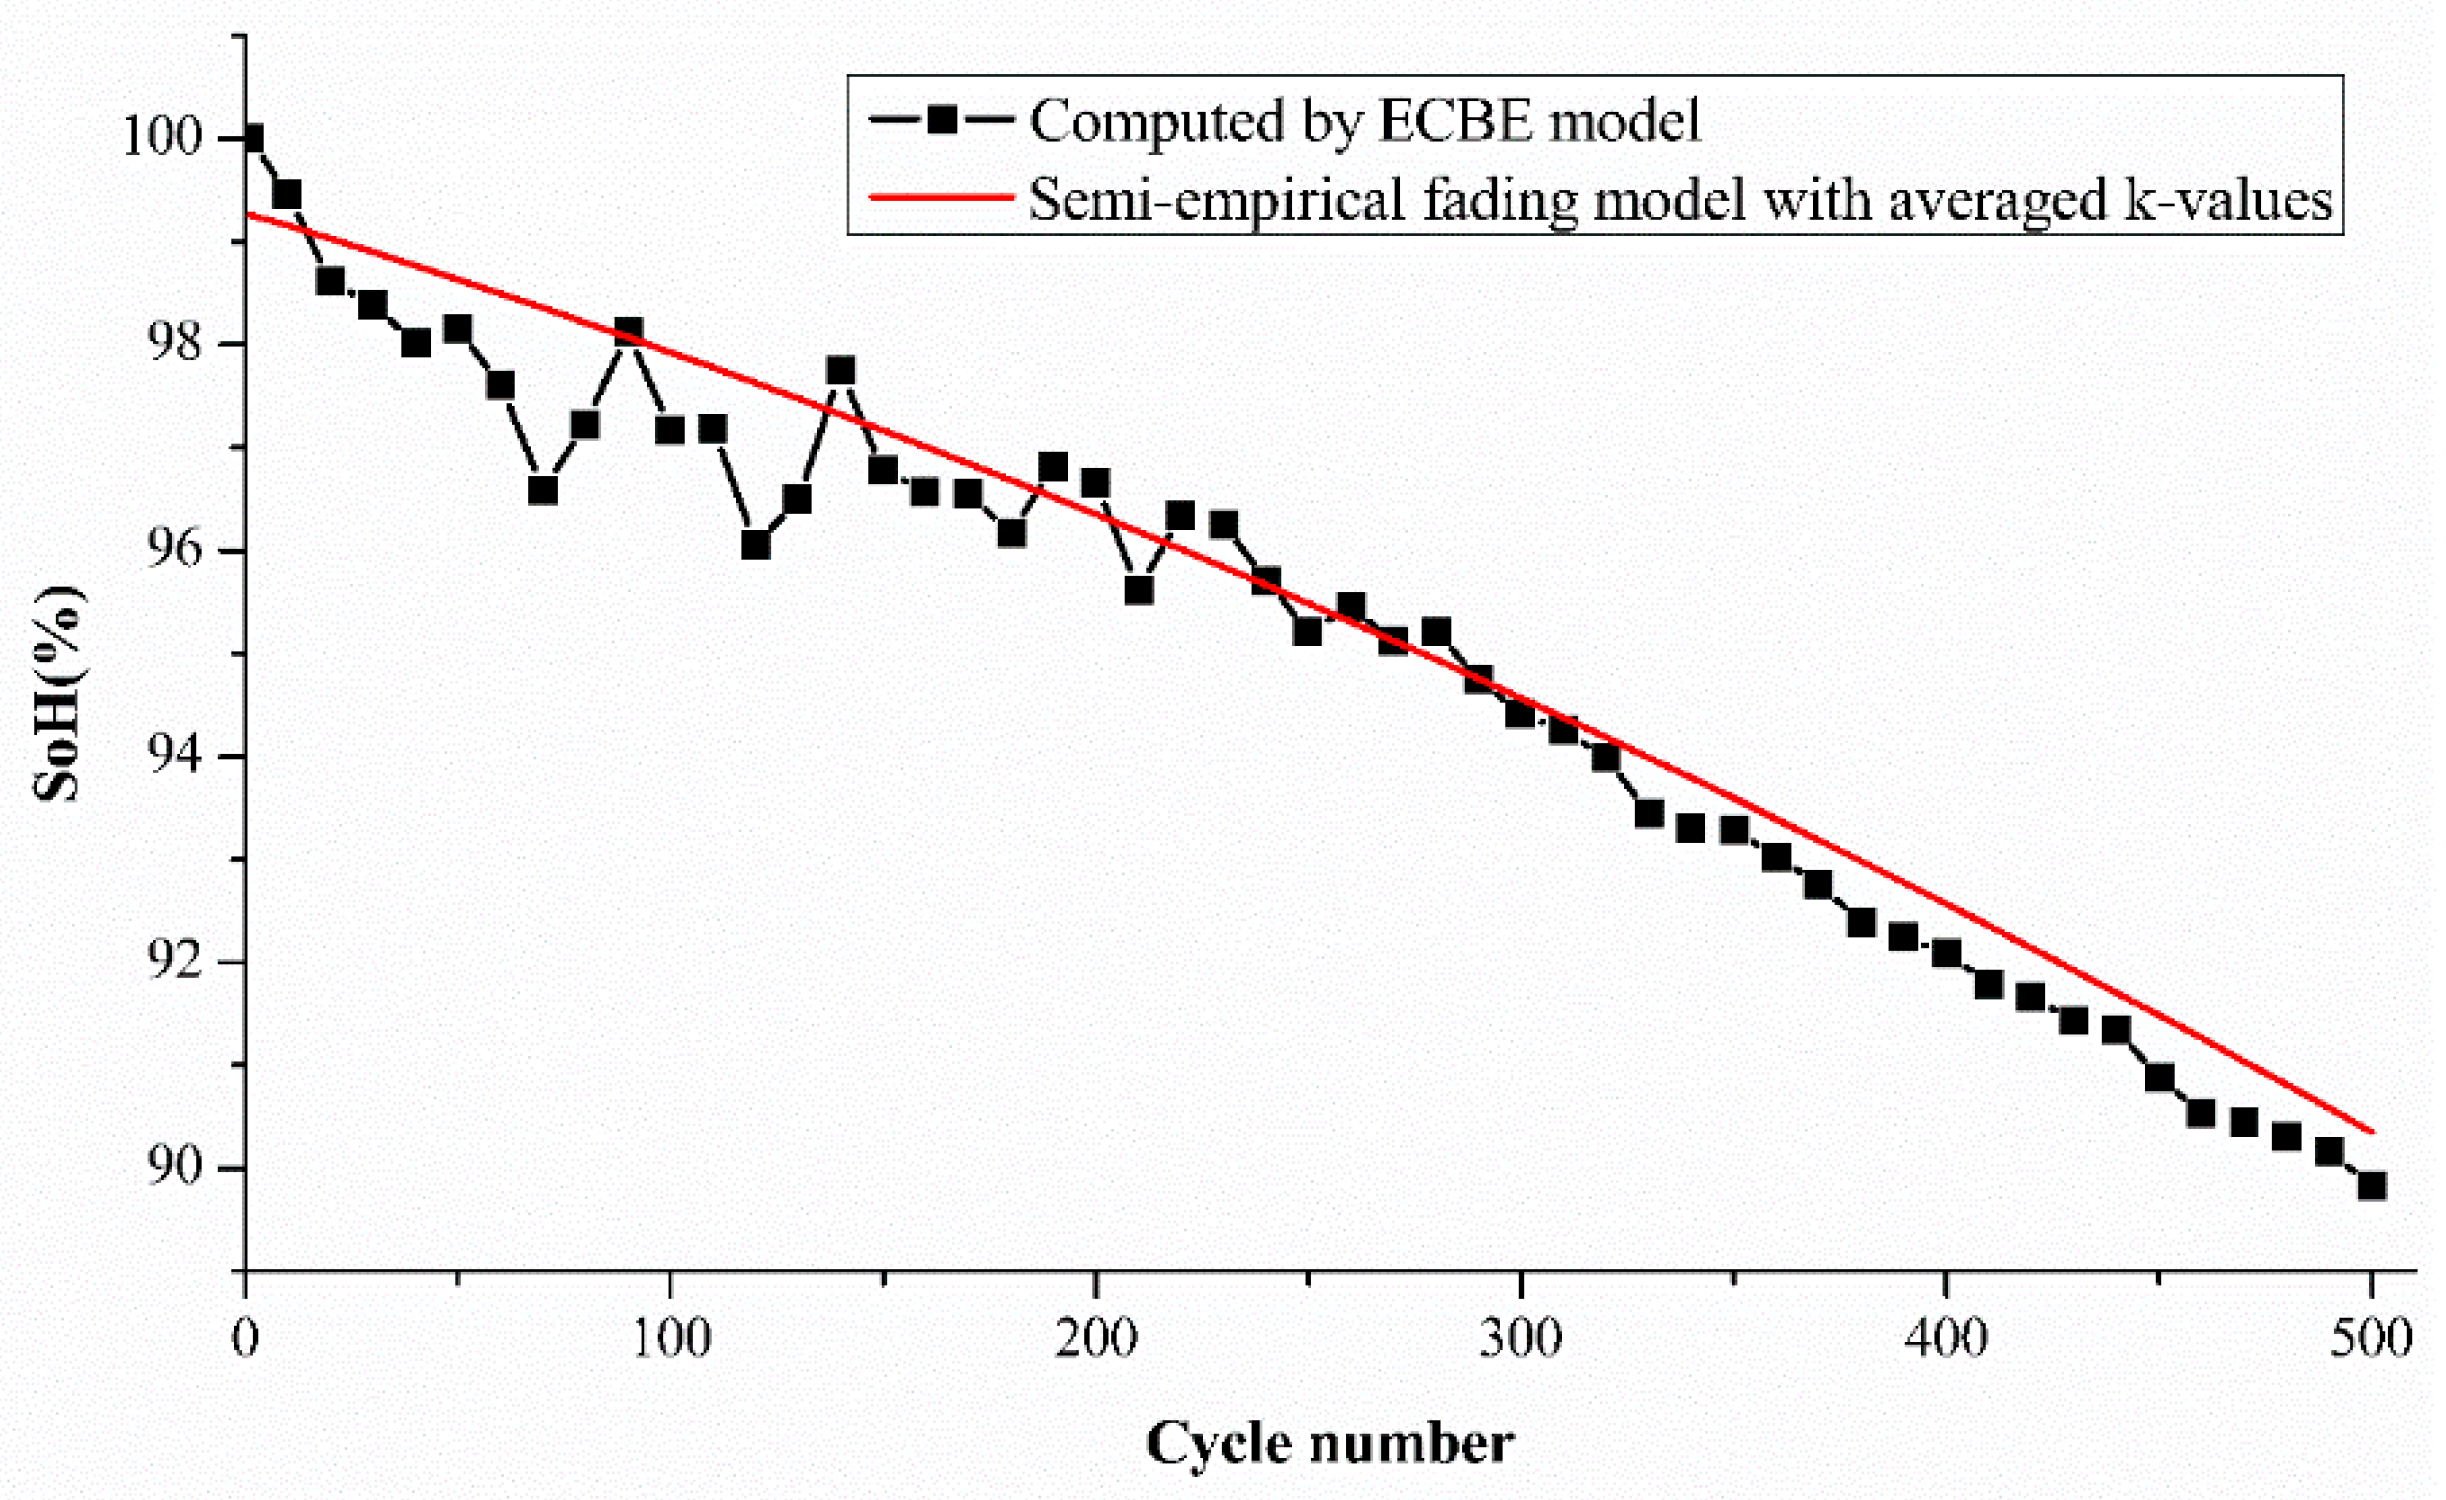
Figure 6. Cell A2 is used to demonstrate the comparison. It is again observed that the estimation difference is higher for cycle numbers from 1 to 60, as noticed in our previous results. However, the mean difference is still within the range of around 1% in our case.
Figure 6 shows the differences between the estimated SoH and the experimental SoH for cell A2 using the average k values, and the differences are in acceptable limits at each cycle number, up to 500 cycles. The initial and final part are prone to larger differences, but the actual battery degradation can still be accurately estimated from the trend of semi-empirical fading model (red line).
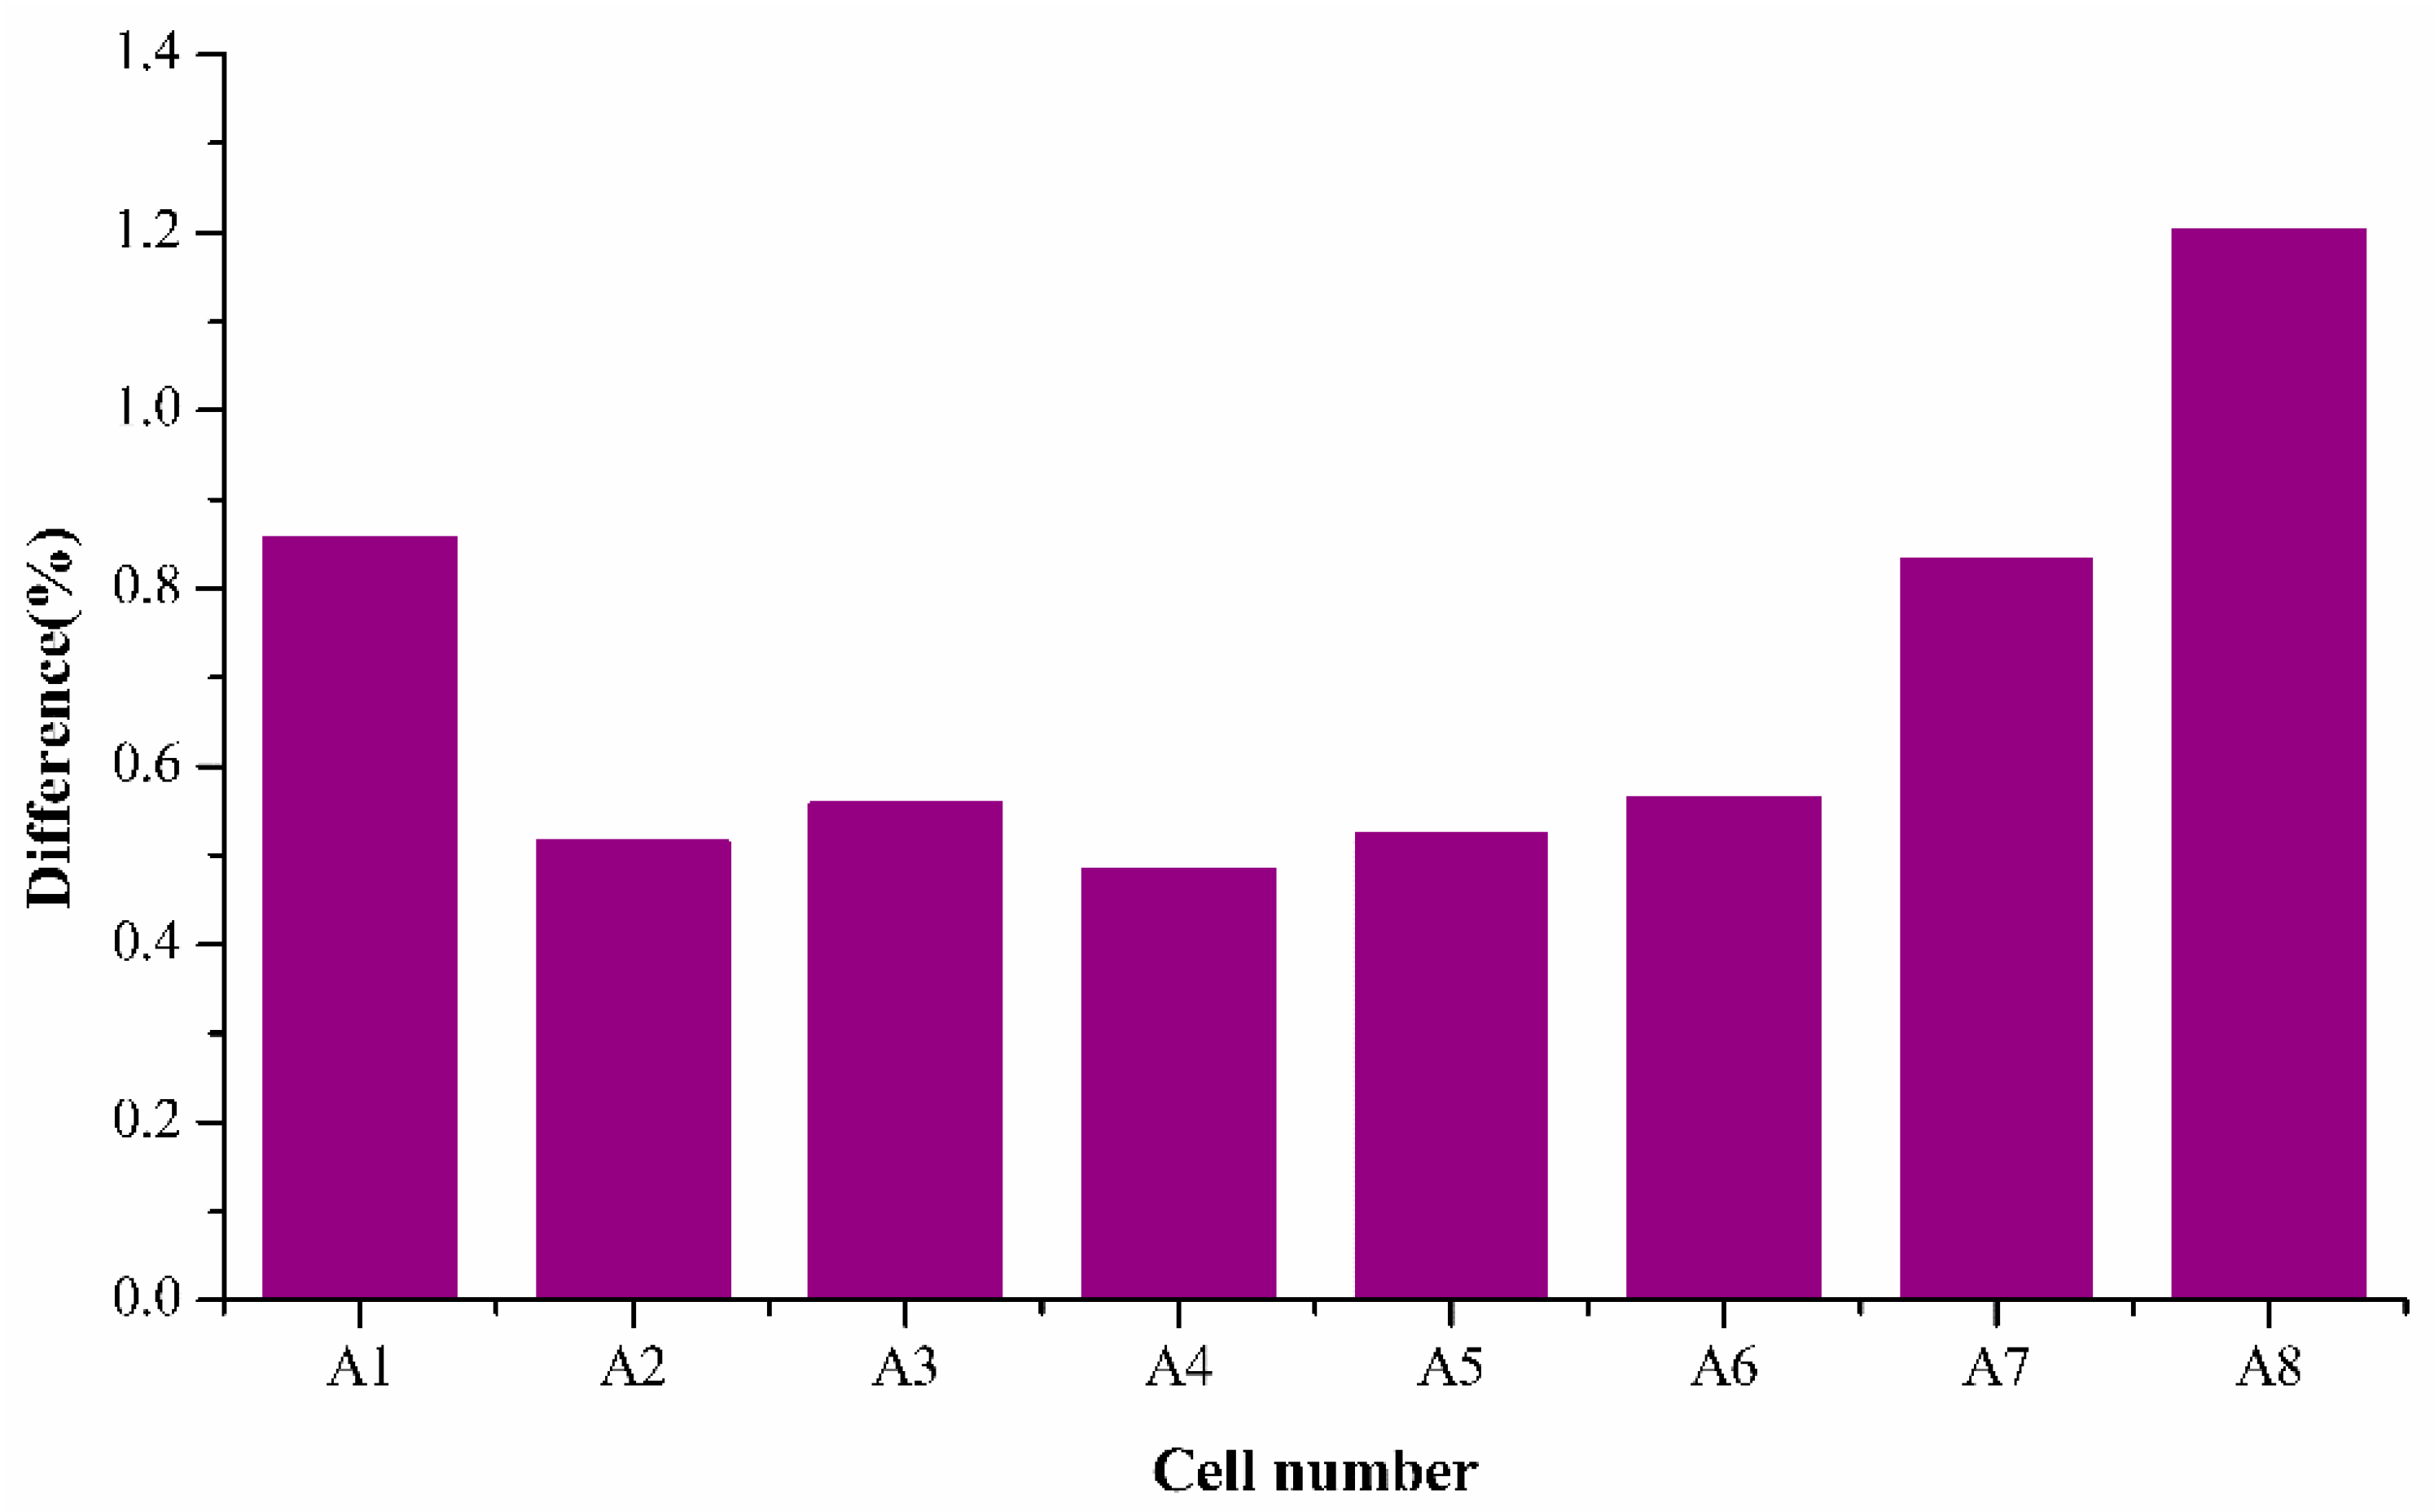
Figure 7 shows the average percentage difference for individual cells when estimated using the average k values, and it is observed that the capacity fading model fitting is in good correlation with the experimental SoH data obtained with the ECBE model with the average k values. The mean difference percentage value is less than 1%, which is even better than the estimations of an individual cell. This shows the robustness of the semi-empirical fading model in estimating SoH for a batch of cells over their respective number of cycles.
3.2. Comparison of Estimation Difference for Batch of Cells
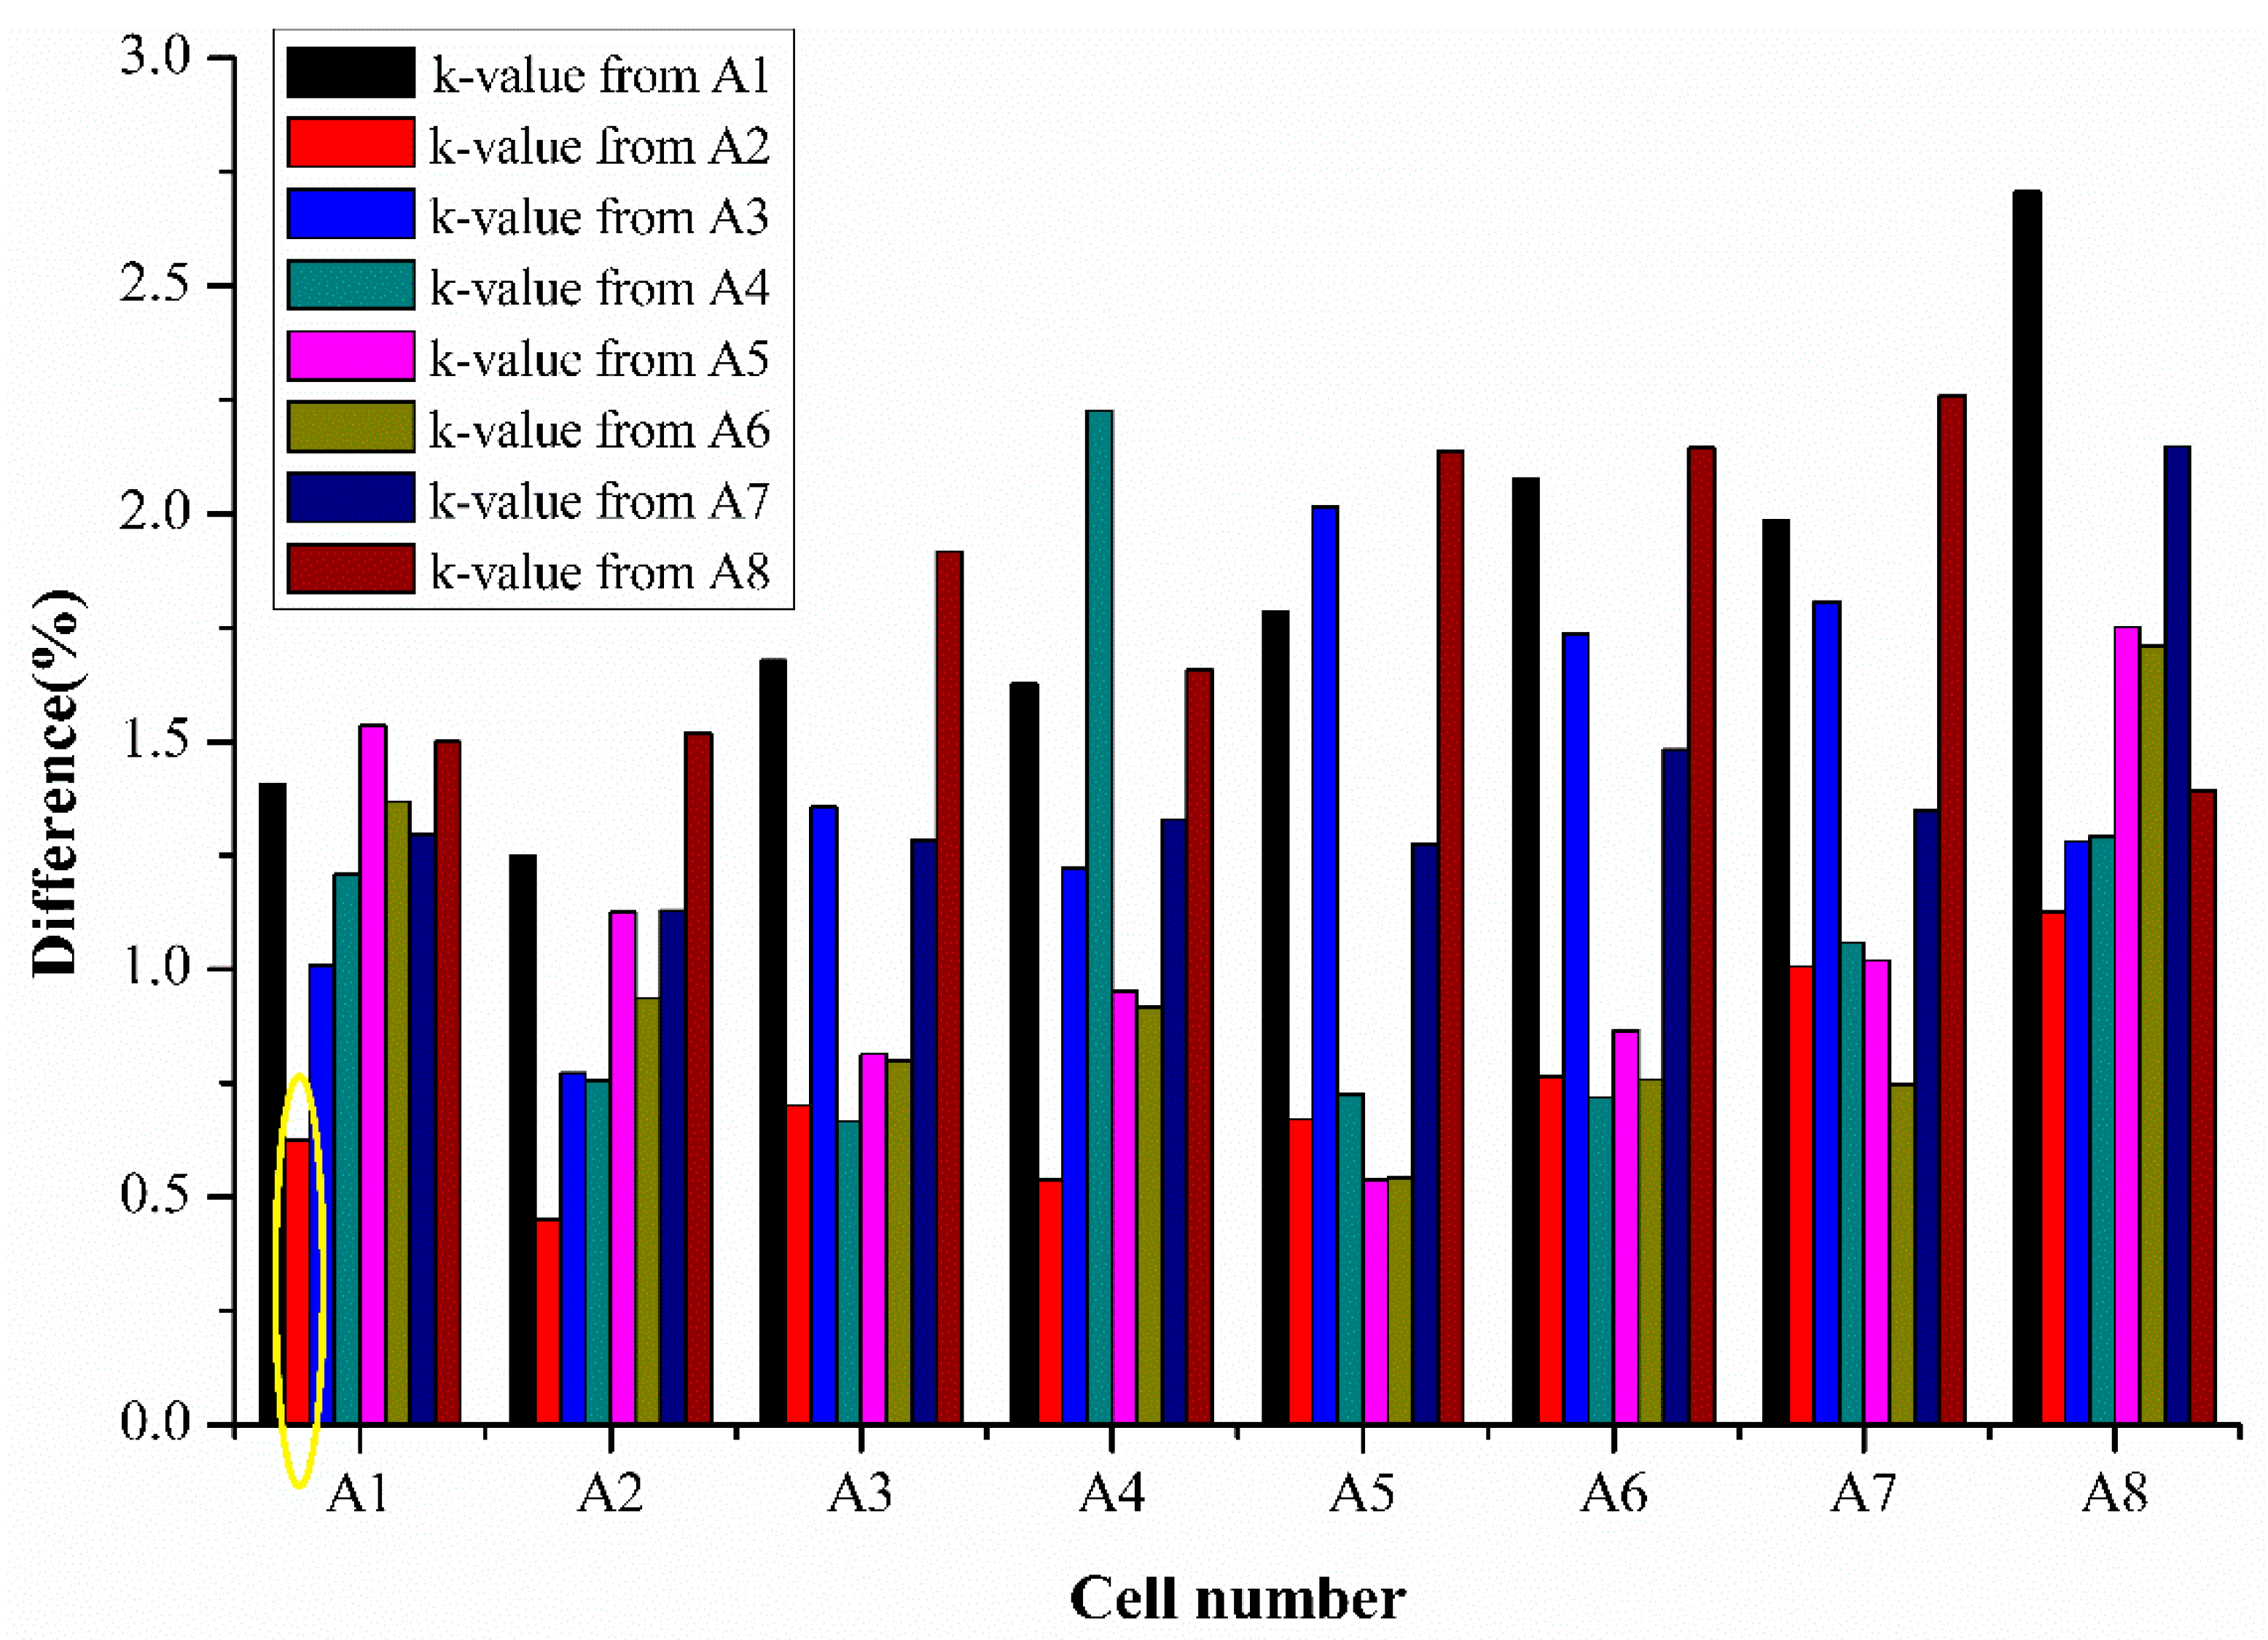
Apart from estimating an individual cell’s SoH using their respective extracted k values and average k values, it is also interesting to observe the potential of the semi-empirical fading model to estimate SoH of different cells using the extracted k values from one cell. This can show the practicality of the semi-empirical fading model for use in estimating SoH for a large number of cells in a set by knowing the k values of only one cell’s parameters. Thus, k values obtained from an individual cell were used to estimate the SoH of other cells, and the difference percentage was calculated for all the cells. The results for the cell difference estimation are presented in
Figure 8 below.
Figure 8 shows the results of the percentage difference for SoH estimation when k values from one cell are used for various cell’s SoH estimation tested from the same batch. The various colors represent the cell number whose k values are used for SoH estimation in
Figure 8. For example, the bar represented in the yellow circle represents the difference percentage of cell 1 when its SoH is estimated using the k values extracted from cell 2.
The results of the percentage difference are generally less than 2.5% for all the cells, as seen from
Figure 8 The difference for cell 7 and 8 which were tested for 650 cycles is in an acceptable range using the estimation using the values obtained from 250 cycles, half of the total cycle numbers estimated. This demonstrates that the simplified model can predict or estimate the SoH with good accuracy using the half-life cell data. Thus, the proposed model can save time in testing and provides rapid SoH estimation with acceptable accuracy.
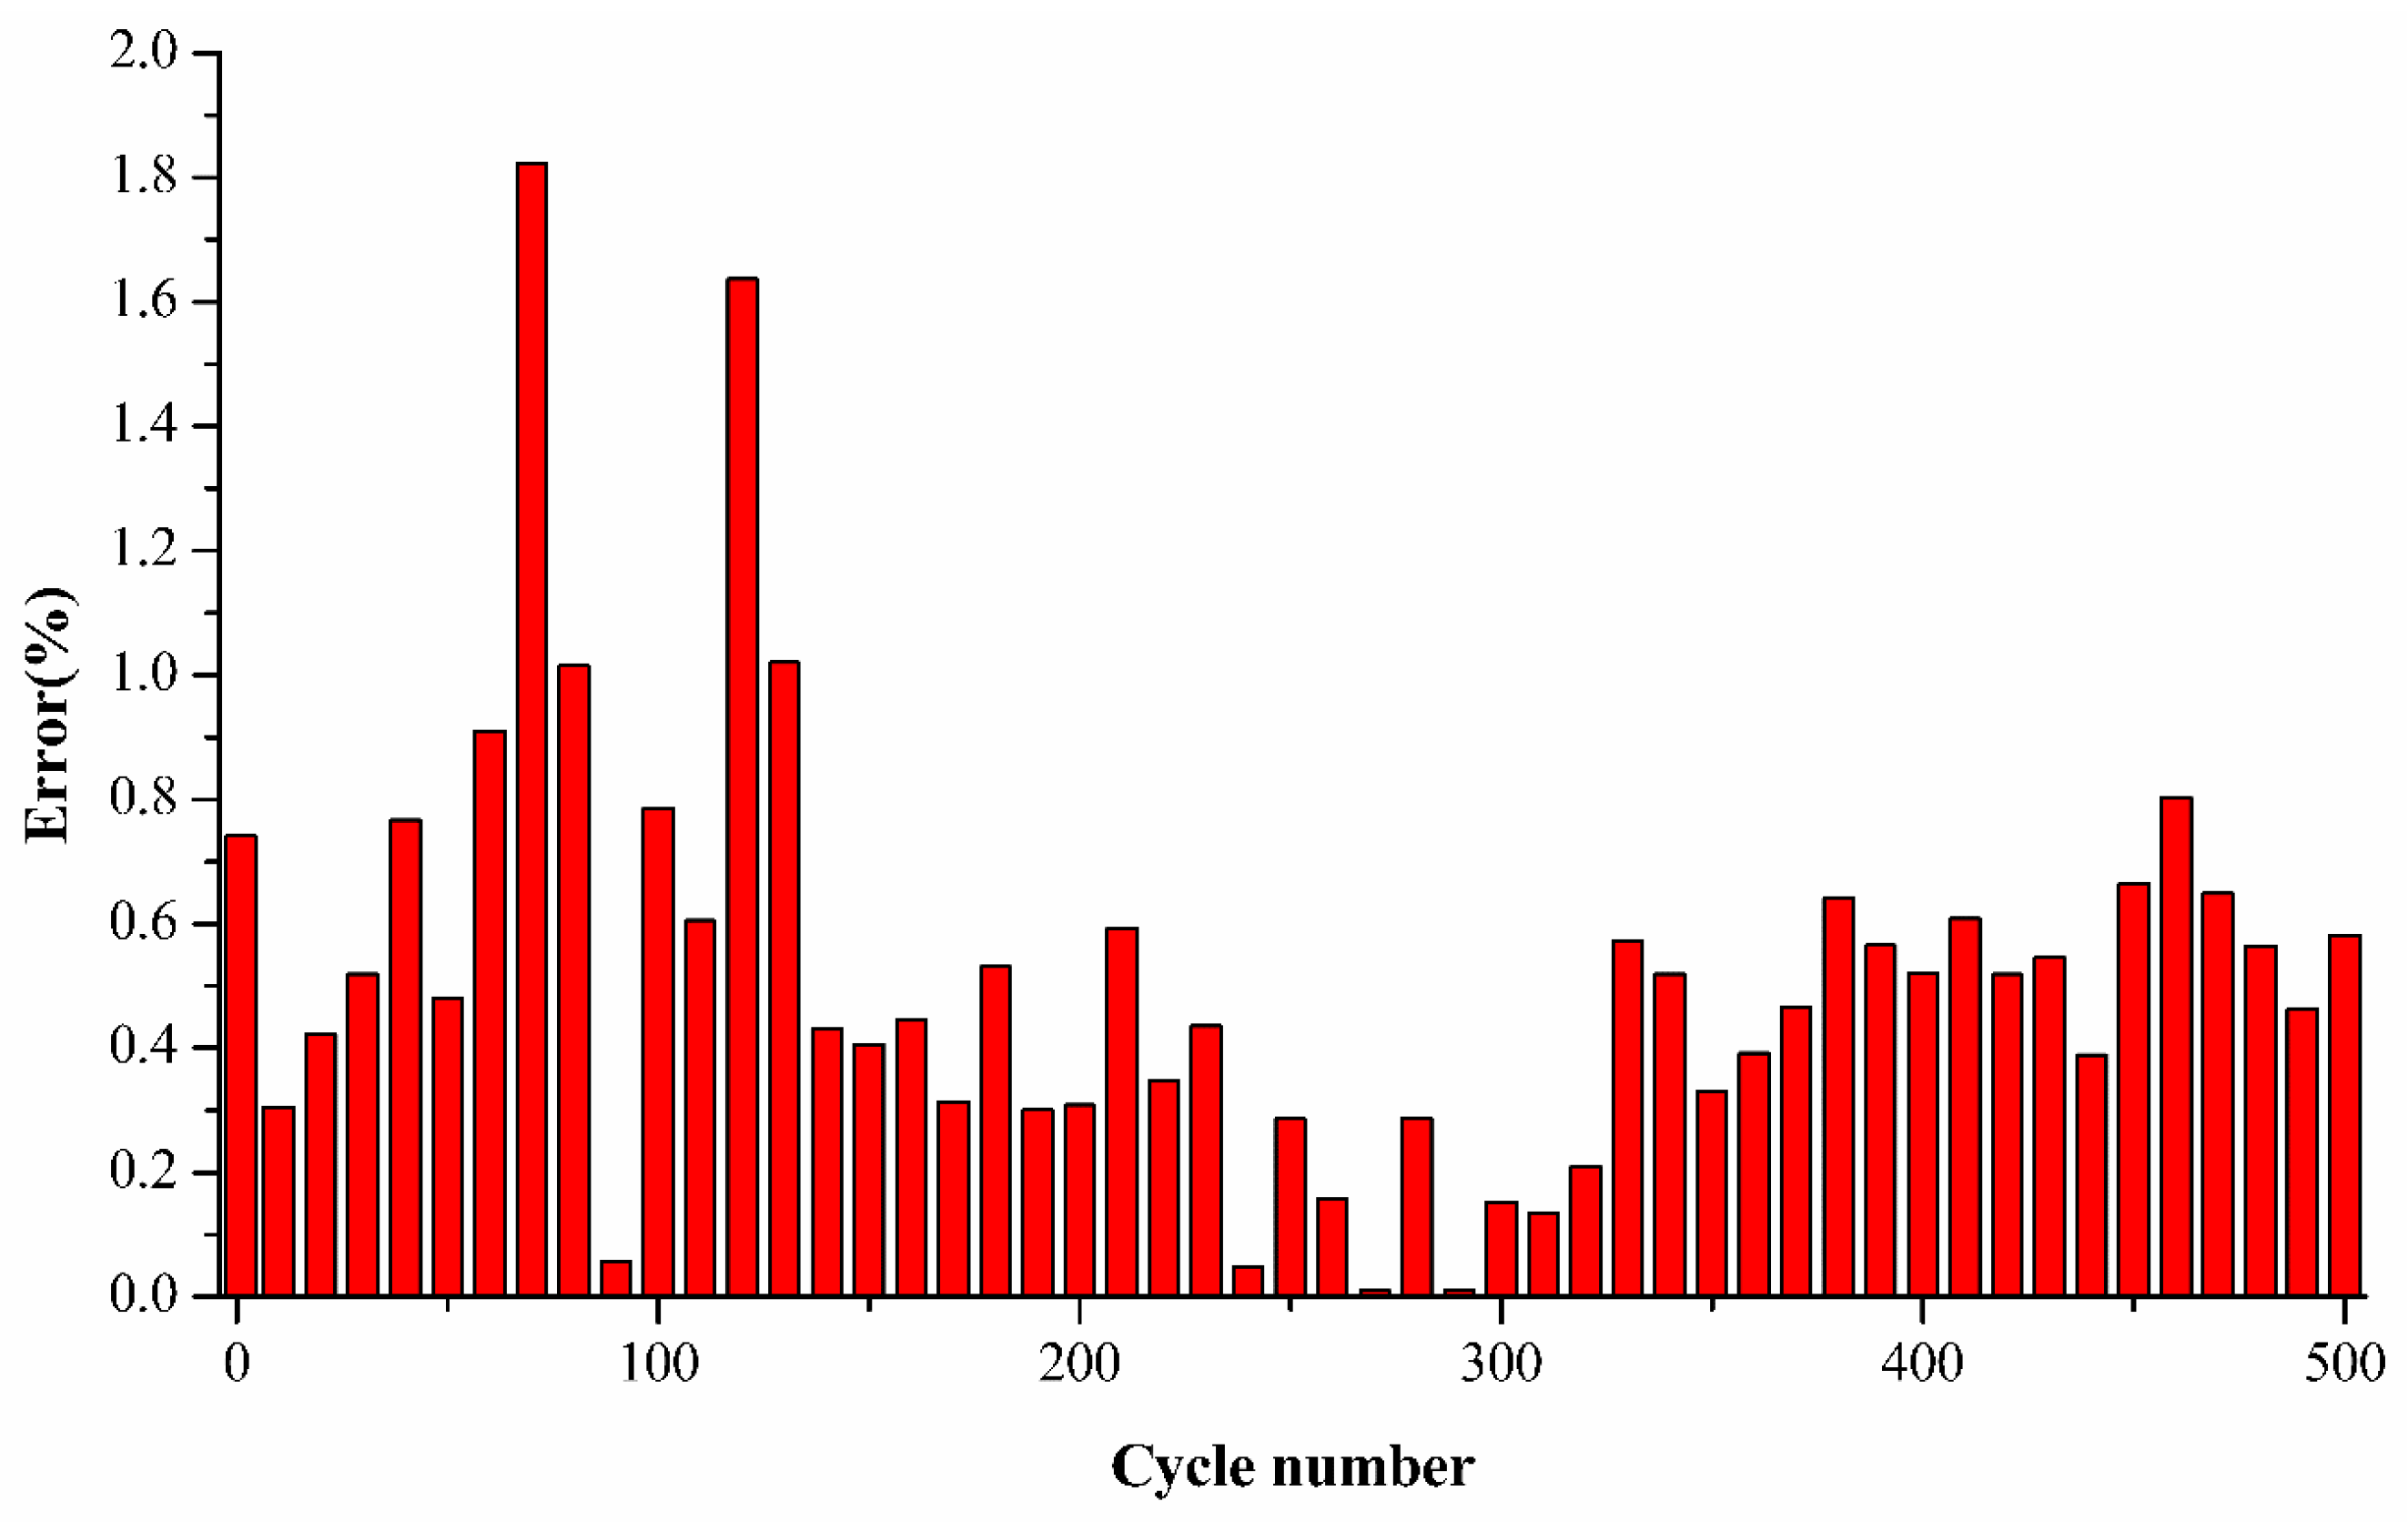
To verify the sensitivity and accuracy of the present semi-empirical model when different charge cycles are used, we estimated average error for the samples using maximum and minimum peak values. As an example, we chose cycles, as shown by value 1, 3, and 4 once and value 2, 3, and 4 to observe the sensitivity of the model, as shown in
Figure 3. A similar observation was done for other samples as well, and the error difference is shown in the Table below.
It is clearly observed from
Table 5 that the difference in errors estimated using upper and lower peaks is less than or around 1% showing the robustness of the model. Cells were chosen from different sets which show that the model is suitable for charge estimation at the different life cycle of batteries, which is an important factor while estimating charge of Li-ion batteries.
In fact, since the fluctuation occurs in the first 250 cycles, and battery, in general, will have a lifetime longer than 250 cycles, we can also perform our computation of k1, k2, and k3 using the ECBE model from 250 cycles onward. In so doing, the average error in charge estimation is less than 1%, which is a lot more accurate, as shown in
Table 6 below.
3.3. Model Effectiveness for Other Types of Battery
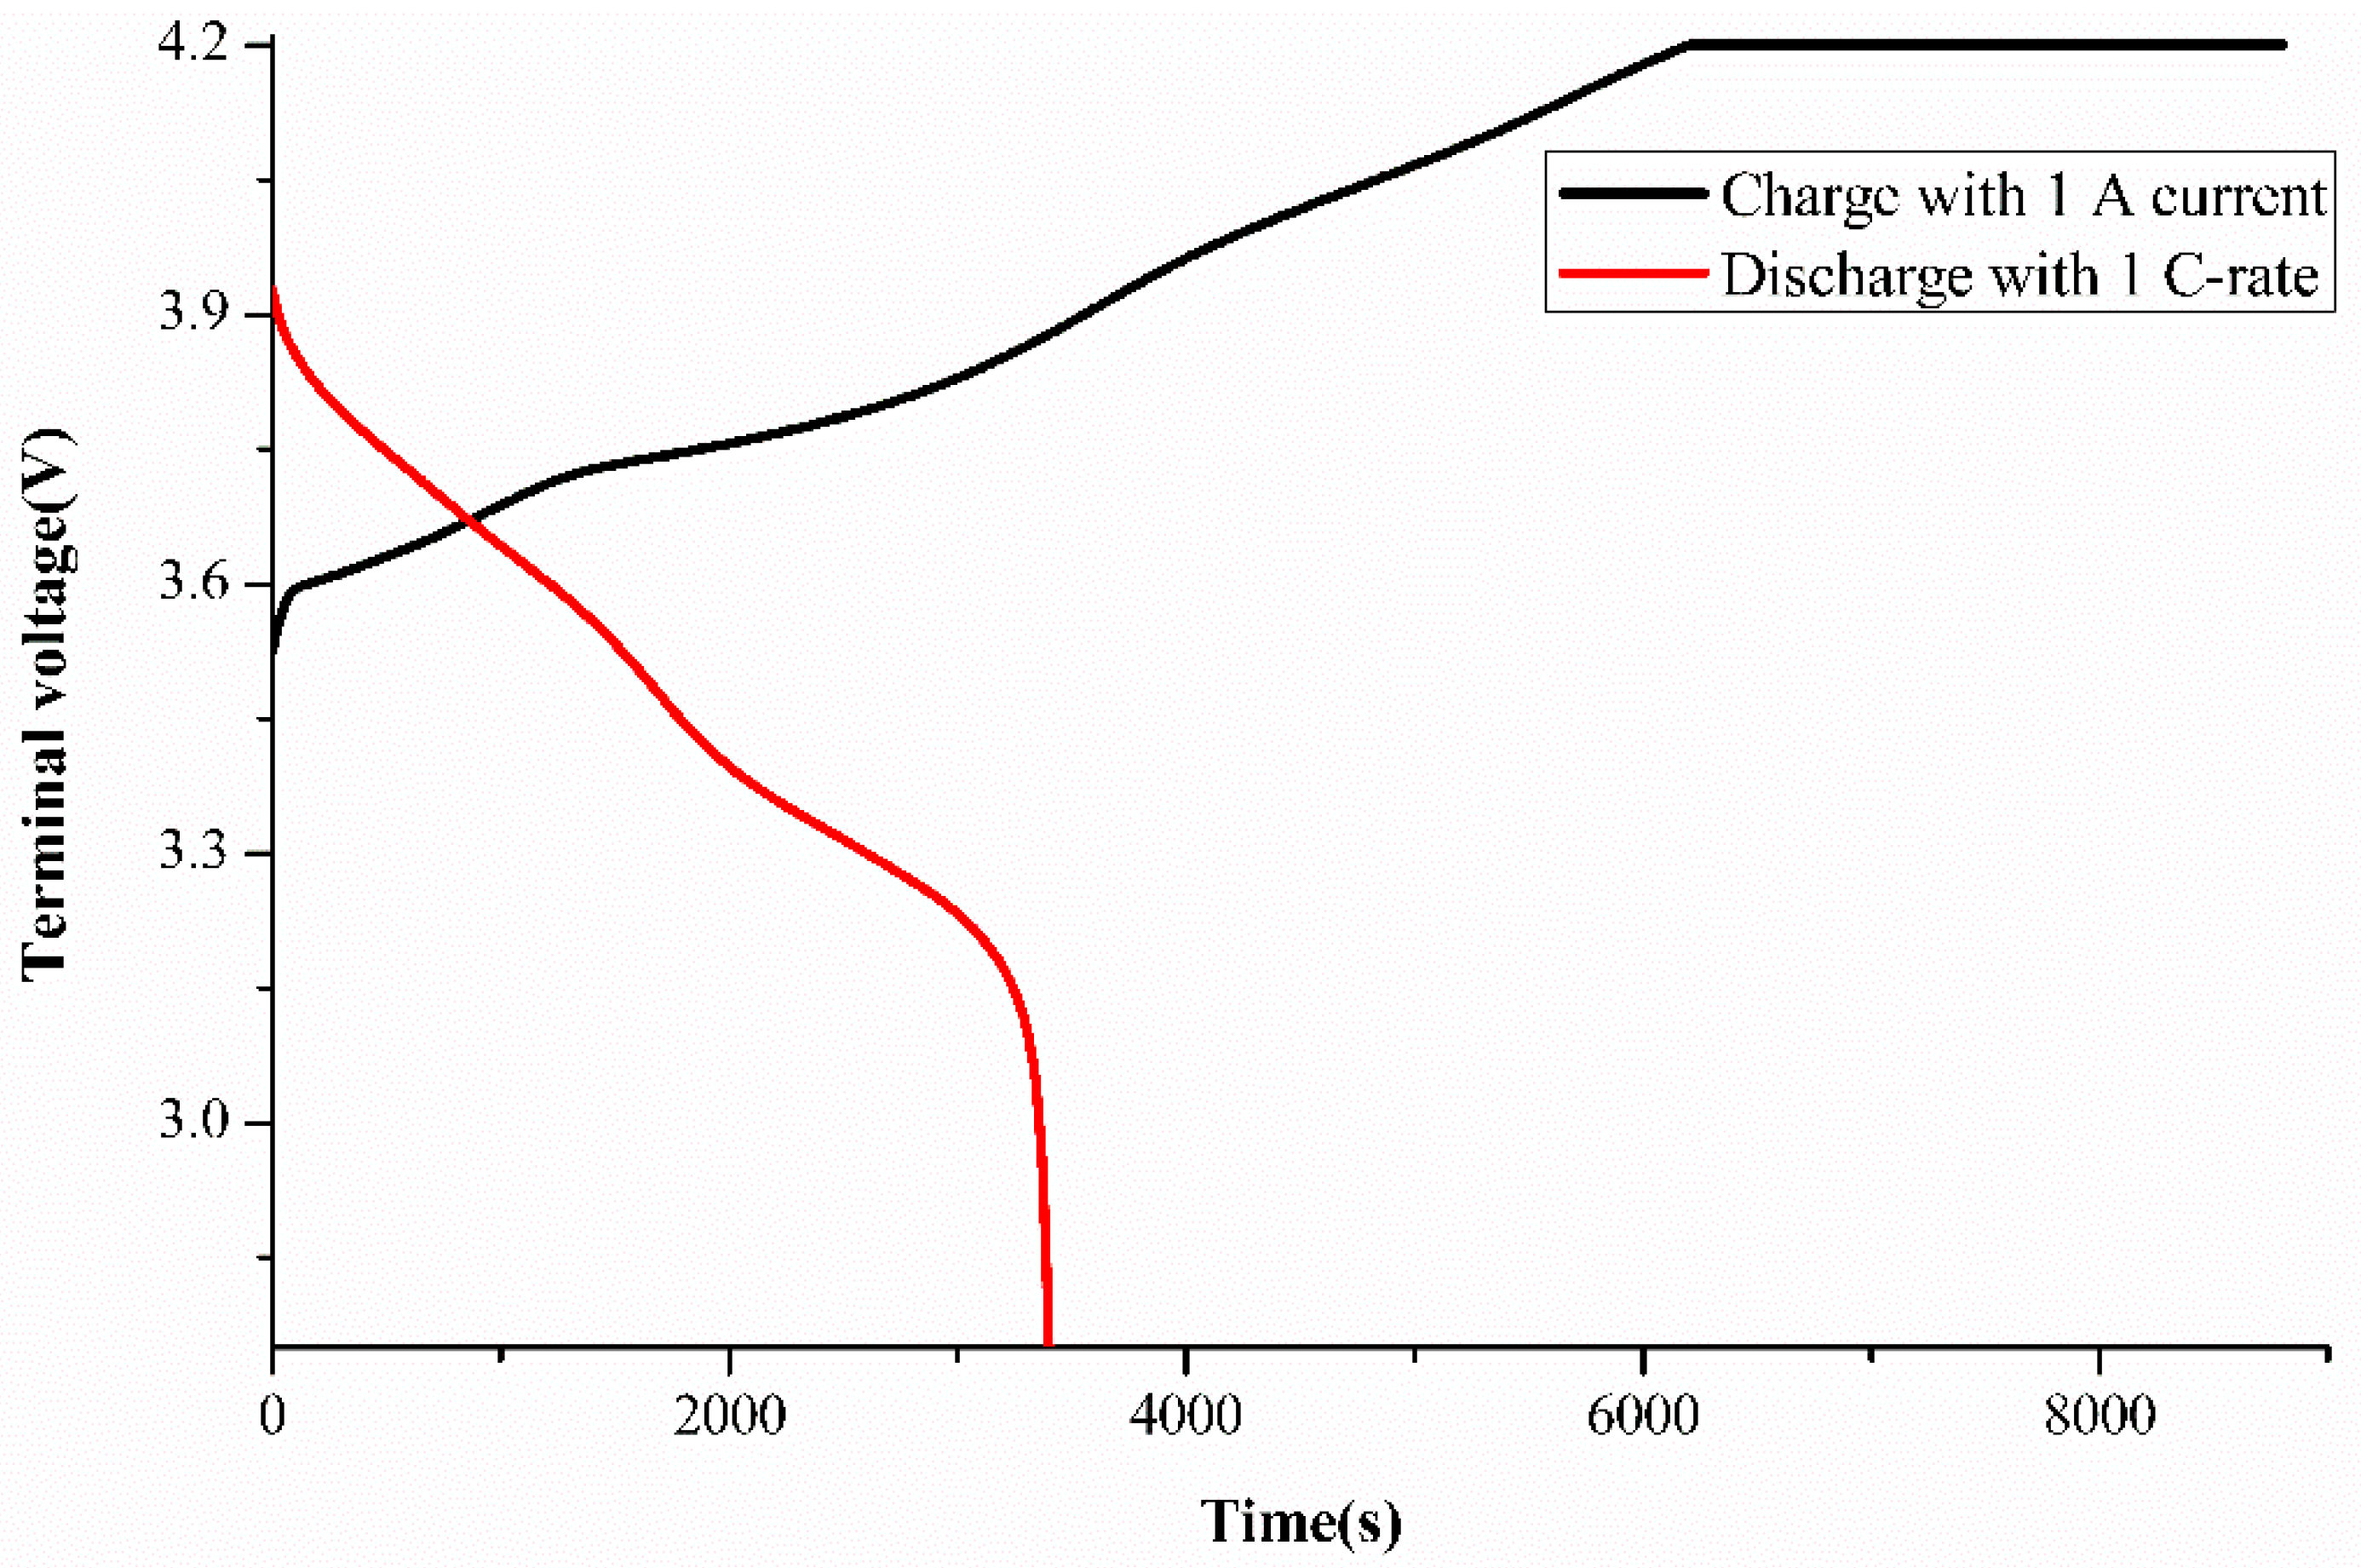
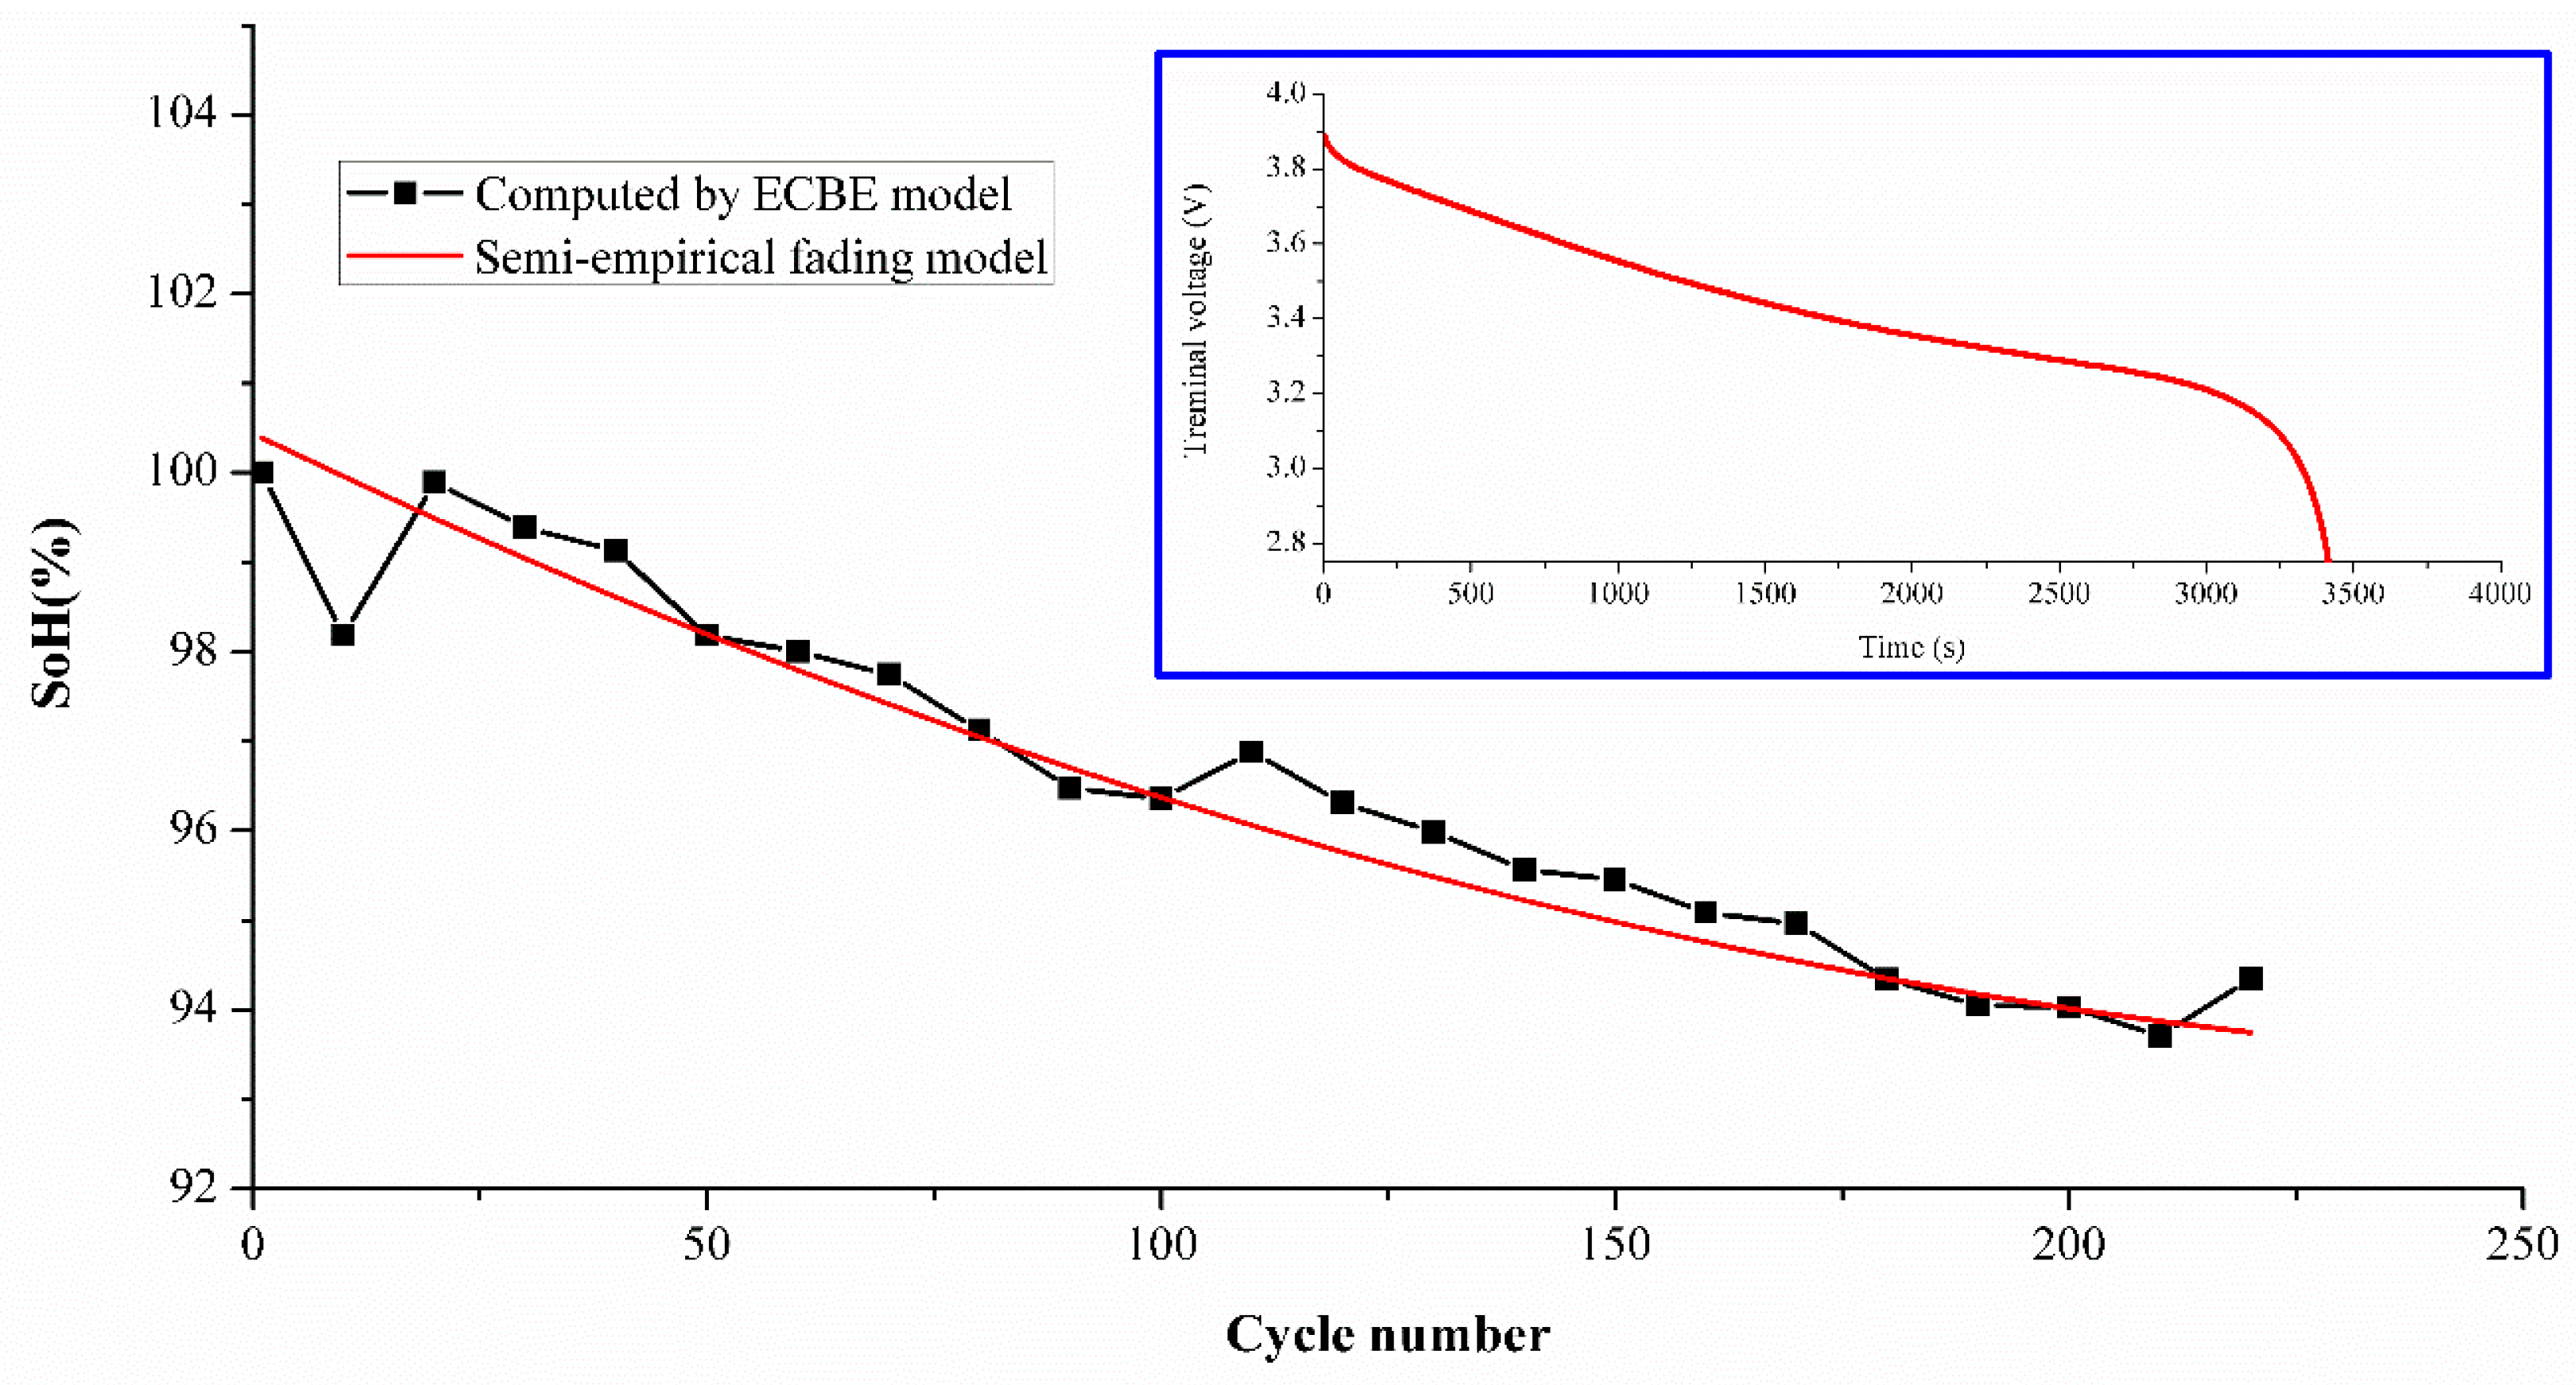
To demonstrate the effectiveness of the model for other types of batteries, a simplified model was used to estimate SoH for two Lithium Cobalt Oxide (LCO) batteries tested for 220 cycles under ambient conditions similar to the experimental set up shown previously for NMC batteries. The LCO sample used in this experiment was a MOLICEL ICR-18650M (MOLICEL®, Taipei, Taiwan) with a typical capacity of 2.8 Ah [
32], and its electrodes were composed of LiCoO
2 and a graphite anode. The charging current set in the experiment was 1 A, and discharge was 1 C-rate (= 2.8 A). Due to the limitation of time and instruments, only two samples were tested as the purpose was simply to demonstrate its effectiveness in principle. The estimation difference is shown in
Table 7, and the average differences are 1.77% and 1.03%, respectively. The difference is found to be less than 2 percent. The SoH comparison between the ECBE and semi-empirical model is shown in
Figure 9, which includes the discharge curve of the LCO battery as an inset.
The above fitting results demonstrate that the semi-empirical fading model used in this work can rapidly estimate SoH of batteries accurately. It is also observed that the difference values are always less than 2% whether the SoH estimation is done using its own extracted k values or another cell’s k values. Another important observation is that this method provides accurate SoH estimation even when the first 60 cycles are included in SoH estimation, where rapid capacity decrease is observed. This rapid capacity decrement increases the estimation difference and can be further reduced if the first 60 cycles are not included in the SoH estimation. However, we have included the first 60 cycles in this work for SoH estimation to show the accuracy of the simplified model in SoH estimation. It will be very interesting to check the credential of this method when batteries degrade to even lower SoH values, and it will be one of our future works. In short, our model provides a path for SoH estimation of several cells in a pack by just the extraction of k values for a single cell in that pack.


