Abstract
Non-destructive ultrasonic testing has attained popularity due to its robustness and cost-effectiveness in monitoring the structural health and performance evaluation of pavements, thus replacing traditional methods. This paper presents the application of an explicit finite element method for the modeling of ultrasonic wave propagation through asphalt concrete. Prior to modeling, non-destructive ultrasonic testing was conducted on four different types of asphalt concrete (AC-13, SMA-13, AC-20, and AM-20). Based on acoustic information (wave velocity) obtained in non-destructive testing (NDT) and density, the dynamic moduli of these asphalt concretes were evaluated and used in numerical modeling of ultrasonic wave propagation using the commercial software package ABAQUS. The ultrasonic wave results obtained by numerical modeling were compared with experimental results. This comparison showed a good fit between the finite element (FE) results and the experimental results and confirmed a good FE approach for ultrasonic wave propagation. In addition, the influence of varying dynamic moduli, density, varying location, and crack size/depth on ultrasonic wave propagation was analyzed.
1. Introduction
Traditional methods for the evaluation of the mechanical properties of pavement are usually costly, as core samples are drilled and shipped to a laboratory to test the corresponding performance. To avoid tedious work and detriment to the pavement by coring, non-destructive testing (NDT) techniques can be applied as a replacement, such as ground-penetrating radar (GPR), spectral analysis of surface wave (SASW), and ultrasonic testing technology (UT). Ultrasonic testing technology is one of the most widely used non-destructive testing methods, in which ultrasonic waves are excited by an ultrasonic transducer, propagated through a medium, and received by the transducer at the other end. These elastic waves include longitudinal and shear waves. In terms of longitudinal waves, particle vibration occurs in the direction parallel to the wave propagation, whereas for shear waves, particles vibrate in the direction perpendicular to the wave propagation. Acoustic parameters, like amplitude, wave velocity, and wave frequency, are directly related to the mechanical properties of the medium [1]. Thus, in a solid elastic isotropic medium, these waves are related to the elastic modulus (E), Poisson’s ratio (), and density (), based on the given equations below.
This ultrasonic wave is frequently used in rock and cement concrete materials and was recently applied in the research area of asphalt concrete, including identifying damage within asphalt concrete [1], quantifying fatigue life of asphalt mixture, evaluating crack-healing efficiency of asphalt pavement [2,3], and determining the dynamic modulus of a specific asphalt mixture [3]. This technology is also able to monitor changes in the integrity of mixtures due to moisture conditioning [4].
Wave propagation modeling is attracting more interest since it provides a way to evaluate the propagation pattern of a wave within a structure like asphalt pavement. Wave propagation modeling has been successfully performed using ANSYS [5] (Ansys Inc., Canonsburg, PA, USA), ABAQUS [6] ABAQUS Inc., Palo Alto, CA, USA), and LS-DYNA (Livermore Software Technology Corporation (LSTC), Livermore, CA, USA) [7]. Finite element method (FEM) was successfully applied in the modeling of three-dimensional propagation of a lead zirconium titanate (PZT) patch-induced Lamb wave through reinforced composites [8] and homogenous plates [9]. FEM modeling of directed Lamb waves, induced by piezoelectric patches bonded on the steel plate, was utilized in [10].
2. Methodology
Four different types of asphalt mixtures, AC-13, SMA-13, AC-20, and AM-20, were used in this study. The four mix types are different in terms of aggregate gradation; detailed differences can be found elsewhere [11,12]. In the laboratory, the specimens were fabricated using a gyratory compactor with target air voids of 7% ± 0.5%. These specimens were further cut into pieces that were 150 mm in height and 100 mm in diameter; the volumetric properties of each specimen were measured in the laboratory, followed by dynamic modulus testing.
Next, ultrasonic testing was carried out on these specimens and the dynamic moduli of the asphalt concrete samples were calculated using Equation (1), based on ultrasonic wave velocity, density, and Poisson’s ratio. Wave velocity is an acoustic parameter which was found to correlate well with mechanical properties, such as elastic moduli, and volumetric properties, such as in-place field density [1]. In the actual pulse penetration method, the wave velocity is calculated by the initial wave method, whereas the measurement of the wave velocity is affected by many factors, such as the delay of the sound wave in the probe transducer, the reading accuracy of the pulse front, and the time axis scale. In order to reduce test dispersion, a total of four test repetitions for each asphalt concrete were carried out and averaged.
A two-dimensional FEM model was built in ABAQUS software for the numerical modeling of ultrasonic wave propagation, which was validated by comparing the ultrasonic wave velocity measured and calculated by the dynamic modulus with the results of the wave velocity measured by an NDT detector. A sensitivity analysis was also conducted to determine the variation of output (wave signal) with varied input parameters. The input parameters considered were in-place air voids, dynamic modulus, thickness, loading pressure, crack depth, and crack size.
3. Data Collection
3.1. Density and Dynamic Modulus
In the laboratory, volumetric properties of specimens were detected, including bulk specific gravity (Gmb) which was measured according to AASHTO T166, theoretical maximum specific gravity (Gmm) (AASHTO T209), and air voids (AASHTO T269). Prior to the density test, water absorption of each asphalt concrete was checked. In this study, the dry volume method was used rather than the wax seal method because the water absorption of all asphalt concretes was less than 2%.
The dynamic modulus is the modulus of pavement material measured under the condition of simulating the dynamic load of vehicle. It is a dynamic parameter that truly reflects the comprehensive behavior of the pavement under various load conditions and also represents the stress–strain analysis of the pavement structure. In the updated Chinese specification (2017 version) of asphalt pavement, the dynamic modulus is designed at a frequency of 10 Hz and a temperature of 21.1 °C. Therefore, dynamic modulus tests for all four mixes were carried out at a frequency of 10 Hz and a temperature of 21.1 °C following AASHTO TP 62 using a UTM-25 test machine. The last five load deformation curves were collected and the averages of the cyclic load amplitude and the recoverable axial deformation were recorded. The dynamic moduli of each mix type were mathematically calculated as the maximum (i.e., peak) dynamic stress divided by the peak recoverable axial strain. The results of the densities and dynamic moduli of the AC-13, SMA-13, AC-20, AM-20 are presented in Table 1.

Table 1.
Comparison of laboratory-measured and calculated dynamic moduli.
3.2. Ultrasonic Dynamic Modulus
Ultrasonic non-destructive tests of the asphalt concrete samples were carried out by a ZBL-U510 non-metal ultrasonic detector, as shown in Figure 1. The instrument adopts ultrasonic pulse technology and includes measuring functions such as pile measurement, strength measurement, non-compaction area, cavity detection, crack depth measurement, etc. In this study, the ultrasonic defect detection function was used due to its ability to capture information of defect size and its orientation, such as the location and size of the structural crack that was not reflected on the pavement surface. An ultrasonic wave is able to conduct such an analysis since the wave signal generated by the transducer is reflected by defects and the back surface of the sample.
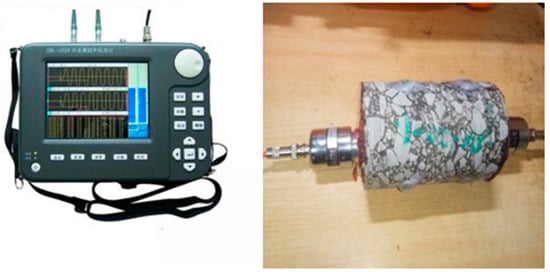
Figure 1.
Ultrasonic detector and measurement setup.
The initial parameters of the detector for the ultrasonic test were set at a voltage of 500 V, a probe frequency of 50 kHz, and a temperature of 21.1 °C. The instrument was zeroed first in order to remove the zero sound (which introduces a time delay of sound wave propagation) followed by the formation of the waveform. In order to ensure better coupling between the transducer probes and the upper and lower surfaces of the sample during the test, butter was applied as a coupling agent at the contact surface of both sides of the test specimens to ensure measurement accuracy. Acoustic information, such as wave velocity, amplitude, waveform, and frequency, was recorded.
3.3. FEM Modeling
The explicit finite element method was used for the numerical modeling of ultrasonic wave propagation through asphalt concrete, as it is a direct integration method using the principle of central differential and a diagonal matrix mass, which is also utilized in this paper for wave propagation simulation, as recommended [6].
The effects of crack size and location on wave propagation were analyzed. Such analysis can be simulated since ultrasonic wave propagation has an inverse relationship with a medium containing voids or cracks. With the increase of voidage, the wave velocity propagated through the medium decreases, which is due to the fact that the medium had large gaps containing air and wave propagation through air is slower than that in aggregates. Also, when ultrasonic waves propagate through materials with large voids, sound energy attenuates faster, which causes more dispersion of longitudinal waves. Due to this dispersion, many equivalent scatters of longitudinal wave are formed, which greatly affects ultrasonic wave propagation, resulting in a long travel time of the ultrasonic wave.
A two-dimensional model of space size with dimensions of 300 mm × 150 mm was constructed. Loading surf-1 on top of model with a length of 40 mm in the assembly module was created for ultrasonic wave input, which was loaded under sinusoidal stress wave with a load magnitude of 0.1 MPa, as suggested [13]. The amplitude curve was defined to describe the change in load and boundary conditions with time by the Fourier series expression, as shown in Equations (3) and (4).
where N represents the number of Fourier series in the formula, ω represents the circular frequency (rad/s), is the initial time, is the initial amplitude, and are the coefficients, and n = 1, 2, 3, 4, …, N.
Figure 2a shows a schematic representation of ultrasonic wave propagation generated by an ultrasonic transducer through pavement without cracks. The bottom asphalt layer was selected as the analyzing point. Figure 2b shows that three cracks, A, B, and C, of varying pavement depths, were created. In the first-round simulation, only cracks A and B were generated in order for the effect of crack depth on wave propagation to be checked. In the second-round simulation, only crack C was set and its two crack widths were utilized to evaluate the effect of crack size.
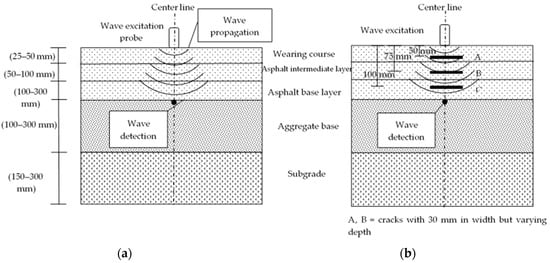
Figure 2.
Schematic diagram of wave propagation through pavement (a) without cracks, and (b) with cracks. Cracks are denoted as black strips.
The simulation frequency was selected as 50 kHz, which equals the frequency that was applied in the field NDT ultrasonic tests. The frequency can be realized in finite element simulation software ABABQUS by defining amplitude curve with circular frequency ω = 2πf = 314,159 rad/s, with initial time and initial amplitude equal to 0.
The selection of a finite element number per wavelength is critical and greatly affects simulative accuracy. At least seven finite elements per wavelength is suggested to achieve satisfyingly accurate results [14,15,16]. In this study, the element per wavelength was determined as 20 based on a sensitivity analysis, which was conducted to determine the proper element number per wavelength. This ensured the accuracy of the solution and did not significantly decrease the calculation efficiency at the same time. It should be noted that whenever the FEM was varied (i.e., mix type, pavement depth, or crack location), sensitivity analysis needed to be re-conducted, since the element number per wavelength was highly sensitive to material property and crack size. Such a step is necessary to ensure simulation efficiency and accuracy. As an example, for the AC-13 mix without cracks, the element number was determined as 20. Taking the asphalt mixture as homogenous, the free meshing technique was adopted and the CPS4R planar quadrilateral stress unit was selected as the cell type.
4. Results Analysis
Figure 3 shows the averaged values of ultrasonic wave velocity, amplitude, and frequency. Standard deviations, which reflect test errors, are also presented. By using the outputs, the dynamic modulus of each asphalt concrete was calculated using Equation (1) and is presented in Table 1. Poisson’s ratio was assumed to be 0.3 for all four mix types.
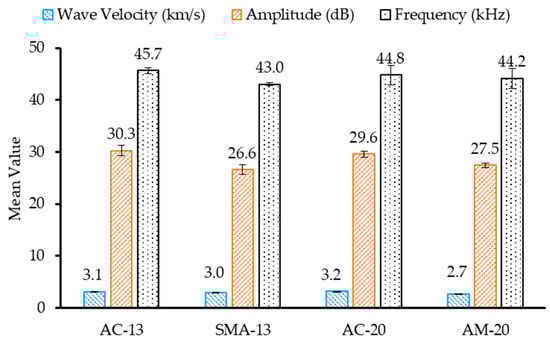
Figure 3.
Output of ultrasonic wave test.
As shown in the table, the dynamic moduli measured in the laboratory were much smaller than those calculated by using the ultrasonic wave velocity. This was within expectations, since the two test methods are different in nature; in the laboratory, the specimens were tested with a relative low frequency (10 Hz) and with viscoelastic properties, whereas the ultrasonic test was conducted at a high frequency (50 kHz) and with very little force acting on the sample by vibration, therefore significant deformation was not caused. However, the laboratory-measured and calculated moduli shared the same ranking; for the laboratory measurement, the AC-20 mix experienced the highest magnitude of modulus, followed by AC-13 and SMA-13 mixes, whereas the AM-20 showed the smallest value and the calculated dynamic moduli showed exact the same trend.
Figure 4a shows a snapshot of a wave field generated by the ultrasonic probe in model AC-13. The top of the picture indicates the pavement surface, whereas the bottom of the picture means the bottom of the asphalt concrete. It can be seen that wave propagation is symmetrical and continuously distributed along the pavement depth direction. It is also observed that the ultrasonic wave propagated through model and diffused outward in a ring shape with concentrated and good directionality and followed a straight line alongside the wave incident direction. Figure 4b shows the extracted time-displacement curve that was obtained from the highlighted point at the bottom of the pavement. Such a curve is required for the calculation of simulated wave velocity. The figure shows that the first wave was detected at a time of 5.069 E–5 s and then turned into sinusoidal waveform, with its amplitude near the sensor decreasing due to the attenuation phenomena.
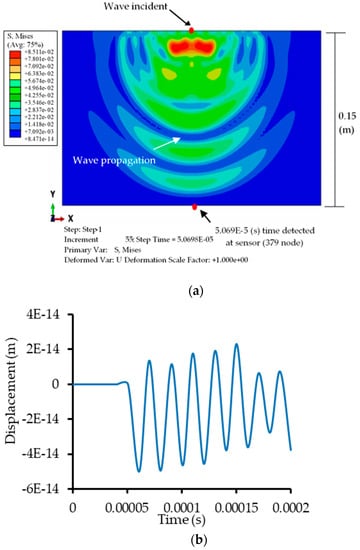
Figure 4.
(a) Wave propagation along pavement depth direction and (b) time-displacement curve.
The ultrasonic wave velocity propagated through the model that originated from the transmitting end and continued to the receiving end was calculated. Taking the AC-13 mix as an example, node #379 at the receiving end on the ultrasonic propagation path was selected and its time-displacement curve was obtained. The time that the first wave of ultrasonic propagation was detected was 5.069 E–5 s. Also, the total height of AC was 0.15 m, so the ultrasonic wave velocity can be calculated by using the relationship of time, distance, and velocity, as given in Equation (5). The final calculated velocity was 2958 m/s.
where (m/s) represents ultrasonic wave velocity, is the height (m) of the model, and is the time (s) taken to detect the first wave. Similarly, the wave velocities of ultrasonic wave propagation through other asphalt concrete models were calculated and are summarized below.
4.1. Comparison between Measured and Simulated Ultrosonic Wave Velocities
Figure 5a,b show the differences between simulated and measured wave velocities. For the simulated wave velocity, two types of dynamic modulus were utilized as inputs, namely the NDT-measured modulus in Figure 5a and the laboratory-measured modulus (at 10 Hz and 21.1 °C) in Figure 5b. All other input parameters in the models remained constant. Figure 5a shows no difference (less than 10%) based on engineering judgement between the simulated and experimental ultrasonic wave velocities. In contrast, Figure 5b shows an obvious difference (more than 70%) based on engineering judgment between the two measurements. A statistical t-test confirmed the above results. This difference is due to the fact that the models used in simulation process were different from real asphalt concrete samples used in NDT testing. In real AC samples, fine aggregates, coarse aggregates, and asphalt binder interact with each other and this heterogeneity of real AC samples caused large energy attenuation and absorption during the propagation of the ultrasonic wave in the NDT tests. In contrast, the simulated model was assumed to be homogenous, which induces less energy attenuation and absorption, resulting in a more stable wave propagation. In addition, ultrasonic wave velocity increases with the rise of the dynamic modulus. As the dynamic moduli of AC samples measured in the laboratory were much lower than those calculated by ultrasonic test results, the simulated results of wave velocity were definitely smaller in this case.
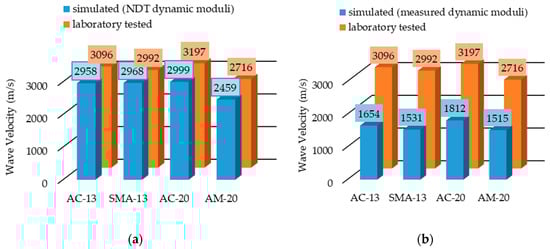
Figure 5.
Relationship between simulated and measured ultrasonic wave velocity. (a) Non-destructive testing (NDT)-measured and simulated and (b) laboratory-measured and simulated.
4.2. Sensitivity of Wave Velocity to Material Properties and Volumetric Parameters
A sensitivity analysis was conducted to evaluate (1) if the wave velocity was sensitive enough to capture the materials with varied mechanical properties (i.e., dynamic modulus), (2) to find out how the wave velocity changes (i.e., increase or decrease) with increased/decreased magnitude of material properties, (3) to determine the effects of different depth positions on wave velocity, and (4) to evaluate the effects of different load pressures on wave velocity.
Figure 6a shows that when all the other parameters (i.e., density and pavement structure) remained constant, the ultrasonic wave velocity was sensitive enough to the change in the dynamic modulus; the ultrasonic wave velocity kept increasing with the increased dynamic modulus value with robust correlation (R2 was close to 1). Figure 6b shows the influence of density on wave propagation by changing its value with an increment of 1000 kg/m3, starting from 2100 kg/m3, while keeping the other parameters constant (i.e., dynamic modulus and pavement structure). It can be seen that, generally, the wave velocity decreased with the increase in density, but this decrease was not large and the wave velocity value tended to be stable. This shows that density had less influence on ultrasonic wave propagation as compared with dynamic modulus.
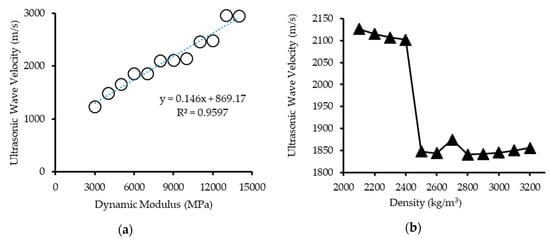
Figure 6.
Sensitivity of wave velocity to (a) dynamic modulus and (b) specimen density.
To analyze the effect of thickness on wave velocity, model AC-13 was selected and analyzed with 8 different depth locations, as shown in Figure 7a.
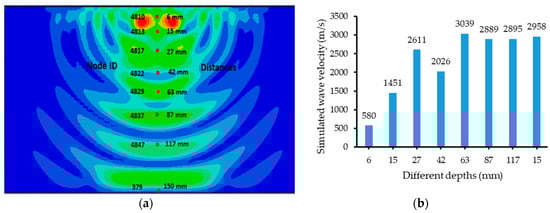
Figure 7.
(a) Schematic diagram of wave propagation at different depths. (b) Effects of thickness on wave propagation.
From Figure 7b, it is observed that simulated wave velocities generally rose with increasing depth. However, at relatively deep locations, ultrasonic wave velocity tended to plateau with the same magnitude of vibration. This was due to ultrasonic waves interfering with each other due to reflected waves at the bottom of the model during wave propagation.
4.3. Effect of Load Magnitude
The transducer probe used in NDT was a composite structure of piezoelectric ceramic, which used vibrations to generate a small force on the surface of test specimens to excite ultrasonic waves. The magnitude of this force was 0.1 MPa and was measured in a simulation process to define the amplitude on the surface of the model. To analyze the effects of varying loading forces on ultrasonic wave velocity, five different loading forces (0.02 MPa, 0.06 MPa, 0.1 MPa, 0.2 MPa, and 0.3 MPa) were used in the simulation process. The simulated results of ultrasonic wave velocity are presented in Figure 8.
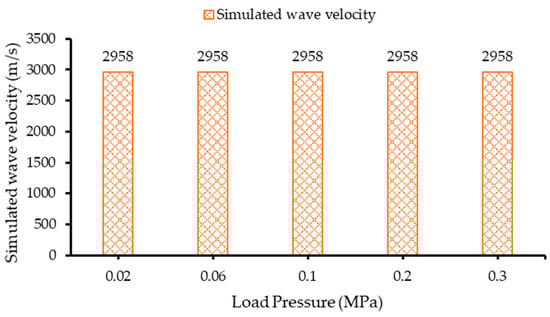
Figure 8.
Effects of different load pressures on wave propagation.
It can be seen that the simulated ultrasonic wave velocities at different loading forces remained the same. This can be explained by the fact that when ultrasonic waves propagated through the models, a group of damping waves was generated by the influence of density and the phenomena of wave reflection. This group of damping waves had certain velocities, which influenced ultrasonic wave propagation. With the rise of loading forces, attenuation of ultrasonic wave propagation also increased, which contributed to the higher velocity of the damping waves and the overall effect on ultrasonic wave propagation remained the same.
4.4. Effect of Crack Size and Loocation on Wave Propagation Properties
To ascertain the effects of size and location of crack on wave propagation, the mix type AC-13 was selected. All parameters required for the development of model remained the same with the inclusion of the crack at different location and sizes. Figure 9a–d shows wave propagation at a time point of 2e–4 (s) for cracks A, B, and C, as designated above. It can be seen that the ultrasonic waves were continuous until they reached the crack area, at which point the ultrasonic waves started to split up, were refracted, reflected back, and superimposed onto each other after passing through the crack.
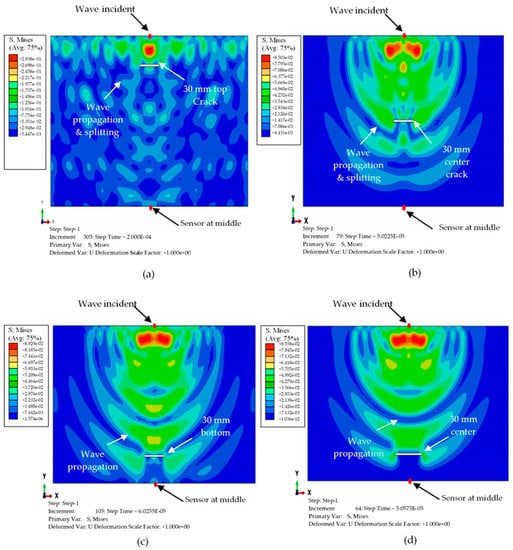
Figure 9.
Wave propagation on asphalt concrete with a crack size of 30 mm at distance (a) 1/3 and (b) 1/2 from the top of the model at a time point of 2e–4 (s). (c) 30 mm at distance 2/3 from the top of the model at a time point of 2e–4 (s). (d) 40 mm at distance 2/3 from the top of the model at a time point of 2e–4 (s).
Time-displacement curves of ultrasonic wave propagation through these models are presented in Figure 10a for cracks A, B, C, and D (similar to C, but with 40 mm crack width). Figure 10b shows the maximum displacement observed for the model. The results indicate that the wave propagation was sensitive enough to the location of the crack depth and size. This feature of the ultrasonic wave was very useful in detecting where the crack initiated within the pavement structure.
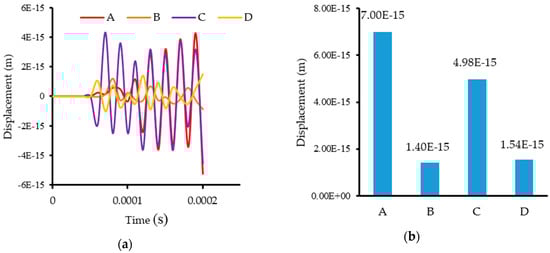
Figure 10.
(a) Time-displacement curves with a crack size of 30 mm at distances of 1/3, 1/2, and 2/3 and 40 mm crack size at a distance of 2/3 from the pavement surface. (b) Comparison of displacements with a crack size of 30 mm and of 40 mm at distances 1/3, 1/2, and 2/3 from the pavement surface.
From this analysis, it is implied that there is an indirect relationship between ultrasonic wave propagation and cracks, which is also consistent with the experimental study that the void ratio and the wave velocity are indirectly proportional to each other. With the increase in void ratio, the wave velocity passing through the material decreases.
5. Summary and Conclusions
Four different types of asphalt concretes (AC-13, SMA-13, AC-20, and AM-20) were used for density, dynamic modulus, and ultransonic tests. The dynamic moduli of these AC samples were caculated based on ultrasonic wave velocity, density, and Poisson’s ratio. A two-dimensional numerical modeling of ultrasonic wave propagation through asphalt conretes was performed using commercial software package ABAQUS and comparisons were made between simulated and measured results of wave velocity. The influence of varying dynamic moduli and density on wave propagation was also analyzed by changing the values of the dynamic modulus and the density alternatively. The influence of varying location and sizes of cracks on ultrasonic wave propagation was also analzed. Based on the analysis, the following conclusions can be drawn:
- Simulated wave velocities under caculated dynamic moduli were very close to experimentally measured wave velocities., with relative errors ranging from 0.57% to 9%. However, there was a huge difference between the simulated results of the wave velocities under measured dynamic moduli and experimentally measured wave velocities, with relative errors ranging from 21% to 31%. This was due to the fact that real AC samples exhibited heterogeneity, while the models used in the simulation process were homogenous in nature. Second, the values of the measured dynamic moduli were lower in comparison with the calculated dynamic moduli of asphalt concretes.
- A strong relationship between the dynamic moduli and the simulated ultrasonic wave velocities was observed; increased dynamic modulus lead to increased ultrasonic wave velocity. The simulated wave velocity decreased with the increase in density, but this decrease was not large and wave velocity tended to become stable at some point. This shows that density has less influence on ultrasonic wave propagation as compared with dynamic modulus.
- The crack location and size were significantly affected by the ultrasonic wave propagation mode. Models with the same crack size but different locations showed different displacment in comparison with each other. Similarly, models with the same location but different crack sizes exhibited a decrease in displacement with the increase of crack size.
Author Contributions
The authors confirm contribution to the paper as follows: Study conception and design: W.Z., S.H, and M.A.A.; data collection: J.B. and D.Z.; analysis and interpretation of results: W.G. and Q.L.; draft manuscript preparation: M.A.A. and W.G. All authors reviewed the results and approved the final version of the manuscript.
Funding
This research was funded by the National Science Foundation of China grant number 51608266, the Research Fund Mechanism of Simultaneous Deformation of Earth-Subgrade-Pavement Intergraded Design Method with grant number 8521002546, and the research funded by the Qilu Transportation Group grant number 2018B51.
Conflicts of Interest
The authors declare no conflicts of interest.
References
- Pan, W.; Sun, X.; Wu, L.; Yang, K.; Tang, N. Damage Detection of Asphalt Concrete Using Piezo-Ultrasonic Wave Technology. Materials 2019, 12, 443. [Google Scholar] [CrossRef] [PubMed]
- Ding, X.; Chen, L.; Ma, T.; Ma, H.; Gu, L.; Chen, T.; Ma, Y. Laboratory investigation of the recycled asphalt concrete with stable crumb rubber asphalt binder. Constr. Build. Mater. 2019. [Google Scholar] [CrossRef]
- Majhi, D.; Karmakar, S.; Roy, T.K. Reliability of Ultrasonic Pulse Velocity Method for Determining Dynamic Modulus of Asphalt Mixtures. Mater. Today Proc. 2017, 4, 9709–9712. [Google Scholar] [CrossRef]
- Birgisson, B.; Roque, R.; Page, G.C. Ultrasonic Pulse Wave Velocity Test for Monitoring Changes in Hot-Mix Asphalt Mixture Integrity from Exposure to Moisture. Transp. Res. Rec. J. Transp. Res. Board 2007, 1832, 173–181. [Google Scholar] [CrossRef]
- Zhang, Y.; Ma, T.; Ling, M.; Huang, X. Mechanical evaluation of aggregate gradation to characterize load carrying capacity and rutting resistance of asphalt mixtures. Constr. Build. Mater. 2019, 205, 499–510. [Google Scholar] [CrossRef]
- Markovic, N.; Stojic, D.; Cvetkovic, R.; Radojicic, V.; Conic, S. Numerical modeling of ultrasonic wave propagation—By using of explicit FEM in ABAQUS. Facta Univ. Ser. Archit. Civ. Eng. 2018, 16, 135–147. [Google Scholar] [CrossRef]
- Yang, M.; Qiao, P. Modeling and experimental detection of damage in various materials using the pulse-echo method and piezoelectric sensors/actuators. Smart Mater. Struct. 2005, 14, 1083–1100. [Google Scholar] [CrossRef]
- Weber, R.; Hosseini, S.M.H.; Gabbert, U. Numerical simulation of the guided Lamb wave propagation in particle reinforced composites. Compos. Struct. 2012, 94, 3064–3071. [Google Scholar] [CrossRef]
- von Ende, S.; Lammering, R. Modeling and simulation of Lamb wave generation with piezoelectric plates. Mech. Adv. Mater. Struct. 2009, 16, 188–197. [Google Scholar] [CrossRef]
- Zhou, W.; Li, H.; Yuan, F.G. Guided wave generation, sensing and damage detection using in-plane shear piezoelectric wafers. Smart Mater. Struct. 2013, 23, 015014. [Google Scholar] [CrossRef]
- Ma, T.; Wang, H.; He, L.; Zhao, Y.; Huang, X.; Chen, J. Property Characterization of Asphalt Binders and Mixtures Modified by Different Crumb Rubbers. J. Mater. Civ. Eng. 2017, 29, 04017036. [Google Scholar] [CrossRef]
- Tang, F.; Zhu, S.; Xu, G.; Ma, T.; King, L.; Kong, L. Influence by chemical constitution of aggregates on demulsification speed of emulsified asphalt based on UV-spectral analysis. Constr. Build. Mater. 2019, 212, 102–108. [Google Scholar] [CrossRef]
- Zhang, W.; Shen, S.; Wu, S.; Chen, X.; Xue, J.; Mohammad, L.N. Effects of In-Place Volumetric Properties on Field Rutting and Cracking Performance of Asphalt Pavement. J. Mater. Civ. Eng. 2019, 31, 04019150. [Google Scholar] [CrossRef]
- Ma, T.; Zhang, D.; Zhang, Y.; Wang, S.; Huang, X. Simulation of wheel tracking test for asphalt mixture using discrete element modelling. Road Mater. Pav. Des. 2018, 19, 367–384. [Google Scholar] [CrossRef]
- Zhang, W.; Shen, S.; Wu, S.; Wu, S. Comparison of the Relative Long-Term Field Performance among Various Warm Mix Asphalt (WMA) Pavements. Transp. Res. Rec. 2018, 2672, 200–210. [Google Scholar] [CrossRef]
- Zhang, W.; Cui, B.; Gu, X.; Dong, Q. Comparison of Relaxation Modulus Converted from Frequency-and Time-Dependent Viscoelastic Functions through Numerical Methods. Appl. Sci. 2018, 8, 2447. [Google Scholar] [CrossRef]
© 2019 by the authors. Licensee MDPI, Basel, Switzerland. This article is an open access article distributed under the terms and conditions of the Creative Commons Attribution (CC BY) license (http://creativecommons.org/licenses/by/4.0/).