Article

An Experimental Study on Mechanical and Thermal Insulation Properties of Rubberized Concrete Including Its Microstructure

1
School of Civil Engineering, Henan Polytechnic University, Jiaozuo 454000, China
2
College of Chemistry and Chemical Engineering, Henan Polytechnic University, Jiaozuo 454000, China
*
Author to whom correspondence should be addressed.
Appl. Sci. 2019, 9(14), 2943; https://doi.org/10.3390/app9142943
Submission received: 4 June 2019 / Revised: 15 July 2019 / Accepted: 17 July 2019 / Published: 23 July 2019

Abstract

:
This study aimed to investigate the effects of the size and weight content of waste rubber particles on the relevant performances of rubberized concrete. First, the fine aggregates were partially replaced by rubber particles of different sizes to produce rubberized concrete. Secondly, the mechanical and thermal insulation properties of rubberized concrete were investigated. Finally, microstructural analyses of rubberized concrete including scanning electronic microscope (SEM) and energy distribution spectroscopy (EDS) were examined. Experimental results indicated that uniaxial compressive strength of rubberized concrete was reduced, while the peak strain was gradually increased and thermal insulation properties were improved with the increase of rubber content or decrease of rubber particle size. In addition, rubber particles affected the failure modes, endowing concrete with weak brittleness and strong cracking resistance. Additionally, it was observed that the interfacial adhesion between the matrix rubber and the aggregates was weak under SEM, which seemed to be a key factor that reduced the strength of rubberized concrete.

Graphical Abstract

1. Introduction

Waste tire rubber is a kind of polymeric solid waste whose volume is increasing at a fast rate. Every year, almost 1000 million tires are discarded, and 50% of them are not reused. By the year 2030, the accumulation of waste tires will reach about 1200 million, which is one of the most important ecological and environmental problems around the world. Considering that waste tires hold toxic and soluble components, this may lead to the reduction of biodiversity in landfill sites. Generally, the cheapest and easiest method for decomposing waste tires is to burn them, which results in problems that harm human health and the environment [1,2,3,4]. In addition, the residue powder left after burning pollutes the soil. The oil that is generated from the melting of tires also pollutes soil and water [5]. In order to make better use of waste tires, researchers have carried out some relevant studies. For example, fine shredded tire particles have been utilized in road construction and repair [6,7]. In civil engineering, tires, cut or not, are used for building noise screens, insulation, light fillers, and bridge supports, etc. [1]. It is worth noting that the incorporation of processed waste tires into concrete by partially replacing aggregates to produce rubberized concrete is an example of reusing waste to produce a sustainable material [8]. Recycled rubber can be regarded as a sustainable alternative, as it contributes to reducing waste production and the use of raw materials [9], increases the workability of concrete, and provides environmental-friendly and cost-effective solutions by using recycled materials for concrete construction applications [10]. Although reusing waste tires for concrete production has negative effects on concrete properties such as lower compressive strength and splitting tensile strength, recycled tire rubber is a promising material in the construction industry due to its favorable lightweight, elasticity, energy absorption, sound, and heat insulating properties. In view of this, it has potential for applications in circumstances where strict crack resistance and higher flexibility but moderate or lower compressive strength (20–30 MPa) are required, such as the base layer of pavement, face slab of a rock-filled dam, and impervious barriers of reservoirs [11,12]. Therefore, the research and application of rubberized concrete has bright prospects, which can bring high economic value and environmental benefits.
Mechanical properties of rubberized concrete containing waste tire rubber particles have been investigated in many studies [13,14,15,16,17,18]. Although the strength of rubberized concrete is reduced, some studies have revealed that mixing rubber into conventional concrete could improve its deformability and ductility, thus resulting in high fracture and cracking resistance due to rubber’s good properties such as high toughness. For example, Nathan M. Miller et al. [15] found that tire-treated aggregates reduced the mechanical strength of specimens, but enhanced ductility of materials. Najib N. Gerges [18] found that rubberized concrete generally had a reduced compressive strength which may limit its use in certain structural applications, but it possessed some desirable properties, such as lower density, higher toughness, and higher impact resistance as compared to conventional concrete. Hanbing Liu et al. [19] observed that the mechanical strength of crumb rubber concrete was reduced, while durability was improved with an increase of crumb rubber content. In other words, adding rubber particles to concrete can contribute to prolonging its service life. Furthermore, compressive strength is significantly influenced by rubber content. Systematic reduction in compressive strength has been observed with the increase of rubber content [8,20,21,22,23]. For example, Reza Hassanli et al. [21] revealed that as the rubber content increased from 0% to 18%, the compressive strength of rubberized concrete reduced by about 31%. In the abovementioned studies of the mechanical properties of rubberized concrete, many analyses on compressive strength have been carried out, but few studies of the effects of rubber particle on the failure modes have been carried out.
Presently, few tests in laboratory have been done on the thermal insulation properties of rubberized concrete. Piti Sukontasukkul [24] investigated the thermal properties of crumb rubber concrete panel and reported that the rubberized concrete exhibited superior thermal properties as compared with plain concrete as measured by the decrease in thermal conductivity coefficient (k), i.e., rubberized concrete has better thermal insulation properties than plain concrete. In addition, some scholars [25,26,27,28] have analyzed the mechanism of rubber’s influence on concrete performance from a micro-perspective by means of scanning electronic microscope (SEM) and energy distribution spectroscopy (EDS). This study mainly aimed to investigate the effect of rubber particle size and content on the compressive strength, failure mode, and thermal insulation properties of rubberized concrete by using an electro-hydraulic servo universal testing machine and a homemade thermal insulation testing device. Additionally, microstructural analysis (SEM and EDS) of specimens was carried out, attempting to evaluate the influence mechanism of rubber particle size and content on mechanical performance of concrete from a micro-perspective. The experimental studies on rubberized concrete are intended for efficient application of waste tires which has certain significance for ecological environment protection. Another purpose of the experiments is to try to effectively apply rubberized concrete to engineering practices, such as paving or pavement base and building thermal insulation.

2. Materials and Composition of the Mixes

2.1. Materials

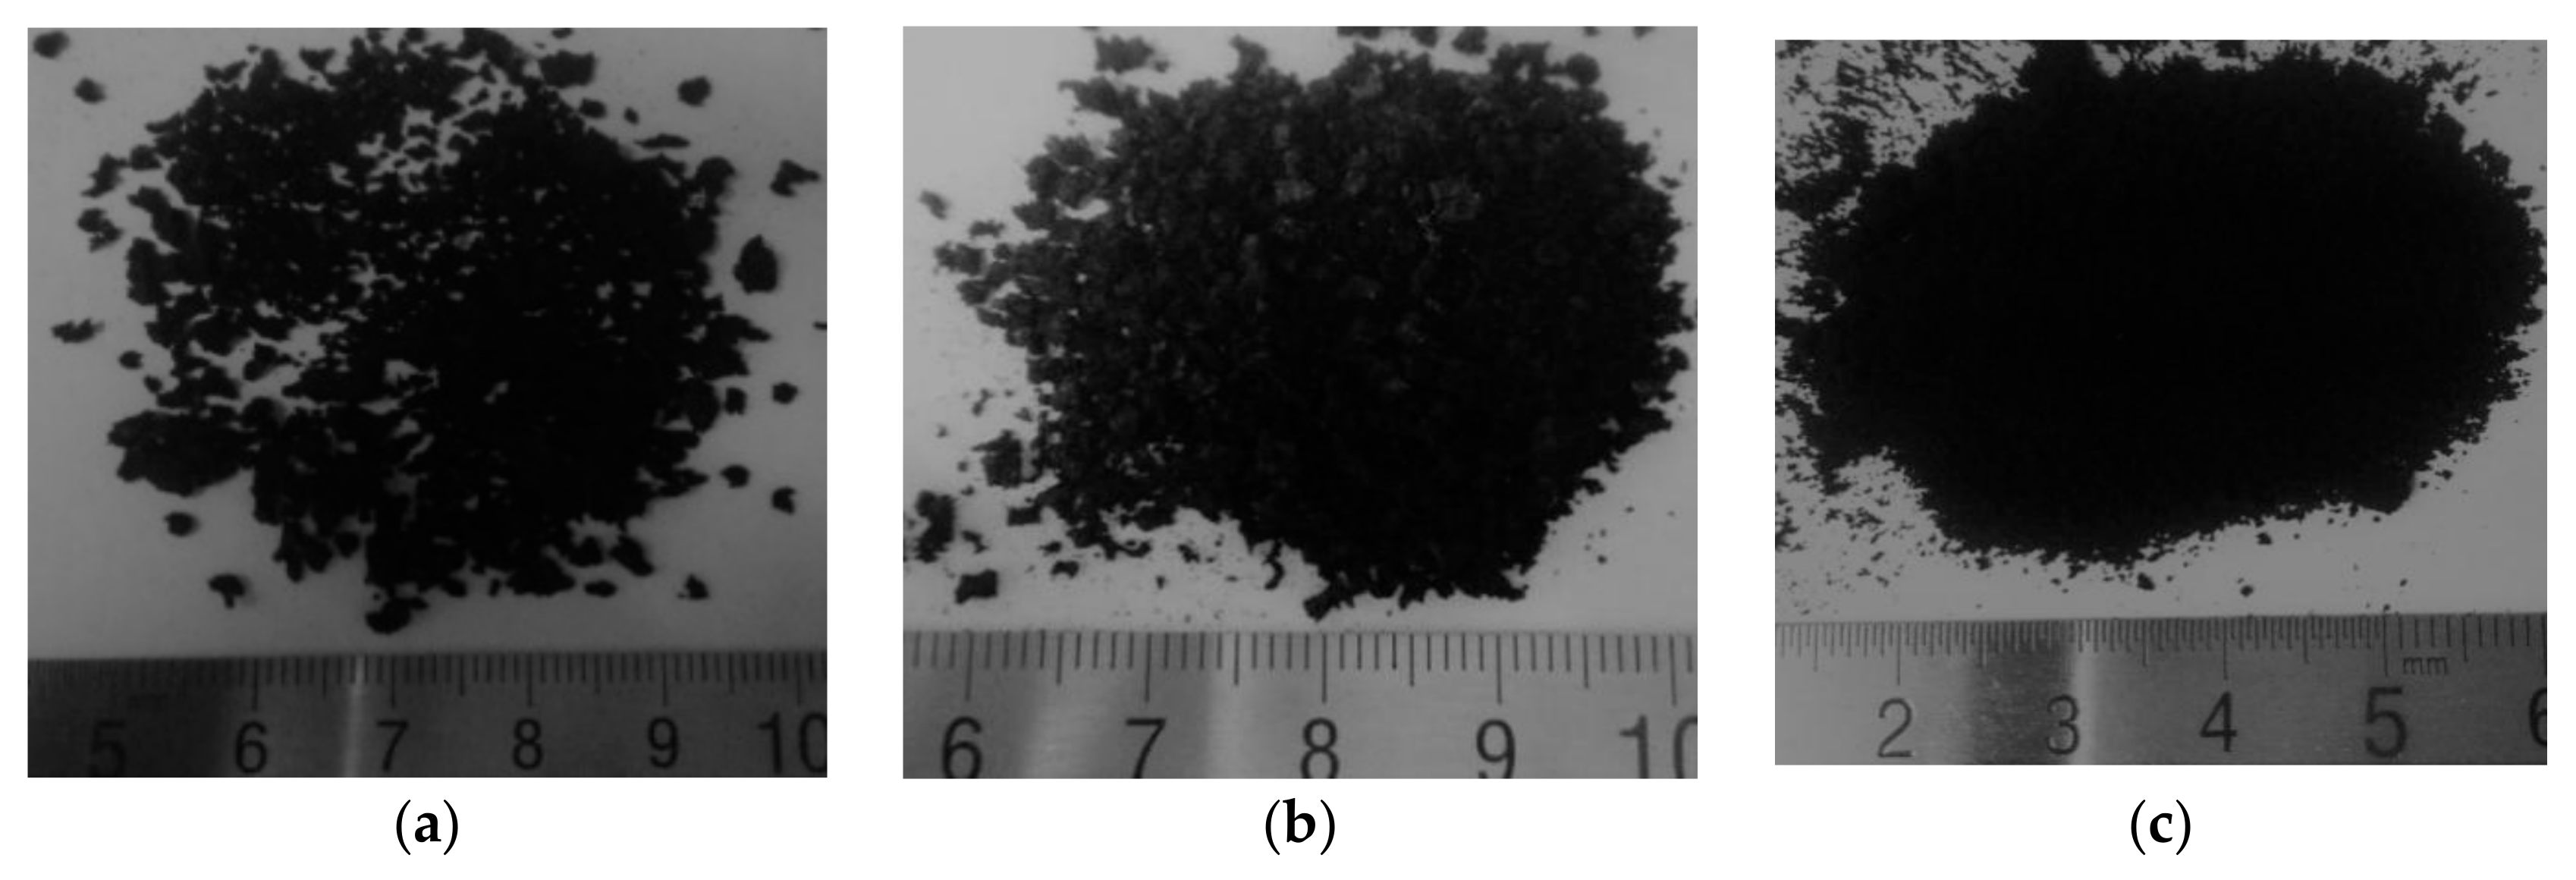
For this study, P.O Type 42.5 Portland cement with a density of 3100 kg/m3 was used based on common Portland cement (China National Standard GB 175-2007). Its physical and mechanical properties are listed in Table 1. Potable water produced by the local water supply company was used which conformed to standards for drinking water quality (China National Standard GB 5749-2006). The water-cement ratio was 0.53. Because the potable water contained less impurities, it did not have a negative effect on the performance of concrete, and therefore the negative influence of water quality was excluded when analyzing the performance of the concrete. The quality of the water is shown in Table 2. Fine aggregates (0.2~5 mm natural river sand) of specific gravity 2.62 and fineness modulus of 2.6 were selected, which complied with the requirements of sand for construction (China National Standard GB/T 14684-2011). Coarse aggregates (5~25 mm continuous graded crushed gravel) of specific gravity 2.56 were used, which complied with the requirements of pebble and crushed stone for construction (China National Standard GB/T 14685-2011). The high range water reducer (HRWR) with a water reduction rate of 20~35% and solid content of 20% was used as admixture, which conformed to concrete admixtures (China National Standard GB 8076-2008). Rubber particles of specific gravity 1.00, prepared from waste rubber tires and produced in China, were used in this study. Rubber particles of 3~5 mm, 1~3 mm, and 40 mesh (rubber particle size of about 0.425 mm) were used as a partial replacement for fine aggregates by weight. Figure 1 shows the particle size distribution of aggregate and rubber particles. A photographic view of rubber particles of three sizes is shown in Figure 2.

2.2. Mix Ratios

When studying compressive strength of rubberized concrete, rubberized concrete was produced by keeping the ratios of water, cement, and coarse aggregate unchanged, mixing 3~5 mm, 1~3 mm, and 40 mesh rubber particles into mixtures in accordance with a rubber content of 0%, 10%, 20%, and 30% by weight, respectively, (concrete with no rubber acted as the control group). The mix identifications and ratios of rubberized concrete are given in Table 3, where C represents concrete; C-J represents the control group; a, b, and c represent particle size of 3~5 mm, 1~3 mm, and 40 mesh, respectively; and 10, 20, and 30 stand for rubber content of 10%, 20%, and 30%, respectively, (similarly, hereinafter). Additionally, HRWR represents the high range water reducer. Moreover, for the investigation of thermal insulation properties of rubberized concrete, rubberized concrete was developed using the same materials and mixing method as described above, except for different rubber contents (0%, 15%, 30%, 40%, and 50%).

3. Experimental Procedure

3.1. Preparation of Specimens

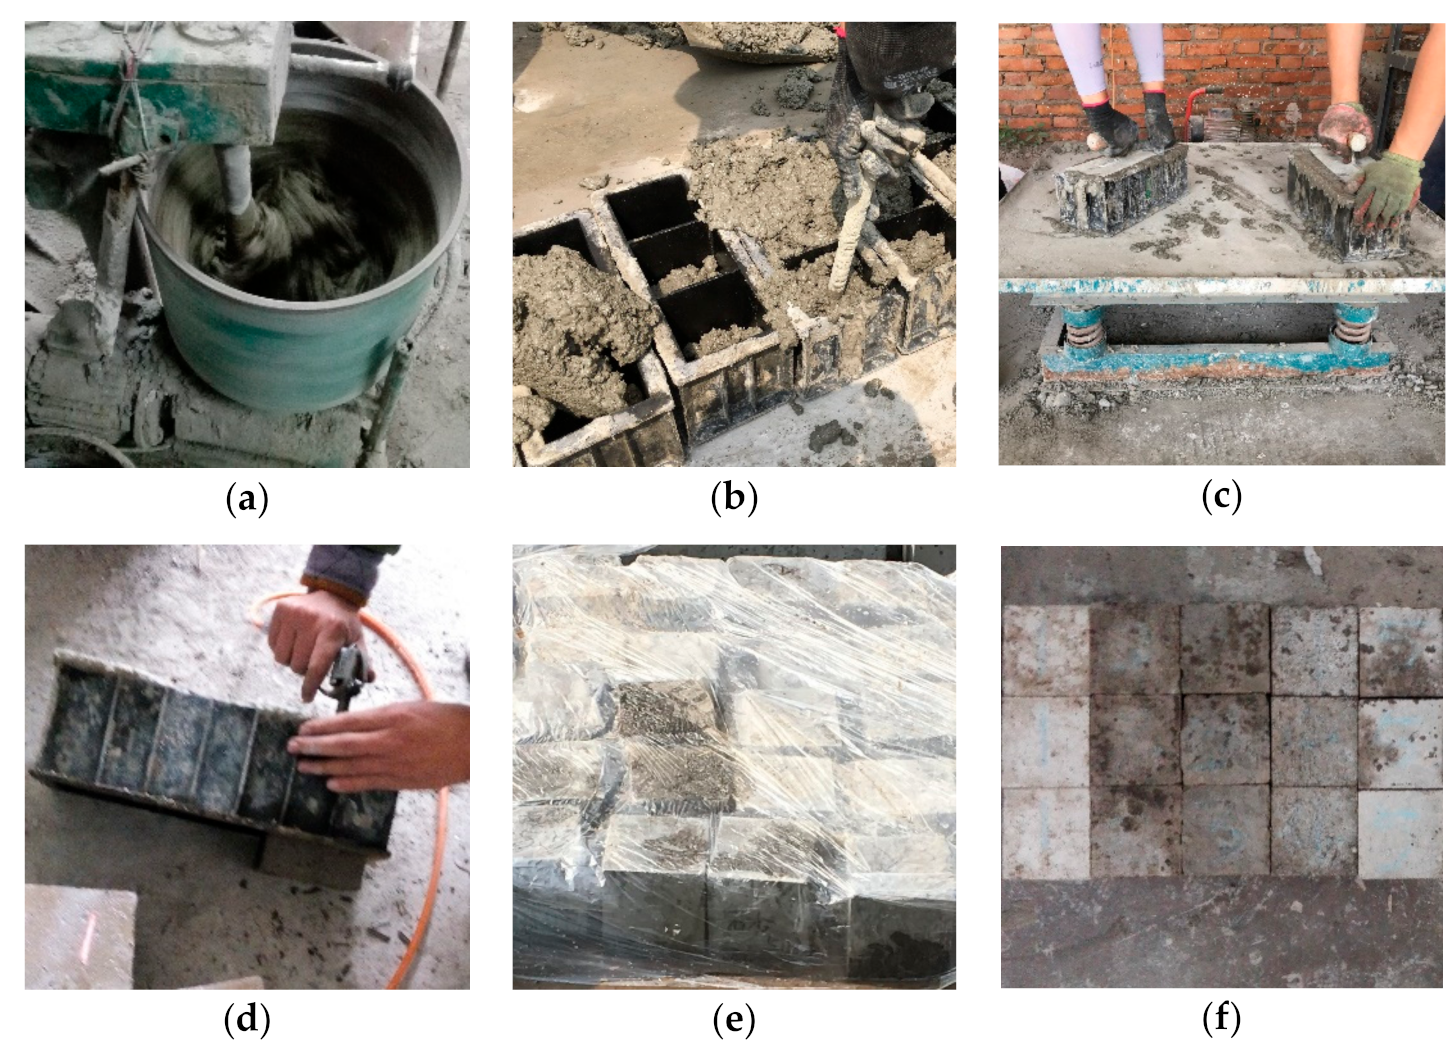
For the study of compressive strength of rubberized concrete, 30 cubic specimens (100 mm × 100 mm × 100 mm) were produced according to the mix ratios presented in Table 2, as specified by the Standard for Test Method of Mechanical Properties on Ordinary Concrete (China National Standard GB/T 50081-2002), and three specimens per mixture. Cement, aggregate, high range water reducer, and water were mixed in a conventional laboratory mixer (Figure 3a) for 3 min, and the prepared concrete was poured into 100 × 100 × 100 mm3 molds (Figure 3b). Then they were placed on the vibration table for vibration compaction (Figure 3c). Finally, they were demolded after 24 h (Figure 3d). All the specimens were cured at 20 ± 2 °C and 95% relative humidity for 28 days (Figure 3e). Figure 3f shows the partial prepared cubic specimens. Table 4 lists the types and the numbers of the specimens for the compression test.
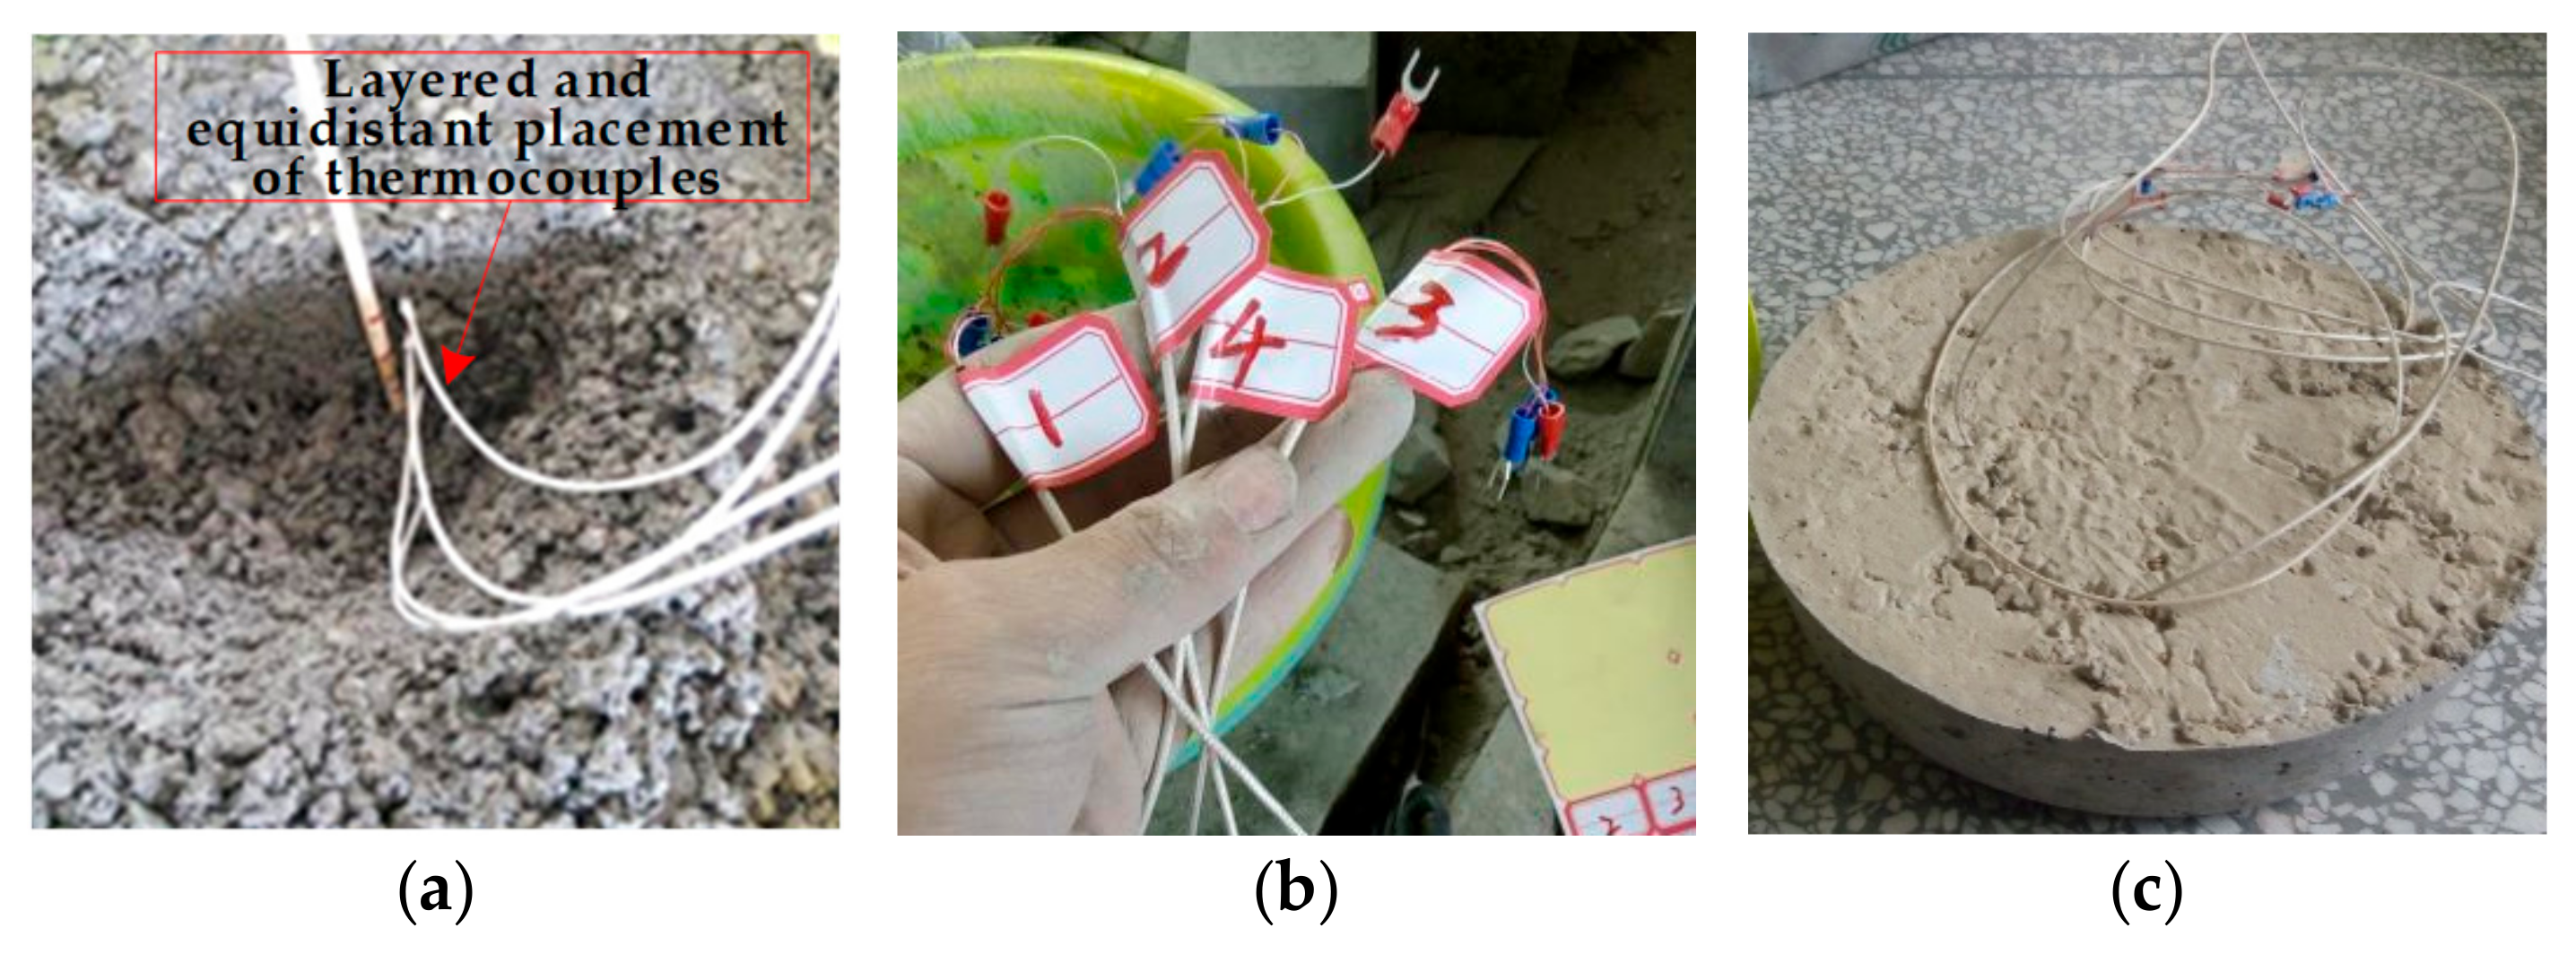
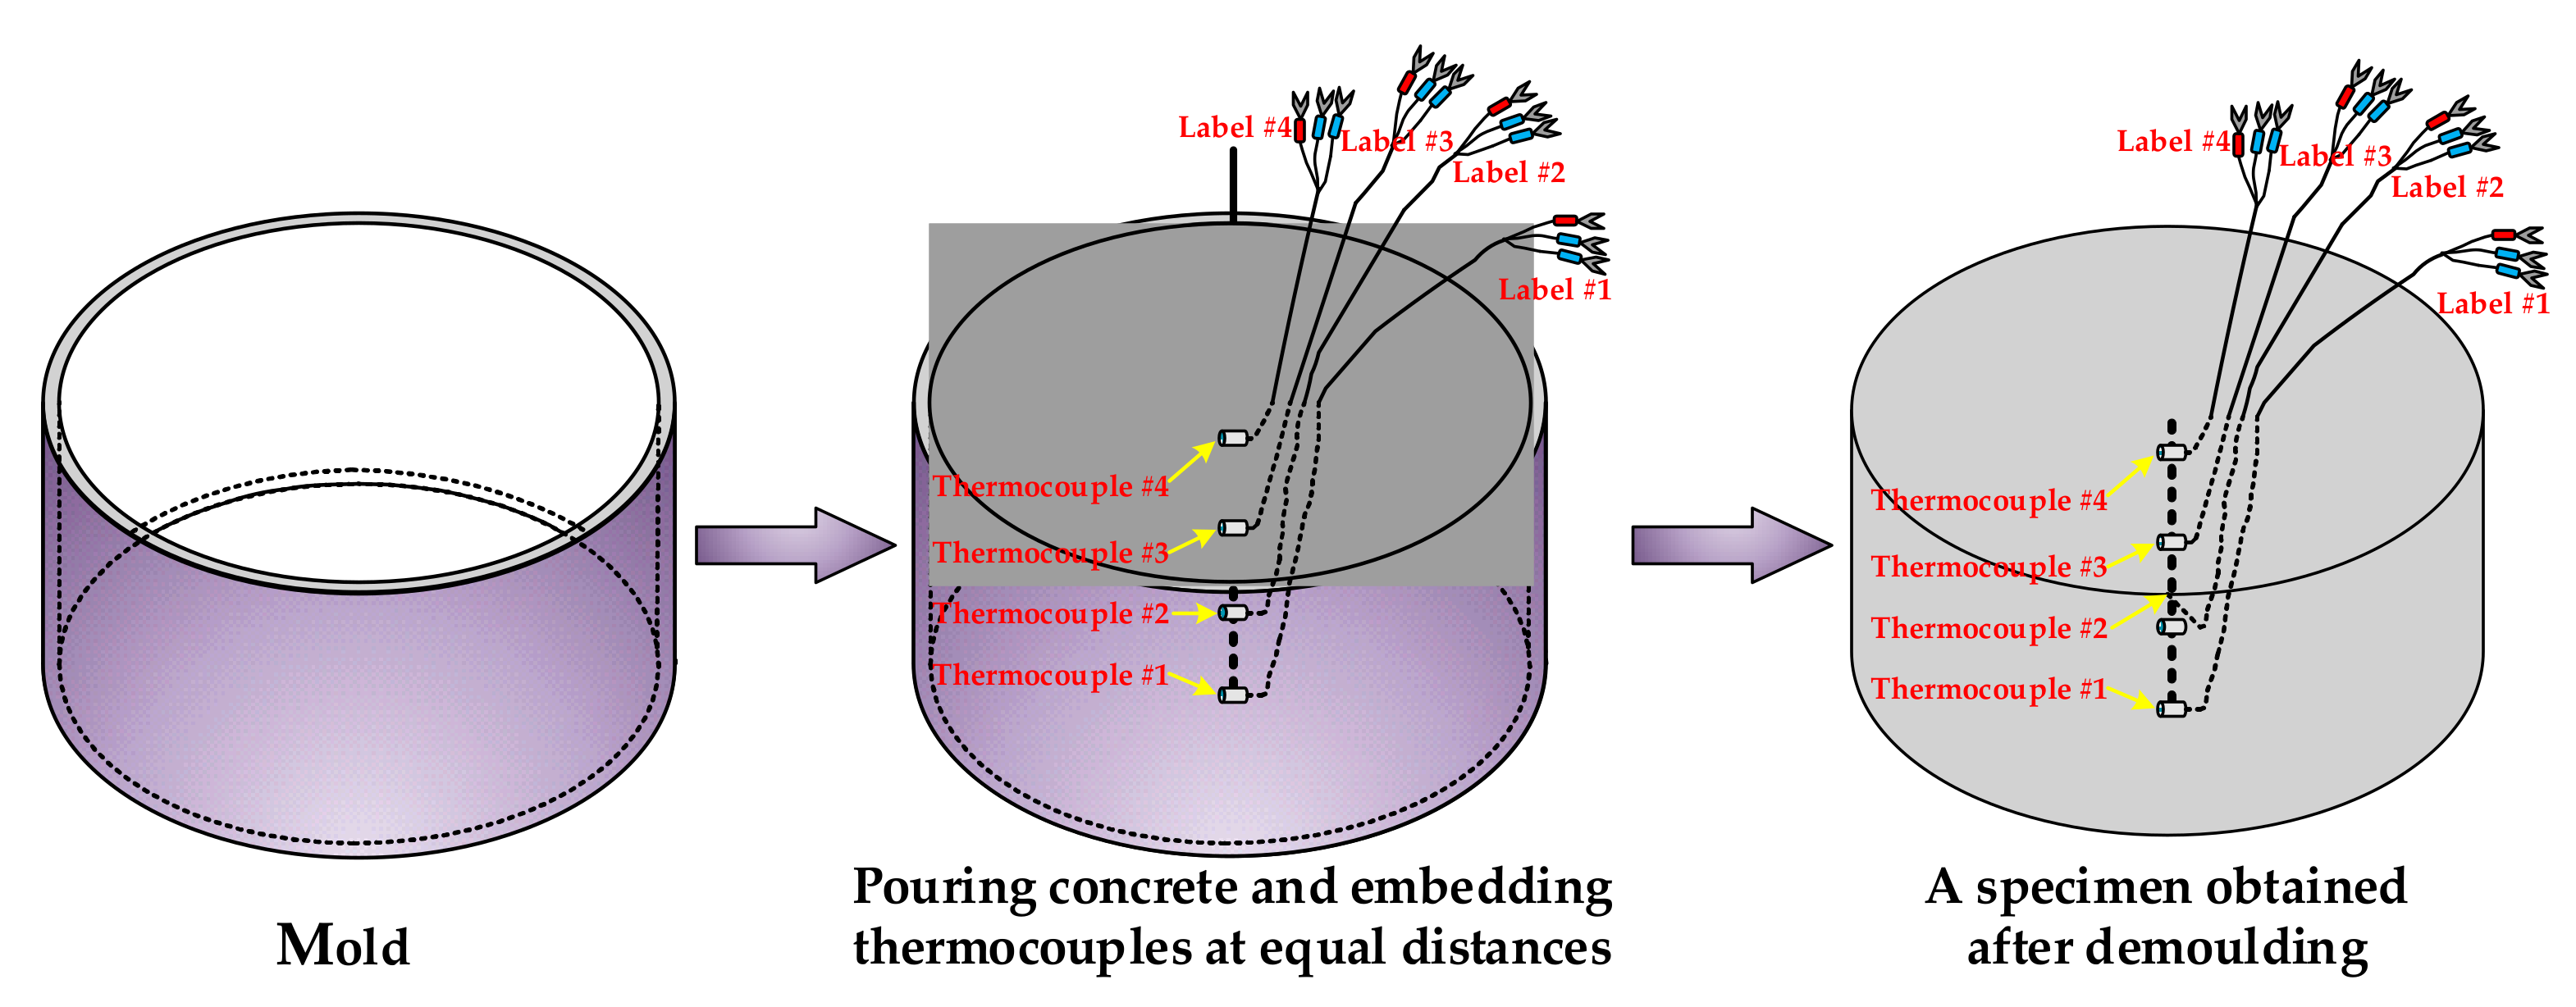
For the investigation of the thermal insulation properties of rubberized concrete, four groups of 13 specimens were fabricated from rubberized concrete mixed according to the mix ratios presented above and one specimen for per mixture. The cylindrical specimens were all 40 cm in height and 60 cm in cross-sectional diameter. Materials were also mixed in the conventional laboratory mixer for 3 min, and then the prepared concrete was poured into molds (removed after 24 h). As shown in Figure 4a, four thermocouples were embedded at equal distances from the bottom to the top of each specimen successively when producing specimens. The thermocouple at the bottom was identified as #1, and then #2, #3, and #4. Numbered labels were successively attached to the wires connecting the thermocouples (Figure 4b). One prepared specimen is shown in Figure 4c. The specimens were also cured at 20 ± 2 °C and 95% relative humidity for 28 days. Figure 5 shows the simplified flow-process diagram for sample preparation, and Table 5 lists the types and the numbers of the specimens for thermal insulation test.

3.2. Uniaxial Compression Test of Rubberized Concrete

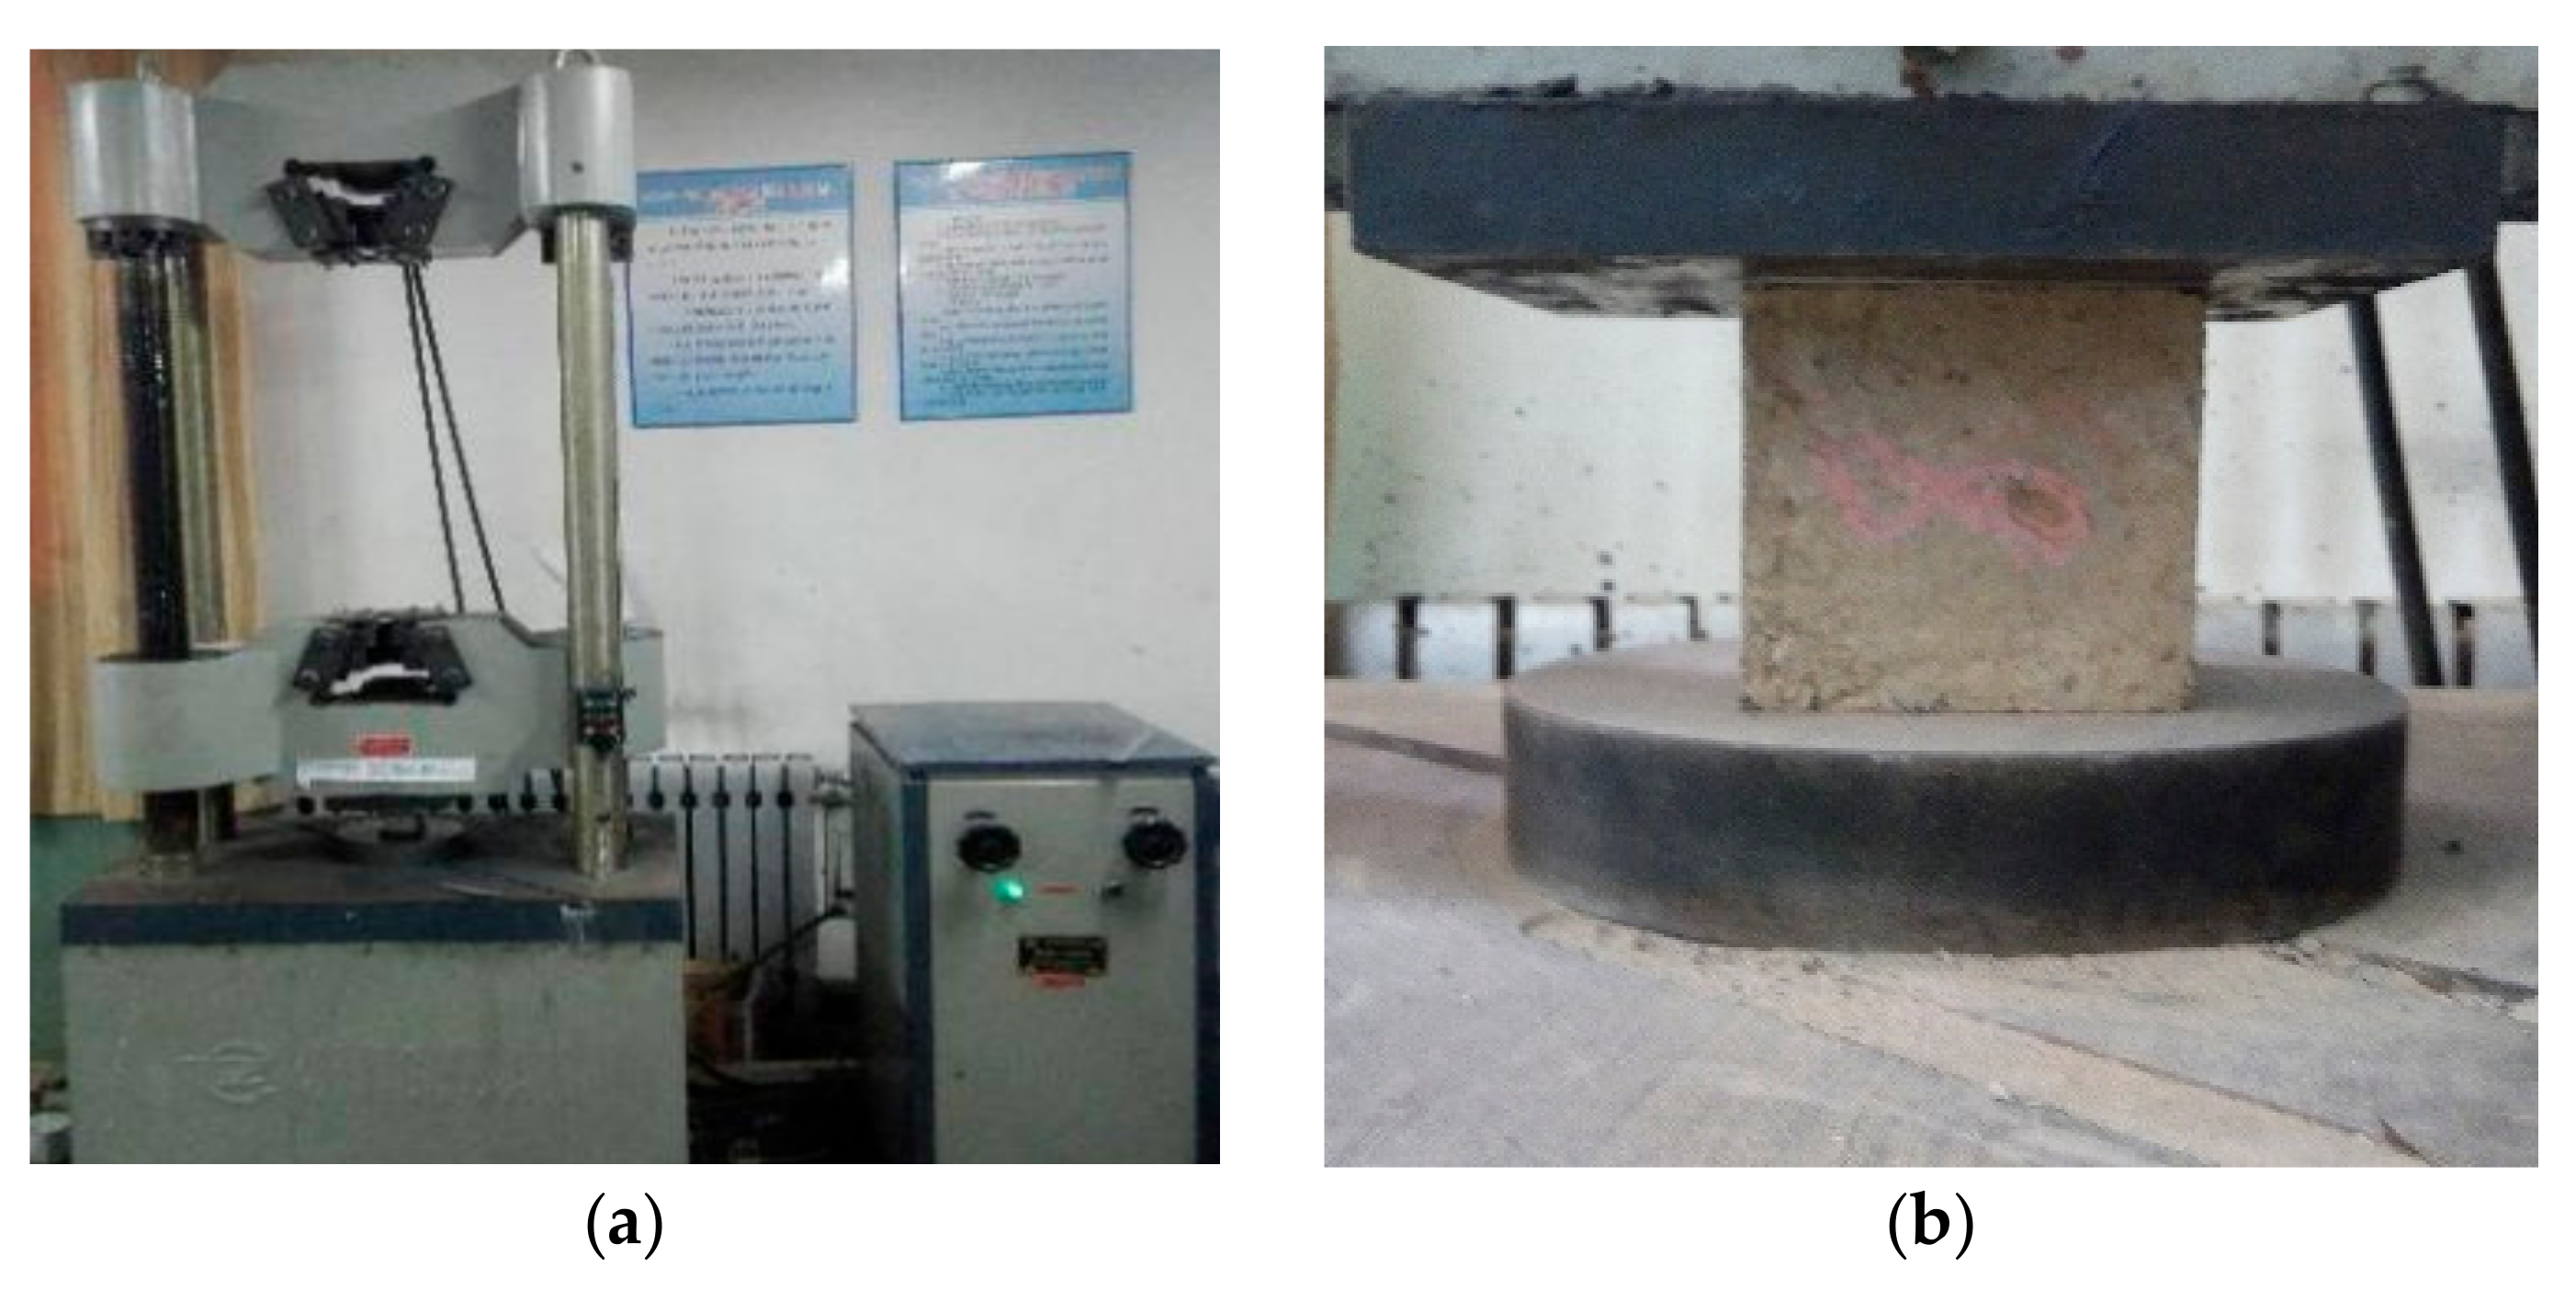
Uniaxial compression tests were carried out to study the compressive strength of rubberized concrete in accordance with the Standard for Test Method of Mechanical Properties on Ordinary Concrete (China National Standard GB/T 50081-2002). Four groups of 30 uniaxial compression tests of cubic specimens were performed by means of the electro-hydraulic servo universal testing machine (WES-1000B [29]), having a maximum capacity of 1000 kN in loading speed control with a rate of 0.5 MPa/s during testing. Loading was carried out continuously and uniformly during the compression test. When the cubic specimens approached failure and began to deform sharply, the throttle of the testing machine was stopped, adjusting until failure, and loading was stopped as well. For example, for one of the reference specimens, the slope of its stress-strain curve decreased from the positive value before the peak to zero, and then rapidly to −1370.02 MPa after the peak, at which point the loading was stopped. The reaction force and the rate were recorded by data acquisition. Figure 6 shows the test equipment for uniaxial compression tests.

3.3. Thermal Insulation Test of Rubberized Concrete

To conduct the thermal insulation test, the prepared specimens were grouped on an electric furnace (see Figure 7c) for heating (see Figure 7a), using the same power (700 W). The insulating cotton (see Figure 7a) used for heat preservation in this test was glass cotton wrap felt, and its safe-use temperature was −120 °C~400 °C. In order to ensure safety, the temperature required for this test did not exceed 400 °C. Therefore, the power of the electric furnace was adjusted to about 700 W. Moreover, Salmabanu Luhar et al. [30] investigated the thermal resistance of fly ash-based rubberized geopolymer concrete and treated the specimens at a maximum of 800 °C demonstrating that the rubberized concrete obtained by mixing rubber particles into plain concrete can withstand high temperature. Therefore, the thermal insulation test in this study was relatively safe. An XMD-100 temperature traveling detector (see Figure 7b) with inspection points up to 20 channels, and specification of 0~500 °C, was adopted for data monitoring and collection. When working, the detector automatically searched and read the temperature value of the next channel every 3 s. If quickly observing the temperature value of each channel, the search button can be pressed to switch to the next channel and, if continuously observing the change of the temperature value of a channel, the fixed button can be pressed to select the channel to observe the change of the temperature.

3.4. Microstructural Analysis of Rubberized Concrete

The microstructural analysis of the specimens was carried out by employing the scanning electron microscope of ZEISS at EHT 10 kV. Using scanning electronic microscope (SEM) and energy distribution spectroscopy (EDS), analyses of the samples were examined. Testing was performed on 12 samples (7 for SEM and 5 for EDS) of 2 cm × 2 cm cutting pieces from the prepared cubic specimens. The gold coating was applied on the surface of the samples before carrying out the analysis, and the surface of all samples were cleaned and contained no exfoliated debris.

4. Result and Discussion

4.1. Compressive Strength of Cubic Specimens

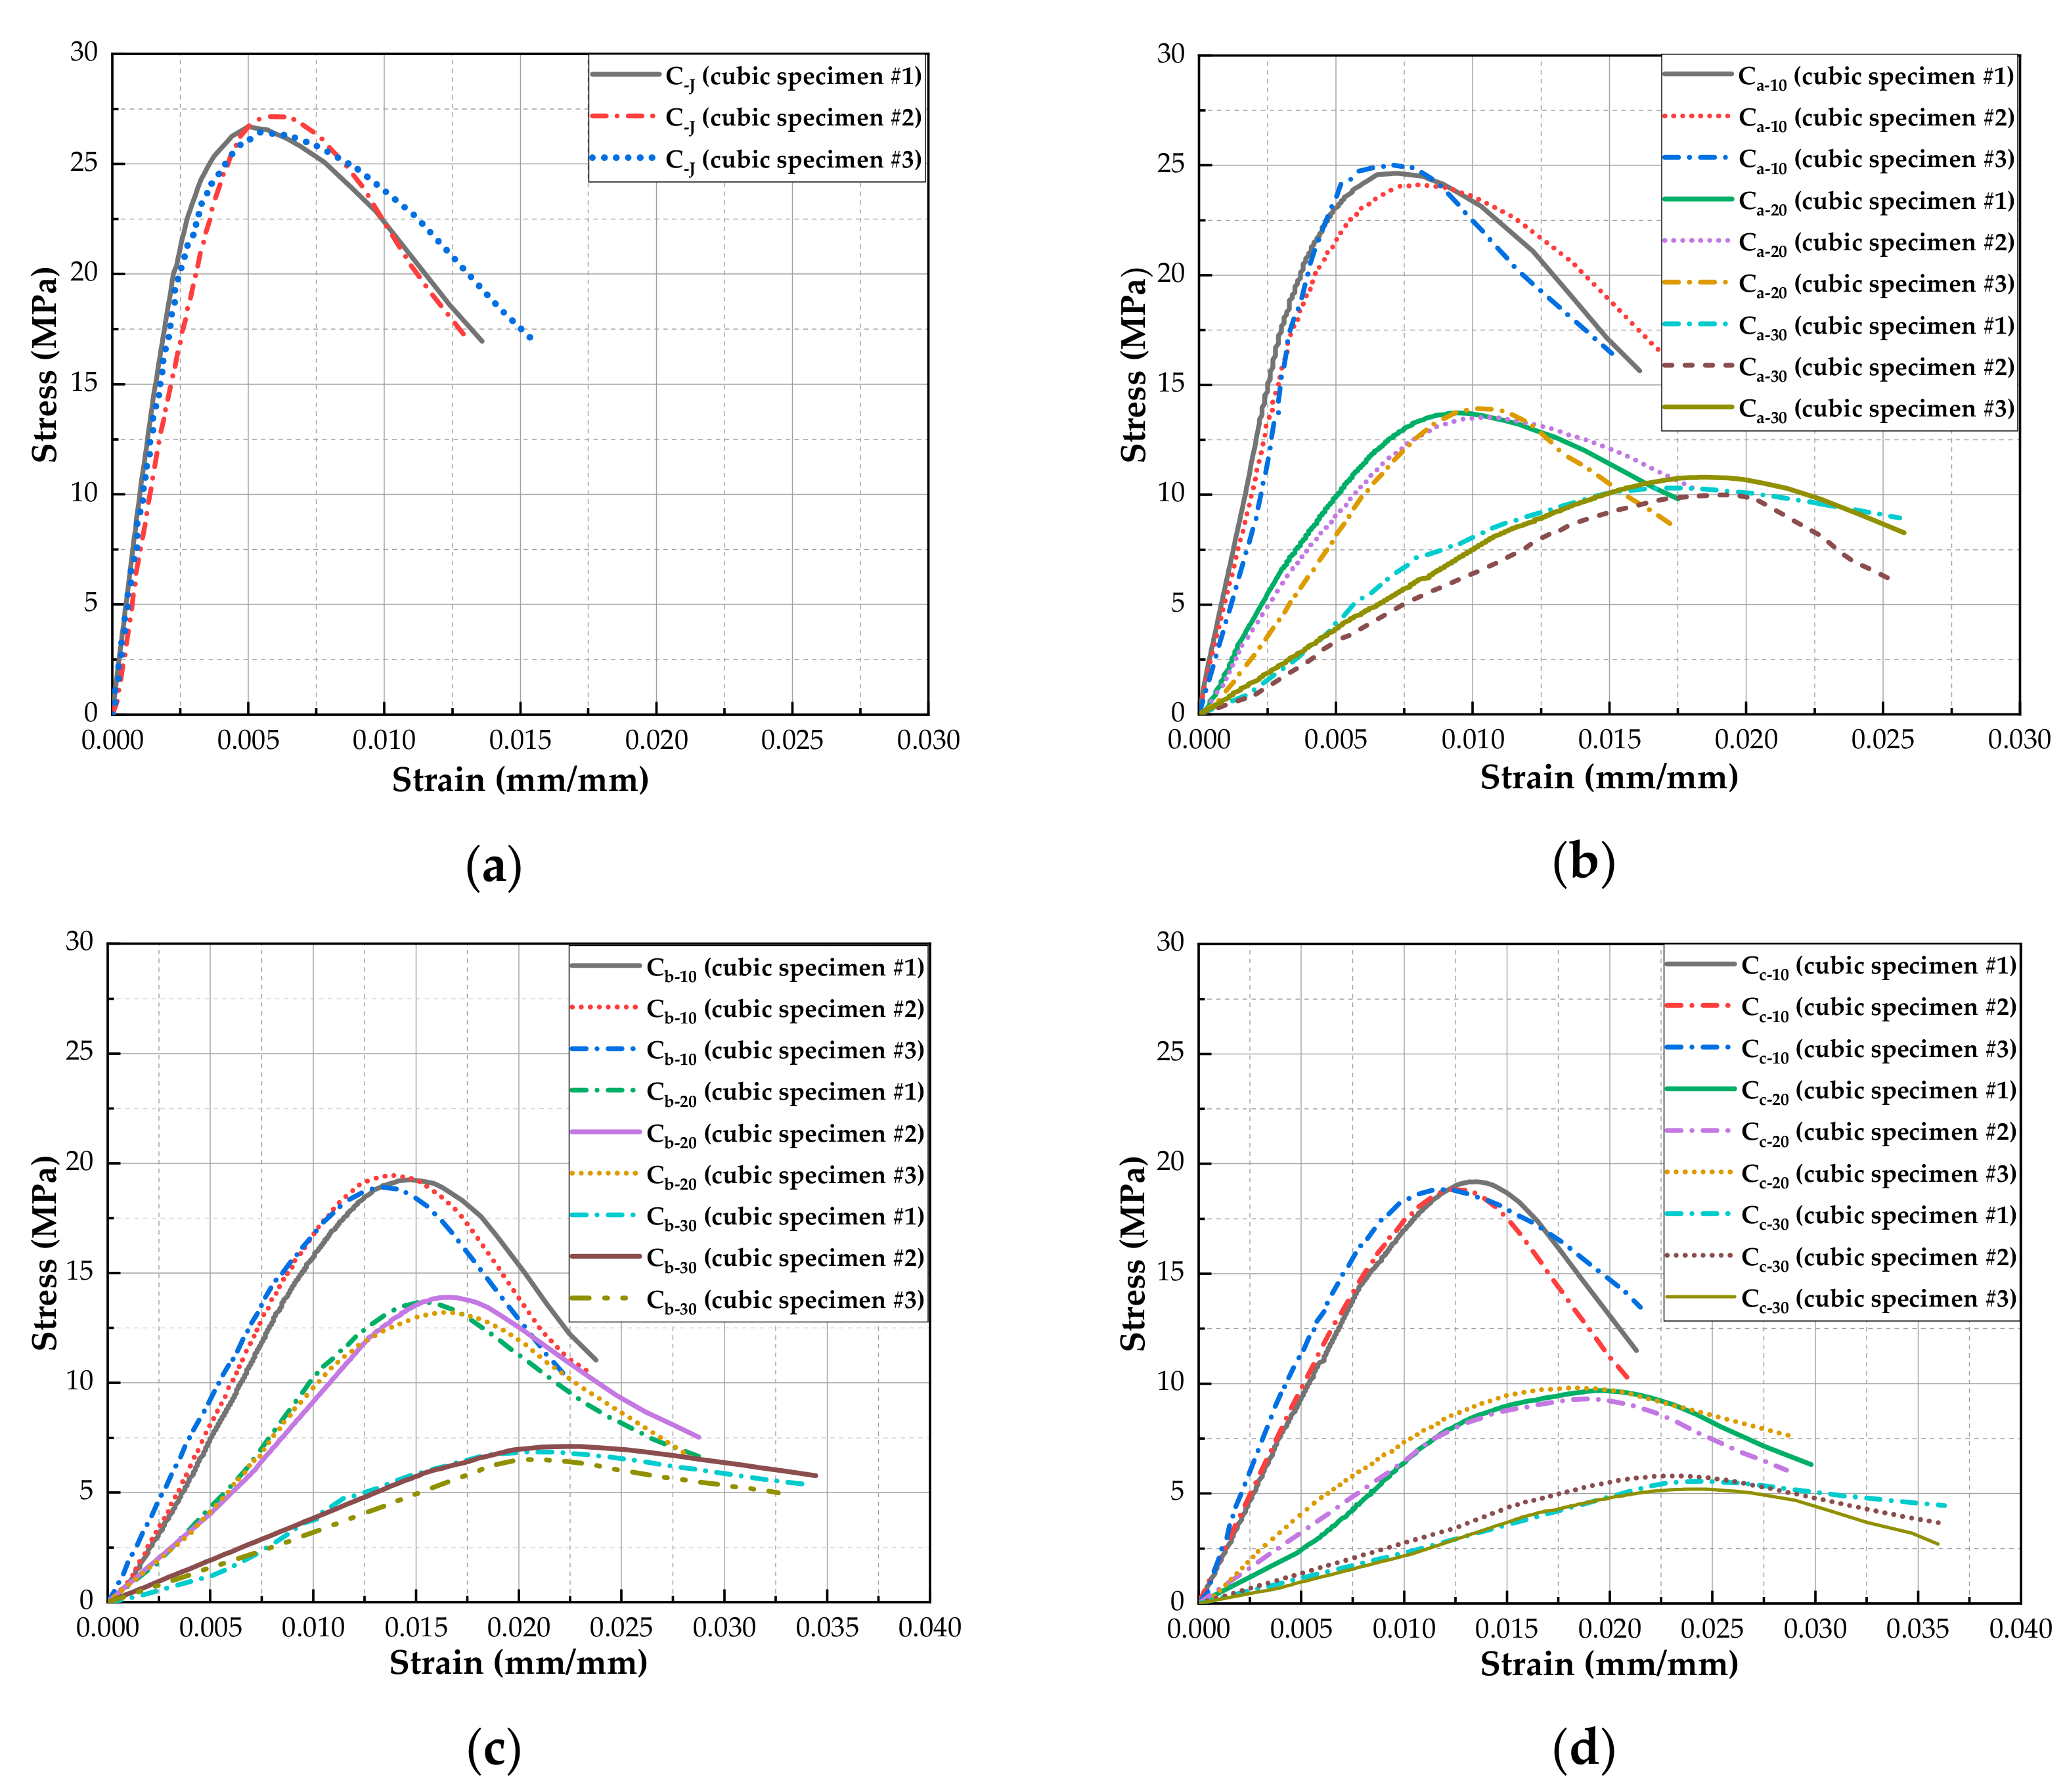
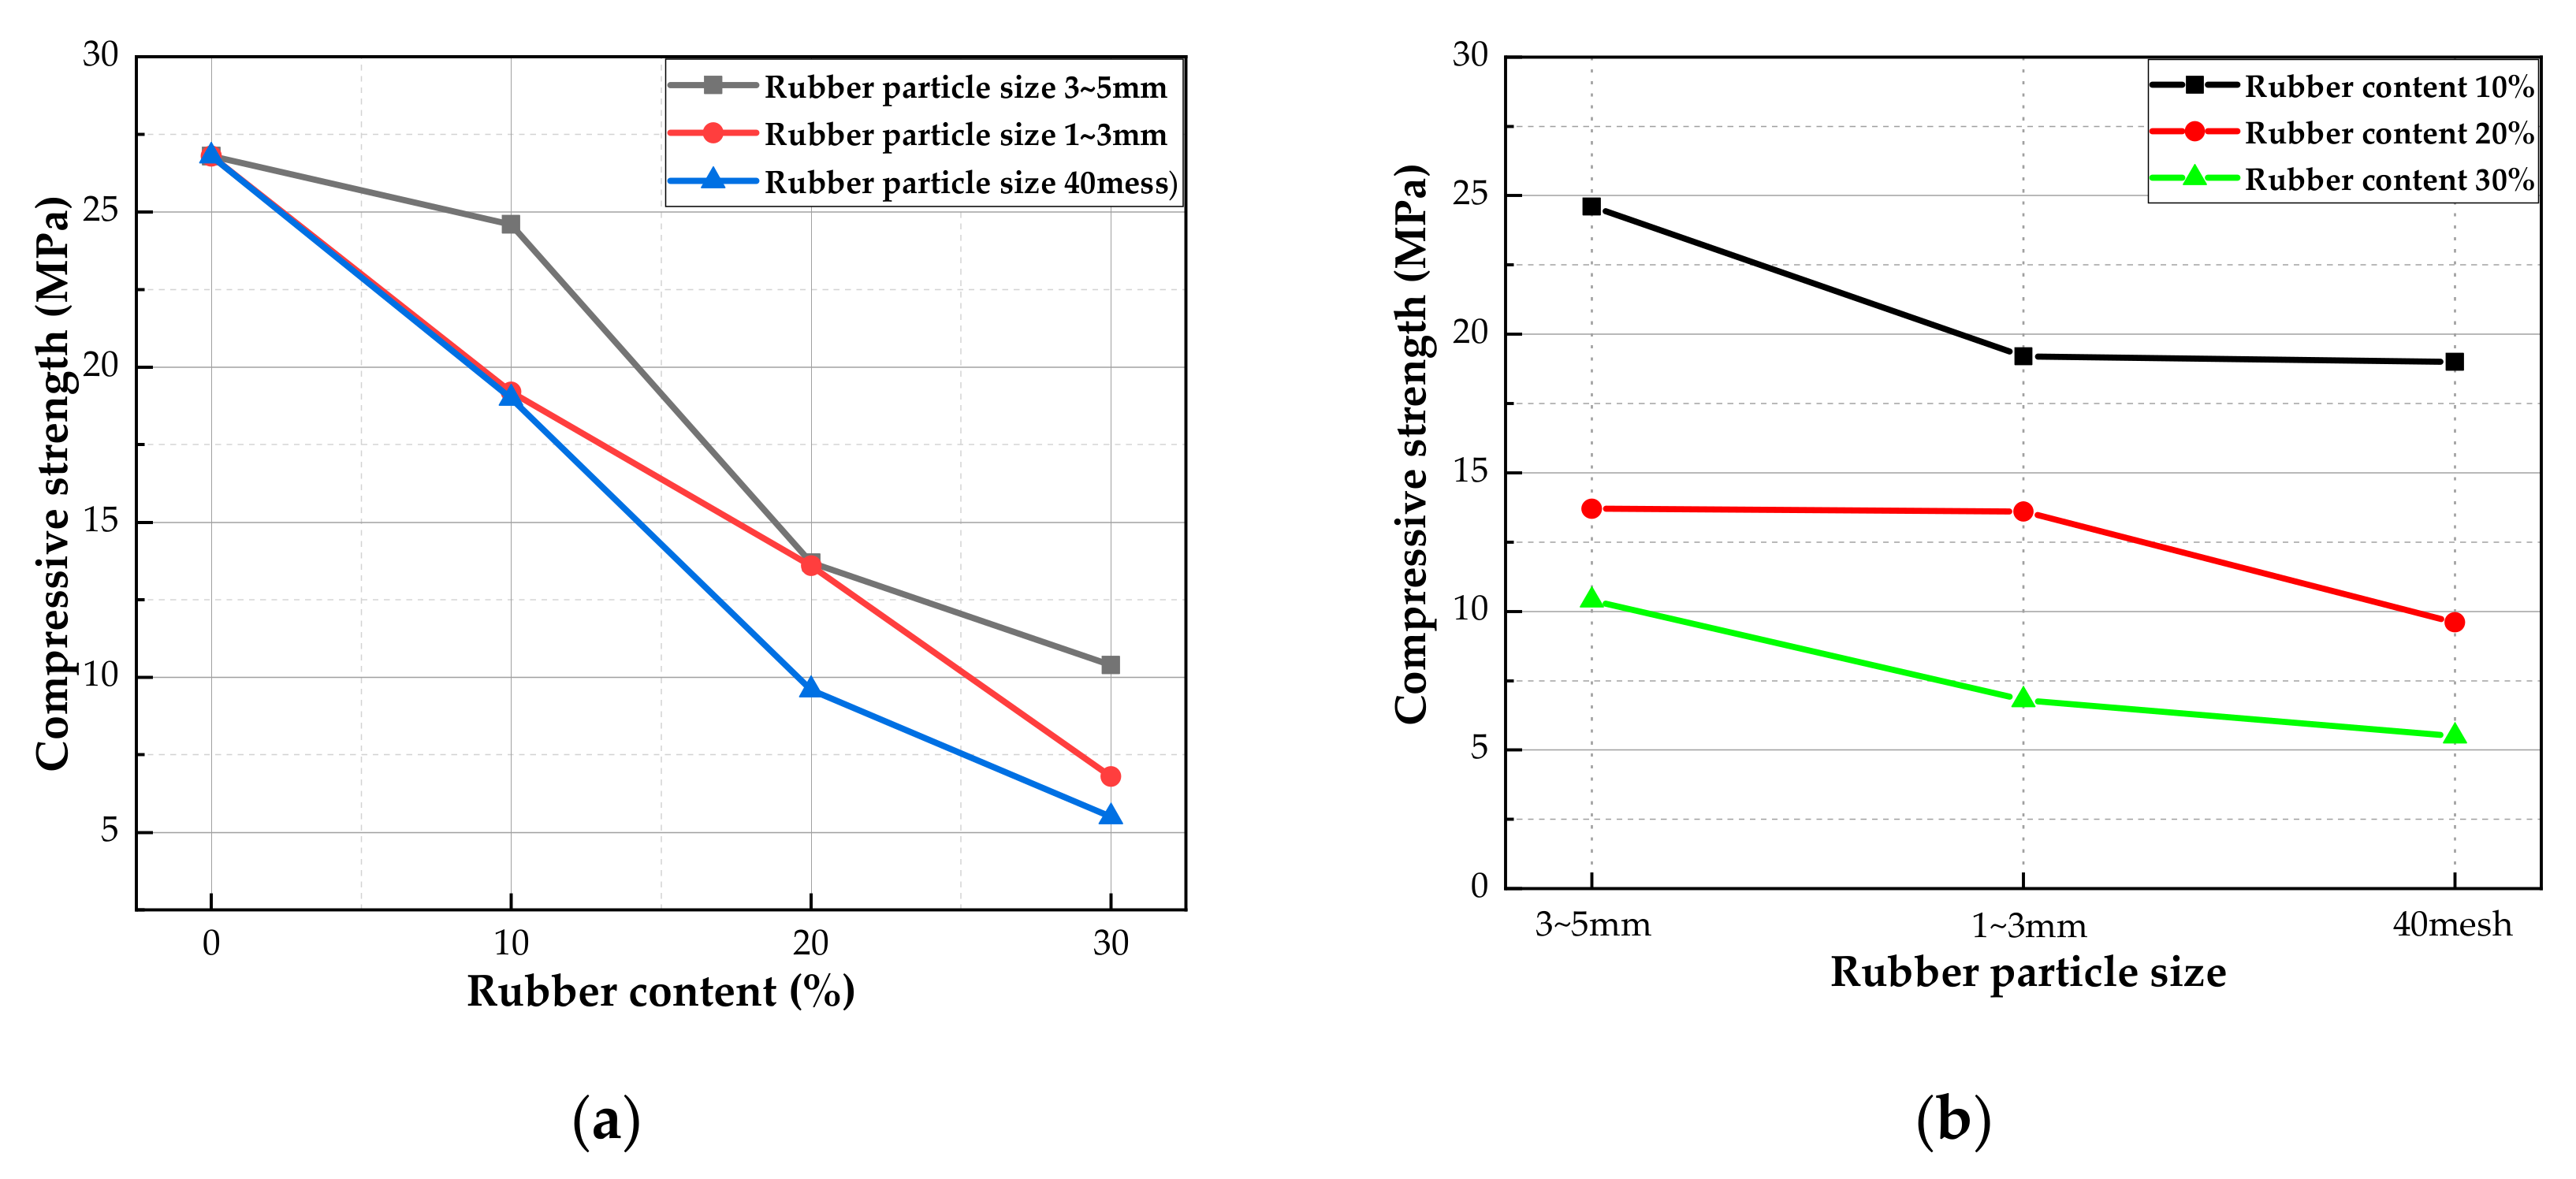
Stress-strain curves of 30 specimens are shown in Figure 8. Because there were 10 kinds of concrete mixtures, three specimens were prepared for each mixture. Therefore, three similar curves appeared to form a cluster (10 clusters in total), and the slopes of these three curves were similar. Effects of rubber particle size and weight content on compressive strength of cubic specimens are presented in Figure 9.

4.1.1. Effect of Rubber on Compressive Strength and Peak Strain

Stress-strain curves of the tested specimens of each group including both pre-peak and post-peak behavior are presented in Figure 8 showing that all the stress-strain curves followed a similar trend. The pre-peak behavior of the curve was almost linear, then the stress slowly increased with different curvatures up to the peak stress. Obviously, the curvature was reduced with a decrease in rubber particle size and, especially, an increase of rubber content. The post-peak behavior of rubberized concrete was strongly influenced by the rubber replacement of the fine aggregates. With an increase of rubber content or a decrease in rubber particle size, the post-peak axial compression behavior exhibited increased softening properties, which contributed to an increase in the peak strain corresponding to uniaxial compressive strength. In addition, the descending portion tended to reach a constant stress level at high strains when adding high content rubber particles into concrete.
The effects of rubber content and rubber particle size on compressive strength of specimens are shown in Figure 9. As shown in Figure 9a, there was a remarkable reduction in the compressive strength with an increase of rubber content. For instance, when the particle size was 3~5 mm, the average compressive strength of specimens with 10%, 20%, and 30% rubber was 24.6, 13.7, and 10.4 MPa, reduced by 8.2%, 48.9%, and 61.2%, respectively, as compared with the control group. When the particle size was 1~3 mm, the average compressive strength of specimens with 10%, 20%, and 30% rubber was 19.2, 13.6, and 6.8 MPa, decreased by 28.4%, 49.3%, and 74.6%, respectively. As shown in Figure 9b, the compressive strength systematically declined with a decrease in rubber particle size. For example, when rubber content was 10%, the average compressive strength of a specimen with 1~3 mm rubber particles was 19.2 MPa, which was 22.0% lower than a specimen with 3~5 mm particles (24.6 MPa). Furthermore, the average strength of a specimen with 40 mesh rubber particles was 19.0 MPa, which was 22.8% lower than a specimen with 3~5 mm particles. When the content was 20%, the average compressive strength of a specimen with 1~3 mm rubber particles was 13.6 MPa, which was 0.7% lower than a specimen with 3~5 mm particles (13.7 MPa). Moreover, the average strength of a specimen with 40 mesh rubber particles was 9.6 MPa, which was 29.9% lower than a specimen with 3~5 mm particles. The comparative analysis found that increasing rubber content sharply reduced the compressive strength of cubic specimens. Whereas, when the rubber particle size was 40 mesh, although the strength was reduced with an increase of rubber content, the rate of decline gradually decreased.

4.1.2. Effect of Rubber on Failure Modes of Cubic Specimens

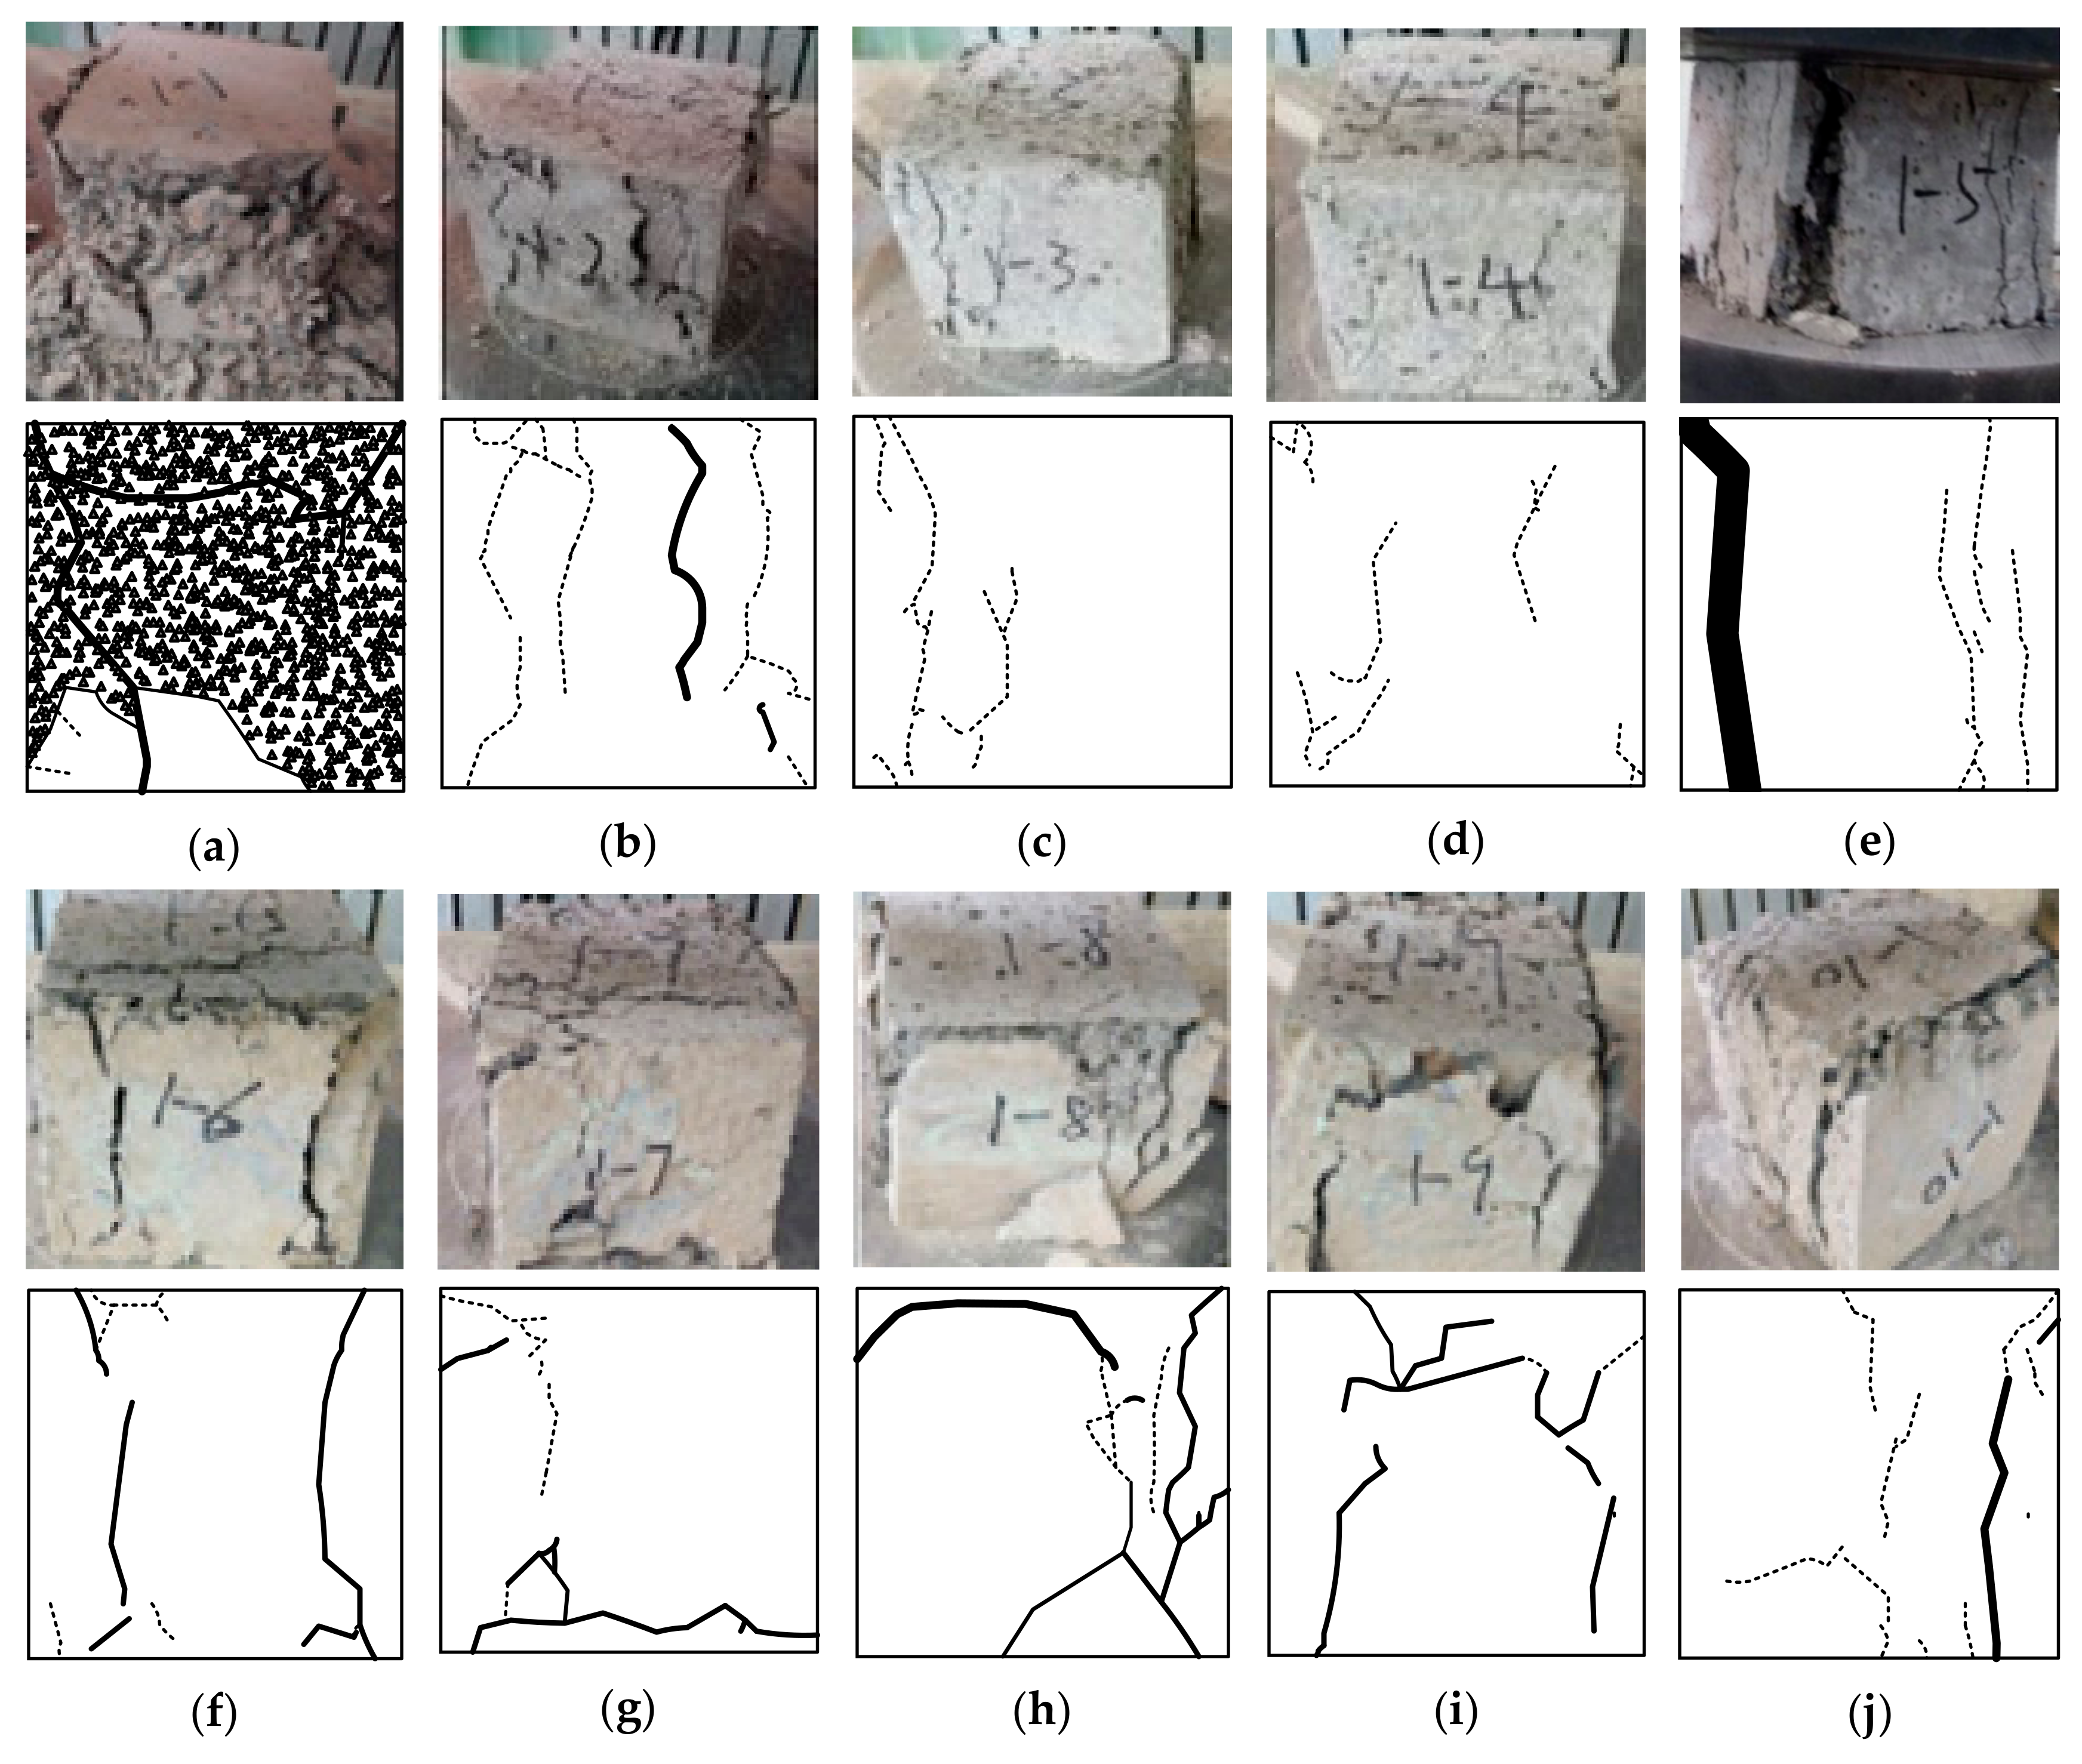
Failure modes were studied by randomly selecting one specimen from three cubic specimens produced from each mixture (10 samples in total). Figure 10 illustrates that specimens with rubber particles kept better morphological integrity. As seen in Figure 10a, the control specimen was completely destroyed and cracks appeared throughout the entire surface, showing brittle failure. Cracks appeared around the specimen, which ran through the whole specimen, and a large area collapsing phenomenon was also observed in the specimens. When mixing the rubber particles, the number and size of cracks decreased as the rubber content was increased. For any rubber particle size (3~5 mm, 1~3 mm, or 40 mesh), with an increase of rubber content, the integrity of the specimen was better, and the number and size of surface cracks and penetrating cracks gradually decreased. In particular, when the rubber particle size was 3~5 mm, the integrity of specimens was the best, with only a few fine surface cracks (Figure 10b–d), and only when the rubber content was 10% (Figure 10b), a narrow penetrating crack appeared. However, when the rubber content was 20% or 30%, no penetrating crack appeared. In addition, when respectively mixing 1~3 mm and 40 mesh rubber particles, the crushing degree of specimens was higher than specimens with 3~5 mm rubber particles, and only few materials were peeled off, mainly manifested as tensile damage. When the rubber content was low, it was manifested as shearing and tensile composite damage, conversely, few surface cracks and penetrating crack appeared in the specimens. In conclusion, the ideal cracking resistance was obtained by incorporating 3–5 mm rubber particles with a rubber content of 30%.
Rubber has low elastic modulus and high hydrophobicity. Low elastic modulus endows the specimens with high elastic deformation capacity. Table 6 lists the average elastic modulus of each concrete mixture calculated based on the stress-strain curves shown in Figure 8. Since three cubic specimens were prepared for each mixture, the elastic modulus of the three specimens was averaged in order to ensure the reliability of the results. It can be seen from Table 6 that the elastic modulus of concrete decreased sharply by adding rubber particles, and decreased gradually with a decline in rubber particle size or an increase of rubber content. High hydrophobicity weakens the bond between rubber particles and cementitious materials, and stress concentration occurs easily at the location of rubber particles, which reduces the strength of the specimens. When rubber content is low, rubber particles are sparsely distributed in cementitious mixtures, having little effect on the properties of concrete. When rubber particles are large and content is high, the voids between partial coarse aggregates are filled by the rubber particles. The voids between rubber particles are filled with sand, and therefore form a relatively stable spatial structure, which results in few surface cracks and penetrating cracks after failure of the cubic specimen. Although the addition of waste rubber particles into concrete reduced its compressive strength, its properties of crack resistance were improved. Therefore, rubberized concrete can be applied to projects requiring crack resistance, such as building of light fillers for the base layer of pavement and bridge supports. In addition, the incorporation of rubber particles can affect concrete’s failure path. Many cracks were distributed in the entire reference specimen, and the evolution, propagation, and coalescence of the cracks eventually lead to its large-scale brittle fracture. However, when rubber particles were mixed, some cracks were locally distributed in the specimens, and the coalescence degree after propagation of the cracks was low. Moreover, with an increase of rubber content, the coalescence degree decreased, and the distribution of the cracks tended to transfer from multiple points to both sides of the specimens.

4.2. Thermal Insulation Properties of Specimens

4.2.1. Results of Thermal Insulation Test of Specimens

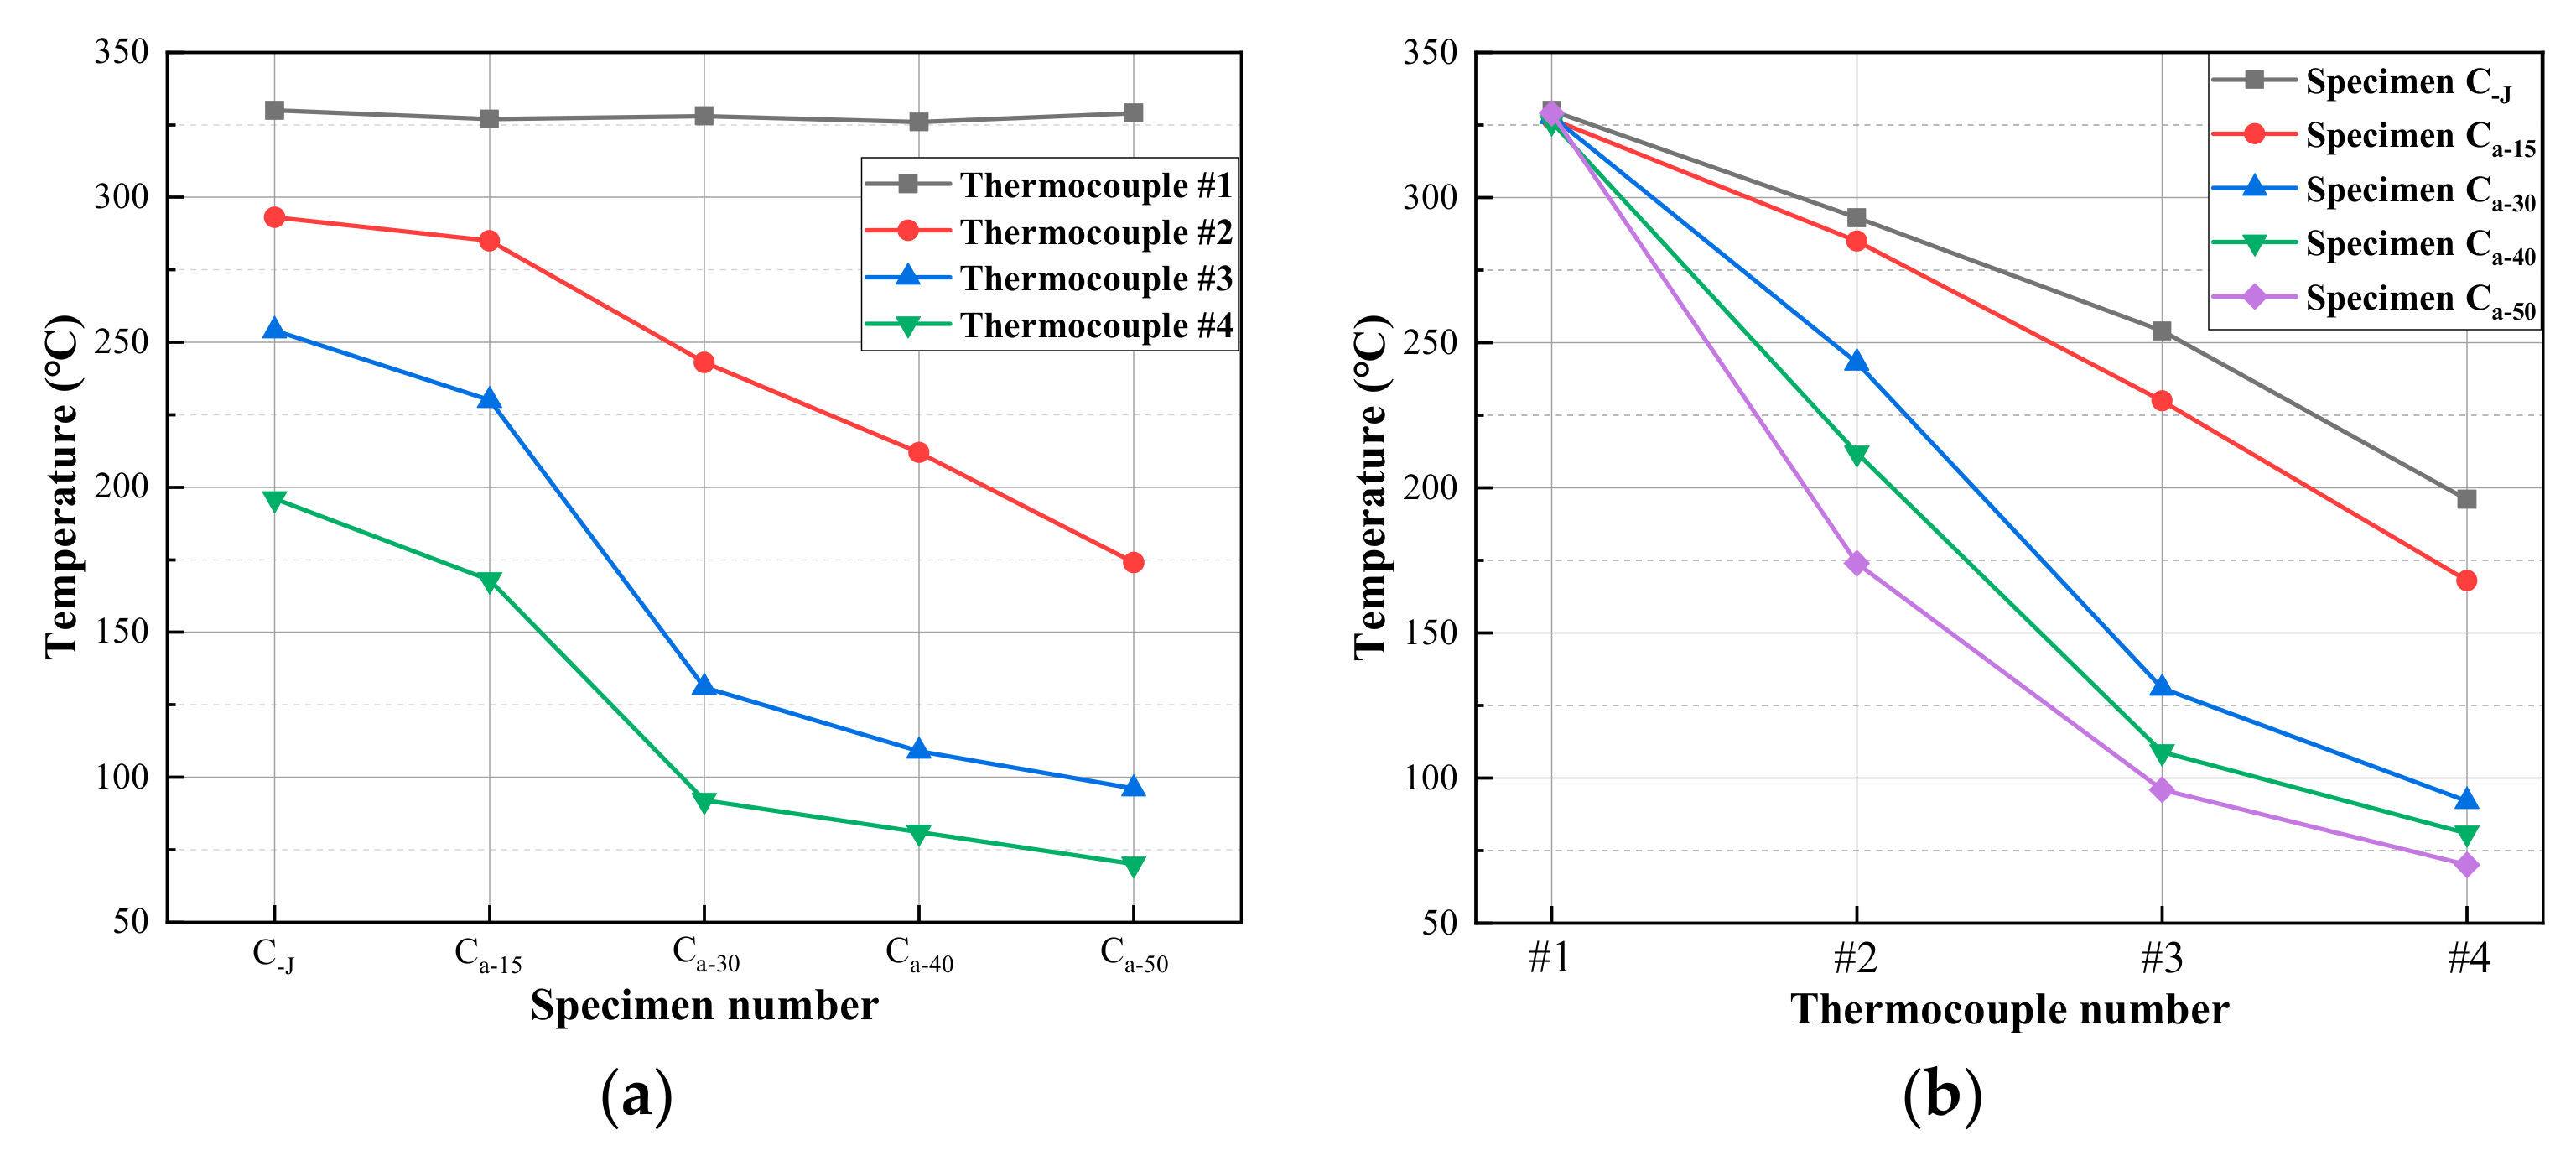
Temperature variation of the thermocouples in the specimens are shown in Figure 11. It can be seen that the temperature of the thermocouples with the same number (except #1) decreased gradually with the increasing of the specimen number at any particle size. As shown in Figure 11b,d,f, the temperature of each thermocouple in the same specimen decreased gradually with an increase of the thermocouple number. Moreover, the decreasing value of the temperature of each thermocouple (except #1) roughly increased with an increase of the specimen number. Additionally, the temperature of the thermocouple #1 in each specimen was approximately the same because they were all embedded at the bottom of the specimens and the distances between these thermocouples and the upper surface of the electric furnace were almost the same.
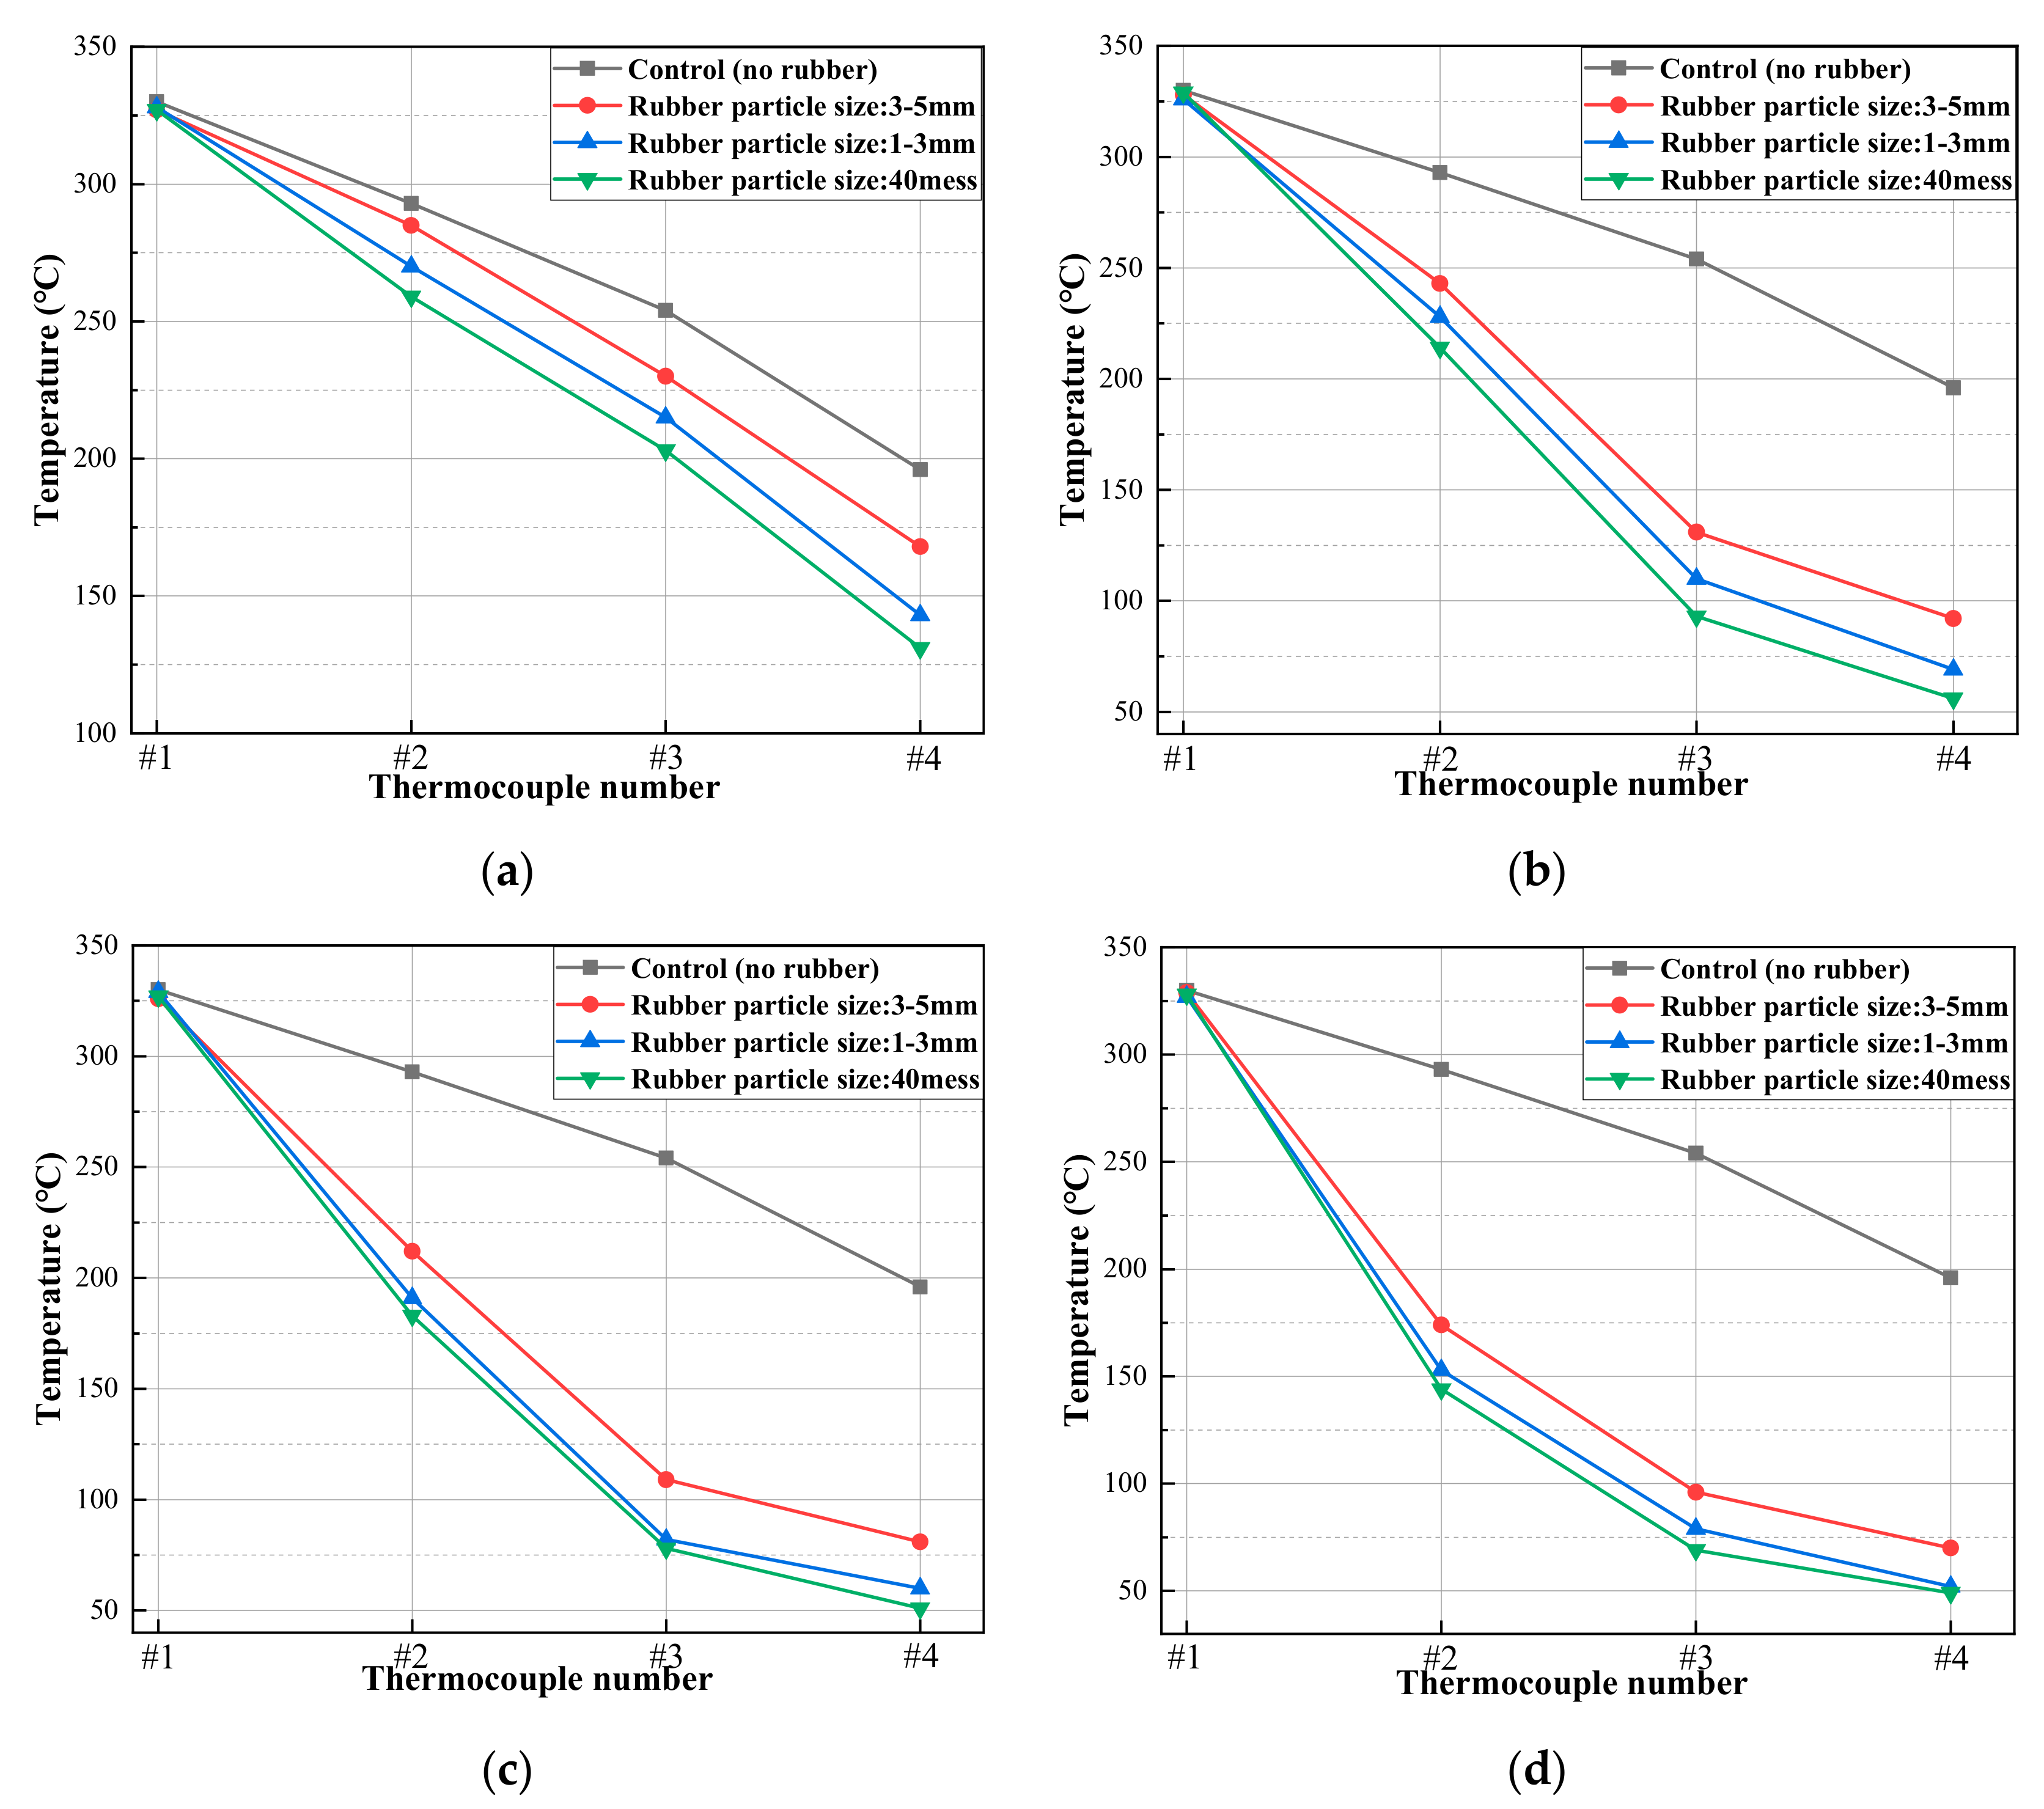
As shown in Figure 12, the graphs reflect the effect of rubber particle size on thermal insulation, illustrating that as the particle size decreased, temperature in the specimens (from the bottom to the top) decreased by a larger margin for any rubber content. However, when particle size was small (1~3 mm or 40 mesh), there was no obvious difference in the change of internal temperature of specimens, and the influence of rubber content on the change of temperature was no longer obvious, relatively, which, accordingly, revealed that the specimens were better when the particle size was smaller. For example, when the rubber content was 30%, the temperature difference between thermocouples #1 and #4 in the specimen with rubber particles of 3~5 mm was 236 °C. However, the temperature difference in the specimen with rubber particles of 40 mesh was 273 °C, showing better thermal insulation performance. Additionally, when the particle size was smaller, the impact of rubber content was not obvious. For instance, when the rubber particle size was 40 mesh, the temperature differences between thermocouples #1 and #4 in the specimens with rubber contents of 30%, 40%, and 50% were 273 °C, 276 °C, and 279 °C, respectively, indicating that rubber content had little influence on the thermal insulation performance of rubberized concrete.

4.2.2. Heat Flux and Heat Resistivity

In this study, heat flux and heat resistivity were utilized to evaluate the thermal insulation performance of the specimens. Piti Sukontasukkul’s study revealed the thermal conductivity values of rubberized concrete were in the range of 0.241~0.443 W/m·K [24]. Considering that the rubber particles and mix ratios of rubberized concrete used in Piti Sukontasukkul’s research were similar to that in this study, the same test was not carried out and the thermal conductivity values (k) obtained from the results of Piti Sukontasukkul’s research were adopted. The variations of the thermal conductivity are shown in Figure 13. Obviously, the rubber particle size was positively correlated with the thermal conductivity, while the rubber content was the opposite.
According to the one-dimensional steady heat transfer theory, the heat flux (q) and heat resistivity (rk) of a single-layer flat wall are calculated separately by the following two formulas:
q = k Δ T d ,
r k = d k ,
where, q = heat flux (W/m2), rk = heat resistivity (m2·K/W), k = thermal conductivity (W/m·K), ΔT = temperature difference between thermocouples at the bottom and top of each specimen (°C), and d = specimen thickness.
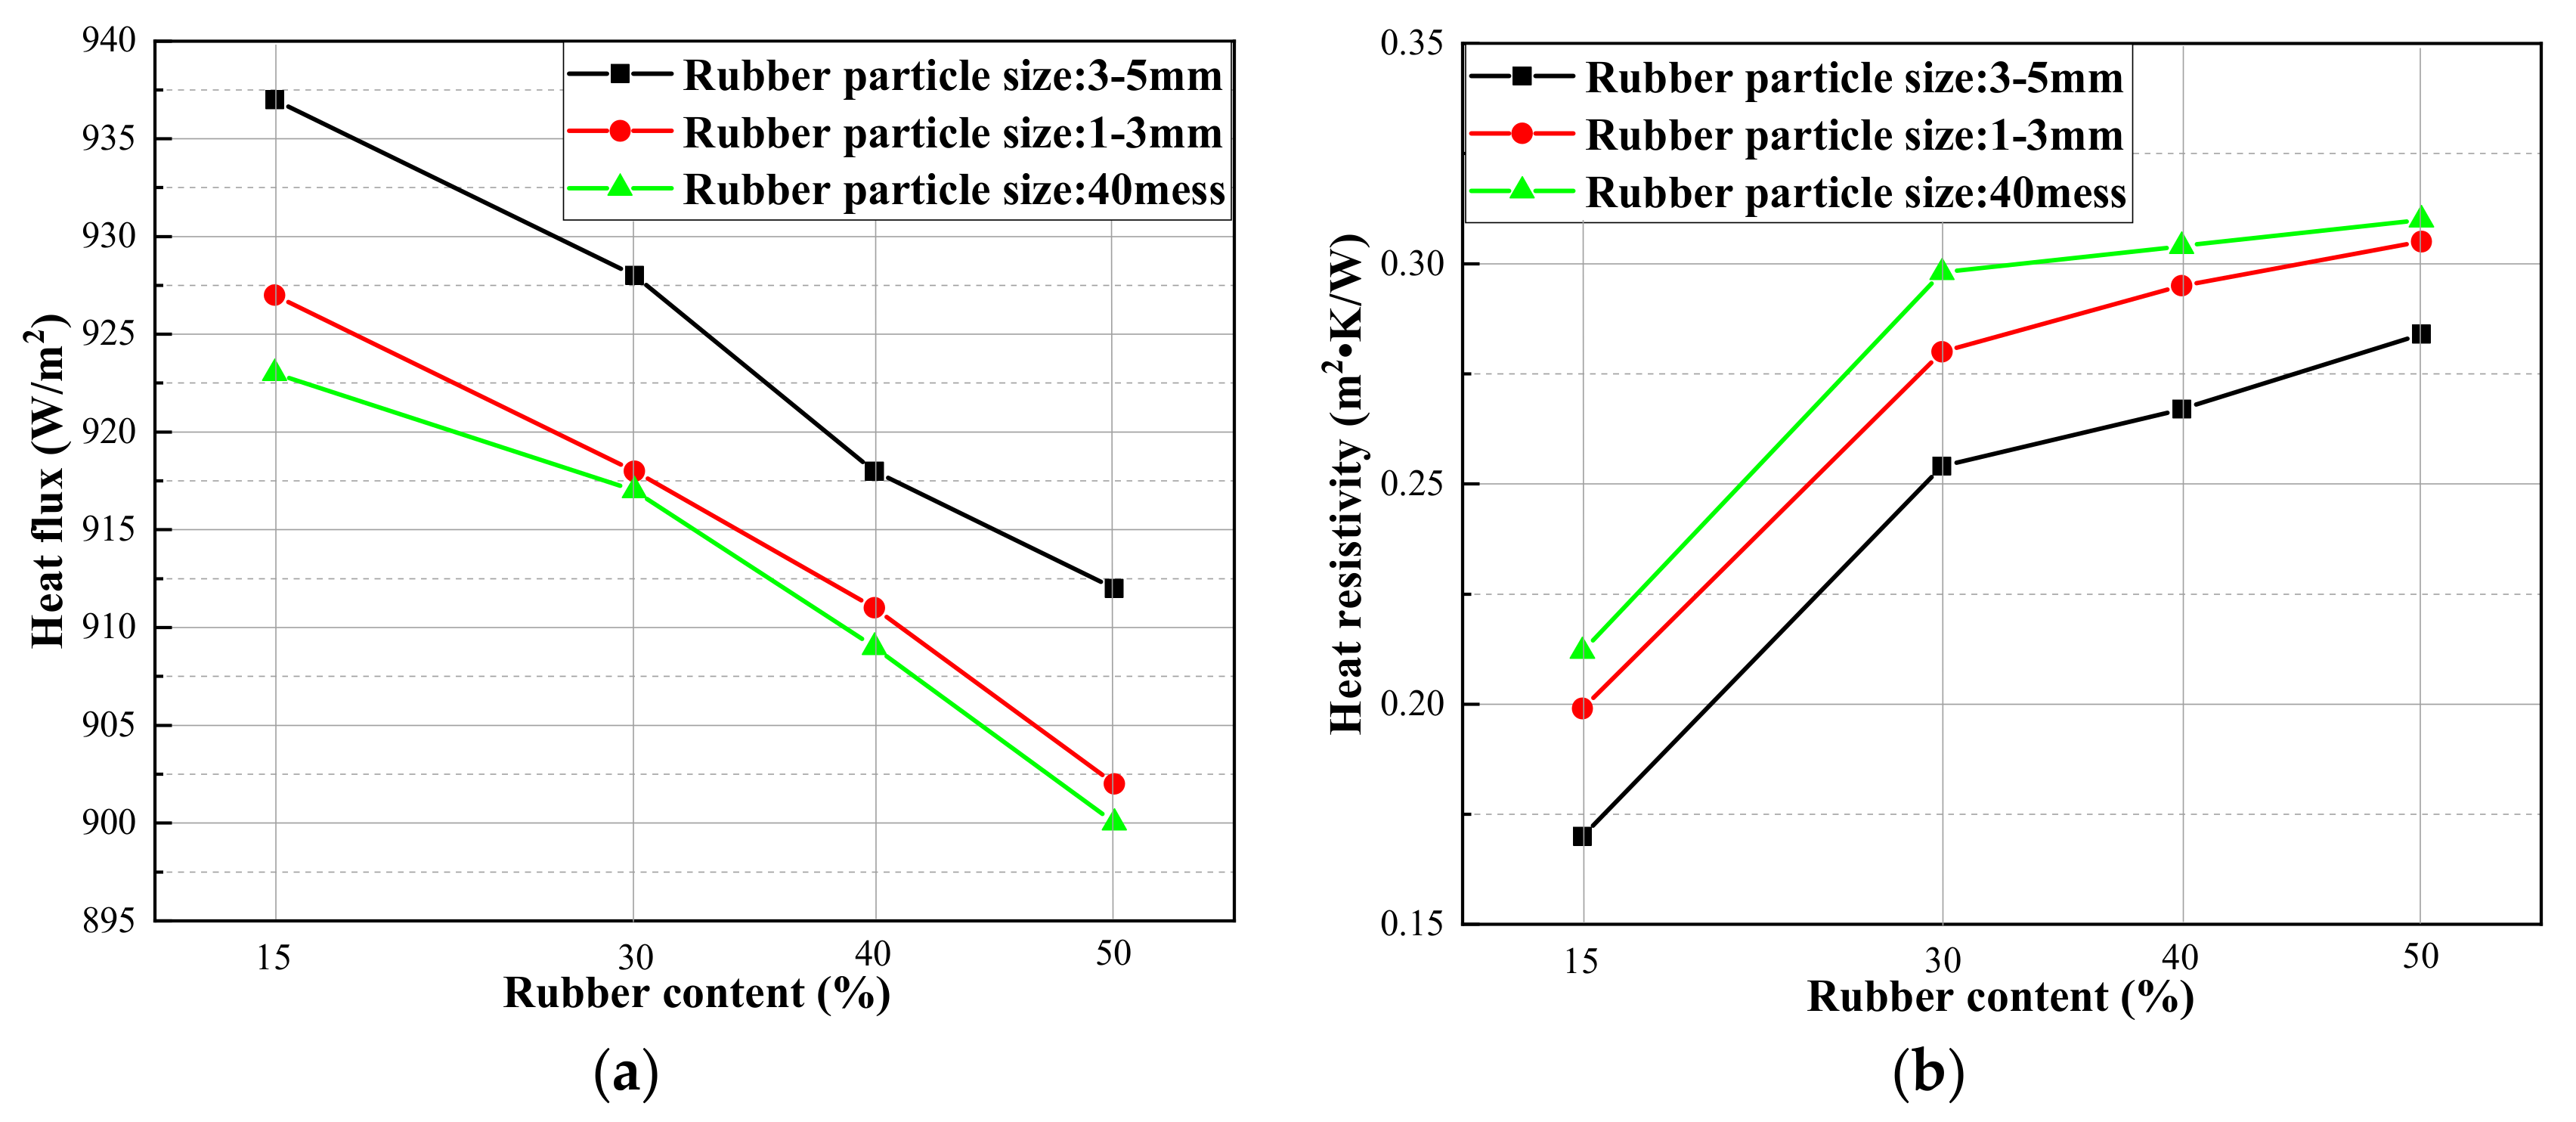
Figure 14 shows the variation of heat flux and heat resistivity of specimens. Obviously, decreasing rubber particle size or increasing rubber content reduced heat flux, while inversely increasing heat resistivity. It is noteworthy that, the heat flux was directly proportional to the rubber particle size and inversely proportional to the rubber content. In addition, the heat resistivity is inversely proportional to the rubber particle size and directly proportional to the rubber content. In conclusion, when rubber particles of 40 mesh and 50% content were incorporated into concrete, the best thermal insulation performance was obtained. In view of its good thermal insulation, rubberized concrete can be applied to building insulation.
Two reasons may account for the results of the thermal insulation tests. First, rubber is a poor conductor of heat, which results in low thermal conductivity of rubberized concrete, and the larger the rubber content, the lower the thermal conductivity. Additionally, the smaller the rubber particles, the better the thermal insulation performance of specimens. A possible explanation is that numerous smaller particles can form denser three-dimensional “thermal insulation network” which can effectively block the heat transmission. Secondly, tiny bubbles enter the mixtures with the addition of rubber particles during the mixing process. Air in the tiny bubbles is a poor conductor of heat, which can improve the overall heat insulation capacity, thereby indirectly improving the thermal insulation performance of rubberized concrete. We know that the smaller the particle size of a substance, the larger its specific surface area, and therefore more air can be adsorbed on the surface of the substance. Therefore, the smaller the rubber particle size, the greater the amount of air brought into concrete by rubber particles during concrete mixing, which may contribute to the improvement of the thermal insulation performance of rubberized concrete.

4.3. Microstructural Analysis

4.3.1. SEM Analysis of Samples

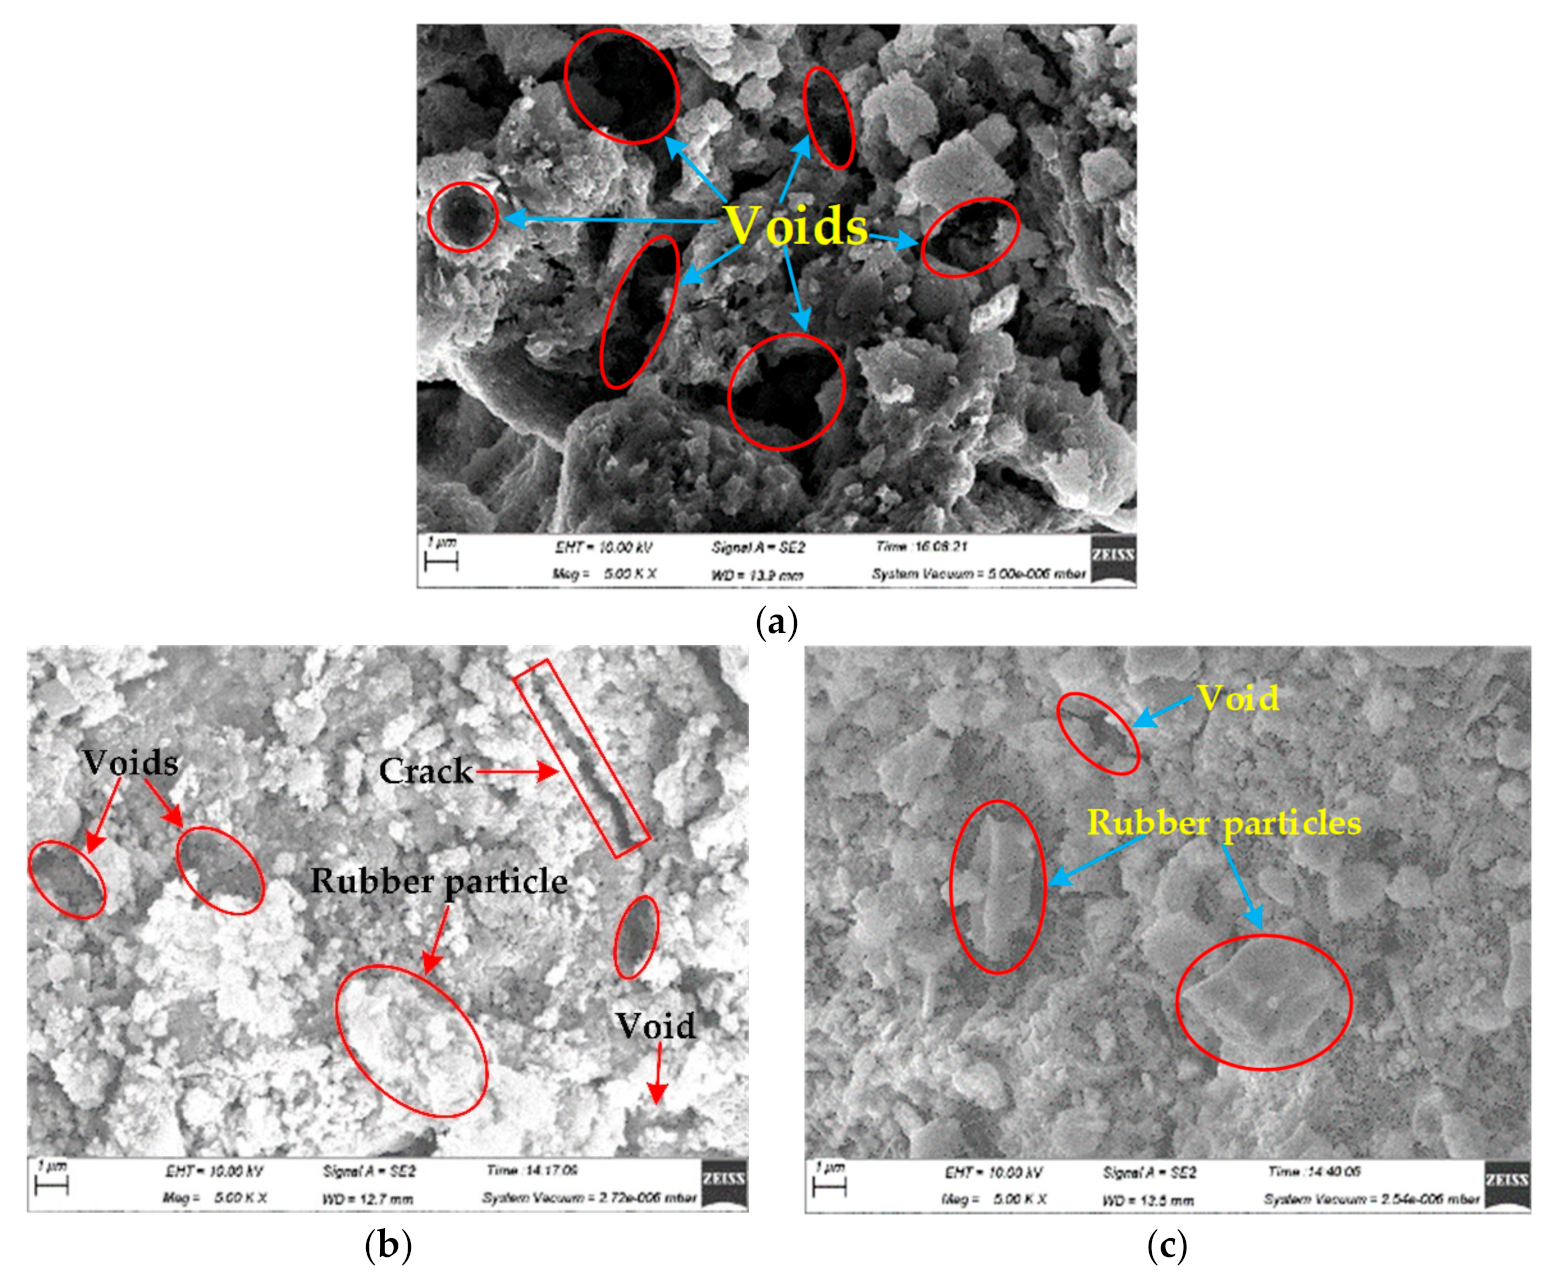
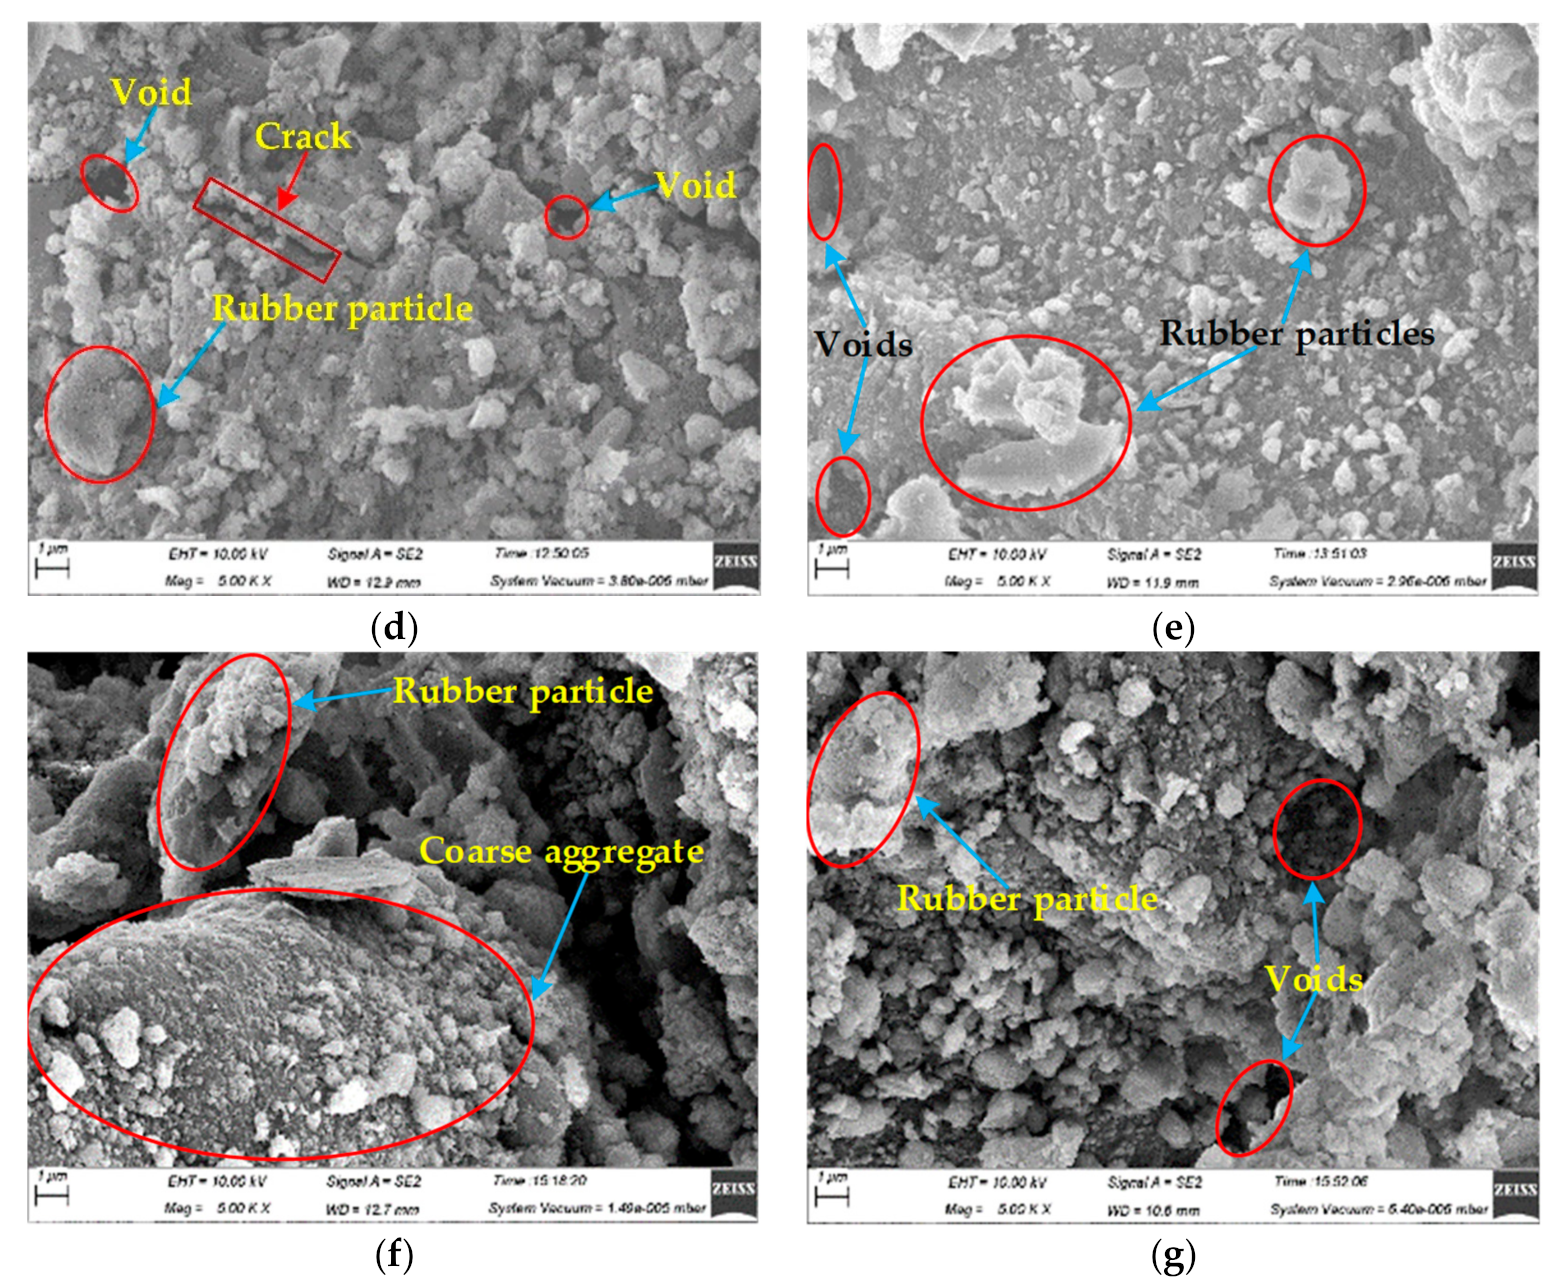
Figure 15 shows the micrographs of seven cut samples obtained by SEM. The surface of the control sample was void and uneven, but the flocculent products in the hydration process of cement made the bond between the aggregates firm (Figure 15a), which was a significant reason for its high strength. Additionally, as shown in Figure 15a, the voids were not filled with rubber particles, so the energy released could not be absorbed when the cubic specimen was destroyed under compression, which may be one of the reasons for significant brittle failure of the control specimen.
As shown in Figure 15b–e, the surface of the samples was relatively flat with a few voids and the presence of rubber particles. Additionally, the presence of rubber particles made the concrete more ductile as compared with the plain concrete, which may be one of the reasons that rubberized concrete can withstand large deformation. However, the rubber, a kind of hydrophobic material, weakened the bond between rubber particles and other aggregates (Figure 15f), resulting in a decrease in the compressive strength of the specimen. When rubber particles were large, the shape was irregular and the surface was rough, which produced good occlusion with aggregates (Figure 15c). When the rubber particles were small, the surface was smooth and the occlusion was weak, which may explain the low strength of specimens with small rubber particles. For example, Figure 15d shows a sample cut from the specimen containing rubber particles of 1~3 mm with rubber content of 10%, and its compressive strength was 19.2 MPa which decreased by 28.4% as compared with the control specimen. Moreover, when the particles were large, such as 3~5 mm, the size of the crack shown in Figure 15b was slightly larger than that presented in Figure 15d of the specimen with small particles (1~3 mm).

4.3.2. EDS Analysis of Samples

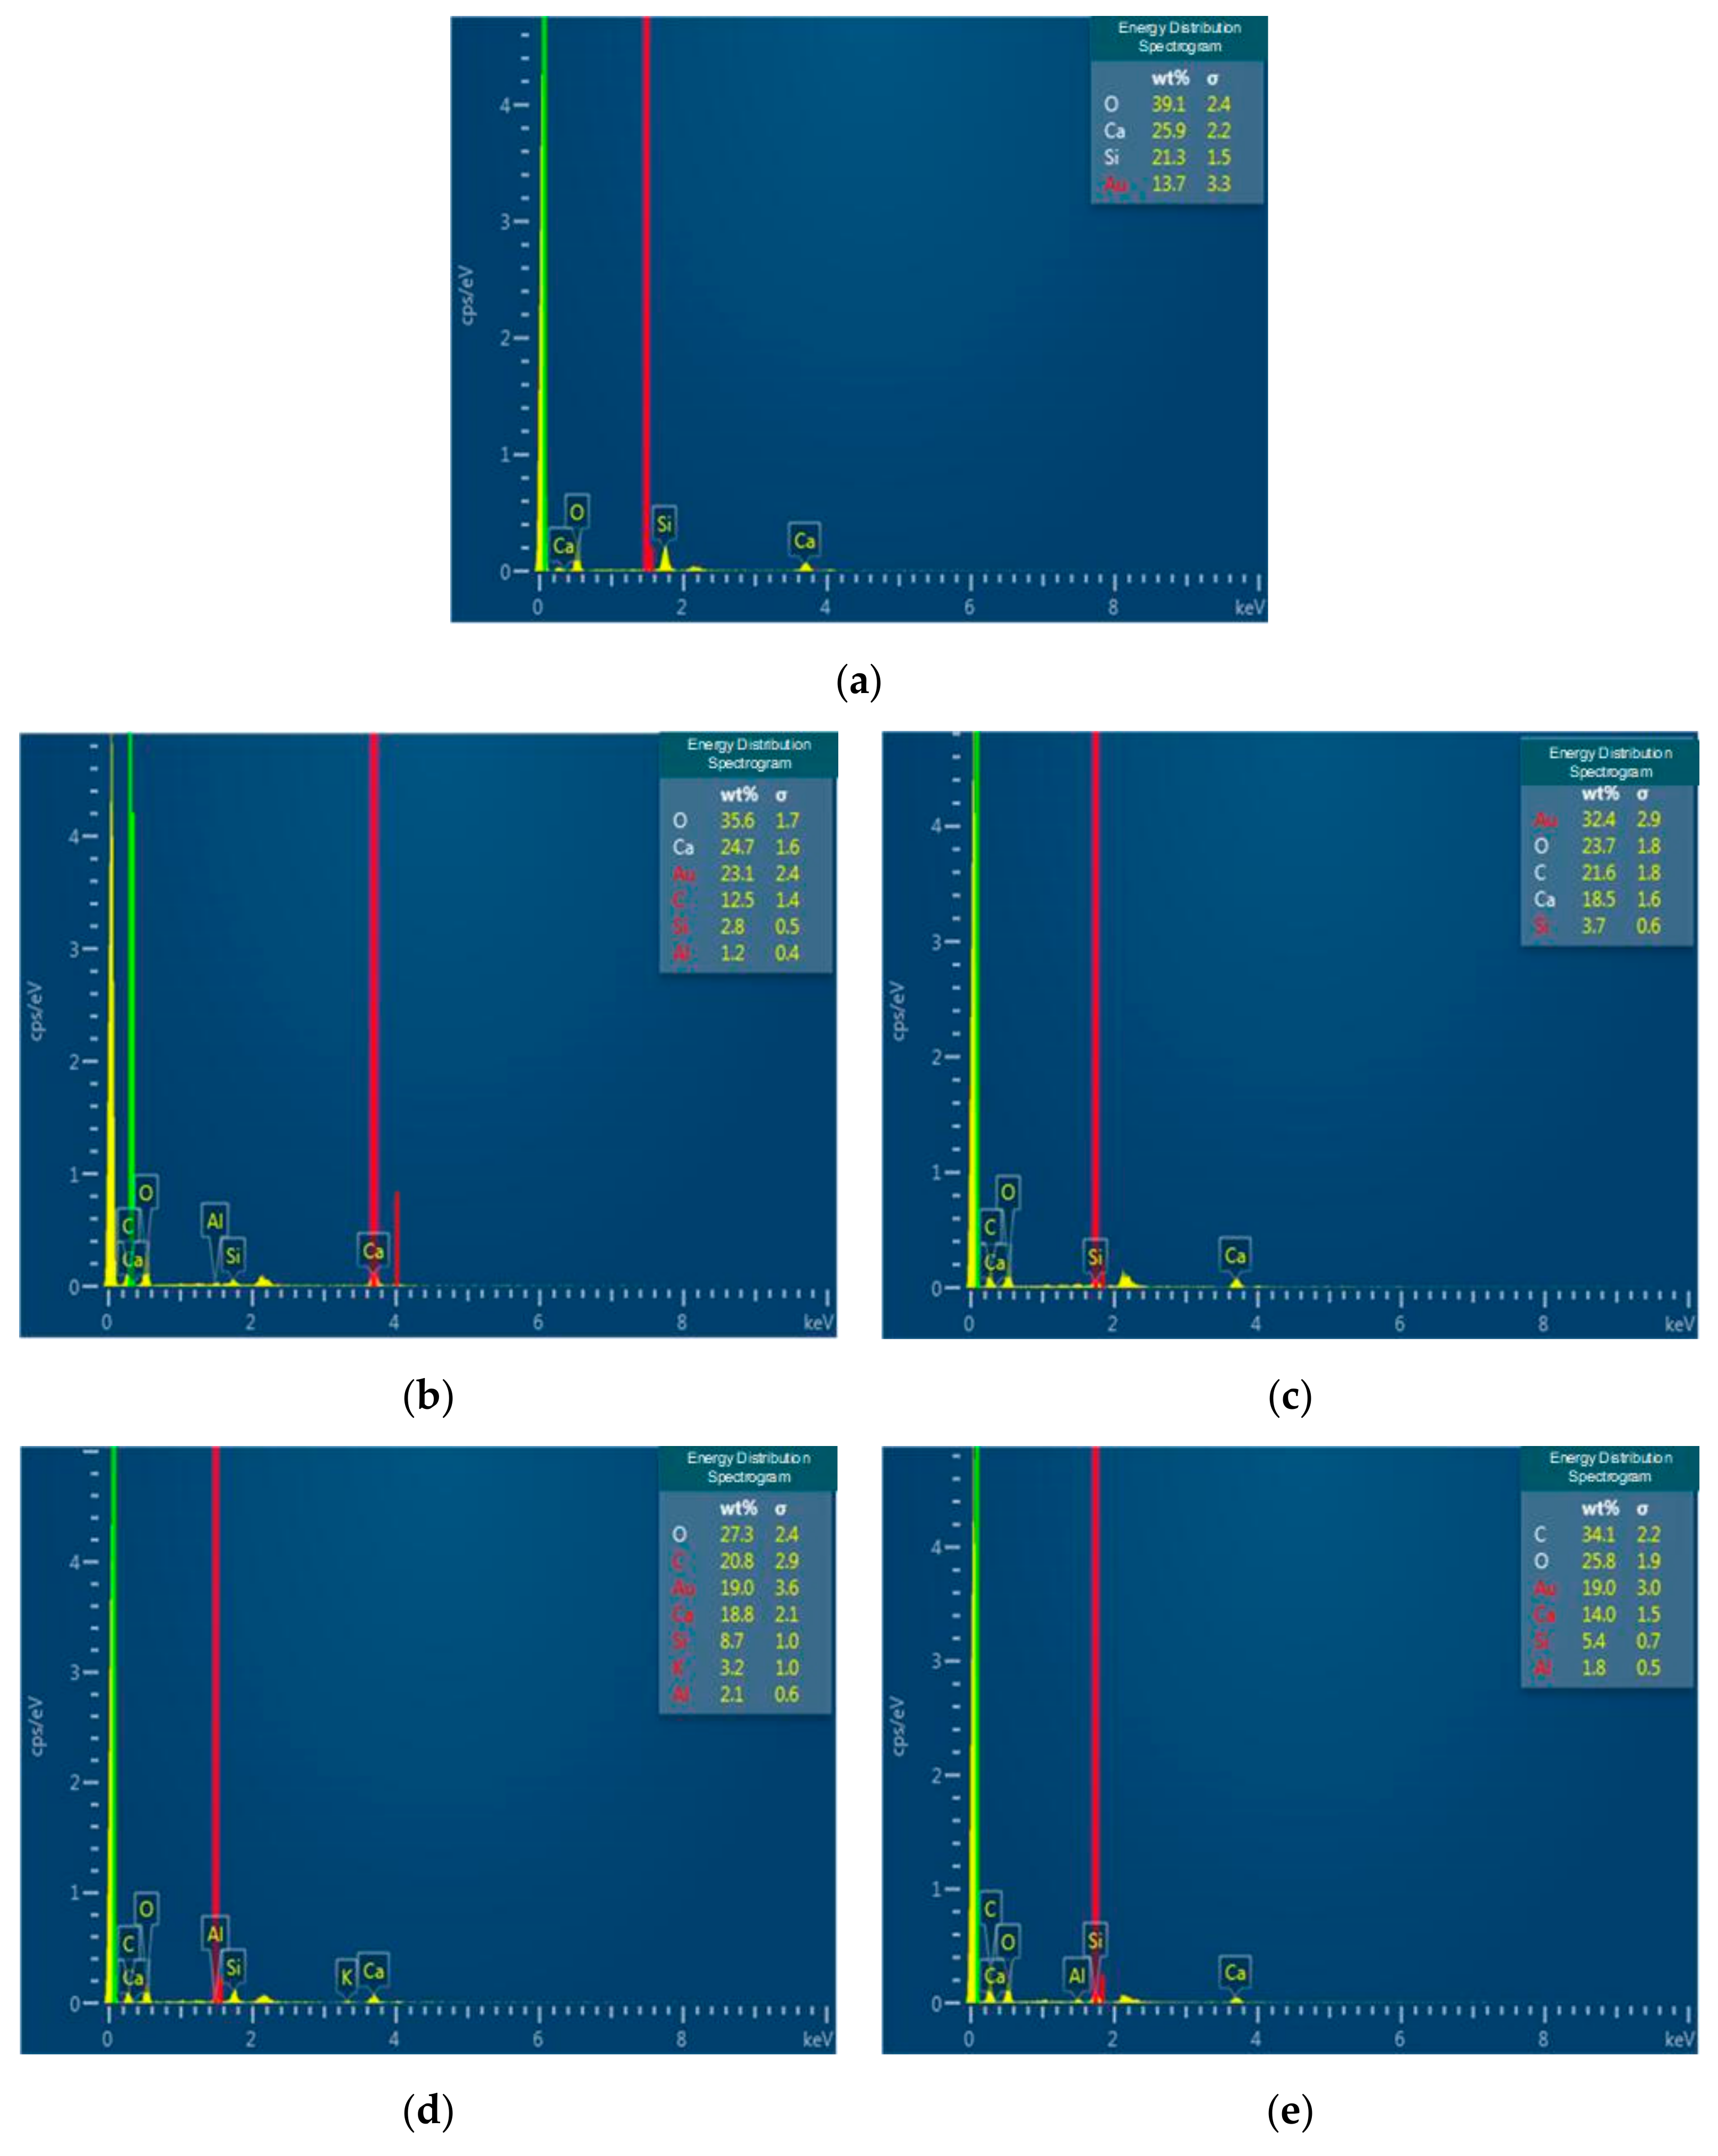
EDS was used to determine the types and contents of elements in samples by analyzing the wavelength and intensity of characteristic X-rays emitted by the samples. Figure 16 shows the energy distribution spectrograms of samples obtained by means of EDS, and each peak in Figure 16 represents an element. It should be pointed out that the carbon content in the control sample was considered as zero by the device due to its small content in the selected area.
Rubber contains many carbon elements and a small amount of aluminum, magnesium, potassium, etc. Table 7 lists the contents of major elements (excluding gold element) in each sample obtained by means of EDS. Table 7 shows that the carbon content was significantly increased after rubber was incorporated, and the greater the rubber particles, the higher the content of carbon element. For example, when the particle size was 3~5 mm, the carbon content (31.95%) of the sample with 20% rubber was increased by 96.62% as compared with the carbon content (16.25%) of the sample with 10% rubber. Keeping the rubber content unchanged, as the particle size decreased, the content of carbon element increased. For instance, when the rubber content was 10%, the carbon content (25.68%) of the sample with 1~3 mm rubber particle size was 58.03% higher than the carbon content (16.25%) of the sample with 3~5 mm rubber particle size.

5. Conclusions

Mechanical performances, thermal insulation properties, and microstructural analysis of rubberized concrete were executed under uniaxial compression tests, thermal insulation tests, and SEM. The following conclusions are made:
(1)
The compressive strength of rubberized concrete was remarkably reduced after introducing rubber particles into concrete, which was negatively correlated with rubber content and positively correlated with rubber particle size. Moreover, when rubber content was high, the effect of rubber particle size on the compressive strength was no longer significant. In addition, by increasing rubber content or decreasing rubber particle size, the peak strain corresponding to the uniaxial compressive strength gradually increased.
(2)
Rubber can affect the failure modes of cubic specimens due to rubber’s low brittleness and high toughness, inhibiting and delaying the appearance and extension of the cracks in specimens. The control specimens showed brittle failure under compression. By adding rubber particles into plain concrete, the number and size of surface cracks and penetrating cracks decreased as rubber content increased. In comparison to the rubber particles of three sizes, the failed specimens mixed with rubber particles of 3~5 mm and rubber content of 30% had the best morphological integrity. Considering that rubberized concrete has high crack resistance and low compressive strength, it can be applied to construction projects requiring crack resistance and lower strength such as base paving.
(3)
Increasing the rubber content or reducing the rubber particle size contributed to an increase in the thermal insulation performance of the specimens. Additionally, the rubber particle size was positively correlated with heat flux, and negatively correlated with heat resistivity, while the rubber content was the opposite. In particular, when the rubber content was less than 30%, the thermal insulation performance of the specimens increased at a high rate as the rubber content increased. Conversely, the increasing rate was gradually slowed down. Thus, when rubber particles of 40 mesh and 50% content were mixed into concrete, the best thermal insulation was obtained. Due to its good thermal insulation, rubberized concrete can be used to produce thermal insulation materials for buildings.
(4)
The SEM analysis revealed that rubberized concrete specimens contained many voids, and rubber, as a hydrophobic material, weakened the bond between rubber particles and other aggregates, which can explain the reduction of compressive strength of rubber modified specimens. Under SEM, only a few tiny cracks were found in the rubber modified samples. Moreover, EDS analysis showed that the addition of rubber changed the species and content of elements in concrete which can indirectly reflect the mixing amount of rubber.
In order to make better use of waste rubber tires, our future work will investigate the effects of other factors such as high temperature treatment of rubberized concrete and the modification of rubber particles on the mechanical properties of rubberized concrete, attempting to prepare rubberized concrete with better performances.

Author Contributions

Conceptualization, J.G. and S.H.; methodology, J.G. and S.H.; validation, J.G.; investigation, J.G. and S.H.; data curation, M.H. and S.W.; writing—original draft preparation, J.G., S.H., and M.H.; writing—review and editing, J.G. and S.H.; supervision, J.G. and S.H.; funding acquisition, J.G.

Funding

This research was funded by the Provincial Key Technological R& D Program of Henan of China (Grant No. 152102210318) and the National Natural Science Foundation of China (Grant No. 51778215).

Acknowledgments

The authors greatly appreciate the financial supports from funding bodies, and would be grateful to the reviewers for their valuable comments and suggestions to improve the quality of the paper.

Conflicts of Interest

The authors declare no conflict of interest.

References

  1. Girskas, G.; Nagrockienė, D. Crushed rubber waste impact of concrete basic properties. Constr. Build. Mater. 2017, 140, 36–42. [Google Scholar] [CrossRef]
  2. Bideci, A.; Öztürk, H.; Bideci, Ö.S.; Emiroğlu, M. Fracture energy and mechanical characteristics of self-compacting concretes including waste bladder tyre. Constr. Build. Mater. 2017, 149, 669–678. [Google Scholar] [CrossRef]
  3. Gesoğlu, M.; Güneyisi, E.; Khoshnaw, G.; İpek, S. Investigating properties of pervious concretes containing waste tire rubbers. Constr. Build. Mater. 2014, 63, 206–213. [Google Scholar] [CrossRef]
  4. Pacheco-Torgal, F.; Ding, Y.; Jalali, S. Properties and durability of concrete containing polymeric wastes (tyre rubber and polyethylene terephthalate bottles): An overview. Constr. Build. Mater. 2012, 30, 714–724. [Google Scholar] [CrossRef] [Green Version]
  5. Sofi, A. Effect of waste tyre rubber on mechanical and durability properties of concrete – A review. Ain Shams Eng. J. 2018, 9, 2691–2700. [Google Scholar] [CrossRef]
  6. Shu, X.; Huang, B. Recycling of waste tire rubber in asphalt and portland cement concrete: An overview. Constr. Build. Mater. 2014, 67, 217–224. [Google Scholar] [CrossRef]
  7. Cao, W. Study on properties of recycled tire rubber modified asphalt mixtures using dry process. Constr. Build. Mater. 2007, 21, 1011–1015. [Google Scholar] [CrossRef]
  8. Li, D.; Zhuge, Y.; Gravina, R.; Mills, J.E. Compressive stress strain behavior of crumb rubber concrete (CRC) and application in reinforced CRC slab. Constr. Build. Mater. 2018, 166, 745–759. [Google Scholar] [CrossRef]
  9. Gandoman, M.; Kokabi, M. Sound barrier properties of sustainable waste rubber/geopolymer concretes. Iran. Polym. J. 2015, 24, 105–112. [Google Scholar] [CrossRef]
  10. Ataei, H. Experimental study of rubber tire aggregates effect on compressive and dynamic load-bearing properties of cylindrical concrete specimens. J. Mater. Cycles Waste Manag. 2016, 18, 665–676. [Google Scholar] [CrossRef]
  11. Gesoglu, M.; Güneyisi, E.; Hansu, O.; İpek, S.; Asaad, D.S. Influence of waste rubber utilization on the fracture and steel–concrete bond strength properties of concrete. Constr. Build. Mater. 2015, 101, 1113–1121. [Google Scholar] [CrossRef]
  12. Kang, J.; Jiang, Y. Improvement of Cracking-resistance and Flexural Behavior of Cement-based Materials by Addition of Rubber Particles. J. Wuhan Univ. Technol. Mater. Sci. Ed. 2008, 23, 579–583. [Google Scholar] [CrossRef]
  13. Bompa, D.V.; Elghazouli, A.Y.; Xu, B.; Stafford, P.J.; Ruiz-Teran, A.M. Experimental assessment and constitutive modelling of rubberised concrete materials. Constr. Build. Mater. 2017, 137, 246–260. [Google Scholar] [CrossRef] [Green Version]
  14. Strukar, K.; Kalman-Šipoš, T.; Dokšanović, T.; Rodrigues, H. Experimental Study of Rubberized Concrete Stress-Strain Behavior for Improving Constitutive Models. Materials 2018, 11, 2245. [Google Scholar] [CrossRef] [PubMed]
  15. Miller, N.M.; Tehrani, F.M. Mechanical properties of rubberized lightweight aggregate concrete. Constr. Build. Mater. 2017, 147, 264–271. [Google Scholar] [CrossRef]
  16. Aslani, F. Mechanical Properties of Waste Tire Rubber Concrete. J. Mater. Civil Eng. 2016, 28. [Google Scholar] [CrossRef]
  17. Thomas, B.S.; Chandra Gupta, R. Properties of high strength concrete containing scrap tire rubber. J. Clean. Prod. 2016, 113, 86–92. [Google Scholar] [CrossRef]
  18. Gerges, N.N.; Issa, C.A.; Fawaz, S.A. Rubber concrete: Mechanical and dynamical properties. Case Stud. Constr. Mater. 2018, 9, e00184. [Google Scholar] [CrossRef]
  19. Liu, H.; Wang, X.; Jiao, Y.; Sha, T. Experimental Investigation of the Mechanical and Durability Properties of Crumb Rubber Concrete. Materials 2016, 9, 172. [Google Scholar] [CrossRef]
  20. Si, R.; Wang, J.; Guo, S.; Dai, Q.; Han, S. Evaluation of laboratory performance of self-consolidating concrete with recycled tire rubber. J. Clean. Prod. 2018, 180, 823–831. [Google Scholar] [CrossRef]
  21. Hassanli, R.; Youssf, O.; Mills, J.E. Experimental investigations of reinforced rubberized concrete structural members. J. Build. Eng. 2017, 10, 149–165. [Google Scholar] [CrossRef]
  22. Jingfu, K.; Chuncui, H.; Zhenli, Z. Strength and shrinkage behaviors of roller-compacted concrete with rubber additives. Mater. Struct. 2009, 42, 1117–1124. [Google Scholar] [CrossRef]
  23. Zheng, L.; Huo, X.S.; Yuan, Y. Strength, Modulus of Elasticity, and Brittleness Index of Rubberized Concrete. J. Mater. Civil Eng. 2008, 20, 692–699. [Google Scholar] [CrossRef]
  24. Sukontasukkul, P. Use of crumb rubber to improve thermal and sound properties of pre-cast concrete panel. Constr. Build. Mater. 2009, 23, 1084–1092. [Google Scholar] [CrossRef]
  25. Gupta, T.; Chaudhary, S.; Sharma, R.K. Assessment of mechanical and durability properties of concrete containing waste rubber tire as fine aggregate. Constr. Build. Mater. 2014, 73, 562–574. [Google Scholar] [CrossRef]
  26. Yang, R.; Li, K.; Zhu, J.; Zhu, T.; Dong, Z.; Wu, D. Effect of rubber particles on cement stabilized gravel system. J. Wuhan Univ. Technol. Mater. Sci. Ed. 2014, 29, 990–995. [Google Scholar] [CrossRef]
  27. Rivas-Vázquez, L.P.; Suárez-Orduña, R.; Hernández-Torres, J.; Aquino-Bolaños, E. Effect of the surface treatment of recycled rubber on the mechanical strength of composite concrete/rubber. Mater. Struct. 2015, 48, 2809–2814. [Google Scholar] [CrossRef]
  28. Pham, N.P.; Toumi, A.; Turatsinze, A. Rubber aggregate-cement matrix bond enhancement: Microstructural analysis, effect on transfer properties and on mechanical behaviours of the composite. Cem. Concr. Compos. 2018, 94, 1–12. [Google Scholar] [CrossRef]
  29. Wei, H.; Wang, Y.; Luo, J. Influence of magnetic water on early-age shrinkage cracking of concrete. Constr. Build. Mater. 2017, 147, 91–100. [Google Scholar] [CrossRef]
  30. Luhar, S.; Chaudhary, S.; Luhar, I. Thermal resistance of fly ash based rubberized geopolymer concrete. J. Build. Eng. 2018, 19, 420–428. [Google Scholar] [CrossRef]
Figure 1. Particle size distribution of aggregate and rubber particles.
Applsci 09 02943 g001
Figure 2. A photographic view of rubber particles (a) 3~5 mm, (b) 1~3 mm, and (c) 40 mesh.
Applsci 09 02943 g002
Figure 3. Preparation process of concrete cubic specimens: (a) Concrete mixing, (b) concrete pouring, (c) vibration compaction of concrete cubic specimens on vibration table, (d) demolding after 24 h, (e) maintenance of concrete cubic specimens, and (f) partial concrete cubic specimens after 28 days of maintenance.
Applsci 09 02943 g003
Figure 4. Preparation process of specimens: (a) Embedding the thermocouples, (b) attaching numbered labels, (c) a prepared specimen.
Applsci 09 02943 g004
Figure 5. The simplified flow-process diagram for sample preparation.
Applsci 09 02943 g005
Figure 6. Test equipment: (a) WES-1000B electro-hydraulic servo universal testing machine and (b) a specimen under compression.
Applsci 09 02943 g006
Figure 7. Thermal insulation test of rubberized concrete: (a) Heating the specimens, (b) XMD-100 temperature traveling detector, and (c) the electric furnace.
Applsci 09 02943 g007
Figure 8. Stress-strain curves of cubic specimens: (a) Control group, (b) particle size 3~5 mm, (c) particle size 1~3 mm, and (d) particle size 40 mesh.
Applsci 09 02943 g008
Figure 9. Effects of rubber content and rubber particle size on compressive strength. (a) Effect of rubber content on compressive strength and (b) effect of rubber particle size on compressive strength.
Applsci 09 02943 g009
Figure 10. Failure types of specimens under compression: (a) C-J, (b) Ca-10, (c) Ca-20, (d) Ca-30, (e) Cb-10, (f) Cb-20, (g) Cb-30, (h) Cc-10, (i) Cc-20, and (j) Cc-30.
Applsci 09 02943 g010
Figure 11. Temperature variation of the thermocouples in each specimen: (a) Specimen no-temperature curve (rubber particle size 3~5 mm), (b) thermocouple no-temperature curve (rubber particle size 3~5 mm), (c) specimen no-temperature curve (rubber particle size 1~3 mm), (d) thermocouple no-temperature curve (rubber particle size 1~3 mm), (e) specimen no-temperature curve (rubber particle size 40 mesh), and (f) thermocouple no-temperature curve (rubber particle size 40 mesh).
Applsci 09 02943 g011aApplsci 09 02943 g011b
Figure 12. Thermocouple no-temperature curve of each specimen: (a) Rubber content, 15%; (b) rubber content, 30%; (c) rubber content, 40%; and (d) rubber content, 50%.
Applsci 09 02943 g012
Figure 13. Thermal conductivity of each specimen.
Applsci 09 02943 g013
Figure 14. Variation of heat flux and heat resistivity of each specimen: (a) Variation of heat flux each specimen and (b) variation of heat resistivity of each specimen.
Applsci 09 02943 g014
Figure 15. Micrographs of samples obtained by SEM: (a) Rubber content 0% (control group), (b) rubber content 10% (rubber particle size 3~5 mm), (c) rubber content 30% (rubber particle size 3~5 mm), (d) rubber content 10% (rubber particle size 1~3 mm), (e) rubber content 30% (rubber particle size 1~3 mm), (f) rubber content 10% (rubber particle size 40 mesh), and (g) rubber content 30% (rubber particle size 40 mesh).
Applsci 09 02943 g015aApplsci 09 02943 g015b
Figure 16. Energy distribution spectrograms of samples: (a) Rubber content 0% (control group), (b) rubber content 10% (rubber particle size 3~5 mm), (c) rubber content 20% (rubber particle size 3~5 mm), (d) rubber content 10% (rubber particle size 1~3 mm), and (e) rubber content 20% (rubber particle size 1~3 mm).
Applsci 09 02943 g016
Table 1. Physical and mechanical properties of Portland cement.
Initial Setting TimeFinal Setting TimeStability of CementCompressive Strength (MPa)Bending Strength (MPa)
3 Days28 Days3 Days28 Days
150 min200 minQualified26.547.84.67.5
Table 2. The quality test of potable water.
Test Item Test ResultRegulatory Standard (GB 5749-2006)
Total dissolved solids (mg/L)411<1000
Chlorine (mg/L)98250
Fe (mg/L)0.022<0.3
Al (mg/L)0.0029<0.2
Mn (mg/L)0.0034<0.1
pH value7.406.5~8.5
Table 3. Mix identifications and ratios of cubic specimens.
Mix IDWater (g)Cement (g)Aggregate(g)Rubber ParticleHRWR (g)
FineCoarseSizeRatio (%)Weight (g)
C-J760144026804480-0010.08
Ca-107601440241244803~5 mm1026810.08
Ca-207601440214444803~5 mm2053610.08
Ca-307601440187644803~5 mm3080410.08
Cb-107601440241244801~3 mm1026810.08
Cb-207601440214444801~3 mm2053610.08
Cb-307601440187644801~3 mm3080410.08
Cc-1076014402412448040 mesh1026810.08
Cc-2076014402144448040 mesh2053610.08
Cc-3076014401876448040 mesh3080410.08
Table 4. Grouping of the cubic specimens for compression test.
GroupRubber Particle Size and ContentNumber of SpecimensNumber of Compression Tests
Reference33
Experimental group #13~5 mm, 10%33
3~5 mm, 20%33
3~5 mm, 30%33
Experimental group #21~3 mm, 10%33
1~3 mm, 20%33
1~3 mm, 30%33
Experimental group #340 mesh, 10%33
40 mesh, 20%33
40 mesh, 30%33
Table 5. Grouping of the cylindrical specimens for the thermal insulation test.
GroupRubber Particle Size and ContentNumber of SpecimensNumber of Thermal Insulation Tests
Reference11
Experimental group #13~5 mm, 15%11
3~5 mm, 30%11
3~5 mm, 40%11
3~5 mm, 50%11
Experimental group #21~3 mm, 15%11
1~3 mm, 30%11
1~3 mm, 40%11
1~3 mm, 50%11
Experimental group #340 mesh, 15%11
40 mesh, 30%11
40 mesh, 40%11
40 mesh, 50%11
Table 6. Elastic modulus of each concrete mixture.
Mix IDC-JCa-10Ca-20Ca-30Cb-10Cb-20Cb-30Cc-10Cc-20Cc-30
Elastic modulus (MPa)99065910231875718339873841729898275
Table 7. Content of major elements in the samples.
Rubber Particle SizeSpecimen NoRubber Content (%)Element (%)
COCaSiAlMgK
ControlC-J0045.3130.0124.68000
3~5 mmCa-101016.2546.2932.123.641.7000
Ca-202031.9535.0627.375.62000
1~3 mmCb-101025.6833.7023.2110.742.5903.95
Cb-202042.1031.8517.286.672.1000