Abstract
As a Kansei engineering design expert system, the product form design multi-objective evolutionary algorithm model (PFDMOEAM) contains various methods. Among them, the multi-objective evolutionary algorithm (MOEA) is the key to determine the performance of the model. Due to the deficiency of MOEA, the traditional PFDMOEAM has limited innovation and application value for designers. In this paper, we propose a novel PFDMOEAM with an improved strength Pareto evolutionary algorithm 2 (ISPEA2) as the core and combining the elliptic Fourier analysis (EFA) and the entropy weight and technique for order preference by similarity to ideal solution (entropy-TOPSIS) methods. Based on the improvement of the original operators in SPEA2 and the introduction of a new operator, ISPEA2 outperforms SPEA2 in convergence and diversity simultaneously. The proposed model takes full advantage of this superiority, and further combines the EFA method’s high accuracy and degree of multi-method integration, as well as the entropy-TOPSIS method’s good objectivity and operability, so it has excellent comprehensive performance and innovative application value. The feasibility and effectiveness of the model are verified by a case study of a car form design. The simulation system of the model is developed, and the simulation results demonstrate that the model can provide a universal and effective tool for designers to carry out multi-objective evolutionary design of product form.
1. Introduction
Rich and homogenous products mean manufacturers face increasingly serious competition. How to better meet consumers’ increasingly diverse affective needs through product forms is the key to product design and the inevitable requirement for manufacturers to win this competition [1,2]. Kansei engineering or Kansei ergonomics has demonstrated an extremely strong relationship between customers’ affective needs and product physical properties such as function and form [3]. As a Kansei engineering design expert system which can automatically generate product form according to consumers’ diverse affective responses, the product form design multi-objective evolutionary algorithm model (PFDMOEAM) has increasingly significant value. A complete PFDMOEAM usually includes three modules: design analysis (DA), multi-objective optimization (MOO) and optimal solution selection (OSS). Each module contains a main method, i.e., product form and image analysis (PFIA) method, a multi-objective evolutionary algorithm (MOEA) and multi-attribute decision-making (MADM) method. Among all the methods, MOEA in the MOO module is the key to determine the comprehensive performance of the model, which mainly includes innovation, accuracy and operability. To improve the performance of PFDMOEAM, the traditional studies have tested different existing MOEAs, and can be divided into two kinds according to the MOEAs adopted. The first kind is to apply aggregation on the objectives to transform multiple objectives into a single objective rather than directly using MOEA in the MOO module [4]. Hsiao and Tsai [5] integrated the multiple objectives into a single value by using the linear weighting method, and then adopted a genetic algorithm (GA) to get the optimal product form based on the prediction model constructed by a fuzzy neural network (FNN). Guo et al. [6] also integrated multiple objectives into a single objective by using the linear weighting method, and obtained the optimal design by employing GA on the basis of the prediction model established by using a back propagation neural network (BPNN). This kind of study is simple and easy to implement, but because it limits the search space and excludes the consideration of all possible solutions, it has limited practical value for designers and consumers [7]. The second kind of study is to use MOEA directly in the MOO module. Although the application is more complicated, it has become a mainstream trend because it can better meet the performance requirements of PFDMOEAM. Yang [8] proposed a PFDMOEAM with a non-dominated sorting genetic algorithm II (NSGA-II) as MOEA in the MOO module, and used support vector regression (SVR) to provide multi-objective fitness functions required by NSGA-II. Su et al. [9] also constructed a PFDMOEAM with NSGA-II as MOEA. The difference is that fuzzy neural network (FNN) is used to provide fitness functions for NSGA II. Shieh et al. [10] also adopted NSGA-II as MOEA and combined with quantification theory type I as the prediction model, based on which a PFDMOEAM was established. As a widely used second-generation classical MOEA, NSGA-II has less time complexity and better convergence. However, because the diversity it provides is not the best compared with other MOEAs [11], this algorithm is not an ideal MOEA for PFDMOEAM with innovation as its key performance. In addition to the algorithm, as a renowned second generation classical MOEA, strength Pareto evolutionary algorithm 2 (SPEA2) has been used in PFDMOEAM recently. Li et al. [12] proposed a PFDMOEAM using SPEA2 as the MOEA in the MOO module. Shieh et al. [7] completed the comparative study of MOEAs which are most suitable for PFDMOEAM. The study systematically compared the performance of three classical MOEAs represented by SPEA2, NSGA II, and another MOEA, and proved that SPEA2, which provides designers with the most diverse product forms, is the best MOEA for PFDMOEAM. This conclusion provides a reference for the selection of MOEA of the model proposed in this paper. However, the convergence of SPEA2 is insufficient [7], and due to the fixed evolutionary mechanism, SPEA2 cannot make full use of the search space and is easy to fall into a local optimum [13]. To fully exploit SPEA2′s diversity and avoid its deficiencies, this paper proposes a novel improved SPEA2 (ISPEA2) algorithm and uses it as the MOEA in the MOO module of PFDMOEAM.
In addition to MOEA, the PFIA method in the DA module is also crucial to the model’s performance. However, the traditional PFIA methods have obvious limitations and deficiencies in the refinement of product morphological features and the comprehensive recognition of key perceptual images [14]. As such, we proposed an elliptical Fourier analysis (EFA) method that can improve the traditional PFIA methods effectively, and proved its feasibility and effectiveness [14]. In the research process of this paper, we further discover a new idea and way to improve MOEA by using EFA method, which helps to establish the relationship between different methods in DA and MOO modules, and promotes the model to form an organic whole. Therefore, EFA is adopted as the PFIA method in this paper.
As the last significant method in the complete PFDMOEAM, the MADM method in the OSS module provides guidance for model performance optimization. To the best of the authors’ knowledge, there are very few studies using the MADM method to construct a complete PFDMOEAM. Only Shieh et al. [10] and Li et al. [12] used the fuzzy analytic hierarchy process (AHP) method and fuzzy integration method to accomplish this task, respectively. However, the accuracy and operability of PFDMOEAMs established in the two studies are not high due to the poor objectivity and insufficient convenience of the MADM methods mentioned above. Compared with fuzzy AHP, fuzzy integral and other subjective evaluation methods, the entropy weight and technique for order preference by similarity to ideal solution (entropy-TOPSIS) method is more objective and accurate, because its multi-objective evaluation in the OSS module comes entirely from the mining of the inherent laws of historical data, without involving subjective reasoning [15]. In addition, it is simple in principle, operable and can evaluate multiple objectives [16]. These characteristics are well in line with the objective of OSS module. Therefore, this paper employs entropy-TOPSIS as the MADM method in the OSS module.
The main contributions of this paper are summarized as follows:
(1) To eliminate the major performance obstacle of PFDMOEAM, a novel ISPEA2 algorithm is first proposed based on the SPEA2 algorithm selected from renowned second-generation classical MOEAs. By improving the original operators in SPEA2 and introducing a new operator, ISPEA2 has better convergence and diversity than SPEA2, which lays a solid foundation for improving the performance of PFDMOEAM.
(2) Taking the ISPEA2 algorithm as the core and combining the EFA and entropy-TOPSIS method, we construct a novel PFDMOEAM. The model makes full use of ISPEA2′s algorithm advantages, and further combines the EFA method’s high accuracy and degree of multi-method integration, as well as the entropy-TOPSIS method’s good objectivity and operability, so it has excellent comprehensive performance in the multi-objective evolutionary design of product form.
(3) We applied the proposed PFDMOEAM to the car form design problem to demonstrate the innovation and application value of the model. The result proves that it can be used as an effective Kansei engineering design expert system and provides a useful tool for designers.
2. Methods
2.1. Research Framework
The overall framework of the proposed PFDMOEAM is presented in Figure 1, which consists of three modules, namely DA, MOO and OSS. The DA module is the first module of PFDMOEAM, which provides quantitative analysis data for the MOO module. The initial data contains two parts, product form data and product image data, which need to be obtained by using two sub-methods of the PFIA method, namely product form representation (PFR) and key image recognition (KIR). The PFR method primarily affects the innovation of the model by the accuracy and freedom of morphological representation, and the KIR method mainly affects the precision of the model through the accuracy and comprehensiveness of image recognition. Given the importance of data quality to the model, the PFIA method is often the basis and prerequisite for ensuring a good comprehensive performance of PFDMOEAM. Firstly, in the DA module of this paper, EFA is adopted as the PFIA method to get the principal component (PC) scores, and combined with image analysis, the image evaluation mean score (IEMS) of the target adjectives is obtained. Secondly, in the MOO module, the genetic algorithm and back propagation neural network (GABP) is first used to establish the non-linear mapping relationship between PC scores and IEMSs, namely multi-objective prediction model (MOPM), which is further used as the fitness function of ISPEA2. Then the Pareto solutions are derived through ISPEA2 improved by the improved crossover operator (ICO), the improved adaptive mutation operator (IAMO) and the modification operator (MO). In ISPEA2, ICO and IAMO are used to adjust the search space dynamically, and the newly introduced MO ensures the algorithm converges to global optimum efficiently. Through these operators, ISPEA2 successfully makes up for the defects of SPEA2 and retains its superiority of diversity. Finally, in the OSS module, the MADM method mainly completes accurate multi-objective evaluation of Pareto design solutions generated in the MOO module. The evaluation results can help designers to observe the actual effect of the model in time and determine the optimized direction of parameters in main methods. Due to its characteristics comply with the objectives of OSS module, entropy-TOPSIS is adopted as the MADM method to get the optimal solution.
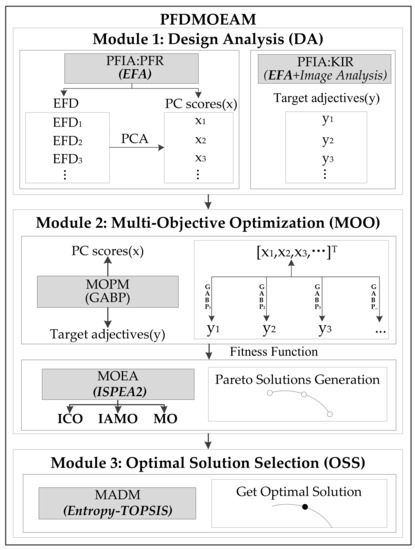
Figure 1.
Framework of the proposed product form design multi-objective evolutionary algorithm model (PFDMOEAM).
2.2. Elliptic Fourier Analysis (EFA)
EFA [17] is a technique for converting point coordinate data into Fourier harmonic coefficients to quantify the profile of an object and has been widely used in many fields [18,19,20,21]. Taking into account all the information of the profile, EFA is better than other traditional morphometric approaches [22]. Its implementation flow is given below (Figure 2).

Figure 2.
Implementation flow of elliptic Fourier analysis (EFA).
2.2.1. Calculation of Elliptic Fourier Descriptor (EFD)
After picture preprocessing, we get the closed product profile curve, which can be regarded as the motion trajectory of the moving point and expressed as two following functions of the arc length () from a point to the starting point on the profile curve [23]:
where and are continuous piecewise linear functions; and are the abscissa and ordinate of the profile center point, respectively; is the number of ellipse Fourier harmonics; is the maximum number of ellipse Fourier harmonics; is the arc length parameter; is the profile perimeter; , , and represent the elliptic Fourier coefficients of the th harmonic and can be defined as follows [17]:
where is the total number of sampling points of the profile; and are the displacements from the point to the point along the X-axis and Y-axis directions, respectively, then:
Thus, product profile can be described by an elliptic Fourier coefficient matrix containing harmonics, which is given as
is the EFD that approximates the profile curve by controlling the harmonic number . When takes different values, the fitting effect of profile curve will be different. In general, a few low-frequency harmonics maintain the global features of profile curve, and high-frequency harmonics affect its finer features.
2.2.2. Normalization of EFDs
Because the position, direction and scale of different product profiles are different after picture preprocessing, their EFDs are inconsistent and needs to be normalized to get the normalized elliptic Fourier descriptor (NEFD) [23]. Let the normalized coefficients of th harmonic are , , and , then:
(1) Since the DC component of EFD only reflects the position of the profile, it is not useful in describing the form. Let the DC component . The center of the first ellipse of the profile can be moved to the coordinate origin to achieve the normalization of the position.
(2) Transform the elliptic Fourier coefficients according to the following equations to achieve the normalization of direction:
where is the angle between the starting point of the profile and the main axis of the ellipse; is the sequence of rotated ellipse; , , and are the four coefficients of the first ellipse.
(3) Calculate the size of the first ellipse and divide each descriptor by to achieve the normalization of scale:
2.2.3. Principal Component Analysis (PCA)
Principal component analysis (PCA) is an indirect ordination technique for obtaining a low dimensional representation of multivariate data [24]. We can get the PC scores of all product profiles by PCA. Using the PC scores as ordinary quantitative characters, the form can be quantitatively analyzed [17]. PC scores constitute crucial data for supporting product profile reconstruction, image analysis and multi-objective evolutionary calculation.
2.3. Image Analysis
As a quantitative analysis technique to study the affective needs of customers, the analysis of Kansei vocabularies is generally used to recognize the key image words influencing consumers’ perception of product form [25,26]. This paper adopts this technique to recognize key image words. The steps are as follows:
Step 1: Collect image words, that is, adjectives, and organize the subjects to conduct an informal survey to pick out appropriate adjectives.
Step 2: Invite experts to set up a focus team and use Delphi method to select the most representative adjectives.
Step 3: Combine the representative adjectives with the product samples to design a questionnaire. Conduct questionnaire survey to assess the experts’ perception of the product image using the semantic differential scale and 7-point Likert scale which are two commonly used scales to quantify human perceptual interpretations [27]. All experts’ evaluation scores for each product sample are averaged to achieve the IEMSs matrix.
Step 4: After concatenating the IEMSs matrix and the PC scores matrix to create a correlation analysis matrix, correlation analysis is performed on the matrix to obtain correlation coefficients. The correlation coefficient is then brought into the image objective comprehensive scoring model (IOCSM) to calculate the final image objective comprehensive score (FIOCS). For more detailed information about the IOCSM, please see Wang et al. [14].
Step 5: Determine the target adjectives and their rankings according to the FIOCS obtained in Step 4.
2.4. Genetic Algorithm and Back Propagation (GABP)
In the MOPM of MOO module, the PC scores and IEMSs, which are input and output variables, respectively, are continuous data. Wang et al. [28] demonstrated that the prediction and fitting ability of neural network model for continuous data is more stable and stronger than the multiple linear regression model used in current authors’ previous research [14], and the combination of GABP can further better predict the nonlinear mapping relationship between input and output variables [6,29,30]. Consequently, this paper uses GABP as the prediction technique in MOPM to achieve the high-precision prediction requirements of MOEA. For detailed implementation procedures of the technique, please see, for example, Huang et al. [30].
2.5. Improved Strength Pareto Evolutionary Algorithm 2 (ISPEA2)
The classical SPEA2 algorithm uses the nearest-neighbor density estimation technique that preserve the diversity of non-inferior solutions, the hybrid selection technique that maintains the evolutionary direction, and the environmental selection technique that retains the Pareto solutions [31]. The proposed ISPEA2 keeps these characteristics of SPEA2, and obtains better convergence and diversity by the ICO, IAMO and MO. Its implementation flow is demonstrated in Figure 3, which consists of seven main steps:
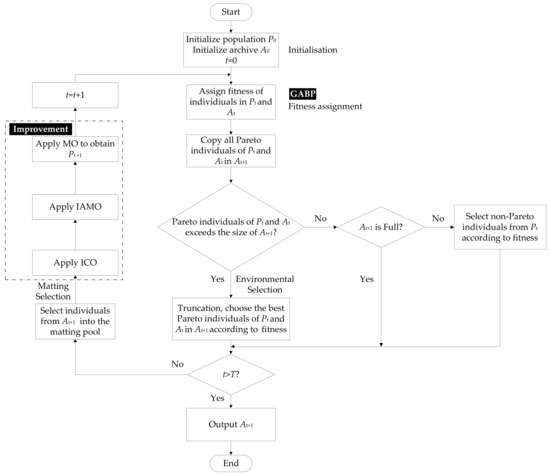
Figure 3.
Implementation flow of improved strength Pareto evolutionary algorithm 2 (ISPEA2).
Step 1: Initialize population and empty archive (external set) . Set the generation number .
Step 2: The neural networks trained by GABP are used to calculate the fitness values of the multi-objective images corresponding to them. The fitness values are then assigned to each individual in and . Specifically, each individual in and is first given an intensity value according to dominance relation, where can be defined as:
where the symbol represents the Pareto dominance relation. Then, calculate the raw fitness based on each individual’s intensity value, which is given below:
Then, calculate the density of the individual to distinguish individuals with the same raw fitness:
where denotes the distance from individual to the th adjacent individual after an ascending order of distance between individual and all other individuals. Finally, the fitness of individual can be expressed as follows:
Step 3: Identify all non-dominant individuals and copy them from and to using an environmental selection technique. If the size of exceeds its maximum permitted size, fill with the best non-inferior solutions by the truncation operation. Otherwise, fill with the dominant individuals in and .
Step 4: If the stopping criterion is satisfied then use the non-dominated individuals in as the final Pareto solution set and terminate.
Step 5: Fill the mating pool with a binary tournament selection to replace .
Step 6: Apply the ICO, IAMO and MO to obtain the resulting population . The calculation process of each operator is as follows:
(1) Let PC scores vectors and be two parent individuals of the th generation to be genetically manipulated after the operation of the above steps, and two descendant individuals after the crossover operation through ICO are expressed as
where is the random number with uniform distribution on [−0.5, 1.5], and = 1; is the number of PC.
(2) Let PC scores vector be the parent individual of the th generation, the descendant individual after the mutation operation through IAMO is expressed as
where is the coefficient of mutation scale; is the decay rate of mutation; is the current number of iteration; is the maximum number of iterations; is a random number of standard normal distribution; and are the upper and lower limits of the boundary of a gene, respectively.
(3) The MO modifies the results of the crossover and mutation operations with a certain modification probability according to the following equation:
where represents the descendant individuals obtained after the crossover and mutation operations, where is , is and is ; is a set of all PC numbers; corresponds to the PC numbers with consistent correlation coefficient between PC scores and IEMSs of target adjectives; is the modification coefficient of the th PC number; is a random number in the interval [4,5]; is the correlation coefficient of the th target adjective of the th PC number, and it is considered that there is a correlation between two variables when [32]; is the number of target adjectives. By replacing the gene corresponding to the position of of with , the modification operation can be completed.
Each operator acts on the algorithm as follows. Firstly, the value range of and in ISPEA2 is not limited to [0,1] in SPEA2, this ensures that the search space of the ICO in ISPEA2 covers all the neighborhoods of and . Therefore, ICO can make the probability of searching for more different offspring higher and the diversity of ISPEA2 better. Secondly, the IAMO ensures that the mutation rate changes dynamically with the increase of the number of iterations. In the initial stage of the iteration, the global optimal solutions are searched by a large mutation rate, and at the end of the iteration, local optimal solutions are fully searched by a small mutation rate. This improves the convergence of ISPEA2. Finally, the MO helps to achieve the goal of continuously improving the scores of target adjectives in iterations. Since the value range of and determines the reasonable range of as the modification coefficient, which ensures that no matter positive and negative correlation, individual genes consisting of PC scores of the position of the th PC number can be evolved towards the direction of increasing the scores of target adjectives with the pre-set modification probability in each iteration. Therefore, the introduction of MO can significantly improve the convergence of the algorithm. By reasonably presetting the modification probability, it can effectively maintain a good balance between the convergence and diversity of SPEA2.
Step 7: Increase the generation number by 1 and go to Step 2.
2.6. Entropy Weight and Technique for Order Preference by Similarity to Ideal Solution (Entropy-TOPSIS)
Entropy-TOPSIS determines the weight of each target adjective based on the entropy weight method, and evaluates Pareto solutions and gets the optimal solution based on the TOPSIS technique. By calculating the comprehensive evaluation index , all Pareto solutions can be ranked in order. For further details and analysis, please see, for example, Chauhan et al. [33].
3. Empirical Study
The feasibility and effectiveness of the proposed model is demonstrated by a case study of car form design. The detailed implementation procedures are described in the following sections.
3.1. Design Analysis
Cars are mature and diverse products that are familiar to consumers. They are ideal research objects in the field of product form design [34,35]. As the most crucial form feature of a car, a car profile is mainly represented by a closed curve including the engine line, the windshield line, the roof line, the wheelbase and the wheel arch line [36]. In view of the fact that most researchers have used a 2D profile to define the form feature of a product [37], this study verifies the proposed model by taking a 2D car profile as an example. In consideration of the familiarity and satisfaction of customers, we first collected pictures of 125 mid-size and three-box cars from 32 different brands in the Chinese market. Subsequently, a focus group of nine experts (five men and four women) with more than two years of car design experience were formed to classify and select representative cars based on their similarity in visual features. By using the Kawakida Jirou (KJ) method, multidimensional scaling analysis (MDS) and cluster analysis [38,39], 45 representative samples were selected to form the final benchmark car sample set. Figure 4 demonstrates the sample pictures, and Table 1 manifests their brands and models.
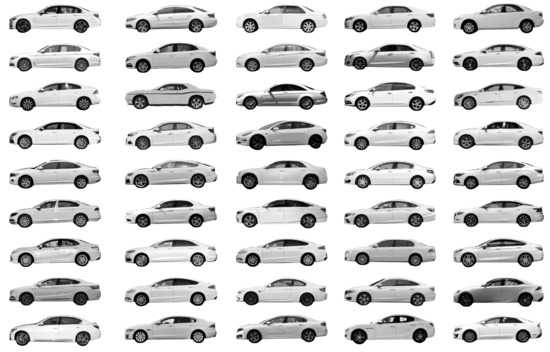
Figure 4.
Pictures of representative samples.

Table 1.
Brands and models of representative samples.
3.1.1. Ellipse Fourier Analysis
After the image preprocessing process shown in Figure 5, we got the data sequence of point coordinates of representative samples’ profiles.
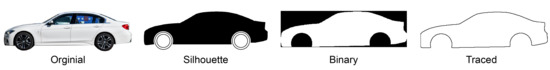
Figure 5.
Picture preprocessing process.
As can be seen from Figure 6, the tire sizes of different representative samples have not changed significantly, so their influence on the product image is negligible. Consequently, the extracted car profiles do not contain tire information (see Figure 7).
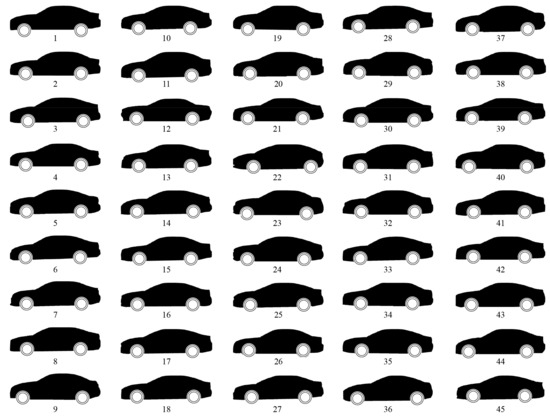
Figure 6.
Silhouettes of representative samples.
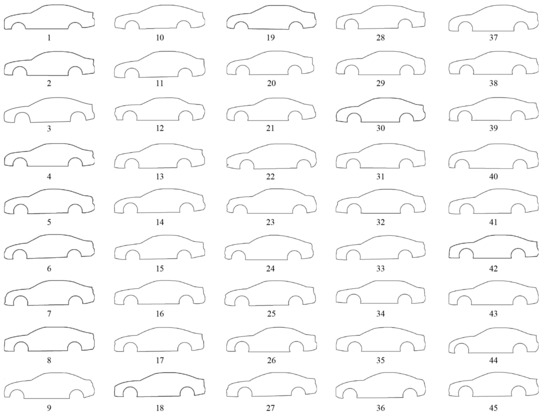
Figure 7.
Profiles of representative samples.
We performed EFA on data sequence of point coordinates of the profiles according to the Equations (1)–(9) and obtained the of each sample. Table 2 demonstrates the for sample No.1.
Table 2.
for sample No.1 ( = 64).
To observe the effect of profile reconstruction, sample profiles were reconstructed by inverse Fourier transform of (see Figure 8).
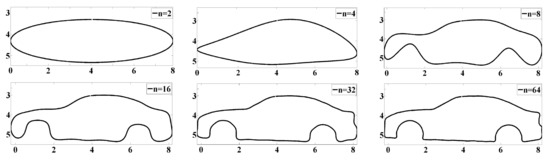
Figure 8.
Profile reconstruction of sample No.1 under different harmonic numbers.
By comparison with the original profile, n was determined to be 64, because at this harmonic number, the reconstructed profile had most of the features of the original profile and the noise was very small. Then, the of each sample was reshaped from a matrix of dimensions 64 × 4 into a row vector, and the matrices of all samples were assembled into a matrix of dimensions 45 × 256. After that, we performed PCA on the matrix to obtain a low-dimensional PC scores matrix.
To ensure high-accuracy reconstruction of the sample profile and reduce the computational complexity of the proposed model, the number of PC was set to 7 based on the cumulative variance contribution rate. At this point, the cumulative variance contribution rate exceeded 99.95% (see Table 3) and the PC scores matrix was a matrix of dimensions 45 × 7 (Table 4, whole set of data see Table S2).
Table 3.
Variance contribution rate of each principal component (PC).
Table 4.
PC scores for representative samples.
3.1.2. Image Analysis
Firstly, 128 affective adjectives describing car profiles were collected from literature, car catalogs and professionals. Next, an informal survey was conducted on 16 industrial design students (8 males and 8 females) to select 36 relevant adjectives preliminarily (see Table 5), which were suitable for these subjects to express their perceptions on the representative sample profiles. Then, the focus group finalized 11 most representative adjectives, with application of the Delphi method. After that, questionnaires were designed by combining 45 representative samples with the 11 representative adjectives, using a 7-point semantic differential method (-3-3), in which −3 and 3 are the lowest and the highest score of adjectives, respectively. Subsequently, the IEMSs was calculated after the focus group completed the questionnaire (Table 6, whole set of data see Table S3), and the correlation analysis matrix for all samples was obtained by concatenating the IEMSs and PC scores matrixes. Finally, the FIOCS and rankings of 11 representative adjectives were obtained via using the IOCSM (Table 7). The top three adjectives in the rankings were set as the target adjectives in the case study of this paper, namely “luxurious”, “steady”, and “modern”.
Table 5.
36 relevant adjectives.
Table 6.
Image evaluation mean scores (IEMSs) matrix.
Table 7.
Final image objective comprehensive score (FIOCS) and rankings of 11 representative adjectives.
3.2. Construction of Multi-Objective Prediction Model (MOPM)
In this section, we constructed three BPNNs optimized by GA to predict calculated scores of three target adjectives. Each BPNN selected the classic three-layer structure, and the number of neurons in the input layer, hidden layer and output layer were 7, 10 and 1, respectively. GA was adopted to generate the optimal initial weights and thresholds for three BPNNs. After being trained, these BPNNs were further used as the fitness function to predict the calculated scores of three target adjectives in ISPEA2. Table 8 reflects the specific parameter values of GABP, some of which are derived from Zhang et al. [40]. The details of the algorithm parameters are manifested in Table 8, The values of some parameters in Table 8 and Table 11 are referenced to the studies. Figure 9 demonstrates the prediction errors of three BPNNs when the number of iterations is 20,000.
Table 8.
Algorithm parameters of genetic algorithm and back propagation neural network (GABP).
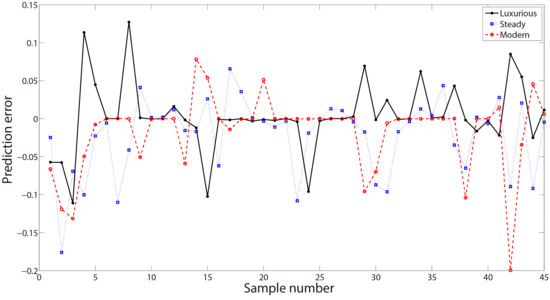
Figure 9.
Predictive errors of back propagation neural networks (BPNNs) for three target adjectives.
As can be seen from Figure 9, there are small errors between the predicted and true values of all samples for three target adjectives. In addition, we further used the root mean square error (RMSE) to evaluate the performances of these BPNNs, which is defined as
where is the number of samples; and are the BPNN predicted and true values of the th sample, respectively.
Table 9 reflects that RMSE of the three BPNNs decrease rapidly as the number of iterations increases. After 20,000 epochs, the final RMSE values are 0.0455, 0.0534 and 0.0526, respectively, all within the acceptable tolerance of less than 0.1, which demonstrates that the convergence performance of each network is satisfactory. It can be seen that GABP has built a MOPM with high prediction accuracy, which provides a strong guarantee for the effective implementation of ISPEA2.
Table 9.
Root mean square error (RMSE) of three BPNNs under different iteration numbers.
3.3. Pareto Solutions Generation
In this section, we first determined the key parameters of ISPEA2. Table 10 illustrates the correlation coefficients between PC scores and IEMSs of the three target adjectives, which indicate that PC1 and PC2 are consistent positive and negative correlation with the three target adjectives, respectively. According to the Equation (19), and were calculated as 0.718 and −0.54 by using the correlation coefficients of PC1 and PC2 in Table 10. Then the modification coefficients and were determined by combining Equation (18) and random number . The purpose of setting the modification probability is to accelerate the convergence of ISPEA2 without affecting the diversity of the algorithm too much, so as to ensure a good balance between the convergence and diversity. As such, it is necessary to compare the scores of multi-object image of Pareto solutions generated after an independent run of the algorithm and the visual difference of the profile shape of the generated solutions. The higher the scores and the larger the shape difference, the better the parameter value will be. Through multiple simulation experiments on different modification probability values, we observed the scores and visual differences of the Pareto solutions generated in different independent runs, and finally set the modification probability to 0.3. The parameter values of ISPEA2 are given in Table 11, some of which are derived from Wen et al. [41].
Table 10.
Correlation coefficients between PC scores and IEMSs of the three target adjectives.
Table 11.
Algorithm parameters of ISPEA2 and SPEA2.
After running ISPEA2 according to the above parameters, we obtained a total of 30 Pareto solutions (design alternatives), whose PC scores and target adjective calculation scores are shown in Table 12 (whole set of data see Table S4).
Table 12.
PC scores and target adjective calculation scores of 30 Pareto solutions.
3.4. Optimal Solution Selection and Verification
In order to obtain the optimal solution, we calculated the weights of three target adjectives and the comprehensive evaluation index of all Pareto solutions by using entropy-TOPSIS, Table 13 manifests the weights of three target adjectives. Table 14 demonstrates the detailed values and rankings of 30 Pareto solutions. Since ranks first, it was determined to be the optimal solution.
Table 13.
Weights of three target adjectives determined by entropy weight method.
Table 14.
Rankings and values of 30 Pareto solutions.
To verify the result, four representative Pareto solutions in the Pareto solution set were selected at the starting point, the middle adjacent two points, and the ending point, respectively, which are marked out with red solid dots in Figure 10. The PC scores, target adjective calculation scores, values and profiles of the four selected Pareto solutions are demonstrated in Table 15. After combining the profiles of these solutions with three target adjectives to create a questionnaire, the focus group was invited again to evaluate these solutions. The result is manifested in Table 16, from which we can see that the expert evaluation result is consistent with the automatic calculation result of the model in this paper.
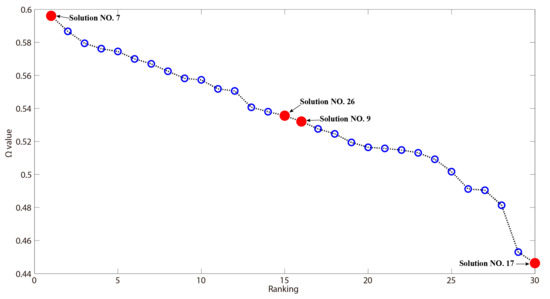
Figure 10.
Rankings and values of 30 Pareto solutions.
Table 15.
Automatic calculation result for four selected Pareto solutions.
Table 16.
Expert evaluation result for four selected Pareto solutions.
4. Discussion
In this paper, we have proposed a PFDMOEAM which integrates three main methods: ISPEA2, EFA and entropy-TOPSIS. The comprehensive performance superiorities of the model derive from the performance benefits of these methods.
4.1. Performance of ISPEA2
The performance of MOEA algorithm is the most critical factor in determining the comprehensive performance of PFDMOEAM. After the comparison of second generation classical MOEAs, we chose to improve SPEA2 into the MOEA required by the PFDMOEAM built in this paper. To verify the performance of ISPEA2, ISPEA2 and SPEA2 were independently run 30 times under the same parameter settings (see Table 11) to compare the performance of two algorithms by using convergence metric, spacing metric and coverage metric [42,43,44]. Since the true Pareto front in this study is unknown, we adopted a common comparative method suitable for this situation, which is to construct a reference Pareto front to represent the true Pareto front by a pair-wise comparison after collecting all Pareto solutions from all independent runs of the two algorithms [7,45]. Let be a solution set obtained by ISPEA2 or SPEA2, and be a solution set on the true Pareto front, the three metrics can be calculated as follows.
Convergence metric represents the average distance from the solution set obtained to the true Pareto front, which can be calculated as [42,46,47]:
where is the minimum normalized Euclidean distance from each solution in to ; and are the maximum and minimum function values of the th objective function in the true Pareto solution set , respectively. The smaller the value is, the better the convergence performance will be. When , it means that all solutions in are on the true Pareto front.
Spacing metric denotes the distance between two consecutive solutions and measures the diversity performance of algorithm, which is computed as [43,47]:
where is the mean of . A smaller value indicates that the obtained solutions are distributed more evenly throughout the objective space.
Coverage metric denotes that the obtained solutions of one algorithm dominate the obtained solutions of the other algorithm, which is defined as [44,48]:
where means the ratio of the number of solutions dominated by in to all solutions in , and indicates the opposite case. If , then are better than . To compare values of the two algorithms from a statistical perspective, and solution sets are obtained by further calculation of Pareto solution generation after collecting all solutions of all runs of the two algorithms, respectively.
After calculating the metrics mentioned above, we computed the means and standard deviations of and metrics and the metric values of two algorithms (Table 17) and plotted the trend graph of and metric values of 30 independent runs (Figure 11).
Table 17.
Means and standard deviations of , , and values for ISPEA2 and SPEA2.
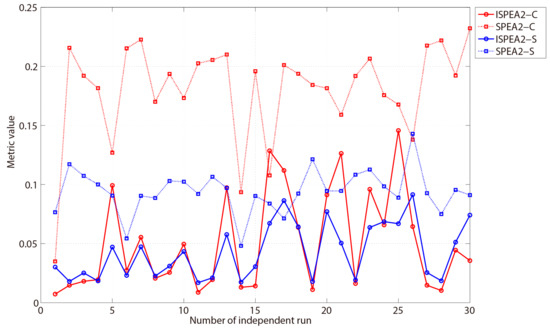
Figure 11.
Trend graph of and metrics of 30 independent runs of the two algorithms.
From Table 17 and Figure 11, we can see that the metric value of ISPEA2 is obviously smaller than that of SPEA2 and the metric value of ISPEA2 is also lower than that of SPEA2, which manifests that the convergence of ISPEA2 has been obviously improved, and the diversity of ISPEA2 has also been enhanced. In addition, means that there is no solution in SPEA2 that can dominate the solution in ISPEA2. The high value of the metric demonstrates that the outcomes of ISPEA2 remarkably dominate the outcomes of SPEA2, and the solutions of ISPEA2 are closer to the true Pareto front and more widely distributed. Consequently, the comparative results prove that ISPEA2 has better convergence and diversity. It should be pointed out that the standard deviations of two metrics are very close, which demonstrates that the stability of two algorithms is relatively consistent.
The ISPEA2 algorithm is the main source of the proposed PFDMOEAM’s comprehensive performance superiority and value, helping the model to generate high quality Pareto design solutions. The overall forms of these solutions are rich and free, and the form details are fine and smooth, even the morphological information of local structures such as car lights can be observed. Rich and fine forms match the multi-image objective better, which significantly improves the innovation and application value of the proposed PFDMOEAM.
4.2. Superiorities and Values of EFA for Product Form Design Multi-Objective Evolutionary Algorithm Model (PFDMOEAM)
In the authors’ previous work, it has been proved that EFA as an effective PFIA method has shown significant superiorities in the DA module. Compared with other traditional PFIA methods, it improves the precision and degree of freedom of PFR, and enhances the accuracy and comprehensiveness of KIR. This paper further proves that EFA can provide a new idea and way for optimizing the performance of MOEA in the MOO module. This is reflected in the fact that the MO operator is proposed by using the consistency correlation between PC scores and IEMSs both obtained by EFA. Because PC scores can reflect overall form features, and the perception mode of product image also adheres to the principle of overall form priority of product image recognition [49], the relationships of PC scores and IEMSs relative to product form are both more based on the whole rather than the local. By using these relations, the MO operator adjusts the evolutionary direction, which reduces the amount of computation and improves the efficiency and performance of ISPEA2 algorithm in approximating the true Pareto solution set. It can be seen that EFA not only promotes the achievement of the goals of DA and MOO modules better, but also creates an organic connection between different methods in these two modules, which helps to integrate the model as a whole more effectively. Therefore, EFA is a significant basis for gaining the superiorities of the proposed PFDMOEAM.
4.3. Complete PFDMOEAM and Entropy-TOPSIS
As the last module of the complete PFDMOEAM, the main task of the OSS module is to use the MADM method to evaluate and rank Pareto design solutions according to multi-objective calculated scores. Based on the superiorities of innovation and accuracy gained in the DA and MOO modules, the goal of OSS module is to consolidate these superiorities and get accurate MADM results. Therefore, an objective, accurate and operable MADM method is needed in this module. Compared with other subjective MADM methods, the entropy-TOPSIS method has better objectivity, accuracy and operability, so it can achieve the goal of the OSS module more effectively. The consistency of the results of Table 15 and Table 16 demonstrates that the entropy-TOPSIS method has good applicability to PFDMOEAM and has been integrated with the other main methods to provide strong support for the comprehensive performance benefits of the model.
Based on the above methods, the automatic simulation system of the model was developed by using MATLAB software. The system provides a visual interface that allows designers to carry on designing and observing the results intuitively and efficiently (Figure 12). The implementation and operation of simulation system proves that the proposed model can be used as a universal Kansei engineering design expert system with great innovation and application value.
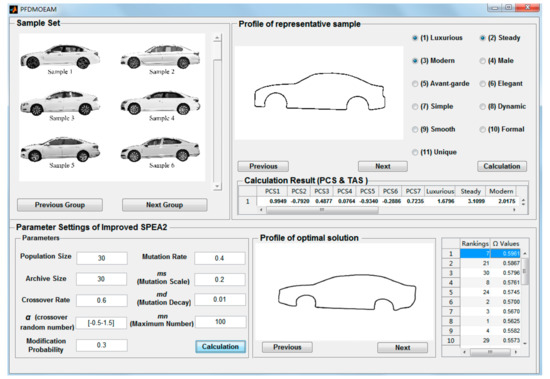
Figure 12.
Automatic simulation system of the proposed PFDMOEAM.
Note that 45 representative samples were used in the case study for test, but the proposed PFDMOEAM can increase or decrease the sample size according to actual needs. Since the PCA in the EFA method requires a certain number of samples, the sample size should not be too small. In theory, the larger the sample size, the more reliable the result will be.
5. Conclusions
To overcome the major obstacle that restricts the performance of traditional PFDMOEAMs, we have proposed a novel ISPEA2 algorithm. Taking ISPEA2 as the core and combining the EFA and entropy-TOPSIS methods, we have further constructed a novel PFDMOEAM and developed its simulation system in this paper. The simulation results verify the feasibility and effectiveness of the model.
(1) Since MOEA is the key to determining the performance of PFDMOEAM, we have proposed a novel ISPEA2 algorithm based on the SPEA2 algorithm selected from the renowned second generation classical MOEAs. In addition to improving the original operators in SPEA2, the MO operator was introduced for the first time to optimize the performance of ISPEA2. Through these operators, ISPEA2 is superior to SPEA2 in convergence and diversity, which lays a solid foundation for improving the comprehensive performance of the model.
(2) For a better complete model, we have further constructed a novel PFDMOEAM that combines ISPEA2, EFA and entropy-TOPSIS. It makes full use of the superiorities of these methods to maximize its comprehensive performance, which are the excellent convergence and diversity of ISPEA2 as MOEA algorithm, the high accuracy and degree of multi-method integration of EFA as PFIA method, and the good objectivity and operability of entropy-TOPSIS as the MADM method. Therefore, the model exhibits excellent comprehensive performance in multi-objective evolutionary design of product form.
(3) A case study of car form design has been used to elaborate the process of the proposed model, and its simulation system has been developed. The simulation results demonstrate that the model can generate a variety of new car profiles that meet the multi-image objective, offer powerful support for the scientific MADM of car form optimization, and provide a universal and effective design tool for designers. Although this study takes car form as an example, the model is also applicable to the form design of other products.
It is acknowledged that the proposed model needs to integrate many different methods, which makes the debugging process a bit complicated. However, this problem has been properly implemented in practice. In addition, this model is only used in the design of a 2D product profile. Further exploring the application of the model in 3D product form design and combining the model with product color design will be the focus of future research.
Supplementary Materials
The following are available online at https://www.mdpi.com/2076-3417/9/14/2944/s1.
Author Contributions
Z.W., W.L. and M.Y. conceived of and designed the study. Z.W. and D.H. performed the experiments and analyzed the data. Z.W. wrote the manuscript. Z.W., W.L. and M.Y. revised and polished the manuscript. All authors have read and approved the final manuscript.
Funding
This work is supported by the National Natural Science Council of the Republic of China under Grant No. 71661023.
Acknowledgments
The authors would like to thank all of the anonymous referees for the comments and suggestions, which have helped to improve the paper. In addition, the authors would like to thank the National Natural Science Council of the Republic of China for financially supporting this research.
Conflicts of Interest
The authors declare no conflict of interest.
References
- Chang, H.C.; Lai, H.H.; Chang, Y.M. Expression modes used by consumers in conveying desire for product form: A case study of a car. Int. J. Ind. Ergonom. 2006, 36, 3–10. [Google Scholar] [CrossRef]
- Liu, C.Y.; Tong, L.I. Developing Automatic Form and Design System Using Integrated Grey Relational Analysis and Affective Engineering. Appl. Sci. 2018, 8, 91. [Google Scholar] [CrossRef]
- Vieira, J.; Osório, J.M.A.; Mouta, S.; Delgado, P.; Portinha, A.; Meireles, J.F.; Santos, J.A. Kansei engineering as a tool for the design of in-vehicle rubber keypads. Appl. Ergon. 2017, 61, 1–11. [Google Scholar] [CrossRef] [PubMed]
- Zouache, D.; Arby, Y.O.; Nouioua, F.; Abdelaziz, F.B. Multi-objective chicken swarm optimization: A novel algorithm for solving multi-objective optimization problems. Comput. Ind. Eng. 2019, 129, 377–391. [Google Scholar] [CrossRef]
- Hsiao, S.W.; Tsai, H.C. Applying a hybrid approach based on fuzzy neural network and genetic algorithm to product form design. Int. J. Ind. Ergonom. 2005, 35, 411–428. [Google Scholar] [CrossRef]
- Guo, F.; Liu, W.L.; Liu, F.T.; Wang, H.; Wang, T.B. Emotional design method of product presented in multi-dimensional variables based on Kansei Engineering. J. Eng. Des. 2014, 25, 194–212. [Google Scholar] [CrossRef]
- Shieh, M.D.; Li, Y.; Yang, C.C. Comparison of multi-objective evolutionary algorithms in hybrid Kansei engineering system for product form design. Adv. Eng. Inform. 2018, 36, 31–42. [Google Scholar] [CrossRef]
- Yang, C.C. Constructing a hybrid Kansei engineering system based on multiple affective responses: Application to product form design. Comput. Ind. Eng. 2011, 60, 760–768. [Google Scholar] [CrossRef]
- Su, J.N.; Zhang, Q.W.; Wu, J.H.; Liu, Y. Evolutionary design of product multi-image styling. Comput. Integr. Manuf. Syst. 2014, 20, 2675–2682. [Google Scholar]
- Shieh, M.D.; Li, Y.; Yang, C.C. Product form design model based on multiobjective optimization and multicriteria decision-making. Math. Probl. Eng. 2017, 2017, 5187521. [Google Scholar] [CrossRef]
- Jiang, H.; Kwong, C.K.; Liu, Y.; Ip, W.H. A methodology of integrating affective design with defining engineering specifications for product design. Int. J. Prod. Res. 2014, 53, 2472–2488. [Google Scholar] [CrossRef]
- Li, Y.F.; Shieh, M.D.; Yang, C.C. A posterior preference articulation approach to Kansei engineering system for product form design. Res. Eng. Des. 2019, 30, 3–19. [Google Scholar] [CrossRef]
- Zhao, F.Q.; Lei, W.C.; Ma, W.M.; Liu, Y.; Zhang, C. An improved SPEA2 algorithm with adaptive selection of evolutionary operators scheme for multiobjective optimization problems. Math. Probl. Eng. 2016, 2016, 8010346. [Google Scholar] [CrossRef]
- Wang, Z.; Liu, W.D.; Yang, M.L.; Han, D.J. Research on product image form design based on elliptic Fourier. Comput. Integr. Manuf. Syst. 2019, 1–23. Available online: http://kns.cnki.net/kcms/detail/11.5946.TP.20190222.0953.008.html/ (accessed on 22 February 2019).
- Huang, W.C.; Shuai, B. Using Improved Entropy-Cloud Model to Select High-Speed Railway Express Freight Train Service Sites. Math. Probl. Eng. 2017, 2017, 7824835. [Google Scholar] [CrossRef]
- Qi, C.Z. Performance Evaluation in University Library’s E-resources Based on Entropy Weighted TOPSIS Method. J. Mod. Inform. 2014, 34, 54–57. [Google Scholar]
- Mebatsion, H.K.; Paliwal, J.; Jayas, D.S. Evaluation of variations in the shape of grain types using principal components analysis of the elliptic Fourier descriptors. Comput. Electron. Agric. 2012, 80, 63–70. [Google Scholar] [CrossRef]
- Chitwood, D.H.; Otoni, W.C. Morphometric analysis of Passiflora leaves: The relationship between landmarks of the vasculature and elliptical Fourier descriptors of the blade. GigaScience 2017, 6, 1–13. [Google Scholar] [PubMed]
- Valčić, M.; Prpić-Oršić, J. Hybrid method for estimating wind loads on ships based on elliptic Fourier analysis and radial basis neural networks. Ocean. Eng. 2016, 122, 227–240. [Google Scholar] [CrossRef]
- Caple, J.M.; Byrd, J.E.; Stephan, C.N. The utility of elliptical Fourier analysis for estimating ancestry and sex from lateral skull photographs. Forensic Sci. Int. 2018, 289, 352–362. [Google Scholar] [CrossRef]
- Hu, Y.Z.; Hu, Y.; Ai, X.B.; Zhao, H.Y.; Meng, Z.; Tian, W.J.; Wang, J. Stability Evaluation of Fault Diagnosis Model Based on Elliptic Fourier Descriptor. J. Control Sci. Eng. 2018, 2018, 1238231. [Google Scholar] [CrossRef]
- Schmittbuhl, M.; Minor, J.M.L.; Schaaf, A.; Mangin, P. The human mandible in lateral view: Elliptical Fourier descriptors of the outline and their morphological analysis. Ann. Anat. 2002, 184, 199–207. [Google Scholar] [CrossRef]
- Mebatsion, H.K.; Paliwal, J. A Fourier analysis based algorithm to separate touching kernels in digital images. Biosyst. Eng. 2011, 108, 66–74. [Google Scholar] [CrossRef]
- Väliranta, M.; Weckström, J. Applying principal components analysis (PCA) for separating wingless birch fruits—A palaeoecological case study from northern Norway. Ann. Bot. Fenn. 2007, 44, 213–218. [Google Scholar]
- Lo, C.H.; Ko, Y.C.; Hsiao, S.W. A study that applies aesthetic theory and genetic algorithms to product form optimization. Adv. Eng. Inform. 2015, 29, 662–679. [Google Scholar] [CrossRef]
- Quan, H.F.; Li, S.B.; Hu, J.J. Product Innovation Design Based on Deep Learning and Kansei Engineering. Appl. Sci. 2018, 8, 2397. [Google Scholar] [CrossRef]
- Chou, J.R. A kansei evaluation approach based on the technique of computing with words. Adv. Eng. Inform. 2016, 30, 1–15. [Google Scholar] [CrossRef]
- Wang, G.L.; Wu, J.H.; Wu, J.H.; Wang, X.H. A Comparison between the Linear Neural Network Method and the Multiple Linear Regression Method in the Modeling of Continuous Data. J. Comput. 2011, 6, 2143–2148. [Google Scholar] [CrossRef]
- Ding, S.F.; Su, C.Y.; Yu, J.Z. An optimizing BP neural network algorithm based on genetic algorithm. Artif. Intell. Rev. 2011, 36, 153–162. [Google Scholar] [CrossRef]
- Huang, Y.Q.; Zhang, J.; Li, X.; Tian, L.J. Thermal error modeling by integrating GA and BP algorithms for the high-speed spindle. Int. J. Adv. Manuf. Tech. 2014, 71, 1669–1675. [Google Scholar] [CrossRef]
- Zitzler, E.; Laumanns, M.; Thiele, L. SPEA2: Improving the Strength Pareto Evolutionary Algorithm; Technical Report; Computer Engineering and Networks Laboratory, Swiss Federal Institute of Technology (ETH): Zurich, Switzerland, 2001; Volume 103, pp. 1–21. [Google Scholar]
- Mukaka, M. Statistics corner: A guide to appropriate use of correlation coefficient in medical research. Malawi Med. J. 2012, 24, 69–71. [Google Scholar]
- Chauhan, R.; Singh, T.; Tiwari, A.; Patnaik, A.; Thakur, N.S. Hybrid entropy-TOPSIS approach for energy performance prioritization in a rectangular channel employing impinging air jets. Energy 2017, 134, 360–368. [Google Scholar] [CrossRef]
- Lai, H.H.; Chang, Y.M.; Chang, H.C. A robust design approach for enhancing the feeling quality of a product: A car profile case study. Int. J. Ind. Ergonom. 2005, 35, 445–460. [Google Scholar] [CrossRef]
- Yadav, H.C.; Jain, R.; Singh, A.R.; Mishra, P.K. Aesthetical design of a car profile: A Kano model-based hybrid approach. Int. J. Adv. Manuf. Techol. 2013, 67, 2137–2155. [Google Scholar] [CrossRef]
- Cheutet, V. 2D semantic sketcher for car aesthetic design [C]. Rabat: Fifth International Conference of Integrated Design and Production, 2007: 1–13. Available online: https://www.researchgate.net/publication/228537990_2D_semantic_sketcher_for_car_aesthetic_design (accessed on 22 February 2019).
- Hsiao, S.W.; Lee, C.H.; Chen, R.Q.; Lin, C.Y. A methodology for brand feature establishment based on the decomposition and reconstruction of a feature curve. Adv. Eng. Inform. 2018, 38, 14–26. [Google Scholar] [CrossRef]
- Lai, H.H.; Lin, Y.C.; Yeh, C.H. Form design of product image using grey relational analysis and neural network models. Comput. Oper. Res. 2005, 32, 2689–2711. [Google Scholar] [CrossRef]
- Lin, Y.C.; Lai, H.H.; Yeh, C.H. Consumer-oriented product form design based on fuzzy logic: A case study of mobile phones. Int. J. Ind. Ergonom. 2007, 37, 531–543. [Google Scholar] [CrossRef]
- Zhang, P.X.; Li, H.; Zhang, J. A GABP optimized algorithm for filler rate of non-heated wire. Trans. Chin. Weld. I 2012, 33, 77–81. [Google Scholar]
- Wen, L.G.; Wang, A.; Xia, M.; Ji, Z.Z. Improved SPEA2 based on local search. Appl. Res. Comput. 2014, 31, 2617–2619. [Google Scholar]
- Deb, K.; Jain, S. Running performance metrics for evolutionary multi-objective optimization. In Proceedings of the 4th Asia-Pacific Conference on Simulated Evolution and Learning (SEAL’02), Singapore, 18–22 November 2002; pp. 13–20. [Google Scholar]
- Deb, K.; Agrawal, S.; Pratap, A.; Meyarivan, T. A fast elitist non-dominated sorting genetic algorithm for multi-objective optimization: NSGA-II. In Proceedings of the Parallel Problem Solving from Nature VI Conference, Paris, France, 18–20 September 2000; pp. 849–858. [Google Scholar]
- Zitzler, E.; Thiele, L. Multiobjective evolutionary algorithms: A comparative case study and the strength Pareto approach. IEEE Trans. Evol. Comput. 1999, 3, 257–271. [Google Scholar] [CrossRef]
- Kumar, R.; Singh, P.K. Assessing solution quality of biobjective 0-1 knapsack problem using evolutionary and heuristic algorithms. Appl. Soft Comput. 2010, 10, 711–718. [Google Scholar] [CrossRef]
- Lau, H.C.W.; Chan, T.M.; Tsui, W.T.; Chan, F.T.S.; Ho, G.T.S.; Choy, K.L. A fuzzy guided multi-objective evolutionary algorithm model for solving transportation problem. Expert Syst. Appl. 2009, 36, 8255–8268. [Google Scholar] [CrossRef]
- Feng, C.; Jing, X.N.; He, G.B. Weapon-target assignment based on improved SPEA2 algorithm. Comput. Eng. Appl. 2016, 52, 248–253. [Google Scholar]
- Zhou, A.M.; Jin, Y.C.; Zhang, Q.F.; Sendhoff, B.; Tsang, E. Combining model-based and genetics-based offspring generation for multi-objective optimization using a convergence criterion. In Proceedings of the 2006 IEEE Congress on Evolutionary Computation, Vancouver, BC, Canada, 16–21 July 2006; pp. 892–899. [Google Scholar]
- Su, J.N.; Li, H.Q. Method of product form design based on perceptual image. Chin. J. Mech. Eng. 2004, 40, 165–167. [Google Scholar] [CrossRef]


© 2019 by the authors. Licensee MDPI, Basel, Switzerland. This article is an open access article distributed under the terms and conditions of the Creative Commons Attribution (CC BY) license (http://creativecommons.org/licenses/by/4.0/).