Article

Using the Characteristics of Pulse Waveform to Enhance the Accuracy of Blood Pressure Measurement by a Multi-Dimension Regression Model

1
Department of Computer Science and Information Engineering, Chaoyang University of Technology, Taichung 41349, Taiwan
2
Department of Electrical Engineering, National Taiwan University, Taipei 10672, Taiwan
3
Division of Cardiology, Chiayi Chang Gung Memorial Hospital, Chiayi 61363, Taiwan
4
Department of Traditional Chinese Medicine, College of Medicine, Chang Gung University, Taoyuan 33305, Taiwan
5
Biomedical Information Engineering Laboratory, The University of Aizu, Aizu-wakamatsu 965-8580, Fukushima, Japan
6
Department of Electrical Engineering, National Taipei University of Technology, Taipei City 10608, Taiwan
*
Author to whom correspondence should be addressed.
Appl. Sci. 2019, 9(14), 2922; https://doi.org/10.3390/app9142922
Submission received: 17 June 2019 / Revised: 12 July 2019 / Accepted: 18 July 2019 / Published: 22 July 2019

Abstract

:
With the advancement of wearable technology, many physiological monitoring instruments are gradually being converted into wearable devices. However, as a consumer product, the blood pressure monitor is still a cuff-type device, which does perform a beat-by-beat continuous blood pressure measurement. Consequently, the cuffless blood pressure measurement device was developed and it is based on the pulse transit time (PTT), although its accuracy remains inadequate. According to the cardiac hemodynamic theorem, blood pressure relates to the arterial characteristics and the contours of the pulse wave include some characteristics of the artery. Therefore, the purpose of this study was to use the contour characteristics of the pulses measured by photoplethysmography (PPG) to estimate the blood pressure using a linear multi-dimension regression model. Ten subjects participated in the experiment, and the blood pressure levels of the subjects were elevated by exercise. The results showed that the mean and standard deviation (mean ± SD) of the root mean square error of the estimated systolic and diastolic pressures within the best five parameters were 6.9 ± 2.81 mmHg and 4.0 ± 0.65 mmHg, respectively. Compared to the results that used one parameter, the PTT, for estimating the systolic and diastolic pressures, 8.2 ± 2.1 mmHg and 4.5 ± 0.79 mmHg, respectively, our results were better.

1. Introduction

The last decade has seen the development of some wearable technologies for health care [1]. These technologies are used for monitoring the saturation of percutaneous oxygen (SpO2) [2], the electrocardiogram (ECG) [3], body temperature, physical activities [4], and the respiratory rate. These aforementioned measurement techniques can be combined into a single device that performs a complete physiological monitoring, similar to physiological clothes and polysomnography. However, the devices do not collect blood pressure measurements because a cuff-type blood pressure measurement requires mechanical devices like an air-pump motor and an electromagnetic valve. Most commercial automatic blood-pressure monitors apply either auscultatory or oscillometric methods [5], and these cannot be easily built into wearable devices.
Ahlstrom et al. proposed a novel technique for a cuffless blood pressure measurement, where they used the pulse transit time (PTT) to evaluate the systolic blood pressure [6]. They found that this method could monitor the change in a person’s blood pressure pattern. Sharwood-Smith et al. used the PTT to evaluate the change in blood pressure during obstetric spinal anesthesia [7]. The PTT is defined as the time taken by the pulse wave to travel from the systolic ending of the left ventricular to the specific position of the peripheral artery. Therefore, the cuffless technique must include at least two sensors, that is, one placed on the chest and another placed on the arm or the leg. Both studies used the ECG and photoplethysmogram (PPG) to obtain the PTT [6,7]. However, the PTT has a stronger relation with Young’s modulus of the artery. Blood pressure is one parameter of the cardiac hemodynamic theorem and, therefore, it is difficult to accurately estimate the blood pressure using only the PTT parameter.
Cardiac hemodynamic parameters include blood pressure, cardiac output, and systemic vascular resistance. In the Windkessel model [8], the pulse contour method was used to estimate cardiac output, and it can be used to estimate arterial stiffness using the Augmentation Index [9]. Xu et al. used the PTT and characteristics of the PPG wave to estimate the continuous blood pressure using a neural network (NN) [10]. Wu et al. used parameters extracted from the ECG and blood pressure waveform to estimate the blood pressure using a multilayer perceptron neural network [11]. Ruiz-Rodrıguez et al. used some of the parameters extracted from the PPG wave to estimate blood pressure [12]. In these studies, the three-layer NN with back propagation algorithm was linked to the regression model. The deep neural network (DNN) has also been utilized to perform a regression model for blood pressure measurements [13]. However, all these studies focused on the static blood pressure measurement and they required significant data to estimate the blood pressure. If the cuffless blood pressure measurement were to be applied to a wearable device, the blood pressure measurement should be under a dynamic condition, and only a few data points would be used to build the model. Thus, the cuffless blood pressure measurement not only uses the PPT parameter, but it also has to combine some contour characteristics of pulse.
The pulse wave can be measured using a pressure sensor [14], tonometer [15], and PPG, where PPG is commonly used to measure the pulse wave, representing the plethysmogram of the arteries. However, the pulse wave measured by PPG is easily affected by some factors like the subject’s skin, tissue, and light density of the LED. Moreover, it is hard to calibrate the device. PTT measured using PPG and an ECG also depends on the placement of the PPG sensor [16]. Consequently, the goal of this study was to explore cuffless blood pressure measurements using the contour characteristics of the pulse measured by PPG. Ten subjects participated in this study and they were asked to exercise to raise their blood pressures. The blood pressure estimation used the linear multi-dimension regression model and a multi-layer NN. The results showed that the contour characteristics of the pulse measured using PPG could estimate blood pressure more accurately in a linear multi-dimension regression model.

2. Methods

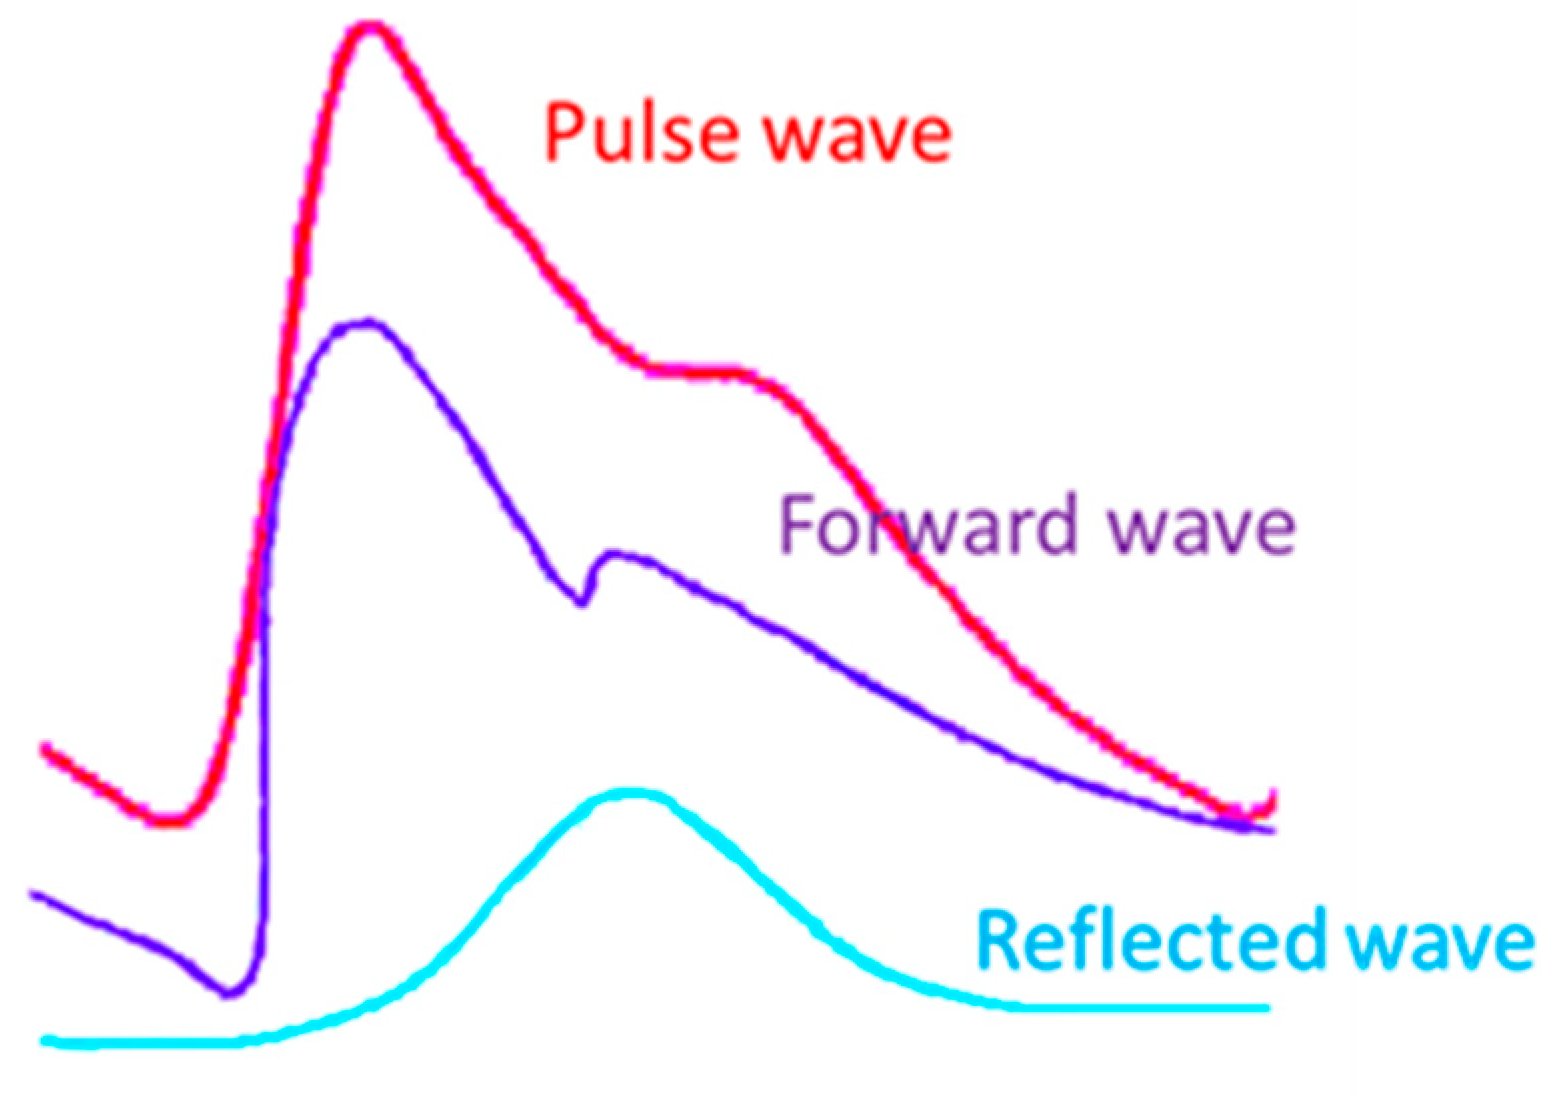
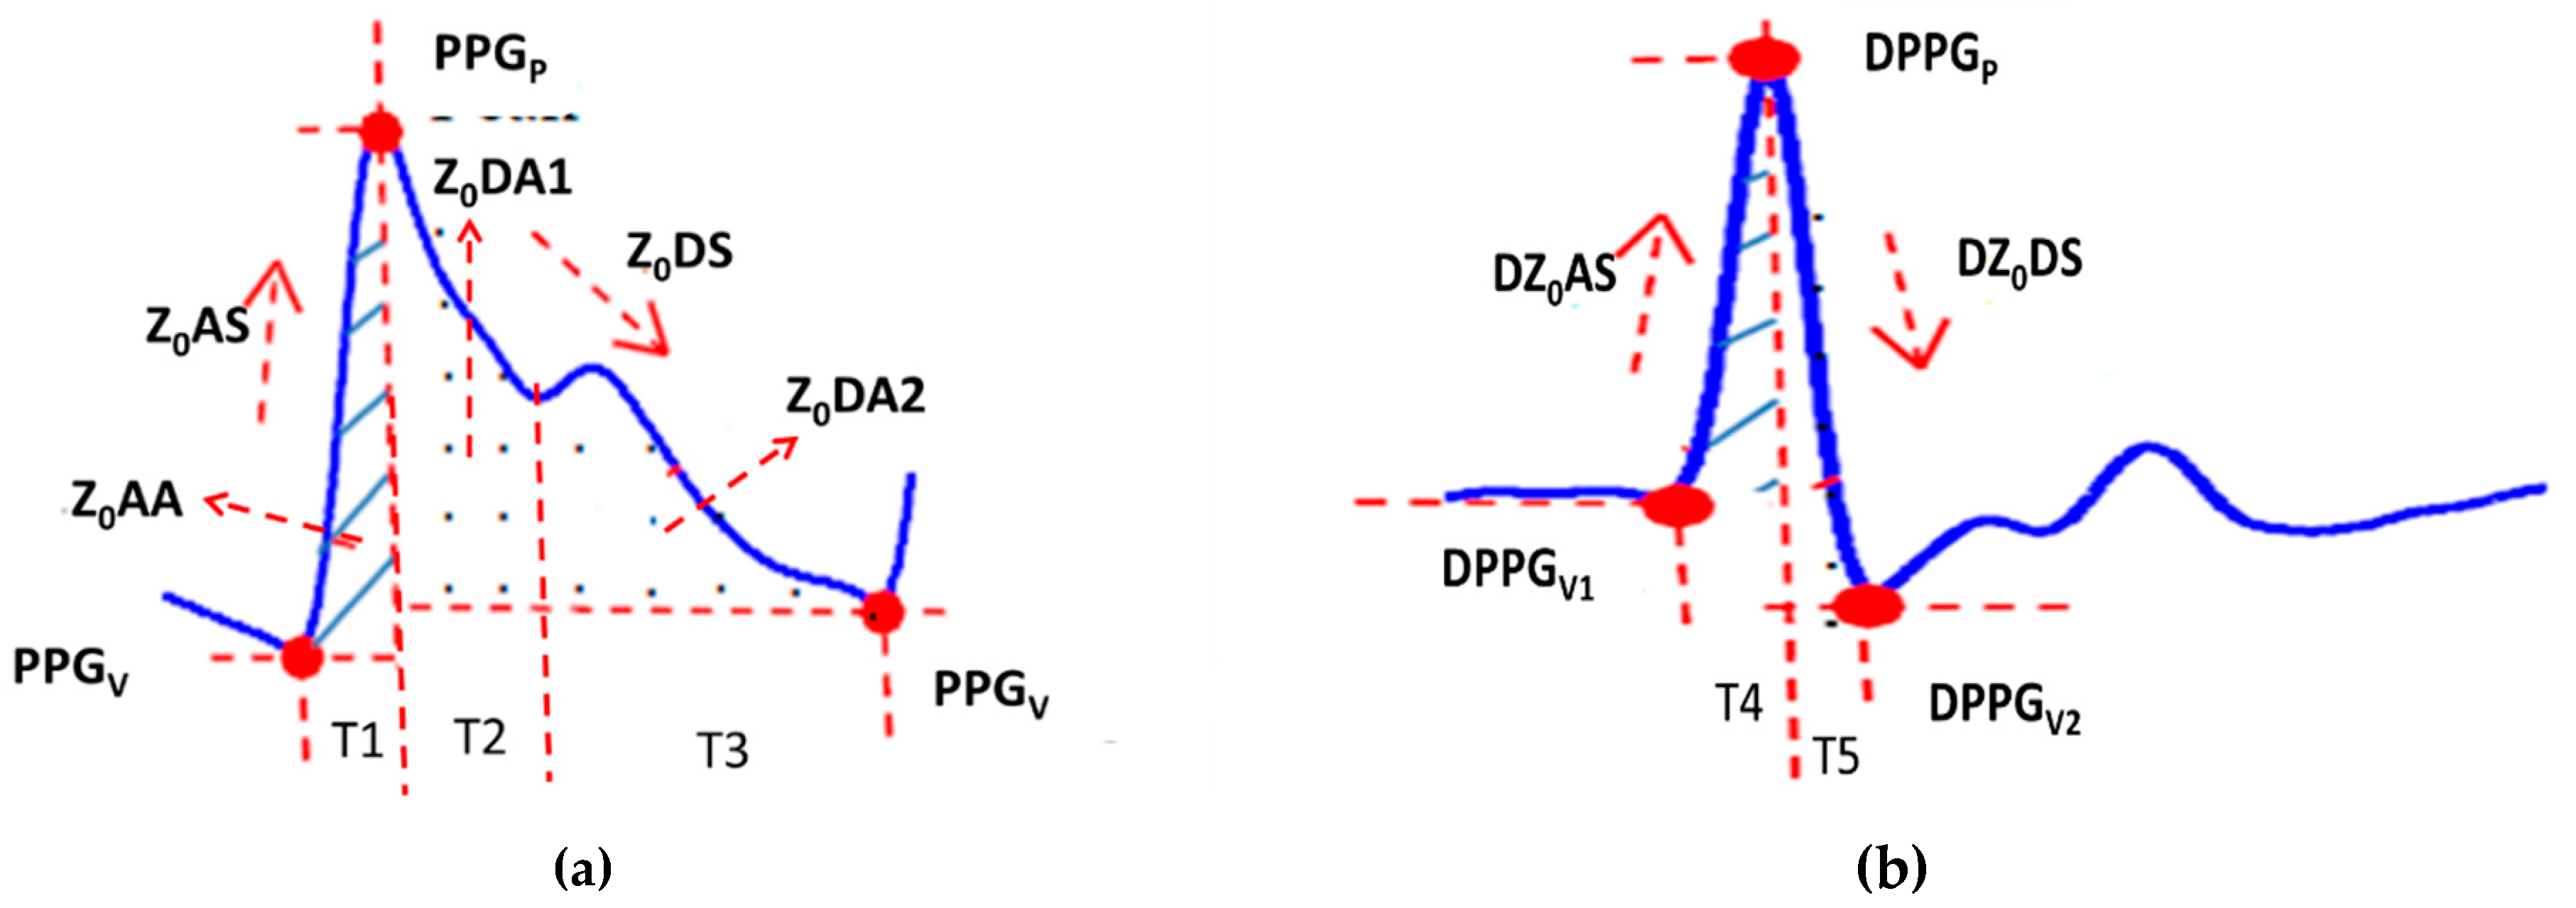
2.1. Parameters of the Pulse Wave

The pulse wave can be viewed as the synthesis of a forward wave and a reflected wave, as shown in Figure 1, which is related to the hemodynamic parameters of the heart, including blood flow, blood pressure, and systemic vascular resistance. According to the Windkessel model, the blood flow (BF) and blood pressure (BP) exhibit a first-order differential and linear relationship,
C W d B P ( t ) d t + B P ( t ) R p = B F ( t ) ,
where Cw and Rp are the arterial compliance and peripheral vascular impedance, respectively. In Equation (1), the pulse wave and pulse differential wave have a relation to the blood flow. Therefore, in this study, we proposed that some parameters should be extracted from the pulse wave, as shown in Figure 2a, and also from the differential wave of the pulse, as shown in Figure 2b. Table 1 shows the parameter definitions.

2.2. Multi-Dimension Regression Model

In this study, we used the linear multi-dimension regression model to estimate the blood pressure, where the model explores the correlation between the independent variable (x) and the dependent variable (y), and establishes a regression model to estimate the variables (ŷ). Let y be the dependent variable, whilst x1, x2, … xk are the independent variables. There is a linear relationship between the independent variable and the dependent variable. As such, the multi-dimension regression model is defined as,
y = B 0 + B 1 x 1 + B 2 x 2 + + B k x k + e
where e is the error. Each measured data is represented by i. The regression model is
y = B 0 + B 1 x i 1 + B 2 x i 2 + + B k x i k + e i
B0, B1, B2Bk are obtained by using the matrix method,
y = [ y 1 y 2 y n ] ,
X = [ 1 x 11 x 12 x 1 K 1 x 21 x 22 x 2 K 1 x n 1 x n 2 x n K ] ,
B = [ B 1 B 2 B n ] ,
E [ e 1 e 2 e n ] ,
y = X B + E .
Assuming the error value E is zero, then,
y ^ = X B ^ ,
X ( y X B ^ ) = 0 ,
X y X X B ^ = 0 ,
X y = X X B ^ .
Finally,
B ^ = ( X X ) 1 X y ,
Table 1 shows the parameters used in this study, and which have used to estimate the blood pressure, y ^ (systolic pressure and diastolic pressure). The root mean square error, ERMS, was used to evaluate the performance of the model,
E R M S = ( 1 n i = 1 n ( y i y ^ i ) 2 ) 0.5 .
where n is the number of data.

2.3. Deep Neural Network

In our study, a multi-layer feed-forward neural network based on the error back propagation algorithm was trained to predict the blood pressure using the rectified linear unit (ReLU),
f ( x ) = { x = x , x 0 x = 0 , x < 0
The neural network’s self-adaptive learning rule uses a gradient-descent method, which adjusts its weight through back propagation and minimization of the square error. Table 2 shows the parameters of the deep neural network (DNN).

2.4. Experimental Protocol

The experiment used a physiological signal measurement system, K&H KL-710, which had an ECG module and a PPG module. The sampling rate was 500 Hz, and the bandwidths of the ECG module and PPG module were tuned 0.5 to 40 Hz and 0.5 to 10 Hz, respectively. The participants in the experiment were recruited through our webpage and written announcements. The purpose and the process of the experiment, as well as the rights of the subjects were listed on the website. Ten male subjects were recruited whose ages were 23.7 ± 0.67 years (from 22 to 25 years), weights were 56.6 ± 3.33 Kg (from 52 to 62 Kg), and heights were 170.4 ± 3.77 cm (from 165 to 175 cm). Frail subjects with arrhythmia and asthma were excluded. This experiment was approved by the Research Ethics Committee of China Medical University and Hospital (No. CRREC-105-072), Taichung city, Taiwan.
Subjects we required to rest for five minutes before the measurements, and they were asked to fill an informed consent form for the experiment. The subjects’ information was recorded, including age, weight, height, medical treatment of illness, and whether there was arrhythmia (if any, excluding from the experiment). An electronic blood pressure monitor (Omron, HM-7210, Japan) was used to measure the subjects’ blood pressure. These blood pressures were used as the reference blood pressure in this experiment. The cuff of the blood pressure monitor was wrapped on the right upper arm, the probe of the PPG was placed on the first finger of the left hand, and the electrodes of the ECG were placed on the chest to measure the lead II equivalent signal. The subject rode on a fitness bike. The experiment procedure is described below:
  • The signals in the first five minutes were used as the baseline of the experiment. At the same time, the blood pressure was measured once and its finish-time would be marked at the PPG signal.
  • The pedaling speed was about 80 rpm and was kept continuous for at least five minutes.
  • Then, the blood pressure was measured and its finish-time would be marked at the PPG signal.
  • Subjects were requested to rest and to wait for their blood pressure to drop to the baseline. The blood pressures of the subjects were measured repeatedly once every minute within the resting duration, and its finish-time would be marked at the PPG signal.
  • Repeat steps 1 to 5, five times.
Table 3 shows the statistics, mean and standard deviation (mean ± SD), and the maximum and minimum blood pressures of the subjects for the exercise. Three-pulse waves close to the marked point were extracted using manual selection, and the average of these parameters for the three-pulse waves was used to construct the blood pressure model.

3. Results

Figure 3 shows the ECG and PPG signals. Since each subject performed the experiment to raise blood pressure five times, the dropping times of their blood pressure were different and so were the numbers of measured data for each subject. We used the data for each subject to make develop their personalized blood pressure models, and the leave-one-out cross validation was used to validate the performance of the multi-dimension regression model and the DNN. Figure 4 shows the correlation coefficient, r, between parameters of the pulse wave and the systolic and diastolic pressures. We found that the PTT and HR had the highest correlation with blood pressure. To choose the optimal parameters for estimating blood pressure, we used different parameter combinations to construct the blood pressure models. According to the ranking of the correlation coefficient in Figure 4, we would first delete the parameter with the lowest correlation coefficient. The parameters would be deleted one by one until the last parameter, the PTT. Table 4 shows the ERMS of the estimated blood pressure for the ten subjects with only the PTT. The ERMS statistics of were 8.2 ± 3.00 mmHg and 4.5 ± 0.75 mmHg for the systolic and diastolic pressures, respectively.
Since the best first five and six parameters could be used to estimate the better blood pressure, the results of all parameters, the six parameters, and the five parameters are shown in Table 5 and Table 6, respectively. In Table 5, the ERMS statistic with all parameters was 7.3 ± 3.46 mmHg, which was better than the ERMS using the PTT parameter only, which was 8.2 ± 3.00 mmHg. When the best first six and five parameters were used to estimate the blood pressure using the linear multi-dimension regression model, the ERMS statistics were 7.1 ± 2.60 mmHg and 6.9 ± 2.81 mmHg, respectively. The results were better than the ERMS statistics of the DNN, which were 9.5 ± 1.73 mmHg and 9.5 ± 1.71 mmHg, respectively. In Table 6, the ERMS statistic of all parameters was 4.2 ± 0.73 mmHg, which was better than the ERMS statistic using only the PTT parameter, which was 4.5 ± 0.75 mmHg. When the best six and five parameters were used to estimate the blood pressure using the linear multi-dimension regression model, the ERMS statistics were 4.0 ± 0.70 mmHg and 4.0 ± 0.65 mmHg, respectively. The results were also better than the ERMS statistics of the DNN, which were 4.7 ± 0.55 mmHg and 4.7 ± 0.58 mmHg, respectively. Figure 5 shows the measured blood pressures and the estimated blood pressures during five exercises for the fifth subject. The subject’s systolic and diastolic pressures dropped about 30 mmHg and 16 mmHg, respectively. The accuracy of the estimated diastolic pressures was better than the estimated systolic pressures, and the ERMS values were 3.4 mmHg and 4.1 mmHg, respectively.

4. Discussion

Cuffless blood pressure measurement using PTT has been studied by many researchers [6,7,10]. The pulse wave can be measured by the PPG [7,10], impedance plethysmography [17], and a pressure sensor [14]. We found that the accuracy of the measured blood pressure was affected by the measuring conditions. Most of the previous studies have measured blood pressure under a static condition, which would have a high accuracy. However, when blood pressure changes under spinal anesthesia [7] or exercise [17], the accuracy of blood pressure measurements using PTT would become fairly poor. In the pilot study by Sharwood-Smith, the correlation coefficient between the mean blood pressure and PTT was only r2 = 0.55. The result for the exercise experiment was only r2 = 0.49. Therefore, we used the contour characteristics of the pulse wave to increase the accuracy of the blood pressure measurement when blood pressure has its quickest and continuous change.
Some studies have also used the parameters extracted from a PPG and ECG to estimate blood pressure using a multilayer perceptron neural network [10,11], where the results showed good accuracy. However, their studies all focused on the static measurement condition, and there were too many parameters used to estimate blood pressure. In our study, we used a DNN and linear multi-dimension regression method to build the blood pressure model, which only used five parameters. The results showed that a linear multi-dimension regression model has a better accuracy than a DNN. The ERMS statistics were 6.9 ± 2.81 mmHg and 9.5 ± 1.71 mmHg for the systolic pressure, respectively, and 4.0 ± 0.65 mmHg and 4.7 ± 0.58 mmHg for the diastolic pressure, respectively.
In this study, only a small volume of data was required for each subject. However, the DNN required a large volume of data. Since we tried to increase the accuracy of the DNN method, the structure complexity of the DNN was increasing to {12, 20, 50, 50, 30, 30, 20, 20, 15}. This presents a bigger problem to utilize the DNN in a wearable device for measuring blood pressure. The linear multi-dimension regression model only had one layer and it could use the pseudoinverse to estimate the multi-dimension regression model, which would save training time and be easily implemented in a wearable device. Although Xu et al. used a NN with two hidden layers to estimate the blood pressure and achieved a good accuracy, the Bland–Altman plots of blood pressure showed that many estimated values were still found outside the limits of the agreement [10]. The results from the calibration-free method showed that there was only 76.9% and 86.4% accuracy in the systolic and diastolic pressures within a 5 mmHg error. According to the BS EN 1060-4 standard [18], the mean error of blood pressure has to be lower than ±5 mmHg. Therefore, if there is no method fitting this standard, a simple model would be the solution, which could be easily realized in a wearable device.
Another problem in this study was the synchronized blood pressure measurement. We only used an electric blood pressure monitor to measure the blood pressure at different time points intermittently. However, we know that this commercial blood pressure monitor only measures the rough average blood pressure within its measuring duration. Meanwhile, the blood pressure was continuously dropping after exercise. Therefore, the chosen pulses only represented these time points, which do not exactly represent the pulses of the blood pressure measured by the commercial blood pressure monitor. Moreover, the systolic pressure would increase more easily than the diastolic pressure when exercising, as shown in Table 3. In Table 5, there are only three subjects whose mean errors of the systolic pressure were lower than 5 mmHg. However, in Table 6, there was only one subject whose mean error of the diastolic pressure was larger than 5 mmHg.

5. Conclusions

In this study, we used different pulse wave parameters to estimate the change of blood pressure using a linear multi-dimension regression model. The pulse wave was measured using the PPG method. The results showed that the blood pressures measured using a five parameter combination, including the PTT parameter, were more accurate than blood pressures measured using only the PTT parameter. The linear multi-dimension regression model could be easily trained with our linear algebra calculation. Therefore, this method could be implemented in a wearable system to measure the continuous beat-to-beat blood pressure. In the future, we will use deep learning techniques to estimate the blood pressure to increase the accuracy of blood pressure measurements.

Author Contributions

S.-H.L. conceived and designed the experiments; L.-J.L. wrote the algorithm to analyze the data. W.C. analyzed the data; S.-H.L. and T.-H.T. wrote the paper; K.-L.P. designed the experiments.

Funding

This research was funded by the Ministry of Science and Technology in Taiwan under MOST 107-2221-E-324-001.

Conflicts of Interest

The authors declare no conflicts of interest.

References

  1. Majumder, S.; Mondal, T.; Deen, M.J. Wearable sensors for remote health monitoring. Sensors 2017, 17, 130. [Google Scholar] [CrossRef] [PubMed]
  2. Tremper, K.K.; Barker, S.J. Pulse oximetry. Anesthesiology 1989, 70, 98–108. [Google Scholar] [CrossRef] [PubMed]
  3. Liu, S.H.; Wang, J.J.; Su, C.H.; Tan, T.H. Development of a patch-type electrocardiographic monitor for real time heartbeat detection and heart rate variability analysis. J. Med. Biol. Eng. 2018, 38, 411–423. [Google Scholar] [CrossRef]
  4. Liu, S.H.; Chang, Y.J. Using accelerometers for physical actions recognition by a neural fuzzy network. Telemed. Health 2009, 15, 867–876. [Google Scholar] [CrossRef] [PubMed]
  5. Carr, J.J.; Brown, J.M. Introduction to Biomedical Equipment Technology, 4th ed.; Prentice Hal: Upper Saddle River, NJ, USA, 2001. [Google Scholar]
  6. Ahlstrom, C.; Johansson, A.; Uhlin, F.; Länne, T.; Ask, P. Noninvasive investigation of blood pressure changes using the pulse wave transit time: A novel approach in the monitoring of hemodialysis patients. J. Artif. Org. 2005, 8, 192–197. [Google Scholar] [CrossRef] [PubMed]
  7. Sharwood-Smith, G.; Bruce, J.; Drummond, G. Assessment of pulse transit time to indicate cardiovascular changes during obstetric spinal anesthesia. Br. J. Anesth. 2006, 96, 100–105. [Google Scholar] [CrossRef]
  8. Wesseling, K.H.; Jansen, J.C.; Settels, J.J.; Schreuder, J.J. Computation of arrtic flow from pressure in humans using a nonlinear three-element model. J. Appl. Physiol. 1993, 74, 2566–2573. [Google Scholar] [CrossRef]
  9. Oliver, J.; Webb, D. Noninvasive assessment of arterial stiffness and risk of atherosclerotic events. Arterioscler. Thromb. Vasc. Biol. 2003, 23, 554–566. [Google Scholar] [CrossRef] [PubMed]
  10. Xu, Z.; Liu, J.; Chen, X.; Wang, Y.; Zhaoa, Z. Continuous blood pressure estimation based on multiple parameters from electrocardiogram and photoplethysmogram by Back-propagation neural network. Comput. Ind. 2017, 89, 50–59. [Google Scholar] [CrossRef]
  11. Wu, C.-M.; Chuang, C.-Y.; Chen, Y.-J.; Chen, S.-C. A new estimate technology of noninvasive continuous blood pressure measurement based on electrocardiograph. Adv. Mech. Eng. 2016, 8, 1–8. [Google Scholar] [CrossRef]
  12. Ruiz-Rodríguez, J.C.; Ruiz-Sanmartín, A.; Ribas, V.; Caballero, J.; García-Roche, A.; Riera, J.; Nuvials, X.; de Nadal, M.; de Sola-Morales, O.; Serra, J.; et al. Innovative continuous non-invasive cuffless blood pressure monitoring based on photoplethysmography technology. Intensive Care Med. 2013, 39, 1618–1625. [Google Scholar] [CrossRef] [PubMed]
  13. Lee, S.; Chang, J-H. Deep belief networks ensemble for blood pressure estimation. IEEE Access 2017, 5, 9962–9972. [Google Scholar] [CrossRef]
  14. Liu, S.H.; Lin, T.H.; Cheng, D.C.; Wang, J.J. Assessment of stroke volume from brachial blood pressure using arterial characteristics. IEEE Trans. Biomed. Eng. 2015, 62, 2151–2157. [Google Scholar] [CrossRef] [PubMed]
  15. Tyan, C.C.; Liu, S.H.; Chen, J.Y.; Chen, J.J.; Liang, W.M. A novel noninvasive measurement technique for analyzing the pressure pulse waveform of the radial artery. IEEE Trans. Biomed. Eng. 2008, 55, 286–297. [Google Scholar] [CrossRef] [PubMed]
  16. Liu, S.H.; Wang, J.J.; Su, C.H.; Cheng, D.C. Improvement of left ventricular ejection time measurement in the impedance cardiography combined with the reflection photoplethysmography. Sensors 2017, 18, 3036. [Google Scholar] [CrossRef] [PubMed]
  17. Liu, S.-H.; Cheng, D.-C.; Su, C.-H. A cuffless blood pressure measurement based on the impedance plethysmography technique. Sensors 2017, 17, 1176. [Google Scholar] [CrossRef] [PubMed]
  18. British Standards Institution (BSI). Non-Invasive Sphygmomanometers-Part 4: Test Procedures to Determine the Overall System Accuracy of Automated Non-Invasive Sphygmomanometers; British Standards Institution (BSI): London, UK, 2009. [Google Scholar]
Figure 1. Red line represents the pulse wave, blue line represents the forward wave, light blue line represents the reflected wave.
Applsci 09 02922 g001
Figure 2. (a) The pulse wave, (b) The differential wave of pulse.
Applsci 09 02922 g002
Figure 3. The typical wave of electrocardiogram (ECG) and photoplethysmography (PPG).
Applsci 09 02922 g003
Figure 4. The correlation coefficient between pulse wave parameters and the blood pressure, (a) the systolic pressure, (b) the diastolic pressure.
Applsci 09 02922 g004
Figure 5. The measured and estimated blood pressures during five exercises for the fifth subject. (a) the first time experiment, (b) the second time experiment, (c) the third time experiment, (d) the fourth time experiment, (e) the fifth time experiment.
Applsci 09 02922 g005
Table 1. Parameter definition of the pulse wave.
ParametersFormula
Ejection Time Ratio (ETR) ETR = T 4 + T 5 T 1 + T 2 + T 3
Beat Duty (BD) BD = T 1 + T 2 + T 3
Heart Rate (HR) HR = 60 BD
Volume change during systolic cycle (Z0AS) Z 0 AS = PPG p PPG v T 1
Volume change during diastolic cycle (Z0DS) Z 0 DS = PPG p PPG v T 2
Volume during systolic cycle (Z0AA)Area during T1 in the pulse wave.
Volume during diastolic cycle (Z0DA2)Area during T3 in the pulse wave.
Maximum volume change during systolic cycle (DPPGp)Peak between T4 and T5 in the differential wave of pulse.
Minimum volume change during diastolic cycle (DPPGv)Valley at the end of T5 in the differential wave of pulse.
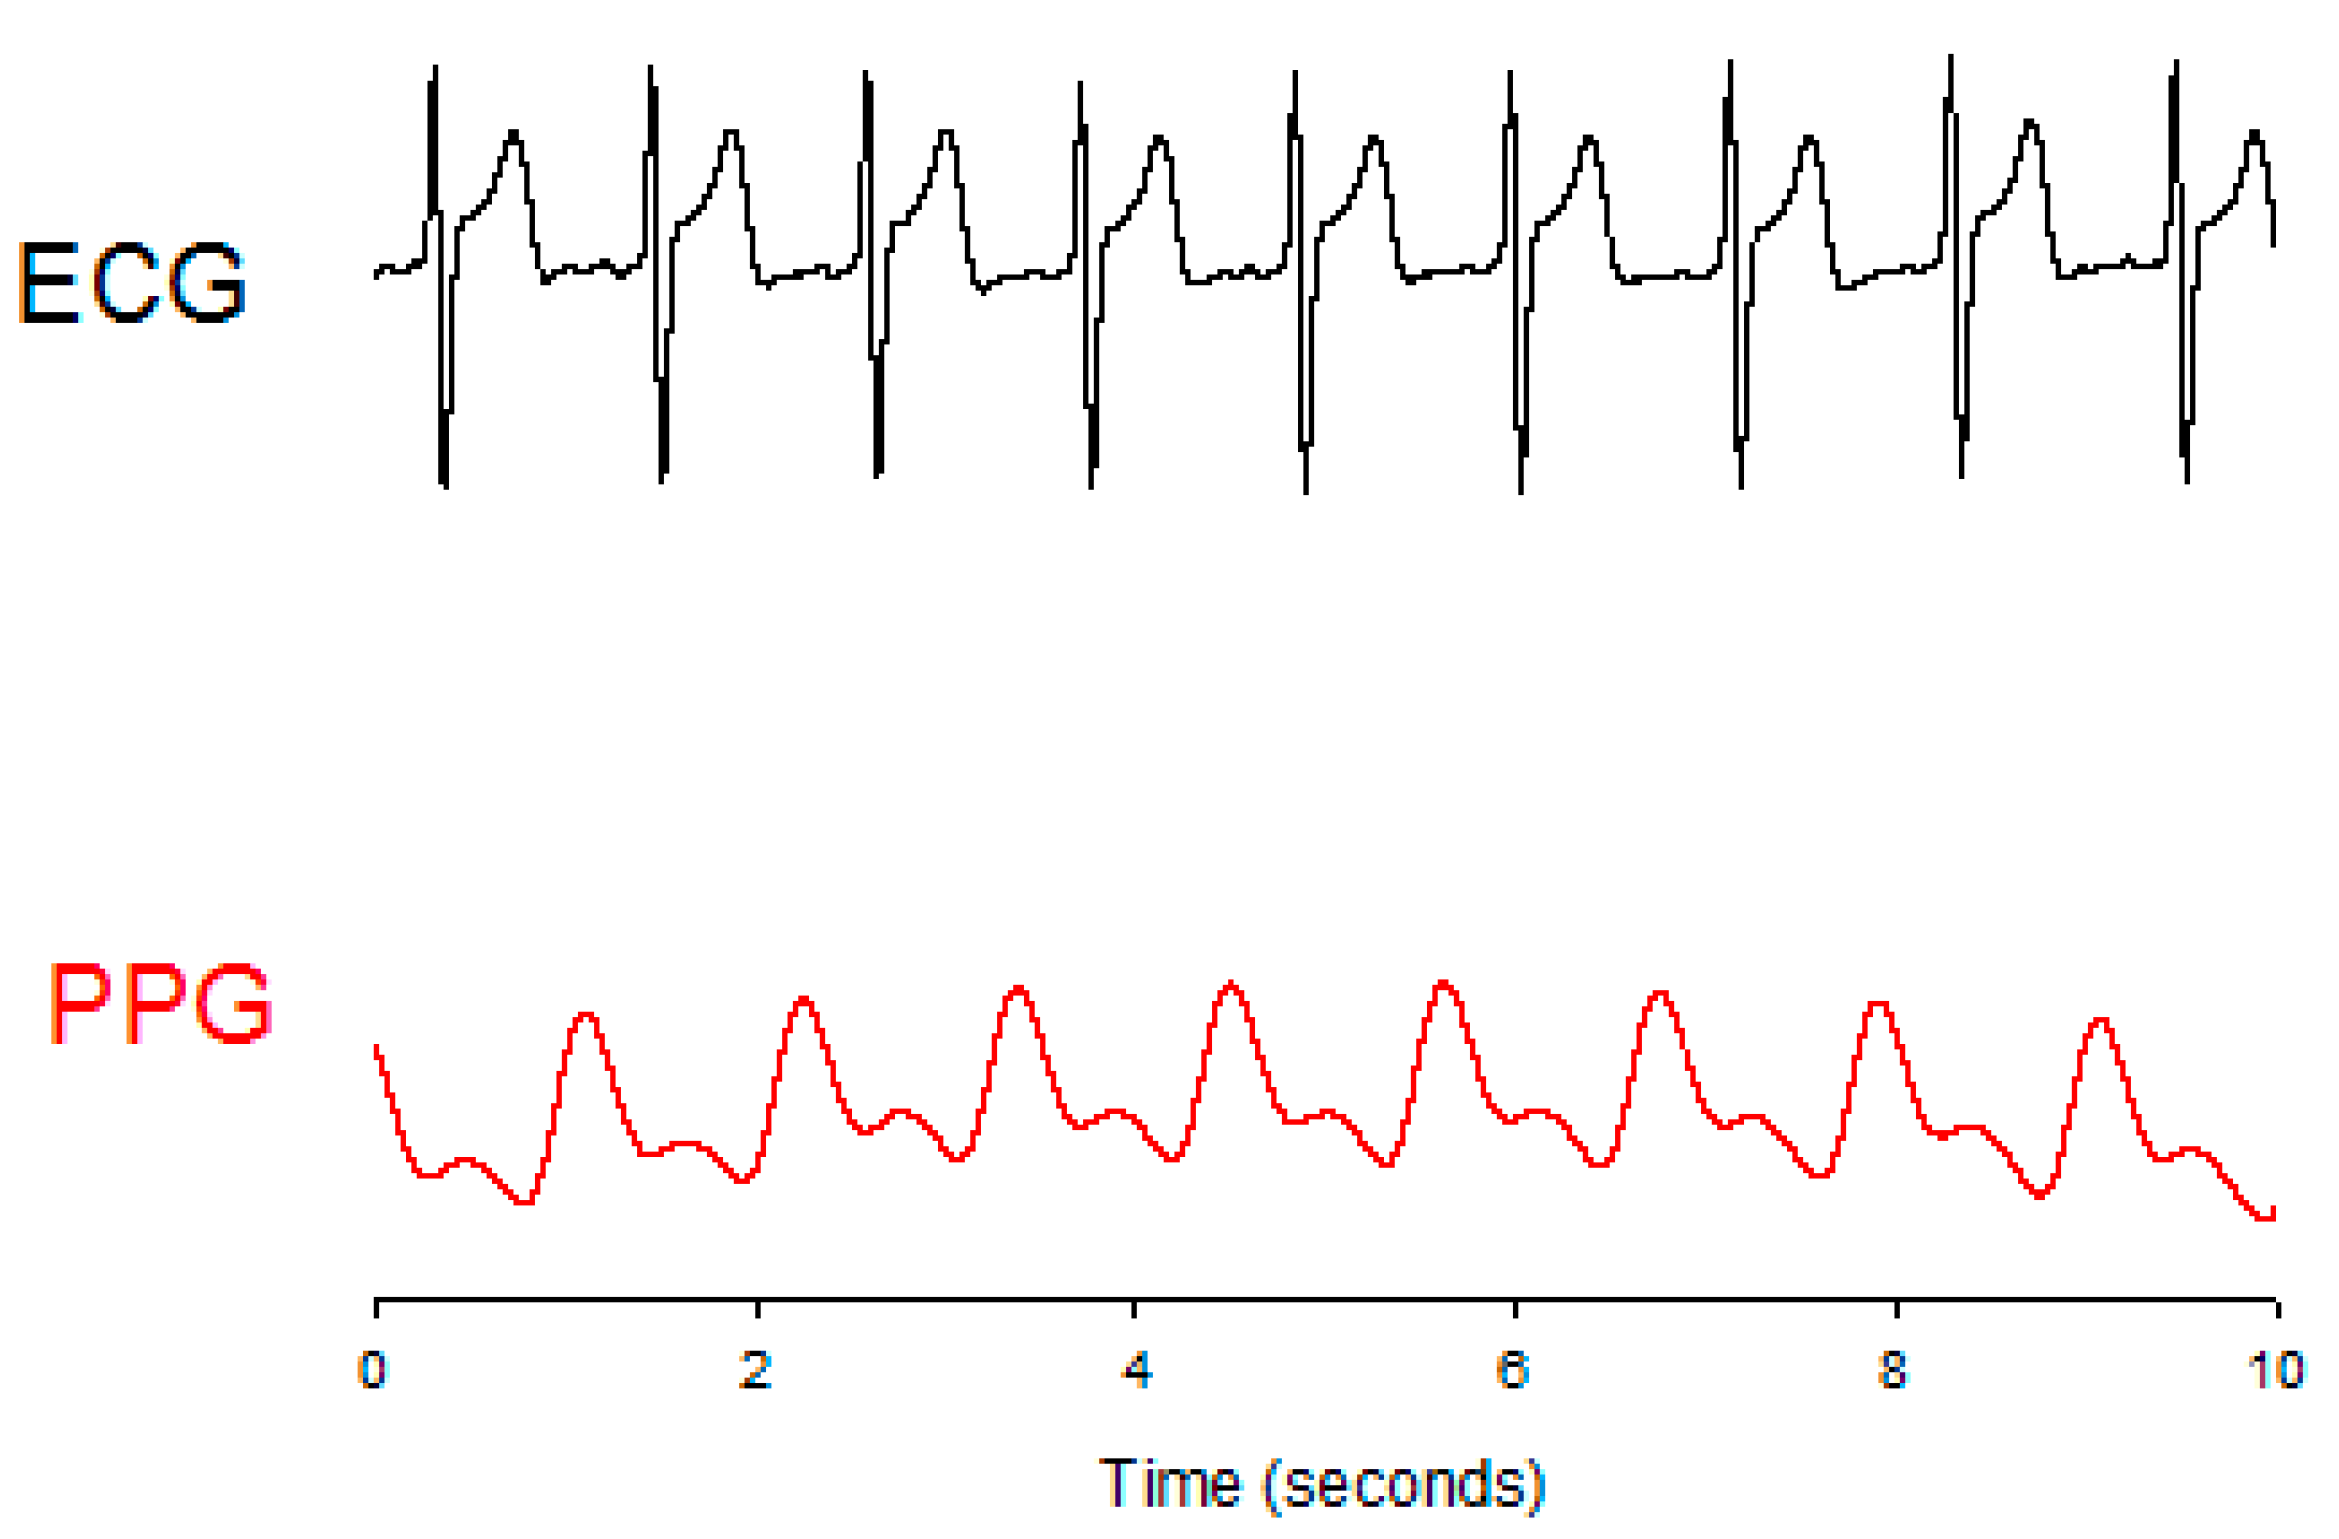
Pulse transit time (PTT)Time interval from the systolic ending of the left ventricular to the specific position of the peripheral artery.
Table 2. Parameter setting of the deep neural network.
ParametersFormula
Number of input feature vector (X) 5
Number of output feature vector (Y) 1
Number of hidden layers: 9
Number of the hidden unit on the hidden layers: {12, 20, 50, 50, 30, 30, 20, 20, 15}
Learning rate for weight 0.01
Learning rate for biases of visible units 0.01
Learning rate for biases of hidden units 0.01
Momentum rate 0.9
Maximum epoch in the pre-training: 10000
Maximum epoch in the fine-training: 10000
Initial weights and biases: randomly between [–1,1]
Table 3. The statistics (mean ± SD) of the maximum and minimum blood pressures of subjects in the five exercises.
SubjectsSystolic Pressure (mmHg)Diastolic Pressure (mmHg)
Max.Min.Max.Min.
1134 ± 11.3105 ± 3.481 ± 3.369 ± 4.4
2139 ± 4.7112 ± 2.878 ± 2.866 ± 3.8
3146 ± 8.3116 ± 3.881 ± 2.167 ± 3.8
4142 ± 5.6116 ± 1.1 81 ± 3.862 ± 5.3
5161 ± 17.1124 ± 4.383 ± 4.867 ± 0.9
6151 ± 12.5114 ± 1.178 ± 2.966 ± 4.0
7146 ± 6.0117 ± 1.769 ± 4.457 ± 3.5
8152 ± 4.8124 ± 6.293 ± 2.781 ± 7.3
9134 ± 8.5105 ± 2.572 ± 5.861 ± 3.5
10133 ± 3.5108 ± 2.274 ± 1.565 ± 1.5
Table 4. The ERMS statistics (mean ± SD) of the estimated blood pressure for ten subjects using only the pulse transit time (PTT) parameter.
Subjects (Samples)Systolic Pressure ERMS (mmHg)Diastolic Pressure ERMS (mmHg)
1 (35)11.95.4
2 (41)5.54.7
3 (37)11.85.1
4 (43)5.55.1
5 (48)6.23.3
6 (35)5.64.4
7 (43)7.53.9
8 (32)13.43.7
9 (41)6.94.2
10 (38)8.05.5
Mean ± SD8.2 ± 3.004.5 ± 0.75
Table 5. The ERMS statistics (mean ± SD) of the estimated systolic pressure for the ten subjects using the parameters of pulse wave and PTT.
Subjects (Samples)All Parameters ERMS (mmHg)PTT HR BD Z0DA2 DPPGv ETR ERMS (mmHg)PTT HR BD Z0DA2 DPPGv ERMS (mmHg)
Number of Parameters1065
DNNMDRDNNMDRDNNMDR
1 (35)7.45.210.08.210.07.9
2 (41)10.34.88.54.38.54.2
3 (37)9.08.68.97.48.98.7
4 (43)7.44.47.44.77.44.6
5 (48)7.54.37.46.37.44.1
6 (35)10.37.310.36.310.36.1
7 (43)11.47.911.57.511.47.3
8 (32)12.916.112.913.712.913.6
9 (41)9.16.79.06.09.16.0
10 (38)9.37.39.36.99.26.9
Mean ± SD 9.5 ± 1.827.3 ± 3.469.5 ± 1.737.1 ± 2.609.5 ± 1.716.9 ± 2.81
DNN: deep neural network, MDR: multi-dimension regression, SD: standard deviation.
Table 6. The ERMS statistics (mean ± SD) of the estimated diastolic pressure for the ten subjects with the parameters of pulse wave and PTT.
Subjects (samples)All Parameters ERMS (mmHg)HR PTT BD DPPGv ETR Z0DA2 ERMS (mmHg)ERMS (mmHg)HR PTT BD DPPGv ETR ERMS (mmHg)
Number of Parameters1065
DNNMDRDNNMDRDNNMDR
1 (35)5.33.85.23.65.13.5
2 (41)4.93.44.94.14.93.9
3 (37)4.14.24.14.04.14.8
4 (43)5.64.65.54.55.64.4
5 (48)3.73.83.73.43.63.4
6 (35)5.04.35.03.95.03.8
7 (43)4.94.14.93.65.03.7
8 (32)4.24.04.23.34.23.6
9 (41)4.74.04.63.84.73.6
10 (38)4.96.14.95.74.95.4
Mean ± SD 4.7 ± 0.584.2 ± 0.734.7 ± 0.554.0 ± 0.704.7 ± 0.584.0 ± 0.65
DNN: deep neural network, MDR: multi-dimension regression, SD: standard deviation.

