Article

Effect of Particulate Disintegration on Biomethane Potential of Particle-Rich Substrates in Batch Anaerobic Reactor

Department of Process, Energy and Environmental Technology, University of South-Eastern Norway, Kjølnes Ring 56, NO 3918 Porsgrunn, Norway
*
Author to whom correspondence should be addressed.
Appl. Sci. 2019, 9(14), 2880; https://doi.org/10.3390/app9142880
Submission received: 24 June 2019 / Revised: 11 July 2019 / Accepted: 15 July 2019 / Published: 18 July 2019
(This article belongs to the Special Issue Anaerobic Co-Digestion of Lignocellulosic Waste)

Abstract

:

Featured Application

The findings in this article contribute to understanding solid particle disintegration and hydrolysis kinetics and how the presence of solid particulates in the form of lignocellulosic substances affect biomethane production rate and yield. It has a potential application in anaerobic digestion of particle-rich feeds in high-rate reactors.

Abstract

An investigation of particle disintegration was carried out using batch anaerobic reactors and a particle-rich substrate from pig manure supernatant. Two types of samples were applied, one high in suspended particles (raw feed) and another low in suspended particle content (centrifuged feed). Both feeds were digested with and without cellulase enzyme addition to obtain a better understanding of particle degradation mechanisms. An automatic methane potential test system (AMPTS) was used to carry out batch reactions at 35 °C. The raw feed with high-suspended solids had higher biomethane potential than the centrifuged feed but the conversion rate and methane yield was lower. The addition of cellulase increased biomethane production rates in both high- and low-particle content samples enhancing yield by 54% and 40%, respectively and converting 69% and 87% of feed chemical oxygen demand (COD), respectively. This implies that the feed particles have high contents of cellulose. This is also the case for the smaller particles remaining after centrifugation. Comparisons of anaerobic digestion model no. 1 (ADM1) simulations with experimental data reveal that classifying substrate particles into a fast and a slow degrading fraction with separate disintegration kinetics fit the experimental data better than lumping all particles into one parameter.

1. Introduction

Biomethane potential (BMP) test is an anaerobic digestion carried out, normally, in batch reactors for a prolonged time in order to estimate the ultimate biomethane or biogas potential of a specific substrate. There is no defined volume for batch reactors but volumes 0.5–1 L are often used. The substrate and inoculum used during anaerobic digestion are characterized in terms of total and soluble chemical oxygen demand (COD), total and volatile solids (TS and VS) as well as various other parameters (Table 1). The theoretical biomethane potential is calculated using various chemical equation relationships and compared with the estimate from the BMP tests in terms of yield, such as L CH4/g VS or g CH4 COD/g feed COD. BMP tests are widely used due to their low cost, simplicity and repeatability. Even though BMP tests take a relatively long time, usually longer than 30 days [1], they are crucial in assessing design parameters for full-scale anaerobic reactors. Full-scale reactors, especially those that are high-rate, often face difficulty in achieving the full biomethane potential of particle-rich substrates due to slow degradation of solid particles. Significant parts of the organic substances contained in the substrate remain undigested, limiting the efficiency of the reactors. It is important to unlock the biomethane potential of such substrates. Particle-rich substrates such as the organic fraction of municipal solid waste (OFMSW) and manure are abundantly available resources that are prime candidates for anaerobic digestion and biomethane production. If the problem of slow solid disintegration were solved, the efficiency of high-rate digestion of particle-rich substrates such as manure would be greatly improved. Estimating the BMP of particle-rich substrates is one of the steps towards achieving that goal. In this article, we aim to clarify the effect of solid particle content on disintegration and hydrolysis of substrates by comparing batch test results from high-particle and low-particle substrates. The tests were carried out with and without the addition of enzyme to obtain a better understanding of the limiting factors in disintegration of particulates. Finally, we aim to establish a simple but adequate kinetic model that uses classification of complex particulates into fast and slow degrading fractions to accurately represent the disintegration of particle-rich substrates.

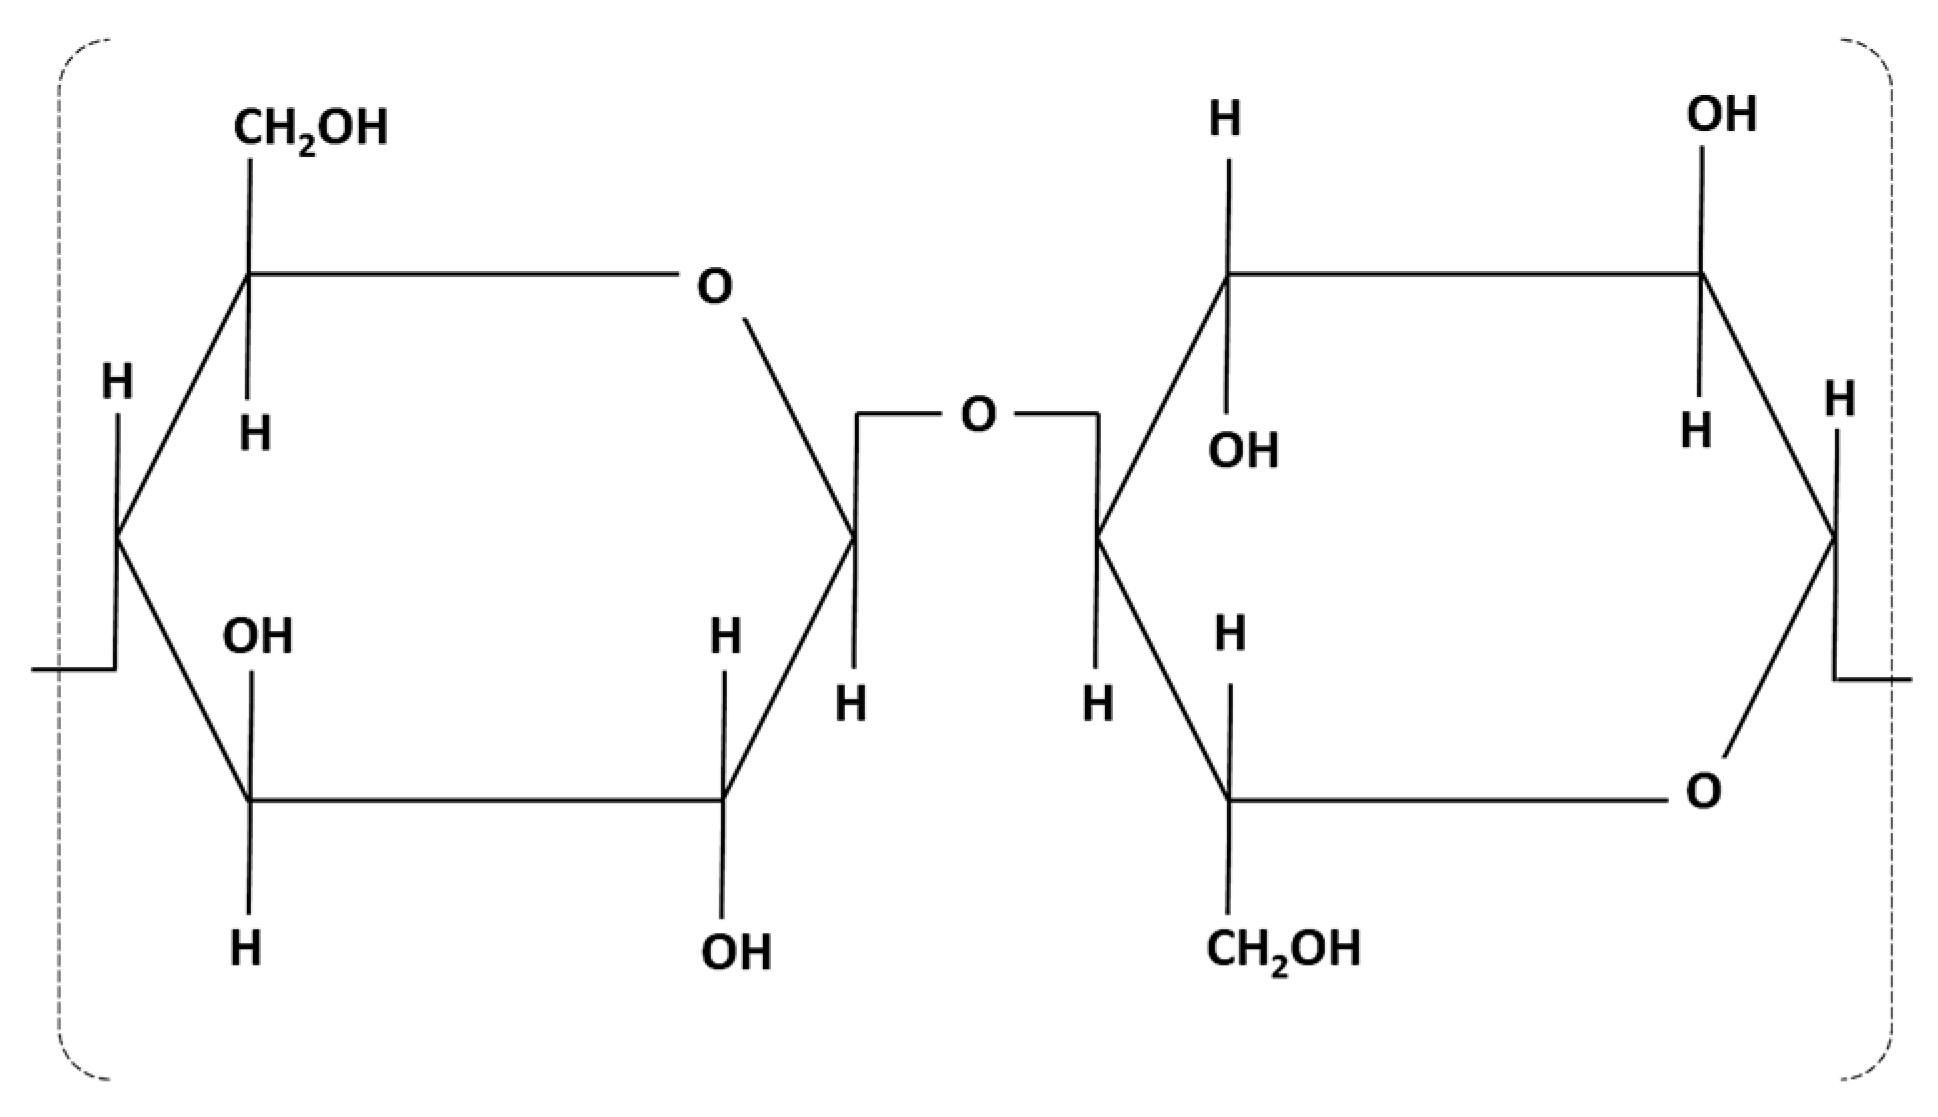
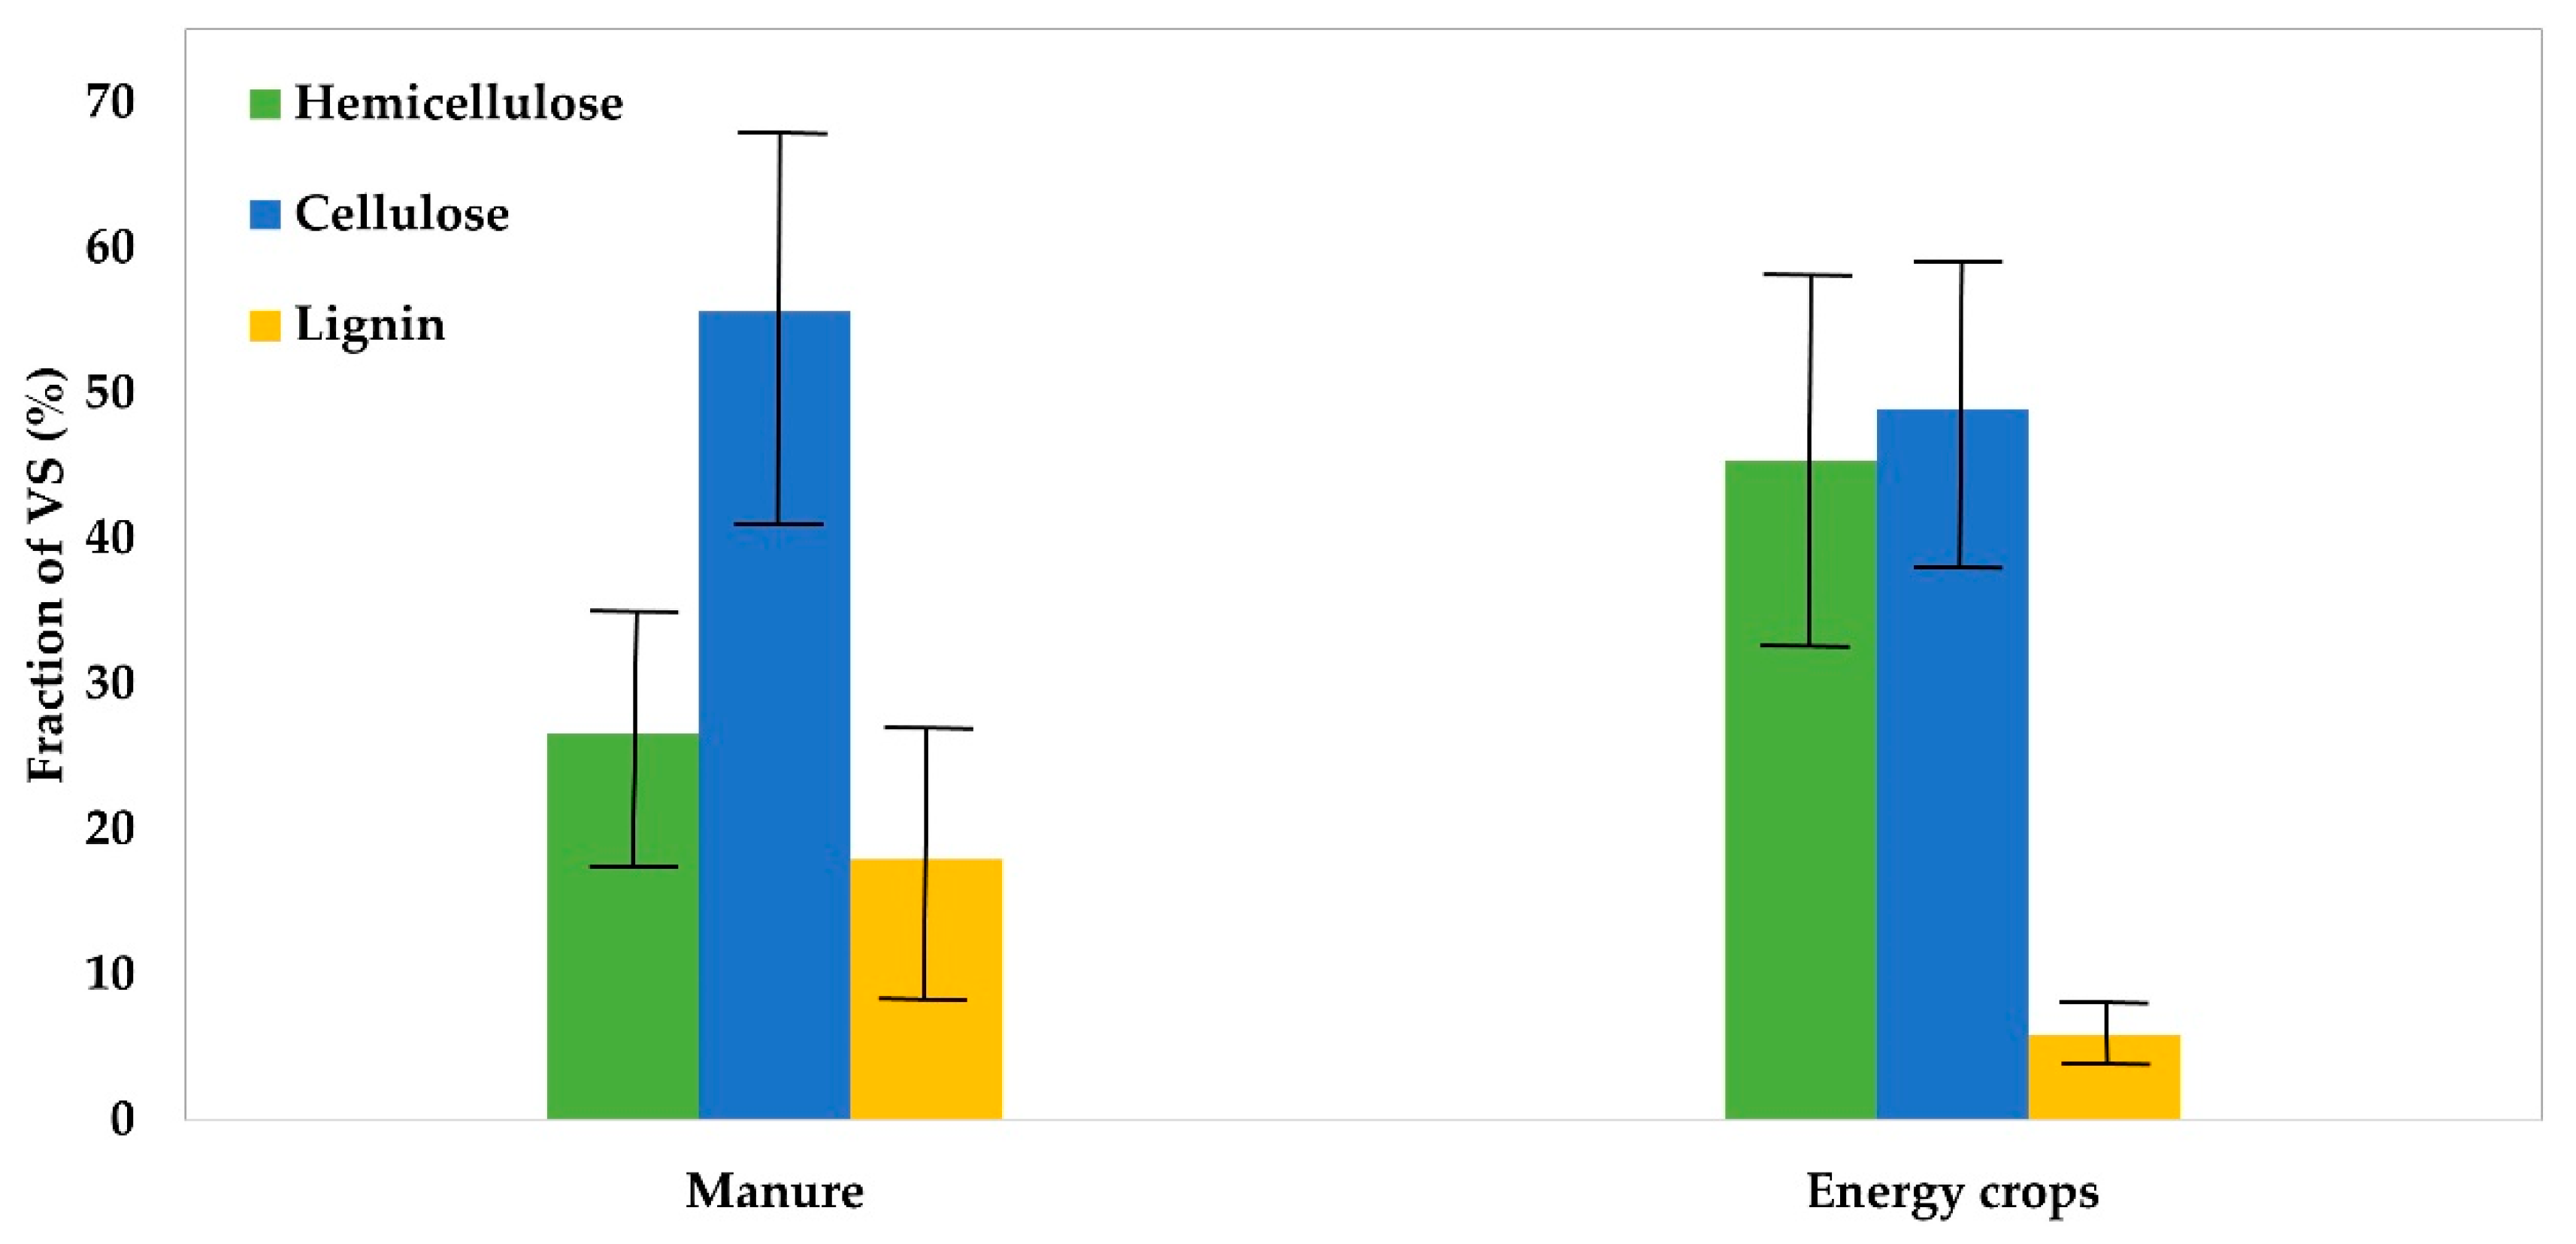
1.1. Lignocellulosic Substances

Presence of lignocellulosic substances in substrates is one of the main reasons for the low conversion efficiency of particle-rich substrates. Lignocellulosic substances consist of three biopolymers called cellulose, hemicellulose and lignin that are present in the cell walls of plant matter. The relative composition of the polymers differs from plant to plant. Hardwoods and softwoods contain a relatively high amount of cellulose whereas straws and grass contain higher hemicellulose content [2]. Glucose molecules are linked through beta-(1,4) glycosidic bonds to form a disaccharide that is polymerized into cellulose (Figure 1). Cellulose is homogenous because it is formed from a single monosaccharide. Hemicellulose, on the other hand, is formed from several monosaccharides including xylose and glucose. This results in a heterogeneous polymer that is more amorphous and has a more hydrolysable structure than that of cellulose. Lignin is made up of phenol-based monomers that are cross-linked to form a large and complex chemical structure that is chemically and biologically resistant to degradation.
Particle-rich substrates such as manure slurry contain a significant amount of lignocellulosic substances [3]. The source of such lignocellulosic substances is plant matter that is fed to the animals and used as bedding material for the animals. Readily biodegradable material in the animal feed is absorbed in the intestine and the leftover manure is composed of a substantial amount of lignocellulosic matter that is difficult to biodegrade. Up to 40–50% of the total solids in manure are lignocellulosic substances [3]. Lignocellulosic substances are difficult to biodegrade because their composite structure limits the accessibility of substrates by hydrolyzing enzymes [4]. A total of 20–300 monomers of cellulose are bound together by hydrogen and Van der Waals forces to make packed cellulosic microfibrils. The microfibrils are mostly in crystalline form and their outer layer is covered with hemicellulose chains. Lignin polymer binds the cellulosic microfibrils and hemicelluloses together and acts like a “glue” to form a rigid macromolecular structure that is inaccessible for enzymatic attack. Due to this reinforced concrete-like structure, disintegration and hydrolysis are difficult. By some estimates, up to 80% of lignocellulosic substances remain undegraded in biogas reactors [5]. The composition of the lignocellulosic content of manure differs from animal to animal as well as the age of the animal. For swine manure, typical cellulose, hemicellulose and lignin contents are 30–50%, 20–30% and 10–20%, respectively (Figure 2). Despite favorable qualities such as abundance, easy availability and being renewable, lignocellulosic substances have not been efficiently used for biogas production due to their strong resistance to biodegradation. Various physical, chemical and biological methods were tried to unlock the biogas potential of lignocellulosic substances with various degrees of success. One of these methods involves the addition of enzymes to facilitate the breakdown of lignocellulose components into their monosaccharides. Bacteria naturally secrete enzymes such as cellulase and hemicellulase that facilitate hydrolysis of lignocellulosic substances. Both cellulase and hemicellulase are groups of several enzymes that can carry out cellulolysis and hemicellulolysis. Other microorganisms such as fungi are also known to produce enzymes that hydrolyze lignocellulose substances. Identifying and isolating enzymes for lignocellulose hydrolysis is a growing field of research due to the advantages associated with enzymatic hydrolysis of lignocellulose such as increased biogas yield and low energy demand [6,7]. Several authors reported an increased biogas yield due to the addition of hydrolytic enzymes [8,9,10]. The increase in biogas yield due to the addition of enzymes depends on the type and concentration of enzymes added, temperature, pH and other parameters. There are commercially available cocktails of hydrolytic enzymes that are extracted from various microorganisms including fungi.

1.2. Hydrolysis Kinetics

Hydrolysis is often assumed to be a first-order reaction [12,13] and its rate can be determined using batch reactor tests. Biomethane potential (BMP) and hydrolysis rate constant (Kh) are obtained by performing data fitting from batch reactor data. First-order kinetics is the simplest and most common hydrolysis rate expression.
dX dt = K h   X
dX ch dt = K h , ch   X ch
dX pr dt = K h , pr   X pr
dX li dt = K h , li   X li
where dX/dt is hydrolysis rate in kg CODm−3d−1, Kh is hydrolysis rate constant in d−1, X is the particulate component in kg CODm−3 and subscripts ch, pr, and li denote carbohydrate, protein and lipid, respectively. Angelidaki et al. [14] proposed a protocol for the determination of Kh from batch tests using an integrated form of the generalized hydrolysis rate expression (Equation (1a)).
ln X X X =   K h   t
X =   X ( 1 e K h   t )
where, X is the value of ultimate methane production and X is the amount of methane produced at a given time, t. After batch test data are collected, a graph is plotted where Kh is determined as a slope of ln X X X and t. The last day of the batch test should be when the difference between biogas productions at day n and day n + 1 is less than or equal to 1% of the cumulative biogas production. This is in accordance with the German Guideline VDI 4630 for BMP estimation [15]. The value of Kh is important because it is a unique characteristic of a substrate and it can be used to assess the suitability of a given substrate for anaerobic digestion. It tells us how much time it takes to reach a certain percentage of the ultimate methane production [16]. There are also other methods to determine Kh experimentally such as the one suggested by Eastman and Ferguson [17].

2. Materials and Methods

Two swine manure slurry samples, with high- and low-suspended particle content, were applied. Both samples were digested with and without cellulase enzyme addition. Automatic methane potential test system (AMPTS) was used to carry out batch reactions at 35 °C. The digestion, without cellulase enzyme addition, was simulated in anaerobic digestion model no. 1 (ADM1) using two disintegration constants to describe fast and slow digestible particles.

2.1. Sample Preparation

Swine manure slurry was collected at a swine production farm in Porsgrunn, Norway. Samples were collected at various depths in intermediate indoor storage and mixed. In order to avoid the thick solid mass found at the bottom of the storage, sampling was made only in the top half of the storage. The samples still contained a substantial amount of suspended solids. This mixed sample was labelled “Raw feed” (RF). One additional sample called “Centrifuged feed” (CF) was prepared by centrifuging the raw feed sample and discarding most of the solids, thereby reducing the total and suspended solid contents. A high-speed centrifuge was used to carry out centrifugation (Beckman J-25, with JA-10 rotor). All samples were characterized immediately after preparation and kept in a refrigerator at 4 °C until they were transferred to the reactor bottles. Two separate sample groups were also prepared by adding 1.2 g cellulase in 75 mL of both RF and CF samples to form RF-cellulase (RF-CEL) and CF-cellulase (CF-CEL), respectively (Table 2). Two types of blanks were prepared, one that contained only distilled water and inoculum (BLANK) and another one that contained distilled water, inoculum and 1.2 g cellulase (BLANK-CEL). Preliminary tests, as well as reviews of works by other authors, indicated that low enzyme concentration might lead to an insignificant increase in biogas yield. As a result, we decided to use a relatively high concentration of enzyme so that the enzymatic effects are sufficiently noticeable (used 1.2 g enzyme/1.03 g VS for RF and 1.2 g Enzyme/0.44 g VS for CF).

2.2. Sample Analysis

Total solids (TS), volatile solids (VS), total suspended solids (TSS) and volatile suspended solids (VSS) of samples were measured according to the American public health association standard method 2540 (APHA 1999) [18]. Total and soluble COD of feed samples were also measured according to the APHA standard (method 5220 D). Sample pH was measured using a Beckman 300 pH meter equipped with Sentix-82 pH electrode. Ammonium–nitrogen content (NH4+-N) was measured according to APHA 4500-NH3. Both COD and NH4+-N concentrations were measured using commercially available test kits and Spectroquant Pharo 300 spectrophotometer (Darmstadt, Germany). Total and individual VFA (volatile fatty acid) content of samples were measured using an Agilent gas chromatography flame ionization detector (GC-FID). Sample characterization results are provided in Table 1 and VFA concentrations are provided in Table 3. Total and volatile solids contents of granular sludge were also measured as a mass percentage (% w/w) according to AMPTS II manual (Bioprocess control 2016) [19].

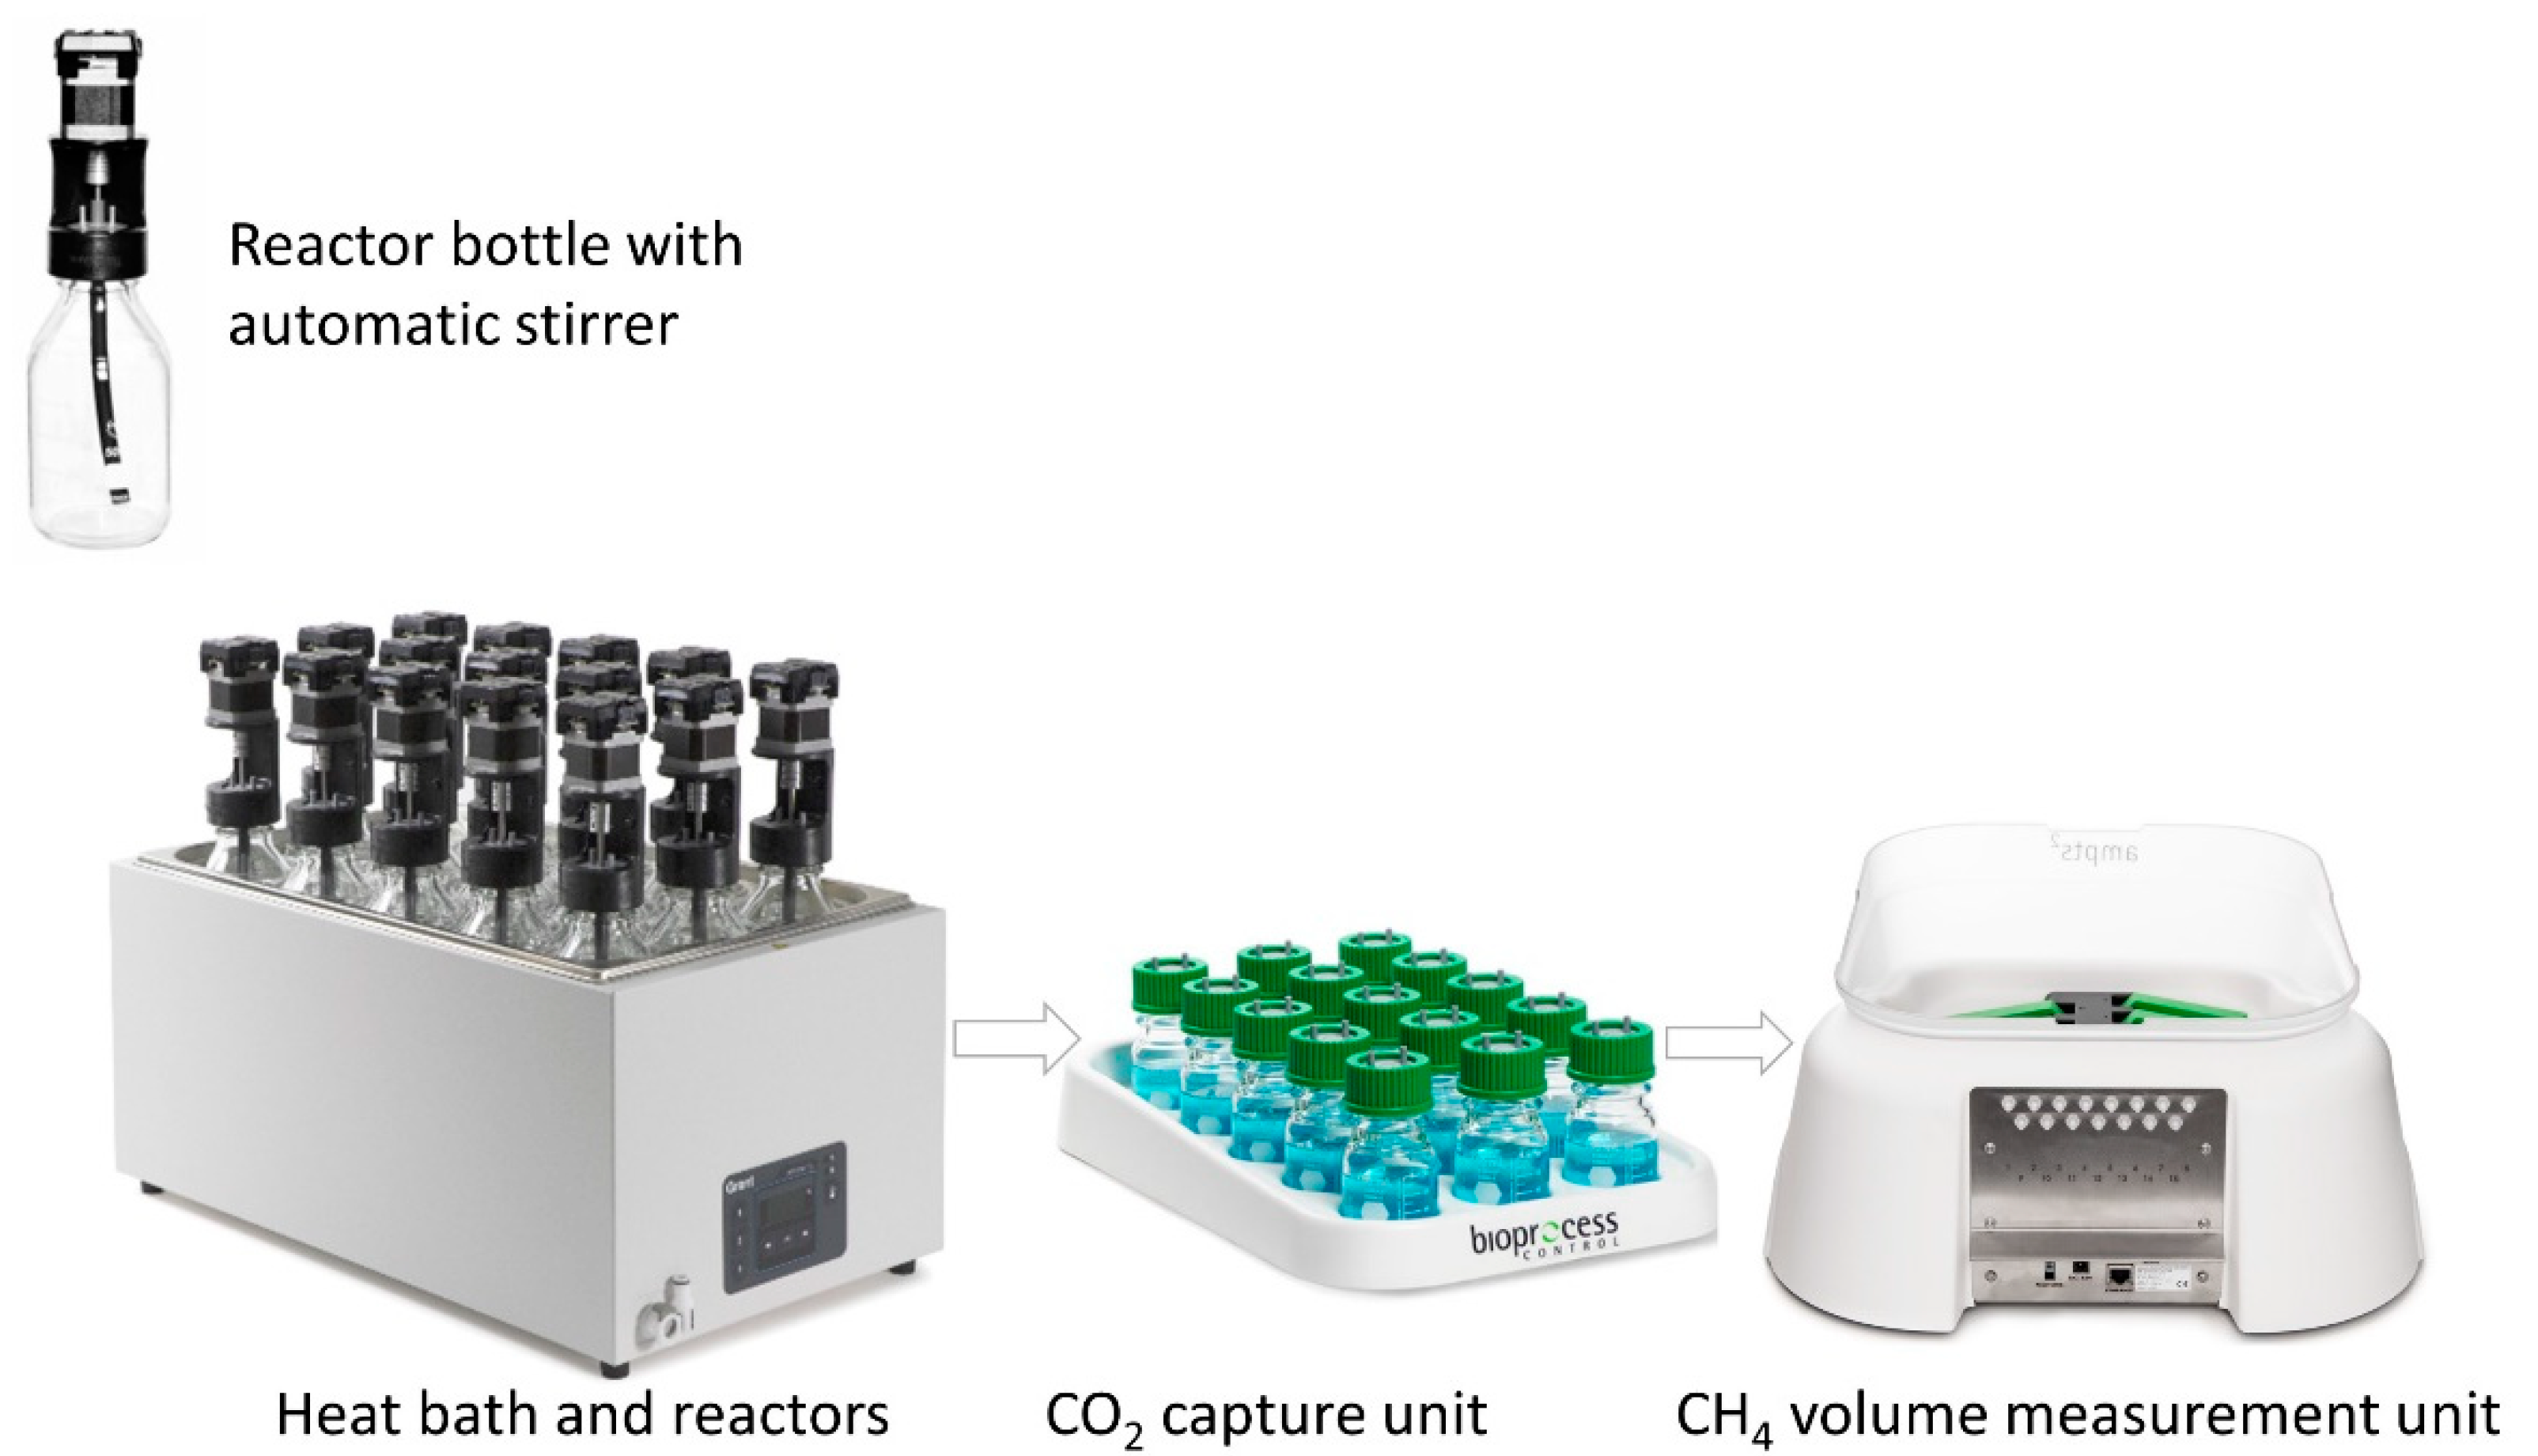
2.3. Reactor and Experimental Procedure

Automatic methane potential test system (AMPTS II) from Bioprocess control, Sweden was used to carry out batch anaerobic digestion experiments [19]. The instrument includes a water bath, a CO2 removal set-up using NaOH, adjustable motor stirrers and an apparatus for the measurement of methane flow (Figure 3). In addition, the instrument provides software to control/monitor reactor settings and plot gas measurement. The batch test was carried out in three parallels for RF, RF-CEL, CF and CF-CEL samples. The maximum number of batch reactors in the AMPTS II set up was 15 allowing two parallels for BLANK and only one parallel for BLANK-CEL. The experiment was carried out at 35 °C. Reactor contents were stirred every hour to allow proper mixing and to facilitate gas removal from the reactors.

2.4. Granular Sludge Degassing

A mixture of granules from various sources was used as inoculum for the batch experiments (mainly granules that have been used to treat wastewater from pulp and paper industry mixed with granules obtained from econvert Water & Energy, Heerenveen, the Netherlands). The granules were degassed before samples were added [14]. Degassing was performed by placing granule containers in a water bath at the reaction temperature (35 °C) for 10 days. The total solid and volatile solid contents of the granule were measured after degassing.

2.5. CO2 Removal

The CO2 removal set-up requires solution preparation and the following solutions were prepared [19]. A solution of 1.2 L NaOH (3 M) was prepared by mixing 144 g of NaOH in 1.2 L distilled water. pH indicator thymolphthalein solution (0.4%) was prepared by mixing 40 mg of thymolphthalein in 9 mL of ethanol (99.5%) and 1 mL distilled water. A total of 6 mL of the thymolphthalein solution was added into 1.2 L NaOH solution. The resulting mixture was transferred to CO2 removal bottles, one for each batch test and each with an 80 mL mixture. The thymolphthalein-NaOH mixture has a bright blue color and when enough CO2 is absorbed, the blue color fades and becomes colorless. Thymolphthalein is bright blue in basic solutions but it turns colorless in acidic or neutral solutions. At this point, a new mixture has to be used. According to the CO2 removal manual, this method absorbs more than 98% of CO2 produced during the biogas production process. The removal is based on the following reaction [20]:
CO 2   ( g )     CO 2   ( aq )  
CO 2   ( aq ) +   OH ( aq )     HCO 3 ( aq )
HCO 3 ( aq ) +   OH ( aq )     CO 3   ( aq ) 2 +   H 2 O ( l )

2.6. Theoretical Methane Yield

Theoretical methane yield was calculated based on the total COD of RF and CF samples. Theoretical calculation was performed as follows [21].
a. Determine COD equivalent of methane:
One mole of methane requires two moles of oxygen, meaning the chemical oxygen demand of methane is:
CH 4 +   2 O 2       CO 2 +   2 H 2 O
COD/mole CH4 = 2 × 32 g O2/mole = 64 g O2/mole
b. Determine the theoretical volume of methane based on g COD
The volume of a mole of methane gas at standard conditions of 0 °C and one atm (atmospheric pressure) is 22.4 L. The theoretical volume of methane that can be obtained from a gram of COD is calculated as:
22.4 L CH4/64 g COD = 0.35 L CH4/g COD
To calculate the theoretical methane yield at 35 °C, we used the ideal gas law:
P 1 V 1 T 1 = P 2 V 2 T 2 = Constant
Yield   at   35   ° C   =   ( 1   atm ) ( 0.35   LCH 4 / g   COD ) ( 308.15   K ) ( 1   atm ) ( 298.15   K ) = 0.36   LCH 4 / g   COD
c. Calculate theoretical methane yield of sample
Theoretical methane yields of all samples were calculated from total COD, sample volume and the value for yield at 35 °C.
CH 4   yield   of   sample   ( L ) =   ( COD total ) ( V sample ) ( 0.36   LCH 4 / g   COD )
d. Compare theoretical and experimental methane yield
Experimental methane yield was corrected by subtracting the average volume of methane produced by blank parallels (VB1, VB2, VB3) from that of samples (VP1, VP2, VP3).
Experimental   CH 4   yield   ( L ) =   ( V P 1 + V P 2 + V P 3 ) N sample     ( V B 1 + V B 2 + V B 3 ) N blank

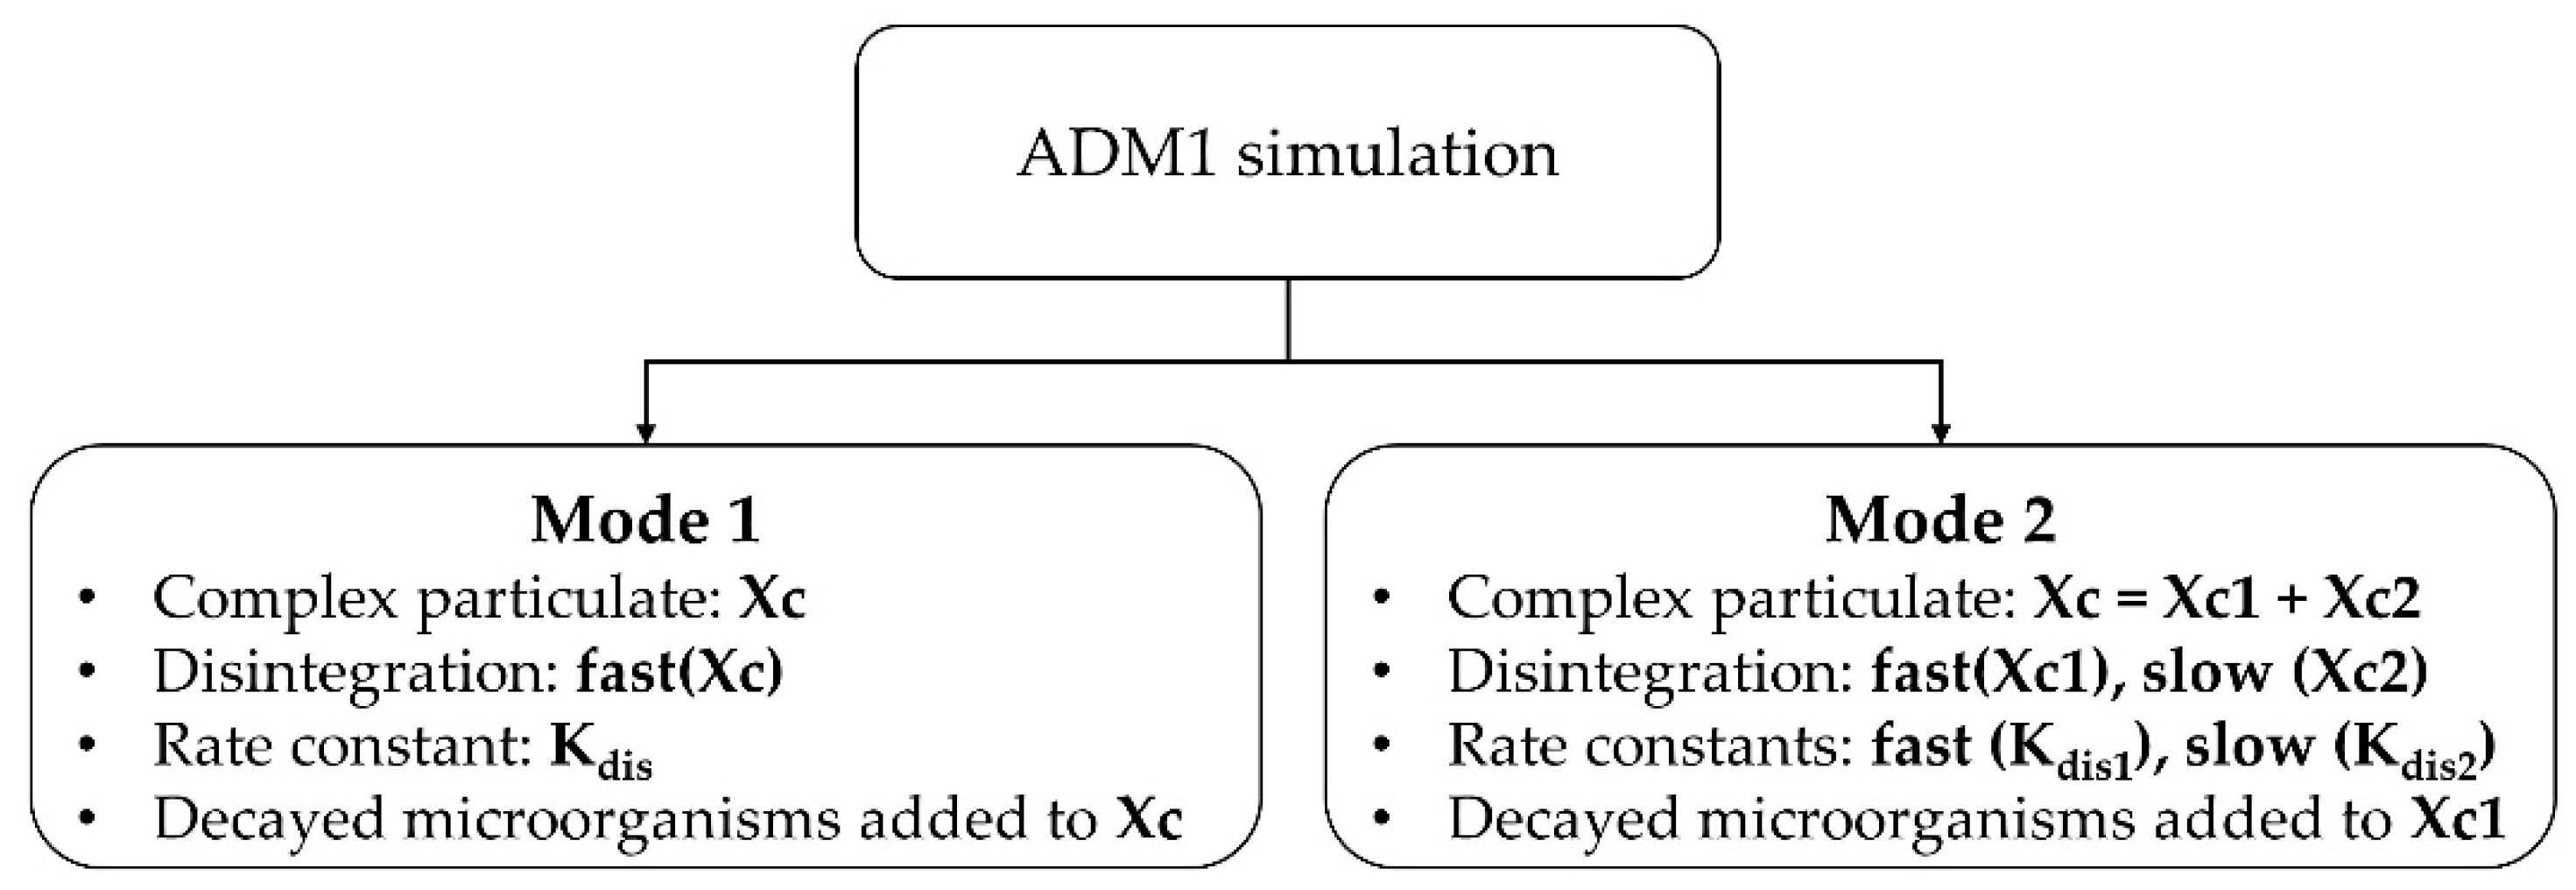
2.7. Anaerobic Digestion Model No. 1 (ADM1) Simulation

Aquasim software was used to implement the ADM1 model to simulate the batch reactors (Table 4). Two modes of disintegration kinetics were used. In the first mode, first-order disintegration kinetics was used, and all complex particulates were assumed to be equally degradable (single disintegration constant, Kdis used). In the second mode, the complex particulates were classified into fast degrading and slow degrading fractions, where two separate disintegration constants, Kdis1 for fast degrading and Kdis2 for slow degrading fractions, were used (Figure 4).
Classification of particulates into fast degrading and slow degrading was carried out as follows:
a. Calculate particulate COD (Xc)
Particulate COD = CODtotal − CODsoluble
CODtotal = Total g COD in reactor/Vreactor = Sample CODtotal × Vsample/Vreactor
For simplification of the simulation, soluble COD was assumed to equal to COD of volatile fatty acids (CODVFA) and some minor constituents as seen in Table 4, according to Equation (13).
CODsoluble = CODVFA + (CODsoluble amino acids + CODsoluble fatty acids + CODsoluble inerts + CODsoluble sugars)
b. Classify particulate COD into fast (Xc1) and slow (Xc2) degrading fractions:
Classification of Xc into Xc1 and Xc2 was carried out separately for RF and CF. The ratio of total dissolved solids to total solids was used as a basis to estimate the fast degrading fraction (Xc1) from which Xc2 was estimated (Xc2 = 1 − Xc1). Since RF contains a relatively large fraction of solid particulates, it was estimated that 85% of the COD comes from slowly degrading fragments and the rest from fast degrading fragments. In the case of CF, most of the solid particulates are removed due to centrifugation making COD from solid particles constitute a small part of the total COD. We estimated that 15% of COD comes from slow degrading and 85% comes from fast degrading particulates.
For RF:
Particulate COD (Xc) = (33.24 g COD/L sample × 0.075 L sample / 0.275 L) − (1.35 g/L) = 7.72 g COD/L
Xc1 = 0.85 × 7.72 g COD/L = 6.56 g COD/L
Xc2 = 0.15 × 7.72 g COD/L = 1.16 g COD/L
For CF:
Particulate COD (Xc) = (19.74 g COD/L sample × 0.075 L sample / 0.275 L) − (1.35 g/L) = 4.03 g COD/L
Xc1 = 0.15 × 4.03 g COD/L = 0.605 g COD/L
Xc2 = 0.85 × 4.03 g COD/L = 3.43 g COD/L
Based on suggestions from preliminary experimental data and literature survey [22], we used Kdis value of 0.17 d−1 for swine manure samples. For fast degrading fraction, Kdis1 stays at 0.17 d−1 and for Kdis2 we used 0.075 d−1 (~45% of Kdis1, estimated from biogas production data for straws, fibers and other solids). We used hydrolysis constants (10 d−1) as suggested by Batstone et al. [23].
In the ADM1 model, decayed microorganisms are added into complex particulates (Xc). In the first mode of simulation, there is no change; all decayed microorganisms are added back to Xc, however, in the second mode, the decayed microorganisms are recycled back to the fast degrading (Xc1) fraction only.

3. Result and Discussion
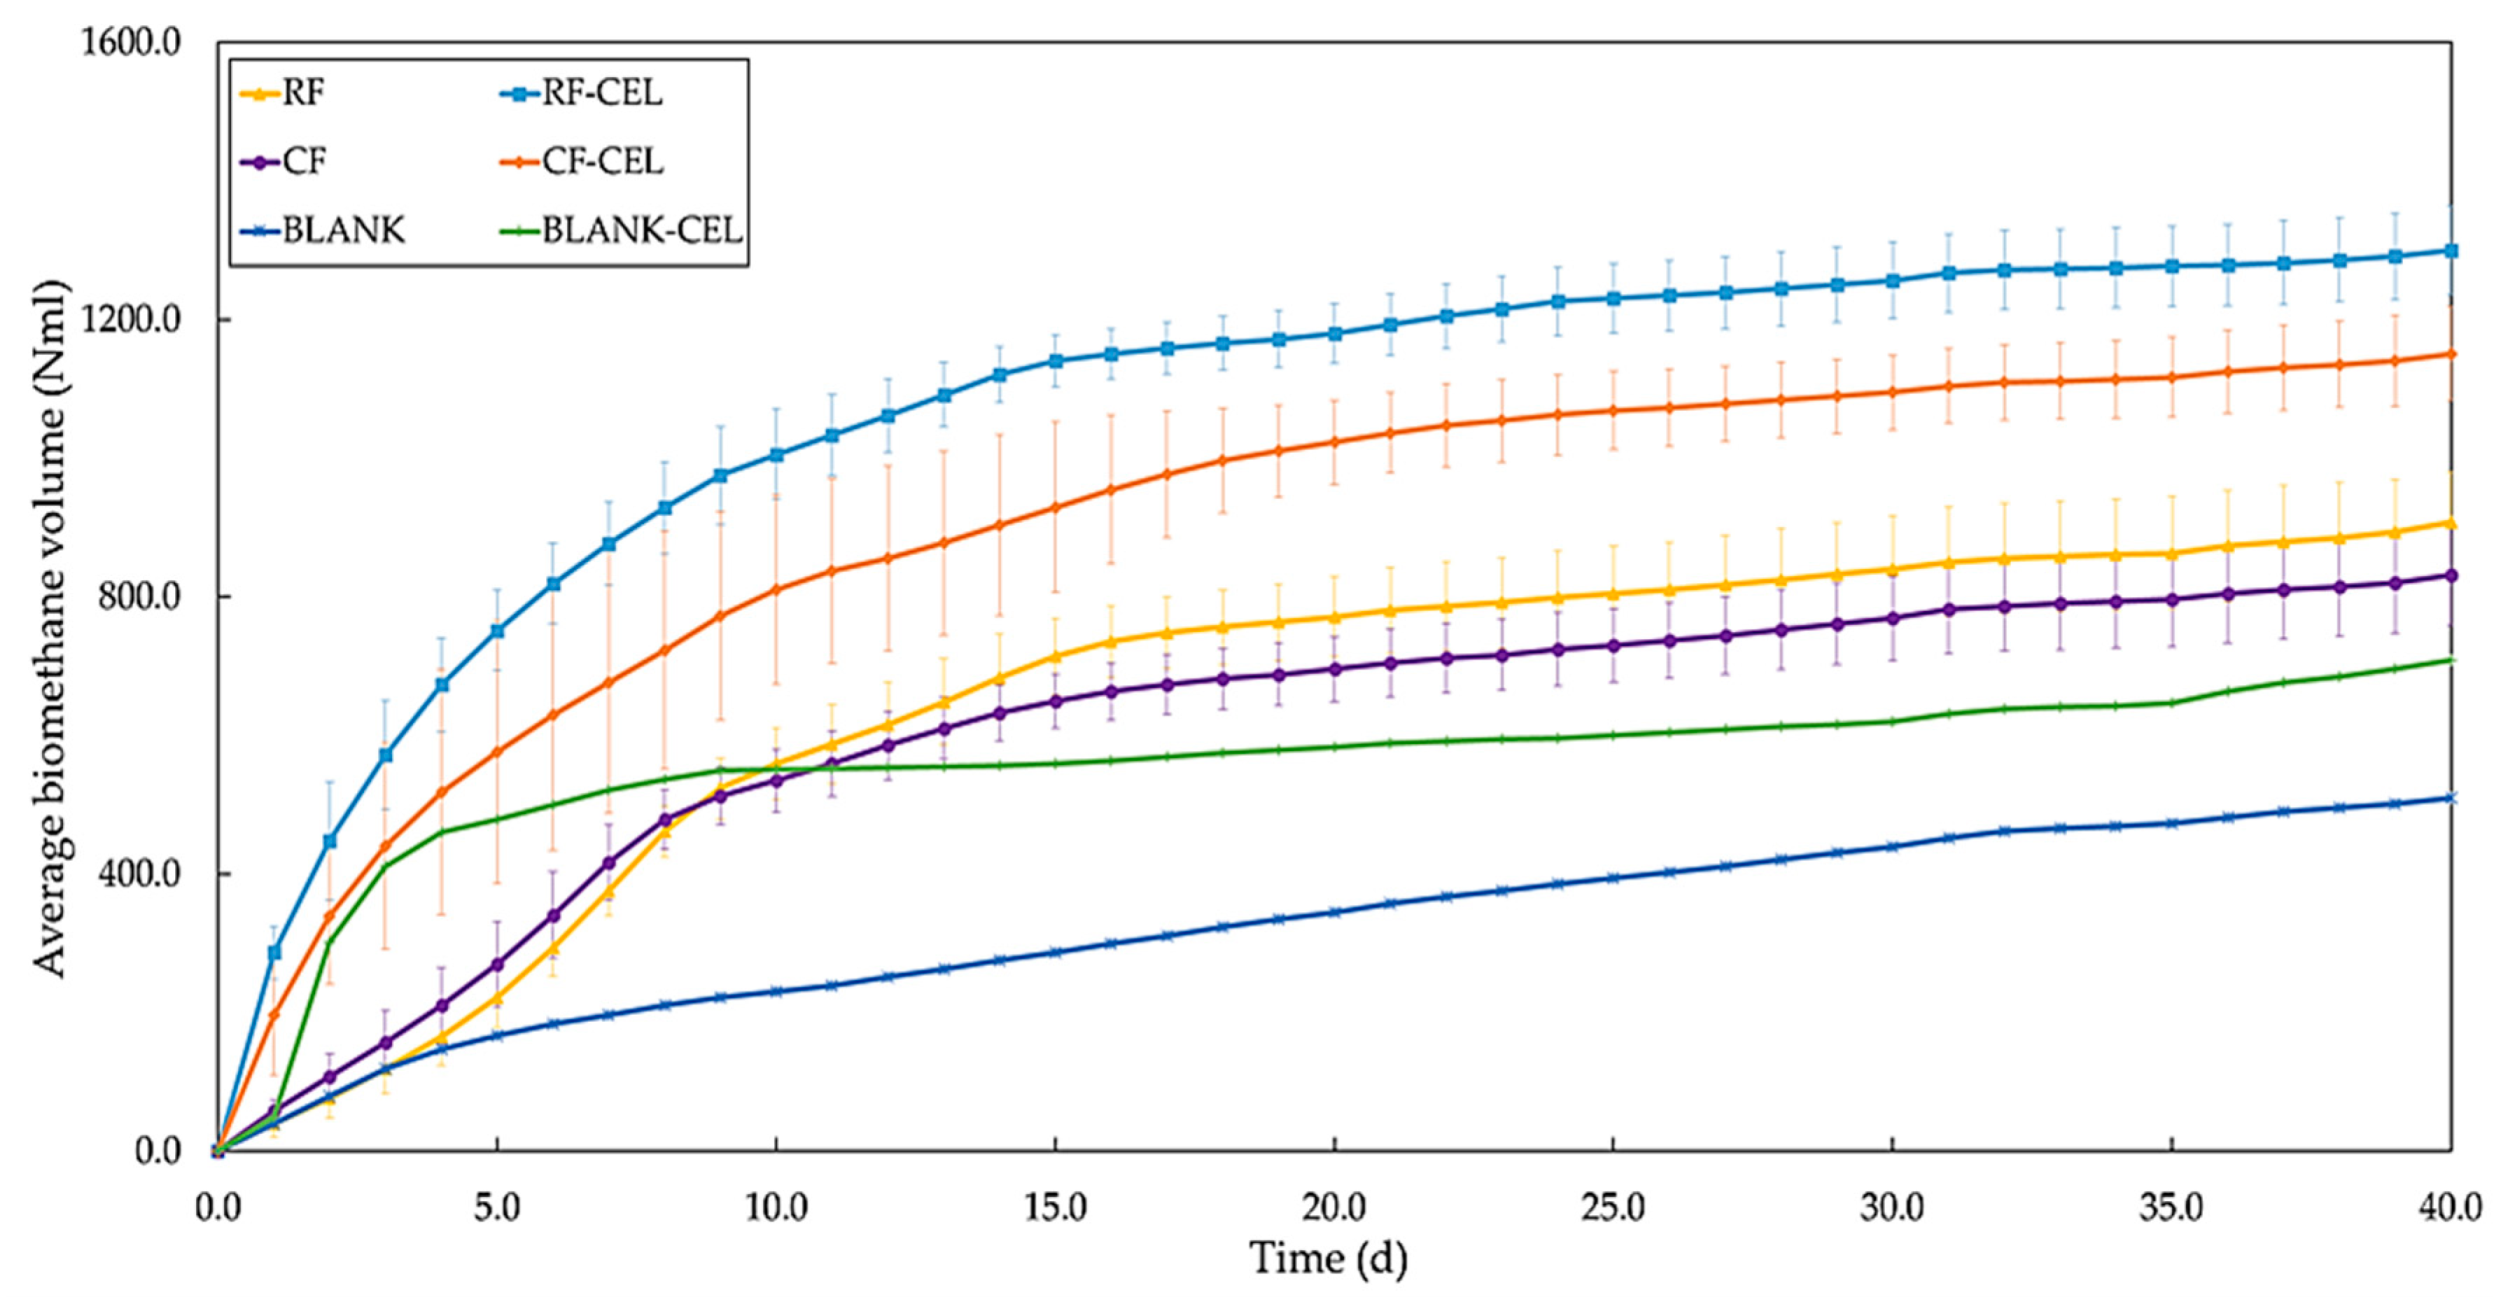
The raw feed with high-suspended solids had higher biomethane potential per liter of substrate than the centrifuged feed but the conversion rate and methane yield (g CODCH4/g CODtotal) was lower. Addition of cellulase increased biomethane production rates and yields in both high- and low-particle content samples.

3.1. Yields

Measured average methane production for the four cases investigated and two blank cases are presented in Figure 5. Blank adjusted total methane productions after 40 d were 403 ± 73 mL for RF, 621 ± 54 mL for RF-CEL, 331 ± 61 mL for CF and 462 ± 57 mL for CF-CEL. The highest volumes of methane were produced by cellulase containing samples RF-CEL and CF-CEL. Cellulase enhanced the COD conversions from 45% to 69% and 62% to 87% for RF and CF samples, respectively (Table 5). As expected, centrifuged samples resulted in lower ultimate methane production but higher specific methane yield than their non-centrifuged counterparts. From RF to RF-CEL specific yield increased from 390 to 600 L CH4/kg VS and from CF to CF-CEL it increased from 742 to 1037 L CH4/kg VS (Table 6).

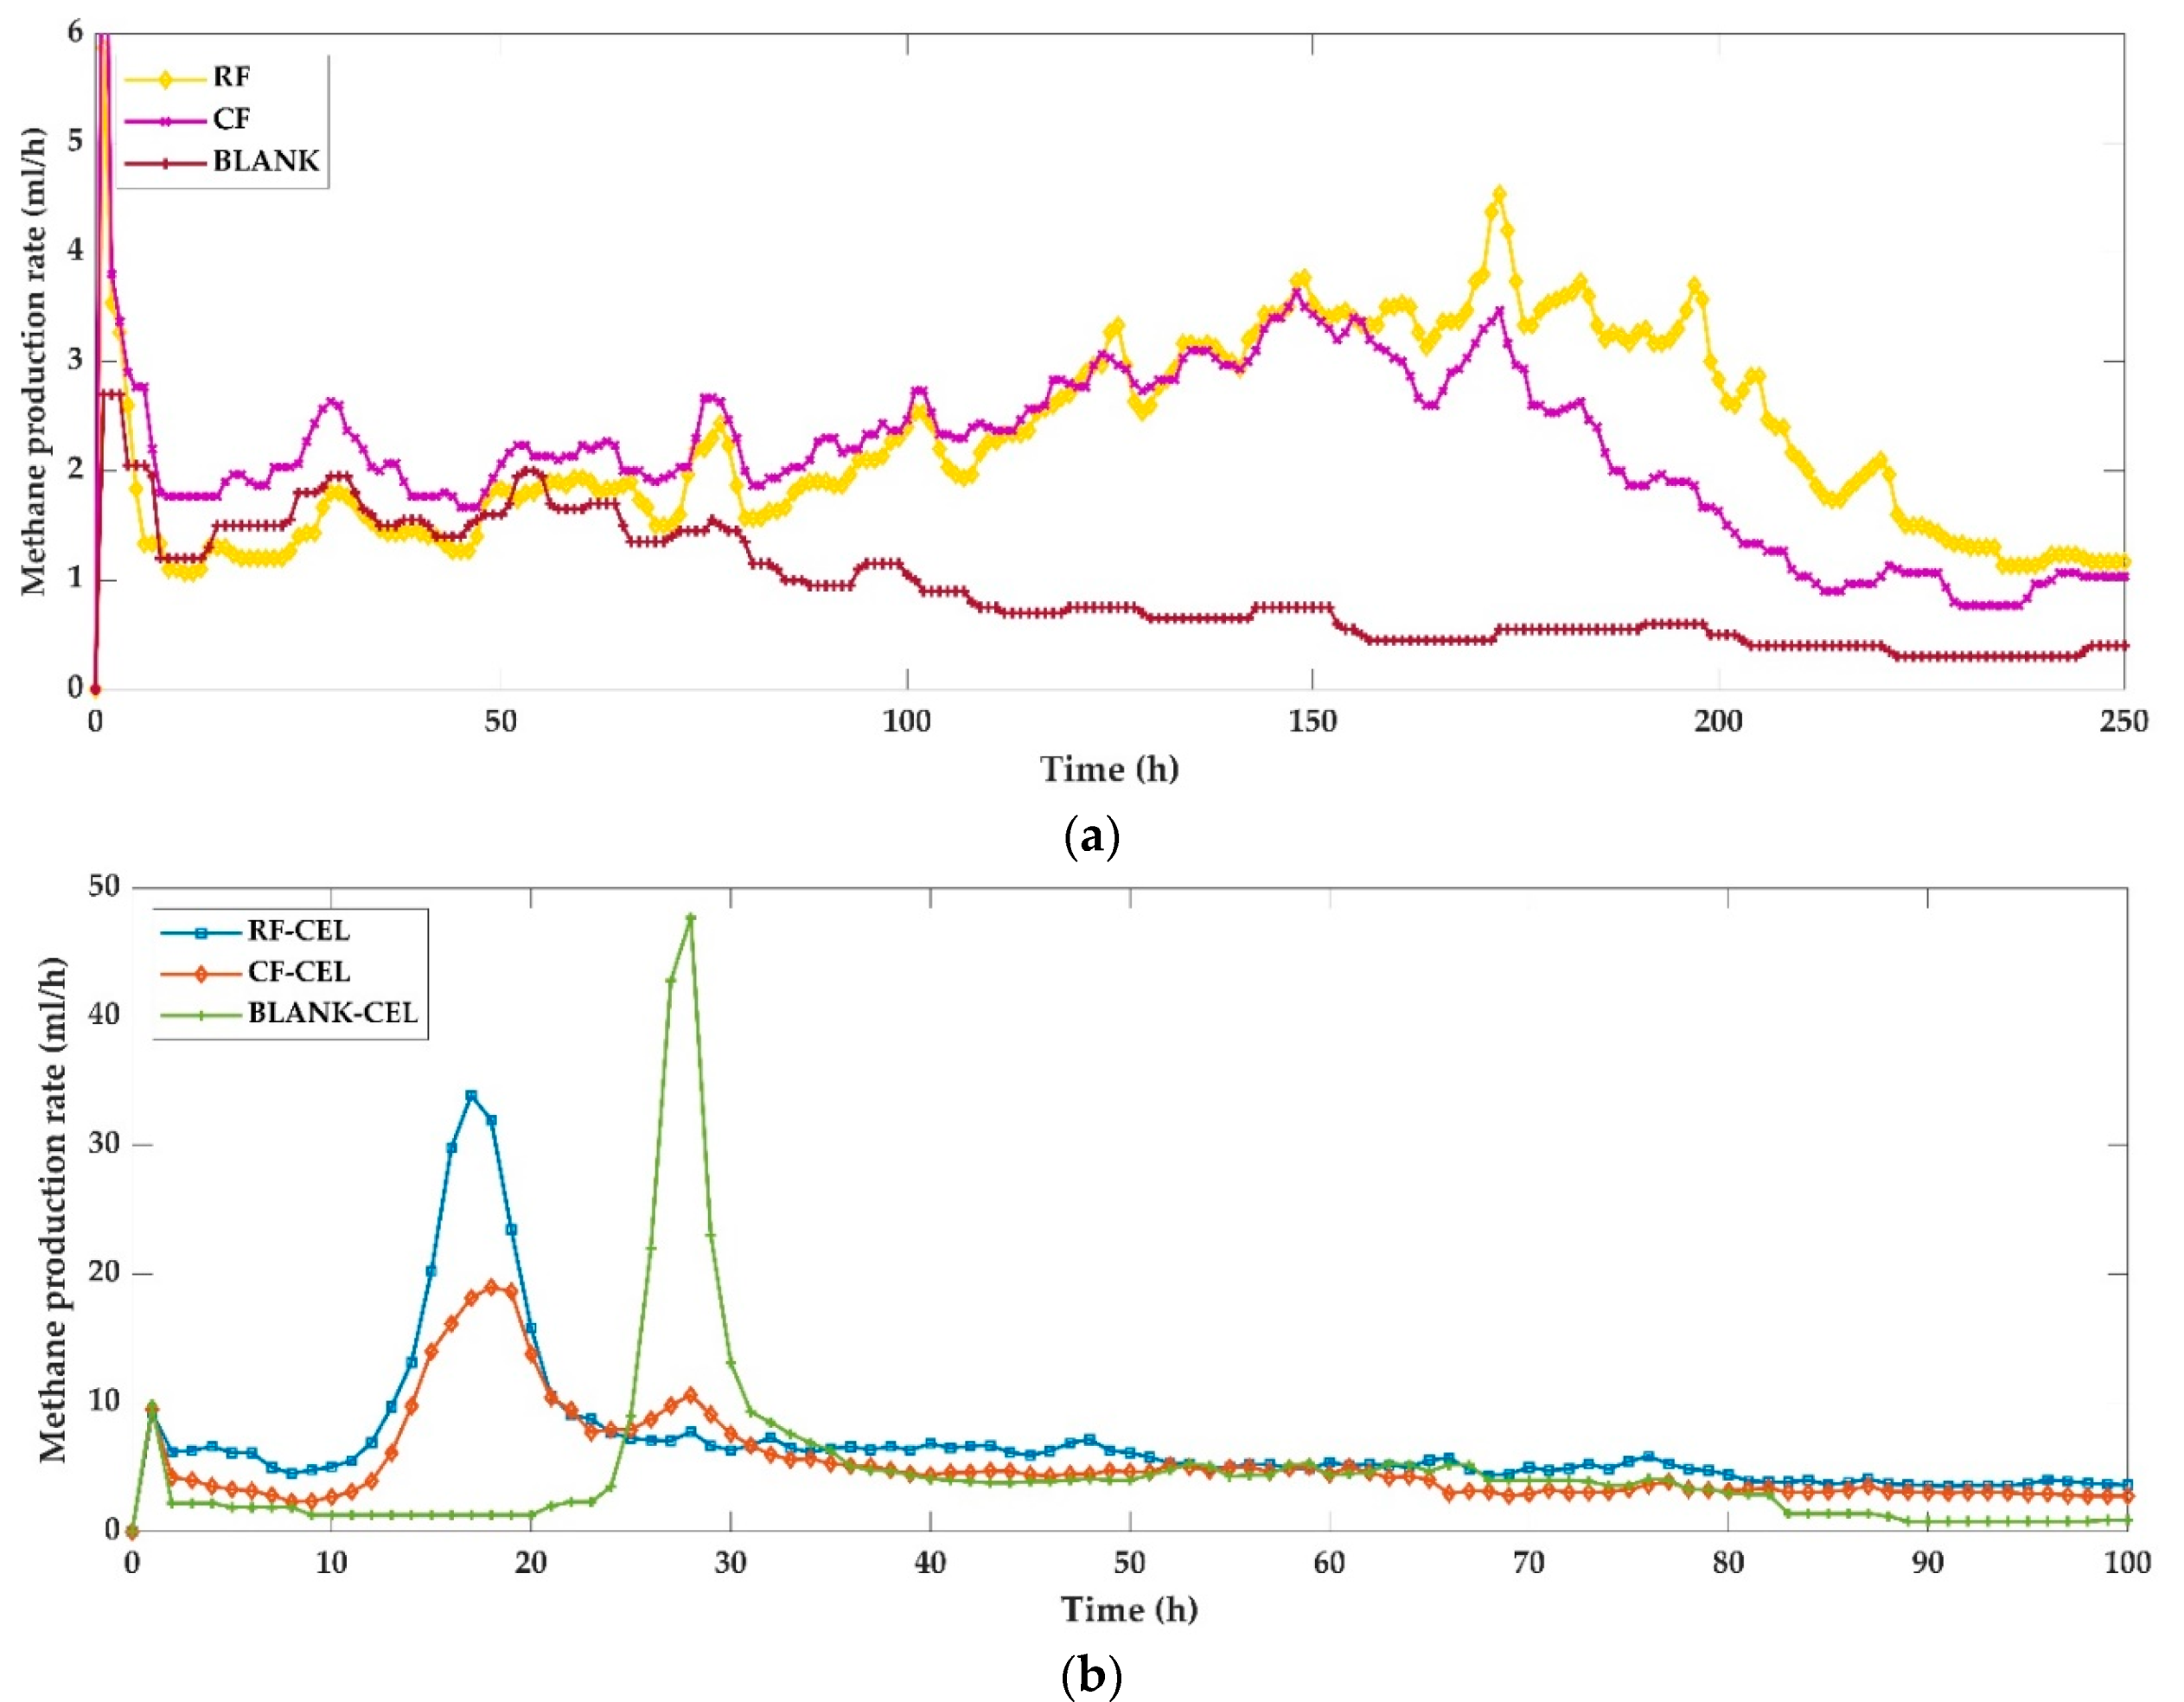
3.2. Production Rates

Biomethane production rates peaked faster with much higher maximum production rates in samples with cellulase addition (RF-CEL and CF-CEL) than those without addition (Figure 6). Cellulase-added samples showed maximum biomethane production rate in the first 30 h of the experiment while the cases without enzyme addition had much lower maximum production and it was distributed over a longer time span, peaking after ~150 h. A brief peak during startup in all cases is assumed irrelevant (methane release from methane saturated inoculum due to temperature increase). RF-CEL reached a maximum of 34 mL/h at 17 h and CF-CEL reached 19 mL/h at 19 h followed by a decrease to ~3 mL/h at 250 h. The BLANK-CEL sample with cellulase but without added substrates reached a methane production rate of 48 mL/h at 28 h, showing that the cellulase itself has a significant BMP and can be degraded quickly. Fortunately, the cellulase was degraded after the main degradation peaks for the feeds, implying that it can carry out the intended enzymatic attack on the feed particulates before it is itself degraded and converted to methane. Cellulase can, therefore, be added to anaerobic digesters to enhance biomethane production from cellulose containing feeds but it is not analyzed here whether this is a sustainable solution.

3.3. Effect of Cellulase Addition and Centrifugation

Enzyme additions were expected to have a stronger effect on samples that contain more particles, as observed. However, methane yield increase from CF to CF-CEL was quite high (40%) considering that centrifugation removed more than 80% of feed VSS (Table 1). The observation that addition of cellulase enzyme had a positive and comparable impact on methane yield both in raw and centrifuged samples (specific methane yield increased by 54% and 40% for RF and CF, respectively (Table 5)) suggests that there are similar fractions of cellulose in large and small particles in such animal manure slurries. The small particles evidently needed to undergo a similar disintegration process as those removed by centrifugation, with maximum rates at approximately the same time both with (Figure 6b) and without (Figure 6a) enzyme addition. Hydrolysis rate constants, Kh, determined from the slope of the plot ln X X X against t show how these observations can be included in process modeling. Only the first few days of the plot, where the curve was at its steepest was used to determine Kh in accordance with suggestions by Angelidaki et al. [14]. Enzyme addition led to much higher Kh values while centrifugation caused marginally larger Kh (Table 7).

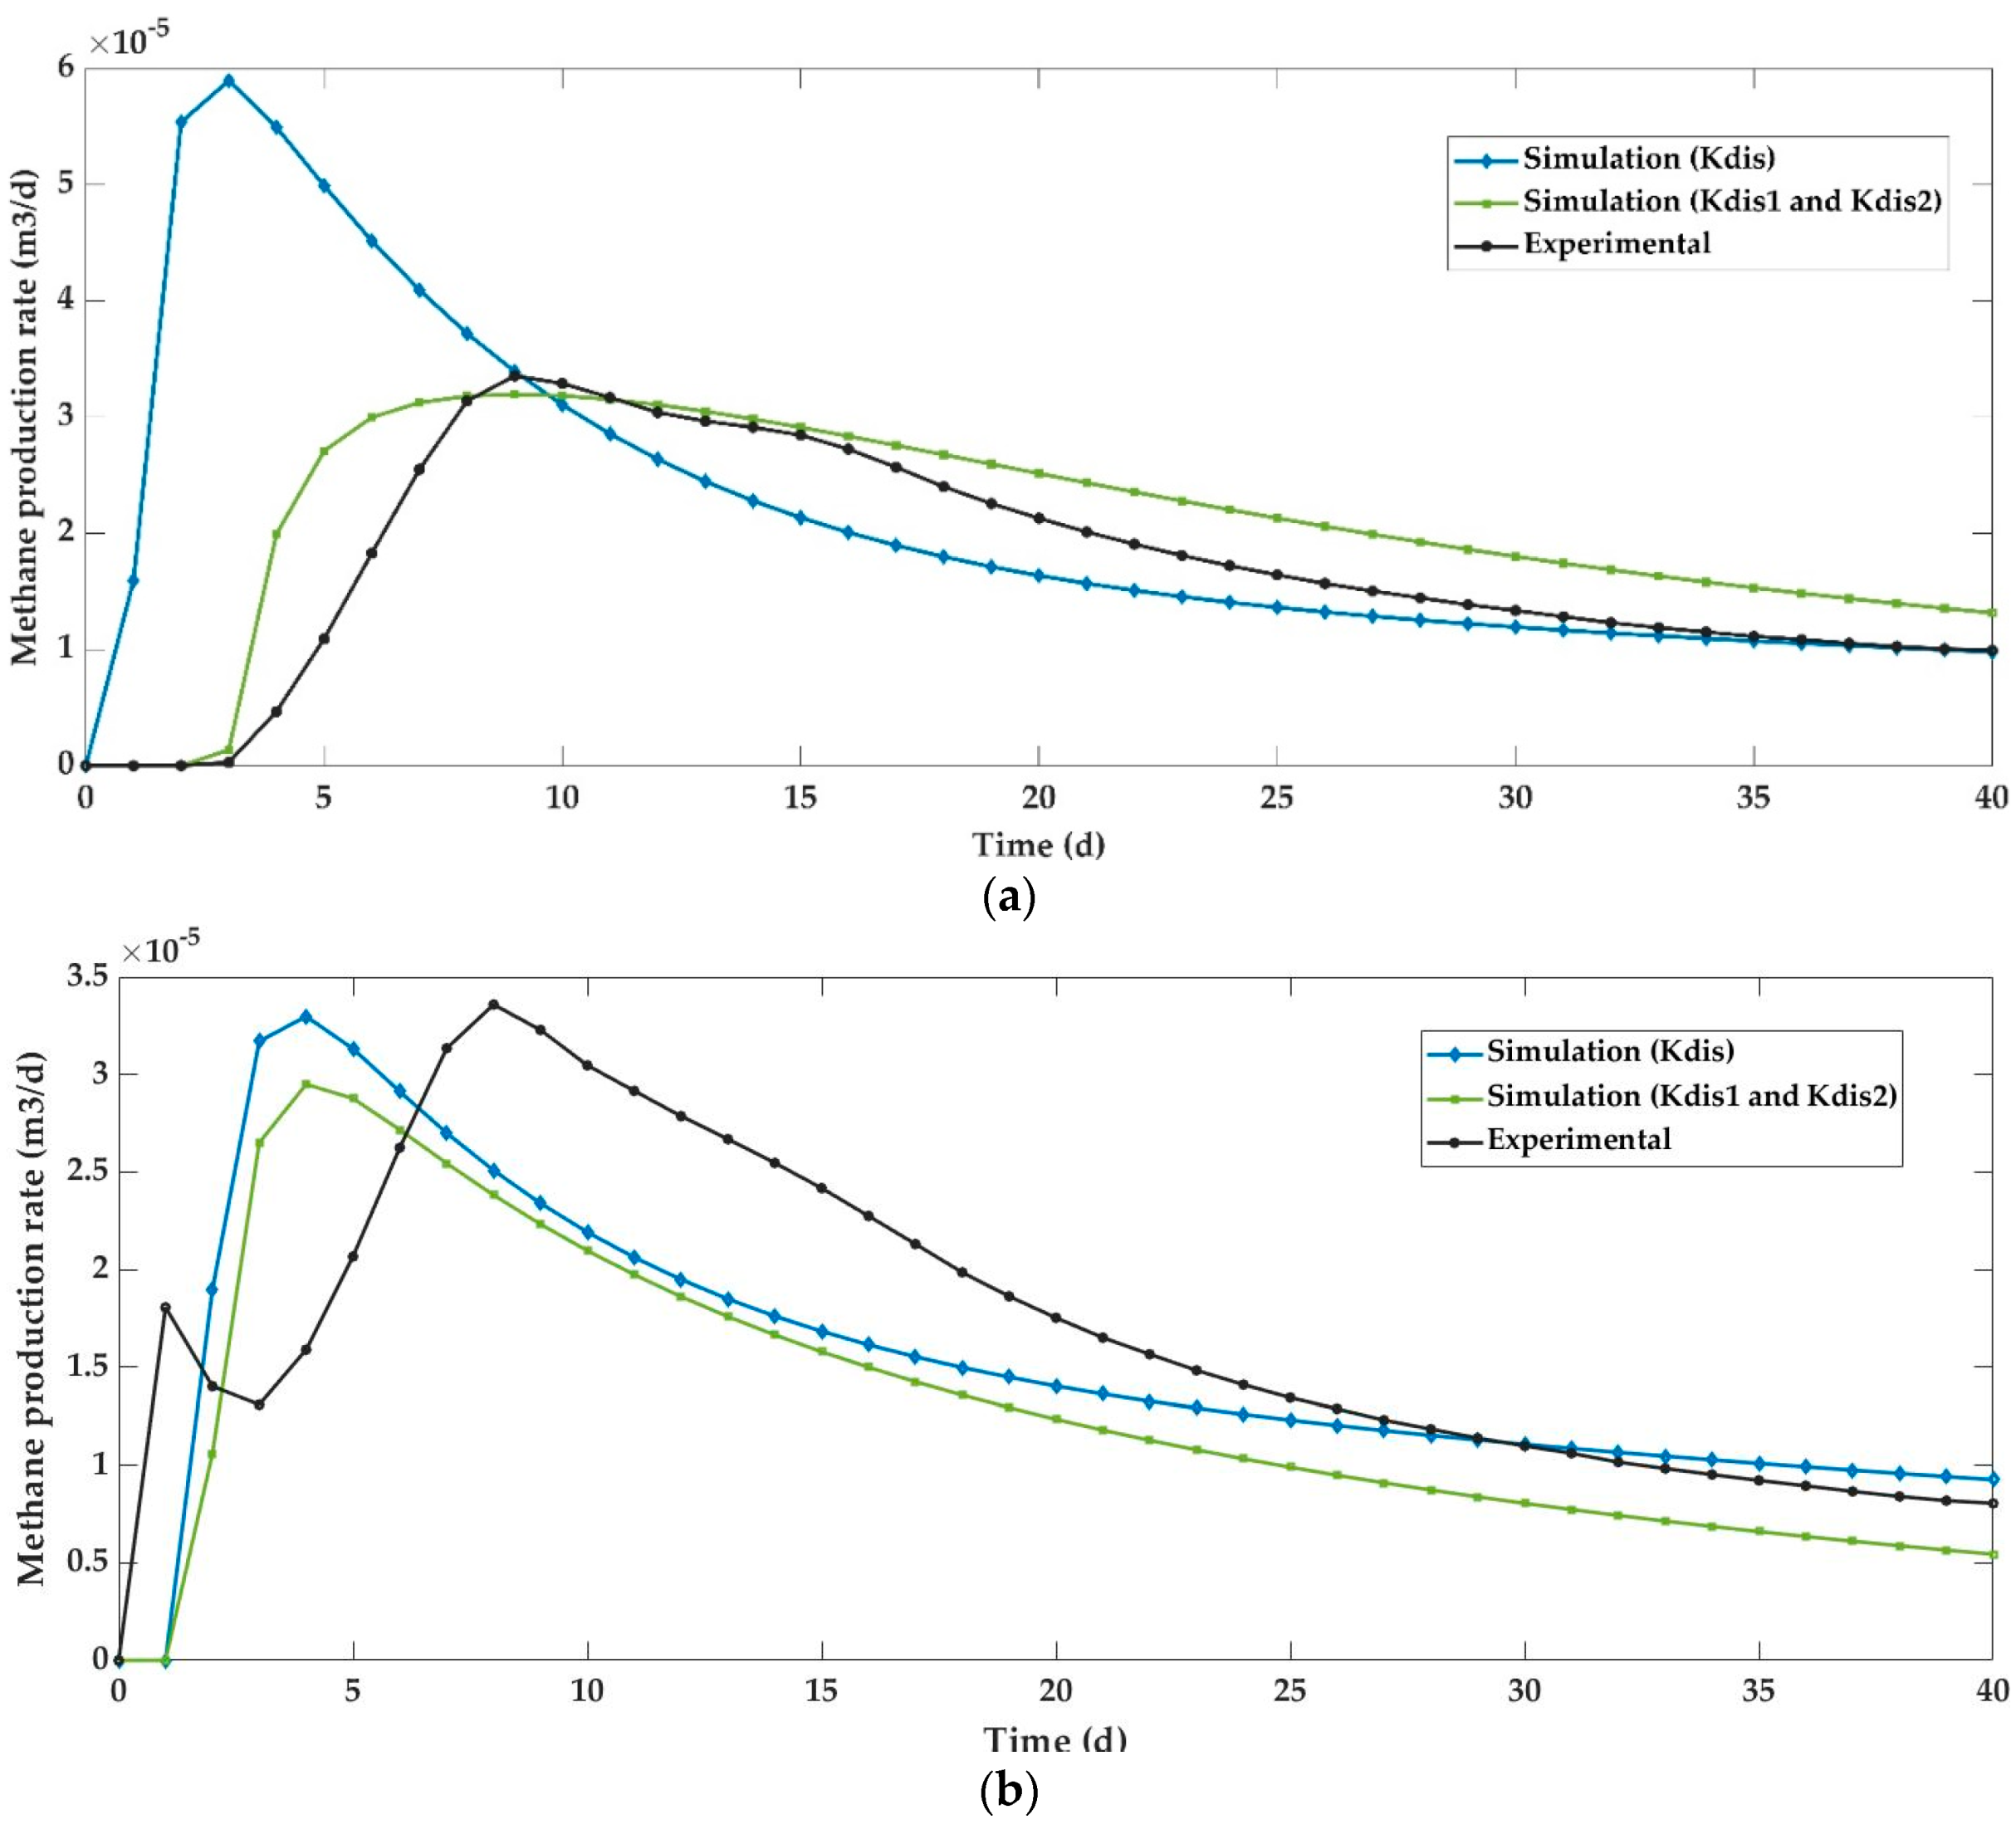
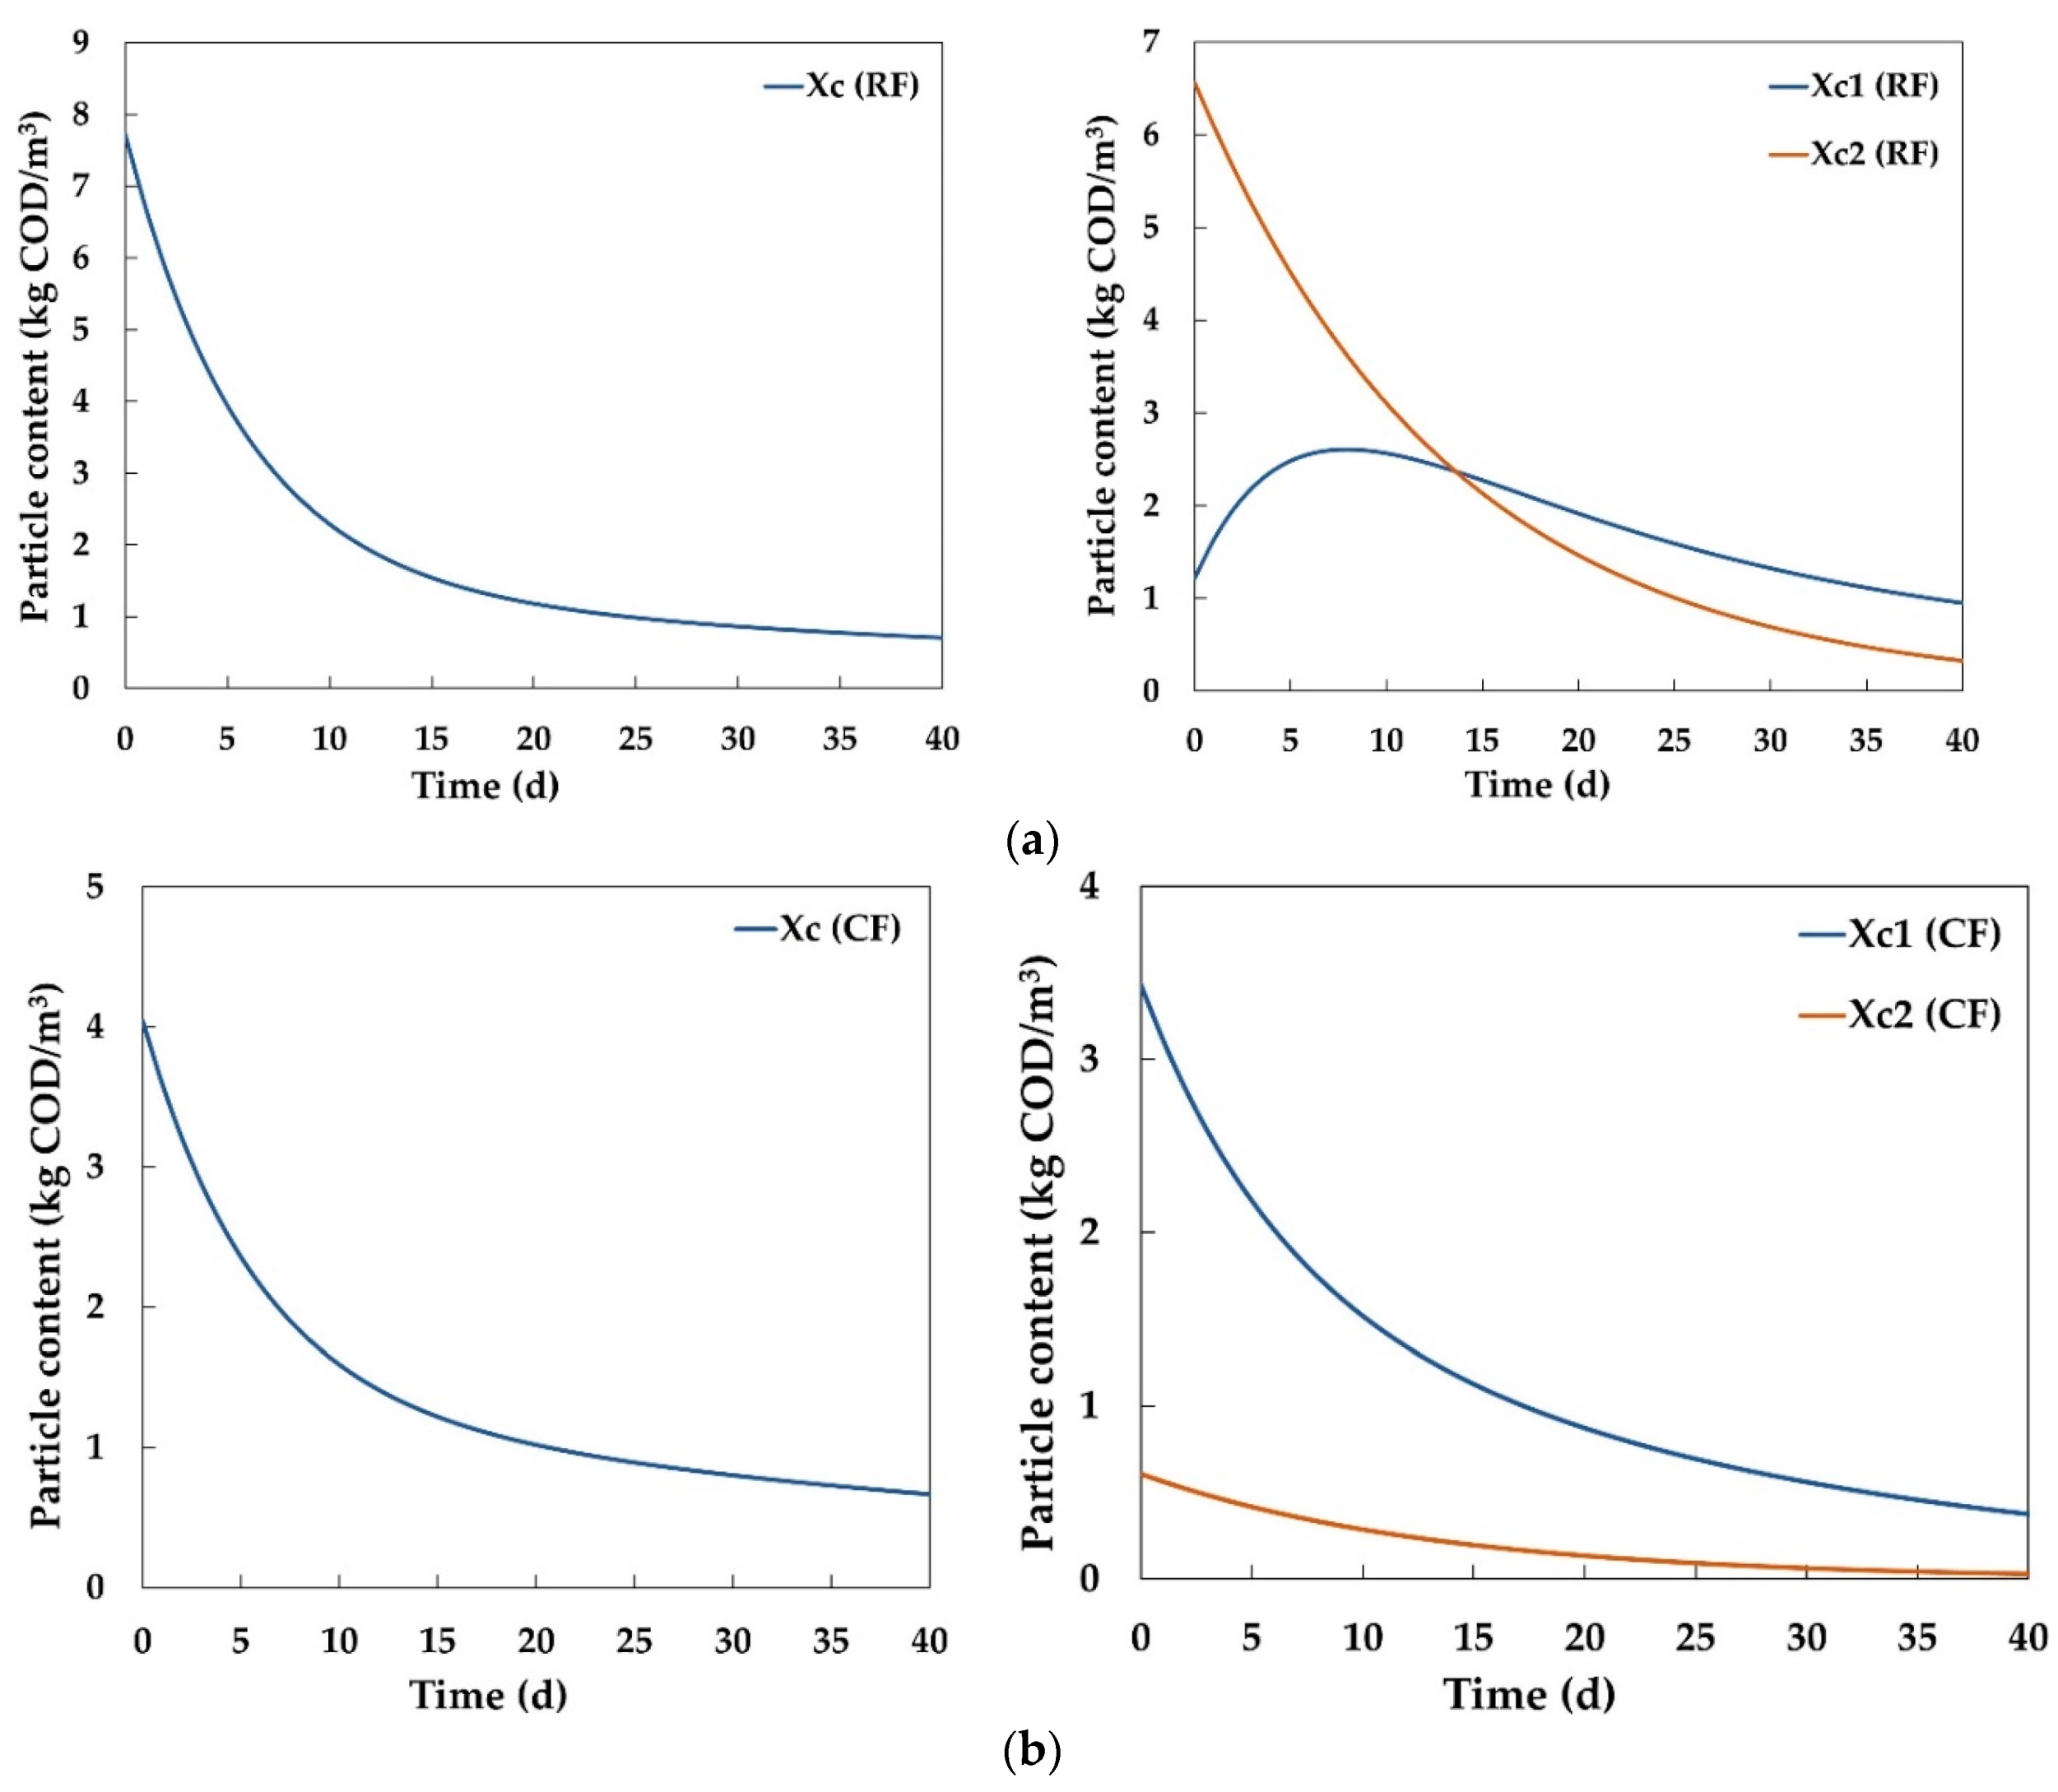
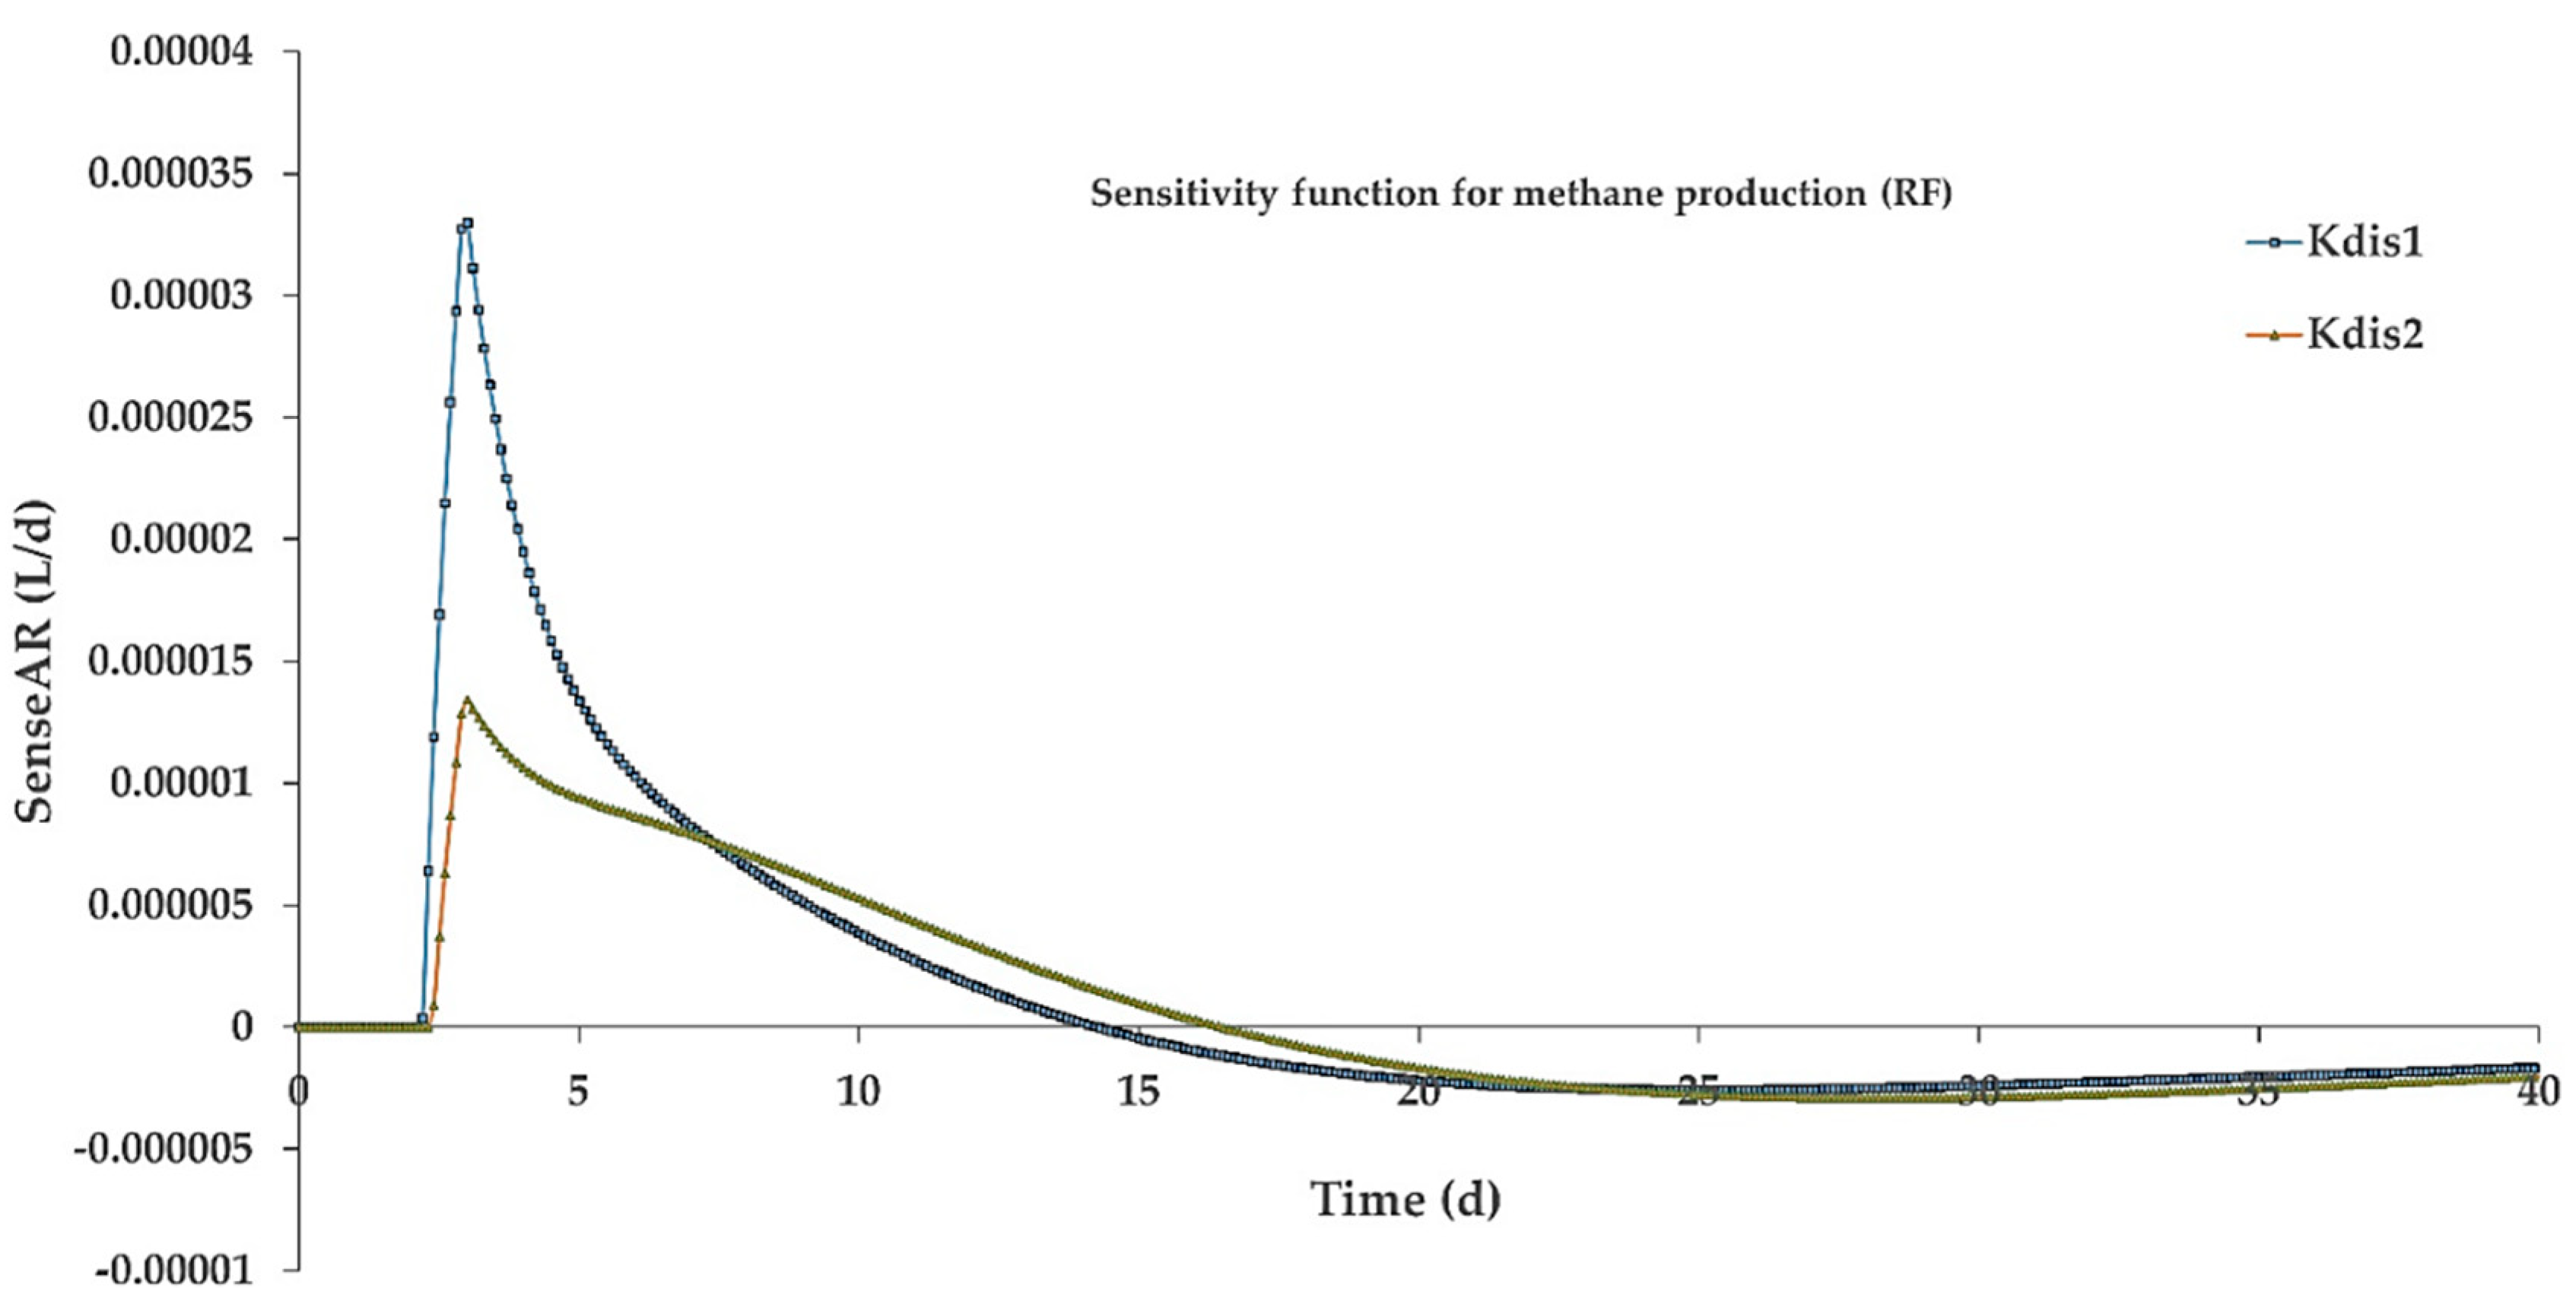
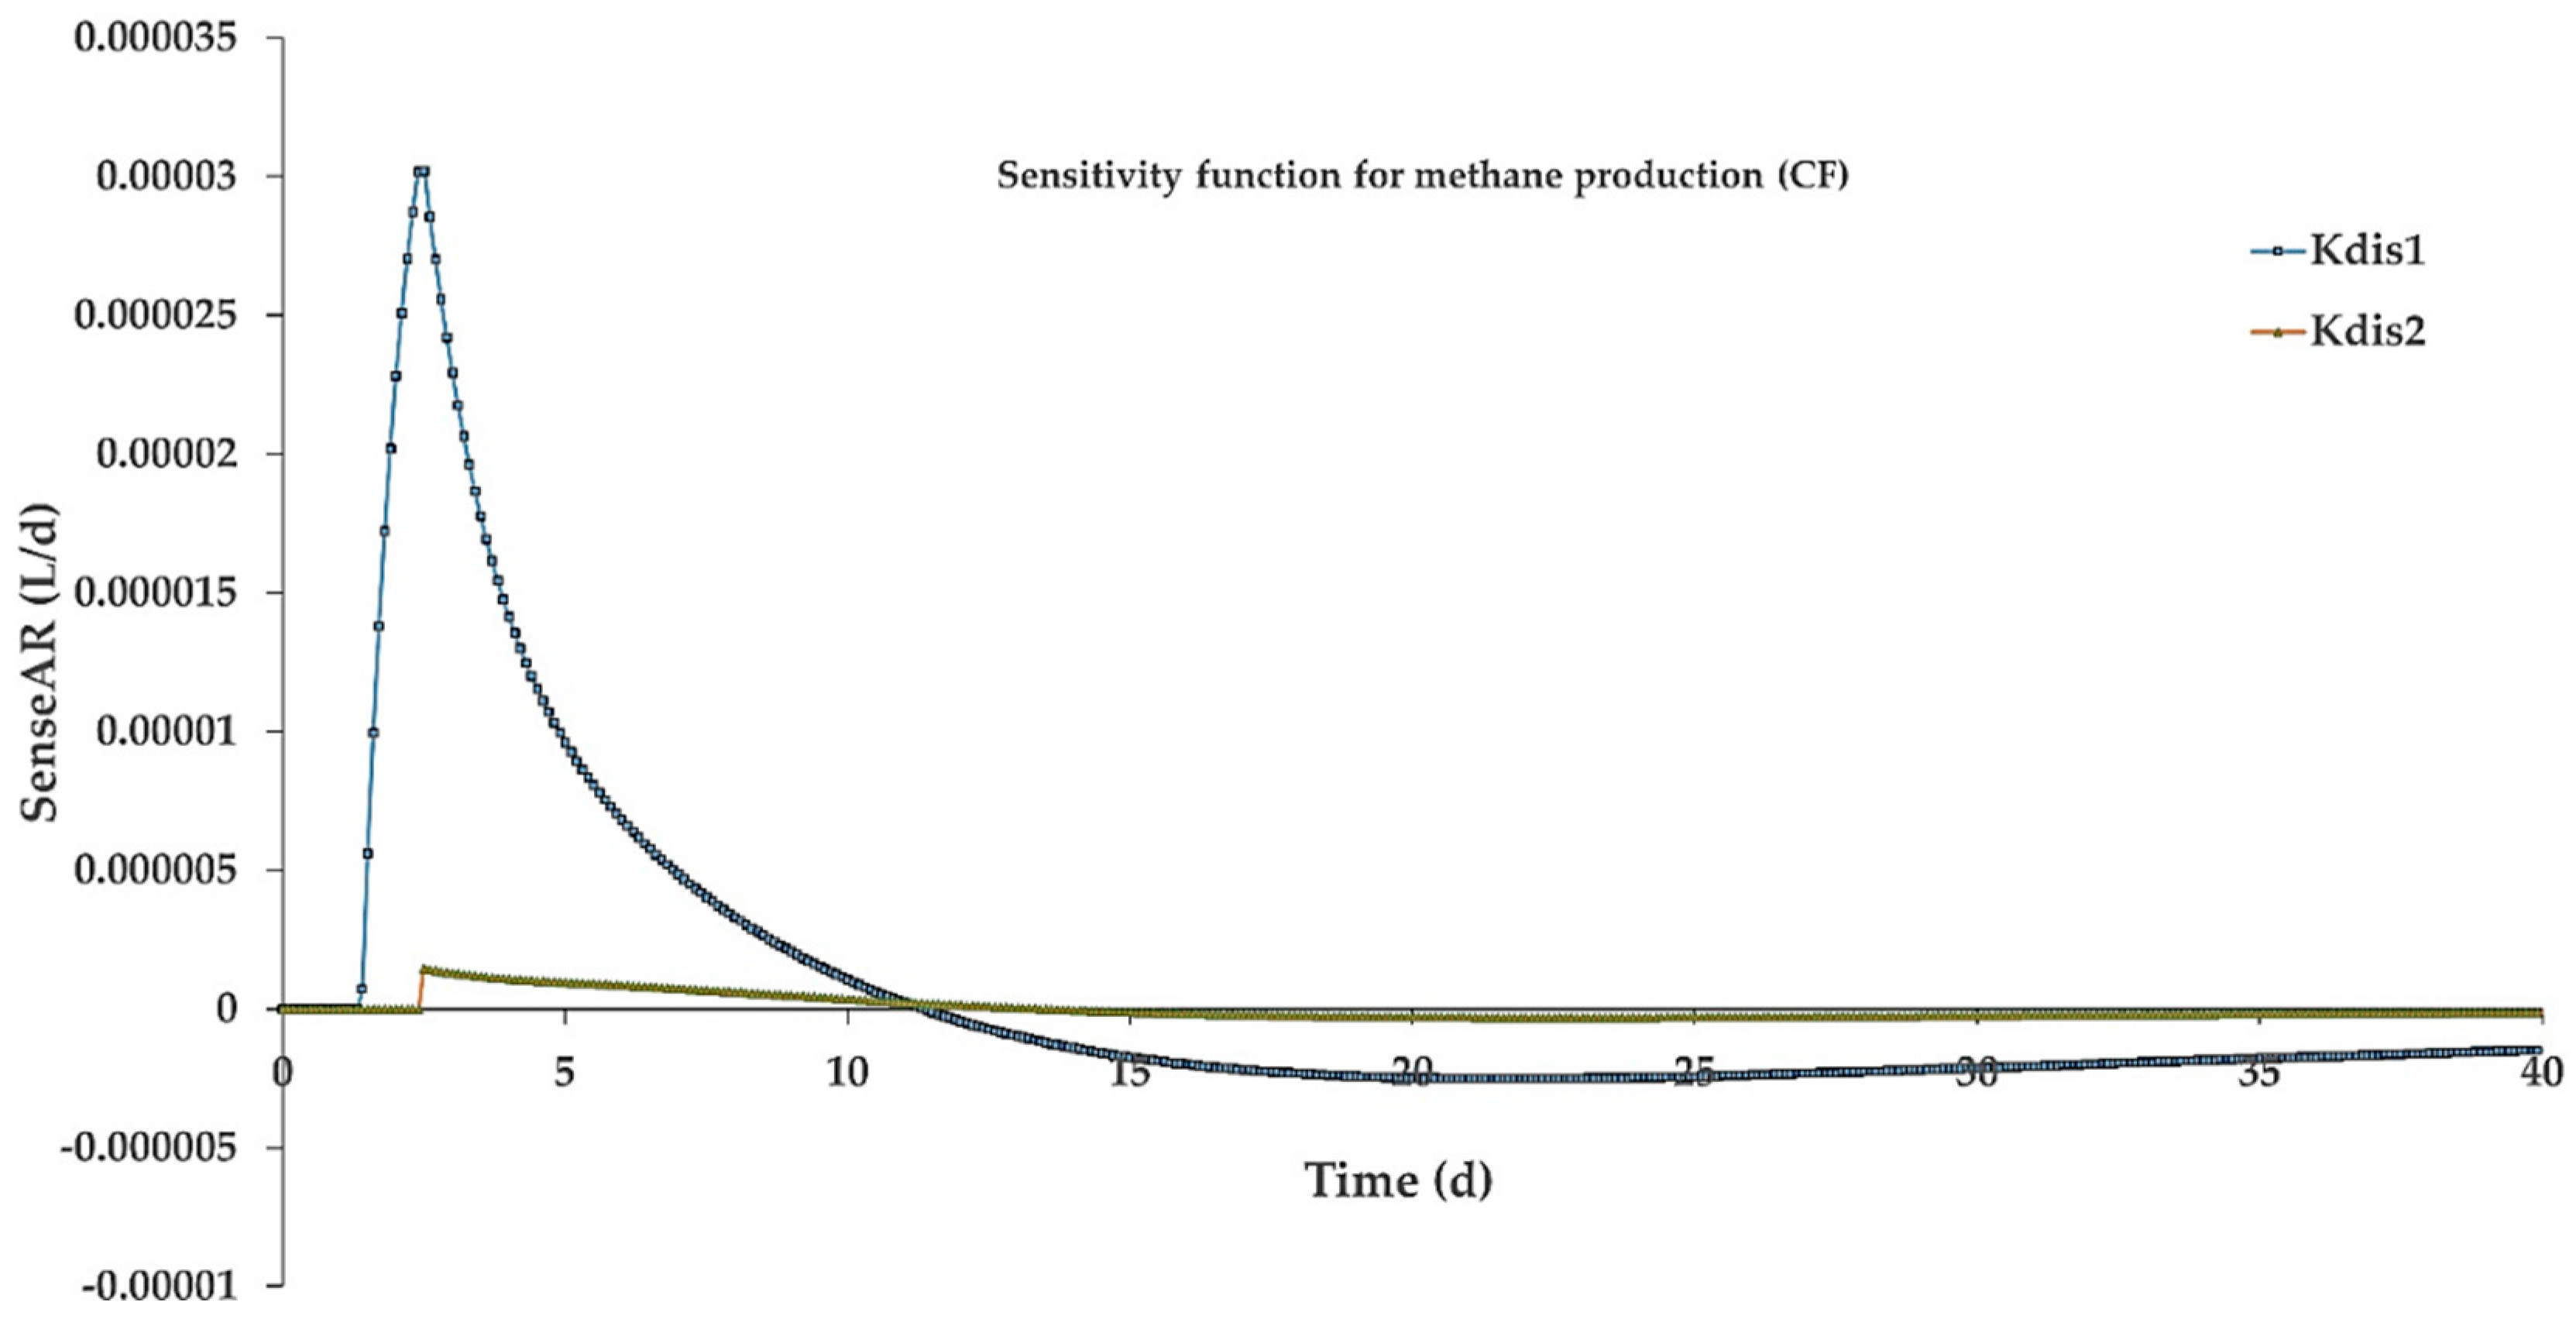
3.4. Simulation Results

Using a single disintegration constant assumes all particulates disintegrate equally. Kdis values in this mode of simulation are usually estimated based on the fast degrading fractions and this leads to an overestimation of methane production. In mode 1 simulation of the RF sample, methane production peaked very early in the digestion process (4–5 d) and continued to decline for the rest of the digestion, which differs significantly from the pattern of methane production observed in the experimental results. This phenomenon is visible in Figure 7a. Classifying particulates into fast degrading and slow degrading fractions seemed to rectify the overestimation of methane production (mode 2). Accounting for slow degrading particulates led to similar patterns in the timing of peak methane production. When the two modes of simulations are compared, it is apparent that the contribution of slow degrading particulates to the methane production became more and more significant at the later stages of digestion. Application of both modes of simulations on CF samples did not lead to significantly different results. Unlike RF, CF samples contain relatively small quantities of solid particulates, which are the main causes of reduced disintegration rate. Even if Kdis, Kdis1 and Kdis2 values for CF and RF are the same, the relative proportion of fast and slow degrading fractions are different. RF contains far more slow disintegrating particulates than CF. As a result, it is expected that simulations of CF in mode 1 (where all particulates are assumed to be degraded at Kdis of 0.17 d−1) and mode 2 (where 85% of particulates are assumed to be degraded at Kdis1 of 0.17 d−1) lead to similar patterns of methane production. Both modes of simulations suggested peak methane productions slightly earlier than observed. Comparing both modes of simulations for CF samples (Figure 7b) it is noticeable that mode 1 simulation seemed a better fit for CF samples than mode 2, suggesting that classification of particulates into fast and slow degrading fractions may be better suited for particle-rich substrates than particle “free” substrates.
The patterns of degradation of particulates were compared using data from mode 1 and mode 2 simulation results (Figure 8). In both RF and CF mode 1 simulations, Xc followed a “logarithmic” decline throughout the course of the digestion process. In RF mode 2 simulation, slow degrading particulates decline in a similar fashion as the one observed by Xc in mode 1 simulations, however fast degrading particulates increased first (until 8–10 days) followed by a gradual decline. The increase in the fast degrading particulates is partly attributed to decaying microorganisms being added into Xc1. Particle size and presence of recalcitrant substances contribute heavily to the slow degradation of solid particulates. After disintegration, the rest of the anaerobic digestion process continues the same way whether the disintegrated particulate originated from slow or fast disintegrating fractions. As a result of this, the slowly disintegrated particulates are continuously being added into a rapidly disintegrated fraction that contributes to the increase in Xc1 at the beginning of the digestion. Mode 2 simulation of the CF sample did not show increasing Xc1 mainly due to the absence of enough slowly disintegrating particulates continuously added to it. In addition, the contribution from microbial decay was minimal.
Sensitivity analysis was carried out on Kdis1 and Kdis2 parameters in mode 2 simulation. Sensitivity analysis, which combines identifiability and uncertainty analysis, is used to check if Kdis parameters can be uniquely determined from available data [24]. The sensitivity function of methane production with respect to Kdis1 and Kdis2 are shown in Figure 9 and Figure 10. In both RF and CF, the methane production was much more sensitive to Kdis1 than Kdis2. Sensitivity to Kdis2 was more apparent in RF than CF. The sensitivity of various other variables to Kdis1 and Kdis2 is also given in the form of sensitivity functions (SensAR) in Appendix A. The absolute-relative sensitivity function (Equation (A1)), was used to measure the absolute change in y (methane production) for 100% change in p (Kdis1/Kdis2).
Comparison of rates for RF and CF samples showed that the rate of biomethane production is faster in particles with lower solid particles, but it also showed that solid particulates breakdown slowly resulting in a steady biomethane production over a long period. In continuous reactors, solid accumulation may occur when substrates are added continuously without efficient solid disintegration and removal. Ideally, there should be a balance between rates of solid substrate addition and solid disintegration for a stable digestion process. In granular sludge bed reactors, solid particulates are often trapped in the sludge bed for long periods, meaning solid retention times much longer than the hydraulic retention time can be achieved, but appreciable disintegration of trapped solid may be hindered due to various reasons among which are large particle size, inefficient mixing, and mass transfer limitation. A carefully adjusted balance between influent solids and solid disintegration kinetics has to be established and considered during reactor design in order to use the granular sludge bed for particle-rich substrates. Reactor conditions such as volume temperature, HRT (Hydraulic Retention Time) and SRT (Solids Retention Time) have to consider possible solid accumulations. In addition, a combination periodic removal of excess solids, pretreatment of solid substrates before and during reaction and continuous monitoring of reactor conditions have to be maintained.

4. Conclusions

After conducting batch reactor tests and analyzing results from substrates with high- and low-suspended particle contents, we have made the following conclusions:
  • High biomethane production was observed in samples with higher particle content however, specific biomethane yield was low compared to samples with low particle contents.
  • Centrifugation of samples decreased the volume of methane produced but increased the rate of methane production regardless of the addition of cellulase.
  • Cellulase addition improved overall and specific methane productions both in raw and centrifuged samples but the improvement was higher in samples that contained higher suspended solids.
  • Simulation results revealed that classifying complex particulates into fast and slow disintegrating fractions led to a more accurate modeling of particle-rich substrates.

Suggestions for Future Work

This article is based on experimental results from batch anaerobic reactors. As a result, its applicability may be limited. In order to increase the validity of the findings in this work, the authors recommend future investigations on how the classification of complex particulates into fast and slow degrading fractions could be implemented in continuous anaerobic reactors. The effect of temperature on the disintegration of particulates would also be an interesting investigation to carry out.

Author Contributions

Conceptualization, F.A.T., W.H.B., C.D. and R.B.; methodology, F.A.T.; software, F.A.T.; validation, F.A.T.; formal analysis, All authors; investigation, All authors; resources, F.A.T.; data curation, F.A.T.; writing—original draft preparation, F.A.T.; writing—review and editing, All authors; visualization, F.A.T.; supervision, R.B. and W.H.B.; project administration, R.B.; funding acquisition, R.B.

Funding

This research was part of a PhD project funded by the European Regional Development Fund; Interreg BioGas2020.

Acknowledgments

The authors would like to thank Dag Øvrebø for his help during sample collection.

Conflicts of Interest

The authors declare no conflict of interest.

Appendix A

The absolute-relative sensitivity function is used in Aquasim software to measure the absolute change in y for 100% change in P. In this case, y is methane production and P is parameter Kdis1 or Kdis2.
Absolute Relative   sensitivity   function = P y P
In the tables below, the sensitivity function (SensAR) is expressed in: root mean square (r(av(SensAR2))) and mean absolute (av(|SensAR|)) and for error contributions as: (av(|ErrCont|)). S_CH4, S_CO2 and S_H2 are concentrations of CH4, CO2 and H2, respectively.
Table A1. Variables ranked based on sensitivity to Kdis1 and Kdis2 in the headspace (RF).
Variabler(av(SensAR2))av(|SensAR|)av(|ErrCont|)
Kdis1Kdis2Kdis1Kdis2Kdis1Kdis2
S_CH40.030.020.0100.050.03
S_CO2000000
S_H2000000
Table A2. Variables ranked based on sensitivity to Kdis1 and Kdis2 in the bulk reactor (RF).
Variabler(av(SensAR2))av(|SensAR|)av(|ErrCont|)
Kdis1Kdis2Kdis1Kdis2Kdis1Kdis2
S_CH40.0010.001000.0020.001
S_CO200000.0020.002
S_H2000000
Other parameters
Xc10.320.100.120.020.730.32
Xc200.2500.0600.83
Table A3. Variables ranked based on sensitivity to Kdis1 and Kdis2 in the headspace (CF).
Variabler(av(SensAR2))av(|SensAR|)av(|ErrCont|)
Kdis1Kdis2Kdis1Kdis2Kdis1Kdis2
S_CH40.0900.0400.240.04
S_CO200000.010
S_H2000000
Table A4. Variables ranked based on sensitivity to Kdis1 and Kdis2 in the bulk reactor (CF).
Variabler(av(SensAR2))av(|SensAR|)av(|ErrCont|)
Kdis1Kdis2Kdis1Kdis2Kdis1Kdis2
S_CH40.00300.00100.0080.001
S_CO20.00100.00100.0030.001
S_H2000000
Other parameters
Xc10.630.030.530.023.090.28
Xc200.070.000.0600.75

References

  1. Esposito, G. Bio-Methane Potential Tests to Measure The Biogas Production From The Digestion and Co-Digestion of Complex Organic Substrates. Open Environ. Eng. J. 2012, 5, 1–8. [Google Scholar] [CrossRef]
  2. Bajpai, P. Pretreatment of Lignocellulosic Biomass for Biofuel Production; Springer Science and Business Media LLC: Berlin/Heidelberg, Germany, 2016. [Google Scholar]
  3. Bruni, E.; Jensen, A.P.; Angelidaki, I. Steam treatment of digested biofibers for increasing biogas production. Bioresour. Technol. 2010, 101, 7668–7671. [Google Scholar] [CrossRef] [PubMed]
  4. Sun, Y.; Cheng, J. Hydrolysis of lignocellulosic materials for ethanol production: A review. Bioresour. Technol. 2002, 83, 1–11. [Google Scholar] [CrossRef]
  5. Pandey, A. Handbook of Plant-Based Biofuels; CRC Press: Boca Raton, FL, USA, 2008. [Google Scholar]
  6. Maitan-Alfenas, G.P.; Visser, E.M.; Guimarães, V.M. Enzymatic hydrolysis of lignocellulosic biomass: Converting food waste in valuable products. Curr. Opin. Food Sci. 2015, 1, 44–49. [Google Scholar] [CrossRef]
  7. Christy, P.M.; Gopinath, L.; Divya, D. A review on anaerobic decomposition and enhancement of biogas production through enzymes and microorganisms. Renew. Sustain. Energy Rev. 2014, 34, 167–173. [Google Scholar] [CrossRef]
  8. Romano, R.T.; Zhang, R.; Teter, S.; McGarvey, J.A. The effect of enzyme addition on anaerobic digestion of Jose Tall Wheat Grass. Bioresour. Technol. 2009, 100, 4564–4571. [Google Scholar] [CrossRef] [PubMed]
  9. Malayil, S.; Chanakya, H. Fungal Enzyme Cocktail Treatment of Biomass for Higher Biogas Production from Leaf Litter. Procedia Environ. Sci. 2016, 35, 826–832. [Google Scholar] [CrossRef]
  10. Quiñones, T.S.; Plöchl, M.; Budde, J.; Heiermann, M. Results of Batch Anaerobic Digestion Test–Effect of Enzyme Addition. Agric. Eng. Int. CIGR J. 2012, 14, 38–50. [Google Scholar]
  11. Triolo, J.M.; Sommer, S.G.; Møller, H.B.; Weisbjerg, M.R.; Jiang, X.Y. A new algorithm to characterize biodegradability of biomass during anaerobic digestion: Influence of lignin concentration on methane production potential. Bioresour. Technol. 2011, 102, 9395–9402. [Google Scholar] [CrossRef] [PubMed]
  12. Koch, K.; Drewes, J.E. Alternative approach to estimate the hydrolysis rate constant of particulate material from batch data. Appl. Energy 2014, 120, 11–15. [Google Scholar] [CrossRef]
  13. Vavilin, V.; Rytov, S.; Lokshina, L. A description of hydrolysis kinetics in anaerobic degradation of particulate organic matter. Bioresour. Technol. 1996, 56, 229–237. [Google Scholar] [CrossRef]
  14. Angelidaki, I.; Alves, M.; Bolzonella, D.; Borzacconi, L.; Campos, J.L.; Guwy, A.J.; Kalyuzhnyi, S.; Jenicek, P.; Van Lier, J.B. Defining the biomethane potential (BMP) of solid organic wastes and energy crops: A proposed protocol for batch assays. Water Sci. Technol. 2009, 59, 927–934. [Google Scholar] [CrossRef] [PubMed]
  15. VDI—The Association of German Engineers. Vergärung organischer Stoffe. Substratcharakterisierung, Probenahme, Stoffdatenerhebung, Gärversuche; Beuth Verlag: Berlin, Germany, 2006. [Google Scholar]
  16. Macé, S.; Bolzonella, D.; Cecchi, F.; Mata-Álvarez, J. Comparison of the biodegradability of the grey fraction of municipal solid waste of Barcelona in mesophilic and thermophilic conditions. Water Sci. Technol. 2003, 48, 21–28. [Google Scholar] [CrossRef] [PubMed]
  17. Eastman, J.A.; Ferguson, J.F. Solubilization of Particulate Organic Carbon during the Acid Phase of Anaerobic Digestion. J. (Water Pollut. Control Fed.) 1981, 53, 352–366. [Google Scholar]
  18. APHA; Water Environment Federation; American Water Works Association. Standard Methods for the Examination of Water and Wastewater; American Public Health Association: Washington, DC, USA, 1998. [Google Scholar]
  19. Bioprocess Control. AMPTS II Light Automatic Methane Potential Test System Operation and Maintenance Manual; Bioprocess Control: Lund, Sweden, 2016. [Google Scholar]
  20. Darmana, D.; Henket, R.; Deen, N.G.; Kuipers, J. Detailed modelling of hydrodynamics, mass transfer and chemical reactions in a bubble column using a discrete bubble model: Chemisorption of CO2 into NaOH solution, numerical and experimental study. Chem. Eng. Sci. 2007, 62, 2556–2575. [Google Scholar] [CrossRef]
  21. Tchobanoglous, G.; Burton, F.L.; Stensel, H.D. Wastewater Engineering Treatment and Reuse; McGraw-Hill Education: Boston, MA, USA, 2003. [Google Scholar]
  22. Gali, A.; Benabdallah, T.; Astals, S.; Mata-Alvarez, J. Modified version of ADM1 model for agro-waste application. Bioresour. Technol. 2009, 100, 2783–2790. [Google Scholar] [CrossRef] [PubMed]
  23. Batstone, D.; Keller, J.; Angelidaki, I.; Kalyuzhnyi, S.; Pavlostathis, S.; Rozzi, A.; Sanders, W.; Siegrist, H.; Vavilin, V. The IWA Anaerobic Digestion Model No 1 (ADM1). Water Sci. Technol. 2002, 45, 65–73. [Google Scholar] [CrossRef] [PubMed]
  24. Reichert, P. Aquasim 2.0-User Manual; Swiss Federal Institute for Environmental Science and Technology: Dubendorf, Switzerland, 1998. [Google Scholar]
Figure 1. Building block of cellulose polymer.
Applsci 09 02880 g001
Figure 2. Composition of hemicellulose, cellulose and lignin contents as a percentage of volatile solids (VS) in manure and energy crops (data from Triolo et al. [11]).
Applsci 09 02880 g002
Figure 3. Automatic methane potential test system (AMPTS) II batch reactor experimental setup (pictures from Bioprocess control’s homepage).
Applsci 09 02880 g003
Figure 4. ADM1 simulation scheme for mode 1 and mode 2 simulations.
Applsci 09 02880 g004
Figure 5. Average biomethane production for raw feed (RF) and centrifuged feed (CF), with and without cellulase, and two blank cases.
Applsci 09 02880 g005
Figure 6. Measured average biomethane production rate: without cellulase (a) for the first 250 h and with cellulase (b) for the first 100 h.
Applsci 09 02880 g006
Figure 7. Methane production rate of simulation and experimental results: RF (a) and CF (b).
Applsci 09 02880 g007
Figure 8. Comparison of particulate degradation in samples: RF (a) and CF (b).
Applsci 09 02880 g008
Figure 9. Sensitivity function of methane production with respect to Kdis1 and Kdis2 (RF).
Applsci 09 02880 g009
Figure 10. Sensitivity function of methane production with respect to Kdis1 and Kdis2 (CF).
Applsci 09 02880 g010
Table 1. Feed sample characteristics.
PropertyRaw Feed (RF)Centrifuged Feed (RF)
TS (g/L)21.512.2
VS (g/L)13.85.9
TSS (g/L)14.22.5
VSS (g/L)12.02.3
TDS (g/L)7.39.7
VDS (g/L)1.73.6
CODtotal (g/L)33.219.7
CODsoluble (g/L)16.611.4
NH4+ (g/L)1.81.3
pH7.07.0
TS: Total Solids; VS: Volatile Solids; TSS: Total Suspended Solids; VSS: Volatile Suspended Solids; TDS: Total Dissolved Solids; VDS: Volatile Dissolved Solids; COD: Chemical Oxygen Demand.
Table 2. Sample preparation for batch test initial conditions.
Sample NameSample DescriptionFeed (mL)Granule (mL)Total (mL)Headspace (mL)
RF1Raw feed parallel 175 (sample)200275200
RF2Raw feed parallel 275 (sample)200275200
RF3Raw feed parallel 375 (sample)200275200
RF-CEL1Raw feed and cellulase parallel 11.2 g cellulase + 75 (sample)200275200
RF-CEL2Raw feed and cellulase parallel 21.2 g cellulase + 75 (sample)200275200
RF-CEL3Raw feed and cellulase parallel 31.2 g cellulase + 75 (sample)200275200
CF1Centrifuged feed parallel 175 (sample)200275200
CF2Centrifuged feed parallel 275 (sample)200275200
CF3Centrifuged feed parallel 375 (sample)200275200
CF-CEL1Centrifuged feed and cellulase parallel 11.2 g cellulase + 75 (sample)200275200
CF-CEL2Centrifuged feed and cellulase parallel 21.2 g cellulase + 75 (sample)200275200
CF-CEL3Centrifuged feed and cellulase parallel 31.2 g cellulase + 75 (sample)200275200
BLANK1Blank parallel 175 (distilled water)200275200
BLANK2Blank parallel 275 (distilled water)200275200
BLANK-CELBlank and cellulase parallel 11.2 g cellulase + 75 (distilled water)200275200
RF: Raw Feed; CF: Centrifuged Feed; CEL: Cellulase; BLANK: Distilled water and inoculum.
Table 3. Volatile fatty acid (VFA) concentration in feed samples.
VFAConcentration (g/L)
Acetic acid3.9
Propionic acid0.2
Isobutyric acid0.0
Butyric acid0.6
Isovaleric acid0.2
Valeric acid0.1
Isocaproic acid0.0
Caproic acid0.0
Heptanoic acid0.0
Total4.9
Table 4. Selected simulation parameters and values used to implement ADM1 in Aquasim.
ParameterRFRFCFCF
KdisKdis1 and Kdis2KdisKdis1 and Kdis2
Disintegration constant (d−1)0.170.17, 0.0750.170.17, 0.075
Amino acid degrading organisms (kg COD/m3)1.701.701.701.70
Acetate degrading organisms (kg COD/m3)2.232.232.232.23
Butyrate/valerate degrading organisms (kg COD/m3)0.690.690.690.69
Fatty acid degrading organisms (kg COD/m3)1.851.851.851.85
Hydrogen degrading organisms (kg COD/m3)1.051.051.051.05
Propionate degrading organisms (kg COD/m3)0.290.290.290.29
Sugar degrading organisms (kg COD/m3)1.681.681.681.68
Soluble amino acids (kg COD/m3)0.20.20.20.2
Soluble fatty acids (kg COD/m3)0.250.250.250.25
Soluble acetates (kg COD/m3)0.660.660.660.66
Soluble butyrates (kg COD/m3)0.150.150.150.15
Soluble propionates (kg COD/m3)0.050.050.050.05
Soluble valerates (kg COD/m3)0.080.080.080.08
Table 5. Comparison of theoretical (assuming complete feed COD conversion) and experimental methane productions.
SampleExperimental (mL)Theoretical (mL)Efficiency (%)
RF403 ± 7389845
RF-CEL621 ± 5489869
CF331 ± 6153362
CF-CEL462 ± 5753387
Table 6. Specific methane yield of samples.
Specific Methane YieldRFRF-CELCFCF-CEL
L CH4/g TS0.250.380.360.51
L CH4/g VS0.40.60.71.0
L CH4/g CODtotal0.160.250.220.31
L CH4/g CODsoluble0.320.50.390.54
g CODCH4/g CODtotal0.440.690.610.86
Table 7. Hydrolysis rate constant values estimated using Equation (2).
SampleKh (d−1)
RF0.088
RF-CEL0.154
CF0.094
CF-CEL0.120
BLANK0.062
BLANK-CEL0.148

