Article

Toward Automatic Cardiomyocyte Clustering and Counting through Hesitant Fuzzy Sets

1
School of Optical-Electrical and Computer Engineering, University of Shanghai for Science and Technology, Shanghai 200093, China
2
Department of Computer Science and Engineering, University of Nevada, Reno, NV 89557, USA
3
Department of Computer Science, University of California, Davis, CA 95616, USA
*
Authors to whom correspondence should be addressed.
Appl. Sci. 2019, 9(14), 2875; https://doi.org/10.3390/app9142875
Submission received: 31 May 2019 / Revised: 10 July 2019 / Accepted: 14 July 2019 / Published: 18 July 2019

Abstract

:

Featured Application

Automatic cell counting and clustering were performed on the blurred images of cardiomyocytes with different shapes and sizes.

Abstract

The isolation and observation of cardiomyocytes serve as the fundamental approach to cardiovascular research. The state-of-the-practice for the isolation and observation relies on manual operation of the entire culture process. Such a manual approach not only incurs high human errors, but also takes a long period of time. This paper proposes a new computer-aided paradigm to automatically, accurately, and efficiently perform the clustering and counting of cardiomyocytes, one of the key procedures for evaluating the success rate of cardiomyocytes isolation and the quality of culture medium. The key challenge of the proposed method lies in the unique, rod-like shape of cardiomyocytes, which has been hardly addressed in literature. Our proposed method employs a novel algorithm inspired by hesitant fuzzy sets and integrates an efficient implementation into the whole process of analyzing cardiomyocytes. The system, along with the data extracted from adult rats’ cardiomyocytes, has been experimentally evaluated with Matlab, showing promising results. The false accept rate (FAR) and the false reject rate (FRR) are as low as 1.46% and 1.97%, respectively. The accuracy rate is up to 98.7%—20% higher than the manual approach—and the processing time is reduced from tens of seconds to 3–5 s—an order of magnitude performance improvement.

1. Introduction

According to the World Health Organization (WHO), more than 12 million people die of heart disease each year [1]. Heart disease has become the number one killer of global population and the incidence is getting increasingly younger. Because the cardiac organ function is directly related to the cardiovascular function, studying the characteristics of cardiomyocytes is one of the fundamental approaches to studying heart diseases and cardiovascular diseases. In studying cardiomyocytes during medical cell research, one crucial step is to isolate and observe cardiomyocytes because the cardiomyocytes isolated from adult animals carry many characteristics representing disease-relevant models that are not available in cells from other developmental stages. Moreover, because the functional properties of adult cardiomyocytes are irreplaceable in other developmental stages, adult cardiomyocytes have become an important tool for studying cardiac structure, metabolism, function, pathophysiology, and its mechanisms [2,3]. With the advances of the genetic studies on cardiac functions using cellular electrophysiology and molecular biology approaches, adult cardiomyocytes have been widely used [4]. At present, most adult rat cardiomyocytes not only resemble human cells in structure and function, but also exclude fibroblasts [5] interference in the vitro culture. The normal cardiomyocytes that have just been isolated are in the shape of rods. Thus, we can distinguish the status of the cardiomyocytes according to the morphological characteristics of the cardiomyocytes. Nevertheless, the immediate rod rate after cardiomyocytes separation was low (only 10% to 15%). It is also difficult to configure cultures that extend the physiological activity of cardiomyocytes. In order to enable the technician to discover the success rate and the quality of the culture liquid in a timely manner, an automated computer system is highly desired to timely count the isolated cardiomyocytes and observe the morphological changes of the subsequent culture process, e.g., through cell clustering.
Clustering is the process of dividing a series of objects, schemes, or events into several classes that are not predefined (i.e., unsupervised). The characteristics of objects in each class are more akin to each other than those from distinct classes. Cluster analysis usually takes mathematical methods to classify objective items according to certain criteria, relying on the similarity of samples as the principle of division; therefore, choosing an appropriate similarity becomes a key factor to a successful clustering [6]. Currently, most studies on cell clustering in biology [7,8] focus on how to prevent cell clustering growth in the process of culture. However, for the studies on cell classification [9,10,11], most of them are known target categories, and the target to be classified has obvious characteristics of which category it belongs to. In the classification of cardiomyocyte shape, manual approaches are criticized for the fact that different people may hold discrepant judgments on which cardiomyocytes should be classified into which group. However, common clustering algorithms (such as k-means algorithm [12], graph theory clustering algorithm [13], and density clustering algorithm [14]) cannot work for solving the problem of cardiomyocyte clustering because their thoughts are, respectively, according to determining which category it belongs to based on the distance between the object to be clustered and the center point, or according to determining classification based on graph theory and network detection ideas, or divide the type by comparing the number of objects in the circle of the unclassified object with the radius r of the circle and the critical minimum number. Some target recognition and detection algorithms based on clustering [15,16,17,18] are applicable to specific algorithms in image processing according to different application scenarios, which will be introduced in detail. However, the cardiomyocytes in this paper need to be clustered according to their morphological characteristics in the culture medium, so these algorithms are not suitable for the cardiomyocytes clustering.
In 2009, Torra and Narukawa [19] proposed hesitant fuzzy sets, where the degree of membership of a fuzzy set is a set of possible numerical values that can intuitively describe the opinions given by different decision makers. This can balance the different preferences of decision makers and obtain more reasonable and comprehensive results, thus reducing the data loss and bias [20]. In addition, in the literature [19,21], Torra discussed the differences and connections between hesitant fuzzy sets and intuitionistic fuzzy sets [22], type 2 fuzzy sets [23], and fuzzy multiple sets [24], and point out that hesitant fuzzy sets contain intuitionistic fuzzy sets, which are special cases of type 2 fuzzy sets, and have the same form as fuzzy multiple sets, but different algorithms. However, the items to be clustered in this work are adult cardiomyocytes in the culture medium. With the increase of culturing time, the cardiomyocytes will slowly die from the long rod-shaped physiologically intact cells; in this process, people might not be able to accurately distinguish the cells. In this paper, we employ the hesitant fuzzy set theory to assign the specific classification attributes and confidence intervals of adult rat cardiomyocytes, enabling an automatic clustering of cardiomyocytes that allows researchers to quickly understand the state of cardiac cells in the culture. This kind of cell clustering based on hesitant fuzzy sets is not only applicable to the statistical changes of cell morphology in the culture process of cardiac muscle cells, but also potentially useful for the clustering of other types of cells whose shape are arbitrary. The proposed new algorithm is built up on the fuzzy set theory and to the best of our knowledge, is the very first work on computer-aided analyzing approaches over cardiomyocytes.
In summary, the contributions of this paper are the design and implementation of a new real-time automatic clustering and counting system for cardiomyocytes. The remainder of this paper is organized as follows. Section 2 reviews related cell-counting technologies. In Section 3, we present the proposed system, including the culture and recording of cardiomyocytes, the automatic counting approaches, and the automatic clustering through hesitant fuzzy sets. Section 4 reports experimental results by analyzing real cardiomyocytes with the implemented system prototype; results show that the system incurs low error rates and delivers both high accuracy and high performance compared with the conventional manual approaches. In Section 5, we conclude the paper with future research directions.

2. Related Work

Existing methods for counting cardiomyocytes are mostly manual or semi-automated operations, such as the blood cell counting plate [25], the trypan blue staining count [26], and the visual field counting method [27]. Manual counting not only takes a long time but also incurs human errors. Therefore, an automatic counting system is highly desired. Semi-automated approaches exist to record the cardiomyocyte state (e.g., frequency scaling, morphological changes) in the culture of cardiomyocytes. In [28], the cardiomyocyte motion field is calculated in real time by GPU acceleration, and the autotrophic model is used to analyze the contraction frequency of cardiomyocytes. In [29], a microelectrode-array (MEA)-based dual-function cardiomyocytes biosensor system explores the impedance detection function, monitors the rhythmic beat of cardiomyocytes, and simultaneously records the extracellular potential. Unfortunately, both of the above approaches show significant errors. Under normal circumstances, the observation of cardiomyocytes mainly depends on ordinary light microscopy. Therefore, the state of the practice of observation and statistics of cardiomyocytes are still largely dependent on manual approaches, including recording the cultivation of cardiomyocytes, extracting and clustering the target objects, counting the number of cells, and so forth. However, there are few automatic and efficient cardiomyocyte counting methods built upon efficient algorithms and computer systems. The state of the practice of automatic counting in this area is for red blood cells due to its unique shape. In the following part, we will review important work in counting cells.
Previous literature mainly focused on red blood cells. In [30], an automatic mosaic method is proposed to improve the reliability of live/dead cell counts by representing the entire red blood cell as a grid mosaic. In [31], an approach is proposed to improve the accuracy of cell counting by learning the parameter set of each application to reduce the error during fine-tuned filtering. For counting red blood cells, mathematical morphology and Otsu threshold method [32] are proposed to determine the round red blood cells, non-circular red blood cells, and overlapping red blood cells. For grayscale images [33], estimating the minimum and maximum number of red blood cells can be achieved by obtaining red blood cell, masking small circle transformation, and then detecting and counting the cells with the iterative soft threshold after removing conflicting red blood cells. Another approach [34] is to simulate human visual system by a computer-aided system and automatically detect red blood cells and white blood cells in the image. There are also many methods using artificial intelligence and machine learning to perform red blood cell counts. In [35], supervised learning and optimal clustering are employed along with spatial color classification to separate overlapping cells and count the number of fetal and maternal red blood cells. Classification of red blood cell images using spectral angle mapping (SAM) [36] is proposed; SAM leverages support vector machine (SVM) and establishes a standard red blood cell model for matching the red blood cells. The approach proposed by [37] takes convolution lexical learning and coding for red blood cell detection and counting in holographic lens imaging. Two types of single-frame processing based on machine learning [38] are proposed for lensless red blood cell counting, i.e., based on extreme learning machines and convolutional neural networks. Existing methods of counting white blood cells include [39], which detects more accurate regional boundaries by using gradient-based region growth and neighborhood effects after region segmentation. Each region is classified according to its shape, size, color, and texture features using different fuzzy and non-fuzzy techniques, respectively.
Cell counting methods for non-red blood cells are also available. In [40], a self-counting mechanism is proposed for flagellate trypanosomes infecting human cells: Firstly, morphological pre-treatment removes complex image backgrounds; secondly, unsupervised classification is used to segment collections; thirdly, threshold processing is used to preserve infected cells; and finally, cells are processed by morphological treatment and filtered by average. In [41], a robust segmentation method is proposed for counting milk somatic cells on a microscope slide image. By changing the original RGB(Red-Green-Blue, three primary colors) format of the image to the lab color space and applying the k-means clustering algorithm to remove debris and other background features, a new gray-level threshold processing method is proposed, and the remaining boundary units are separated in the final segmentation step of applying the watershed transform. In [42], a new approach is proposed using powerful cell detection and online dictionary learning for automatic Ki-67 counting.
The state-of-the-art research on target detection and recognition based on clustering features can be summarized as follows: In [15], a block-based color cluster background modeling and a foreground detection algorithm that possesses efficient processing and low memory requirement in a complex scene was proposed. In training phase, the color cluster and pixel distribution line (PDL) are efficiently used to reduce the background information. In the detection phase, the foreground objects were extracted precisely and fast in a complex scene by comparing the color clusters and PDLs. In [16], a salient object detection (SOD) approach was proposed to automatically isolate important objects from the background in images. In [17], a subcategory-aware CNN (S-CNN) was proposed to solve the object intra-class variation problem. In the proposed technique, the training samples were first grouped into multiple subcategories automatically through a novel instance sharing maximum margin clustering process. A multi-component aggregated channel feature (ACF) detector was then trained to produce more latent training samples, where each ACF component corresponds to one clustered subcategory. The produced latent samples together with their subcategory labels were further fed into a CNN classifier to filter out false proposals for object detection. In addition, an iterative learning algorithm was designed for the joint optimization of image subcategorization, multi-component ACF detector, and subcategory-aware CNN classifier. In [18], a scalable bi-level parallel object detection framework based on heterogeneous manycore cluster was established to improve object detection performance for embedded device. First, the fundamental principle of local binary pattern and cascade classifier combined object-detection method was introduced as the basis of the research. Second, a set of key algorithms designed to parallel access and process image for object detection based on Parallella manycore platform was proposed to improve the detection speed and the computational resource efficiency on a single node. Third, a message passing interface-based distributed framework was established for cluster environment to further improve the performance. Finally, an experiment of face detection application was conducted to evaluate the accuracy and performance of this framework.
Due to the size difference and shape non-fixation of cardiomyocytes, and the difficulty of cardiomyocytes motion blur and high noise in experimental image acquisition, the above algorithms cannot accurately count and cluster cardiomyocytes. The main contribution of this paper is the design and implementation of a new real-time automatic counting based on cardiomyocyte morphology and clustering system for cardiomyocytes based on hesitant fuzzy sets. This algorithm can quickly let the experimenter know the number of currently viable cardiomyocytes in the culture medium and the current morphological changes of these cardiomyocytes. This work, to the best of our knowledge, is the first automatic tool to count cardiomyocytes.

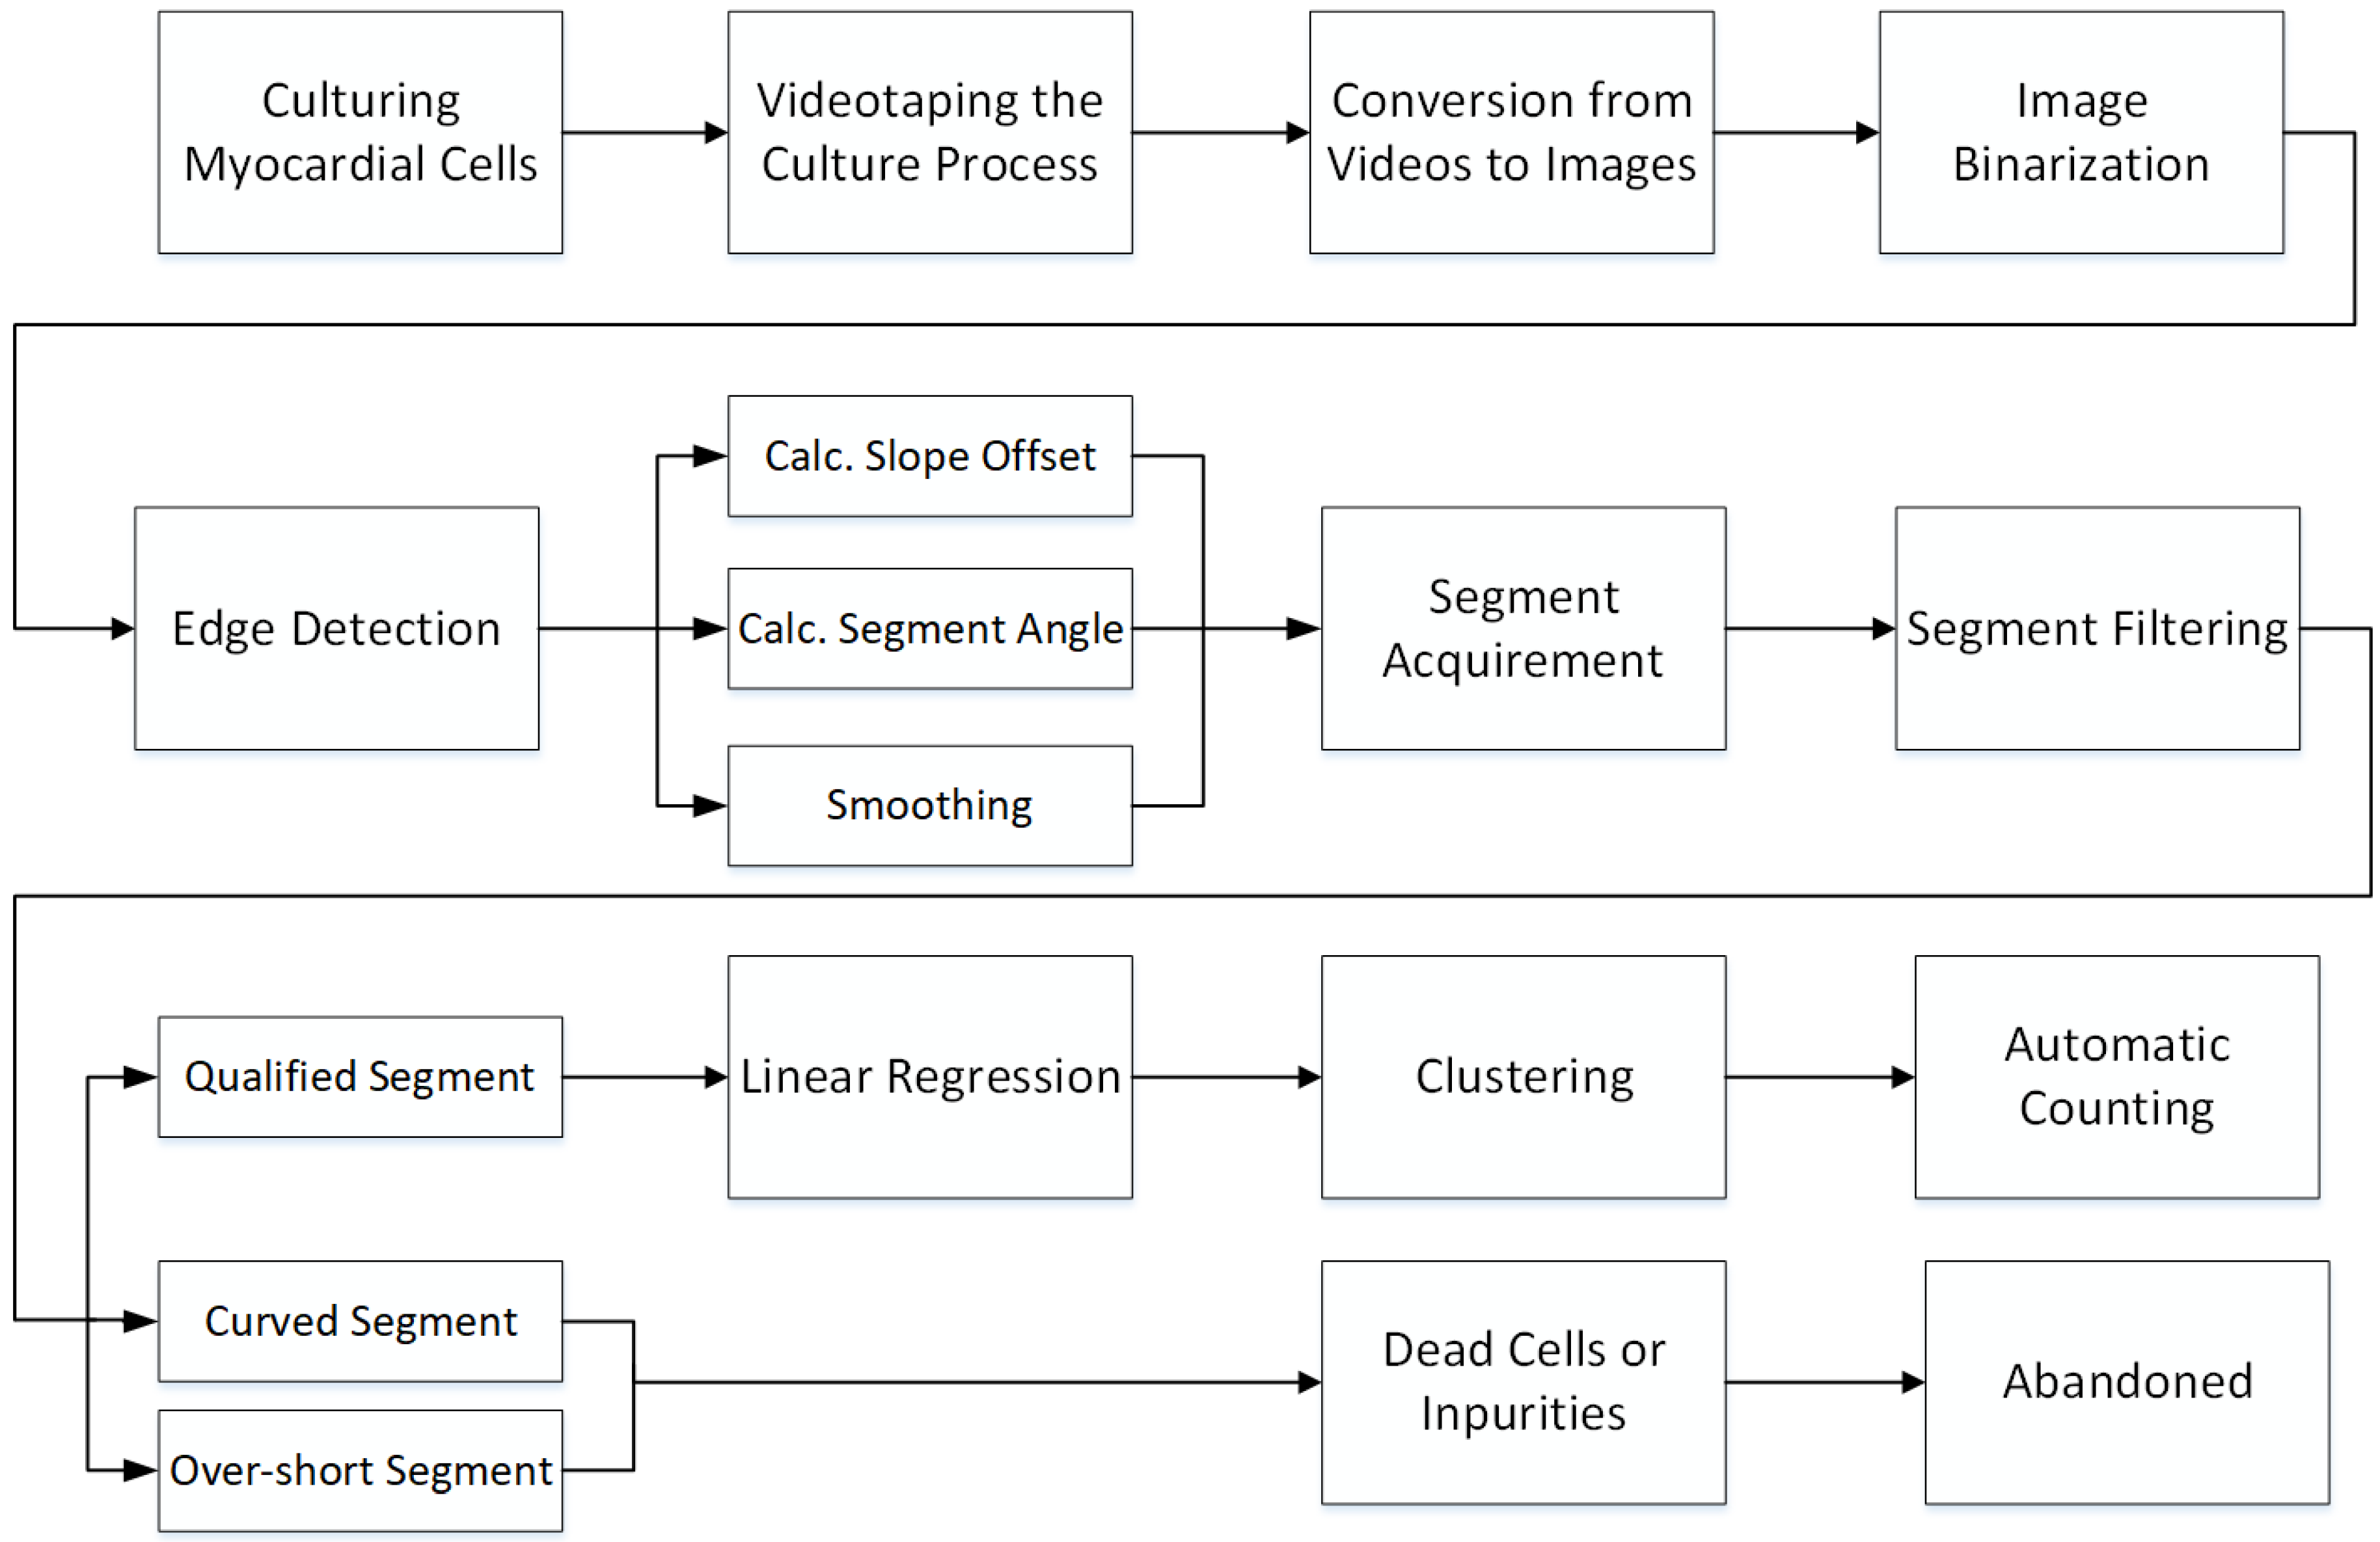
3. Methods and Algorithms

In the process of the myocardial cell culture, the experimenter is required to conduct real-time recording of the medium cell changes in physiological characteristics. The process of apoptosis, in the training process for 2–3 days, is recorded; also, the degree of myocardial cell apoptosis is tracked to facilitate the classification. In order to observe the effects of transgenes on the contractile function of adult rat cardiac myocytes, it is necessary to establish an effective and stable method for isolation and culture of adult rat cardiac cells. This system should promptly report the experiment’s success rate and the appropriateness of the culture through repeated experiments, which can help to form more effective separation n and culture methods. We illustrate the overall workflow for automatic cell counting in Figure 1, starting from the top-left corner. The proposed system consists of the following key steps: (i) Obtaining cardiomyocytes; (ii) extracting images; (iii) counting algorithms; and (iv) clustering with hesitant fuzzy sets.

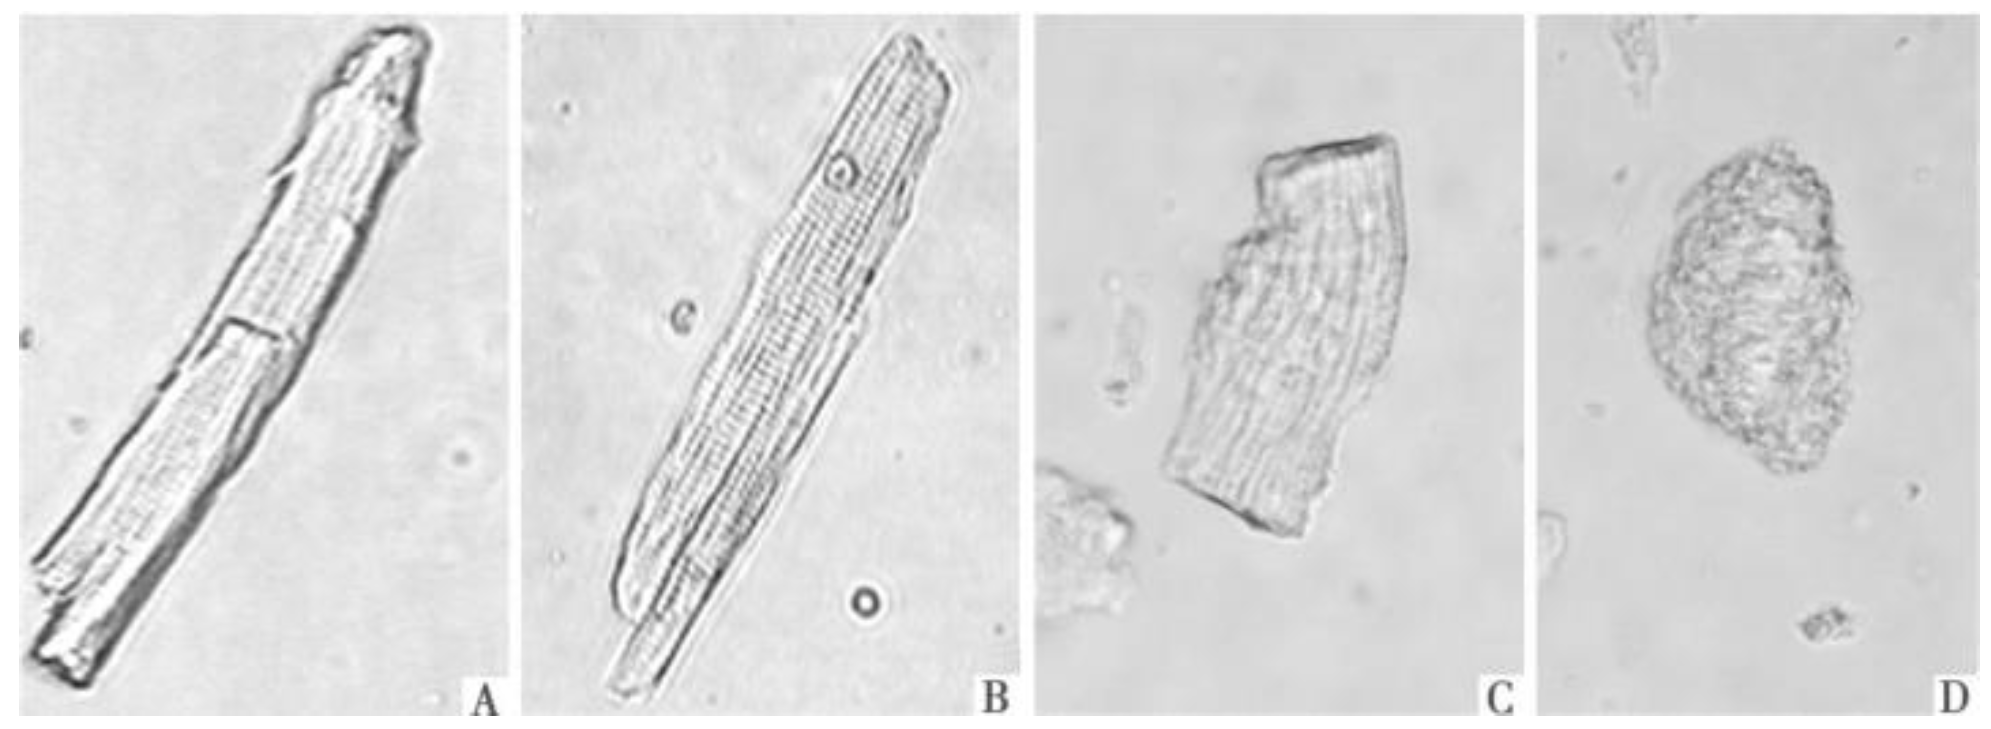
3.1. Isolation and Culture of Adult Rat Cardiomyocytes

Adult SD(Sprague-Dawley) rats, male or female, weighing between 200–250 g, were provided by the Experimental Animal Center of Xuzhou Medical College. SD rats were injected with 5000 U kg of heparin intraperitoneally. After 10 min, they were anesthetized with 1% pentobarbital sodium. The heart was quickly opened and immediately placed in ice-cold oxygen-saturated calcium free solution. All the blood vessels were cut around the heart except the aorta, connective tissue, and the upper part of the aortic arch. The heart was then hung on the Langendorff perfusion device. The insertion depth of the cannula should not exceed the aortic valve and should be fixed by wire ligation. After the aorta was retrogradely perfused without calcium solution, after 5 min, the enzyme solution was perfused for 20 to 30 min. The temperature around the heart and the temperature of the perfusate were maintained at 37 °C during the whole perfusion, and the flow rate was 6 mL/min.
When the heart became soft, it was cut into dissolved 25 mg collagenase in 5–6 mL warm Powell medium with 12.5   μ L CaCl 2 ( 30   μ M ) ; the atria and basal tissue were cut off, the ventricular tissue was cut into pieces of about 1   mm × 1   mm × 1   mm , and was gently blown with a thick open pipette. Single cell and cell clusters fell off, then were filtered with 200 mesh nylon mesh. The filtrate was allowed to stand at room temperature for 20 min, the cells were naturally sediment, the supernatant was then removed, 12 mL of warm Powell medium was further added to 120   μ L of CaCl 2   ( 1   mM ) for natural sedimentation, and the cells were allowed to stand at room temperature for one hour until use. The cells were seeded in a 12-well culture plate, and each well was about 2 × 134 cells; cells were cultured in a CO2 incubator in a serum-free high-dose DMEM.
Under the inverted light microscope, the cardiomyocytes mainly showed the following forms: The better-performing cardiomyocytes were long rod-shaped cells stretched, the cell membrane was intact, the surface was smooth, the refractive index was strong, and the cells had no obvious pulsation, showing a clear horizontal pattern. The pattern has sharp edges at both ends—the ratio of length to width is { 4 l 6 } :1 (l is the length of cardiomyocytes); the cardiomyocytes are blurred in horizontal stripes, and there are vesicles in the cells; some of the cardiomyocytes are rounded and blunt at both ends. Bending or contracture, the volume becomes larger, and the cell membrane surface is blistered; the other cardiomyocytes become round or severely atrophied into dead cells. The purpose of this system is to distinguish between four types of cardiomyocytes and counts of cells of type A, B, and C at each time period, as shown in Figure 2.

3.2. Videotaping the Procedure

In the process of adult rat cardiomyocyte culture, we used the Leica DCM8 model optical microscope to record the cardiomyocytes culture process in real time at 10 × magnification with CCD camera. The shooting frequency is up to 830 frames/s, with resolution of 720 × 404 × 96-pixel RGB color. The images shown in this article are gray-scale imaging after magnifying 10 times under an optical microscope.

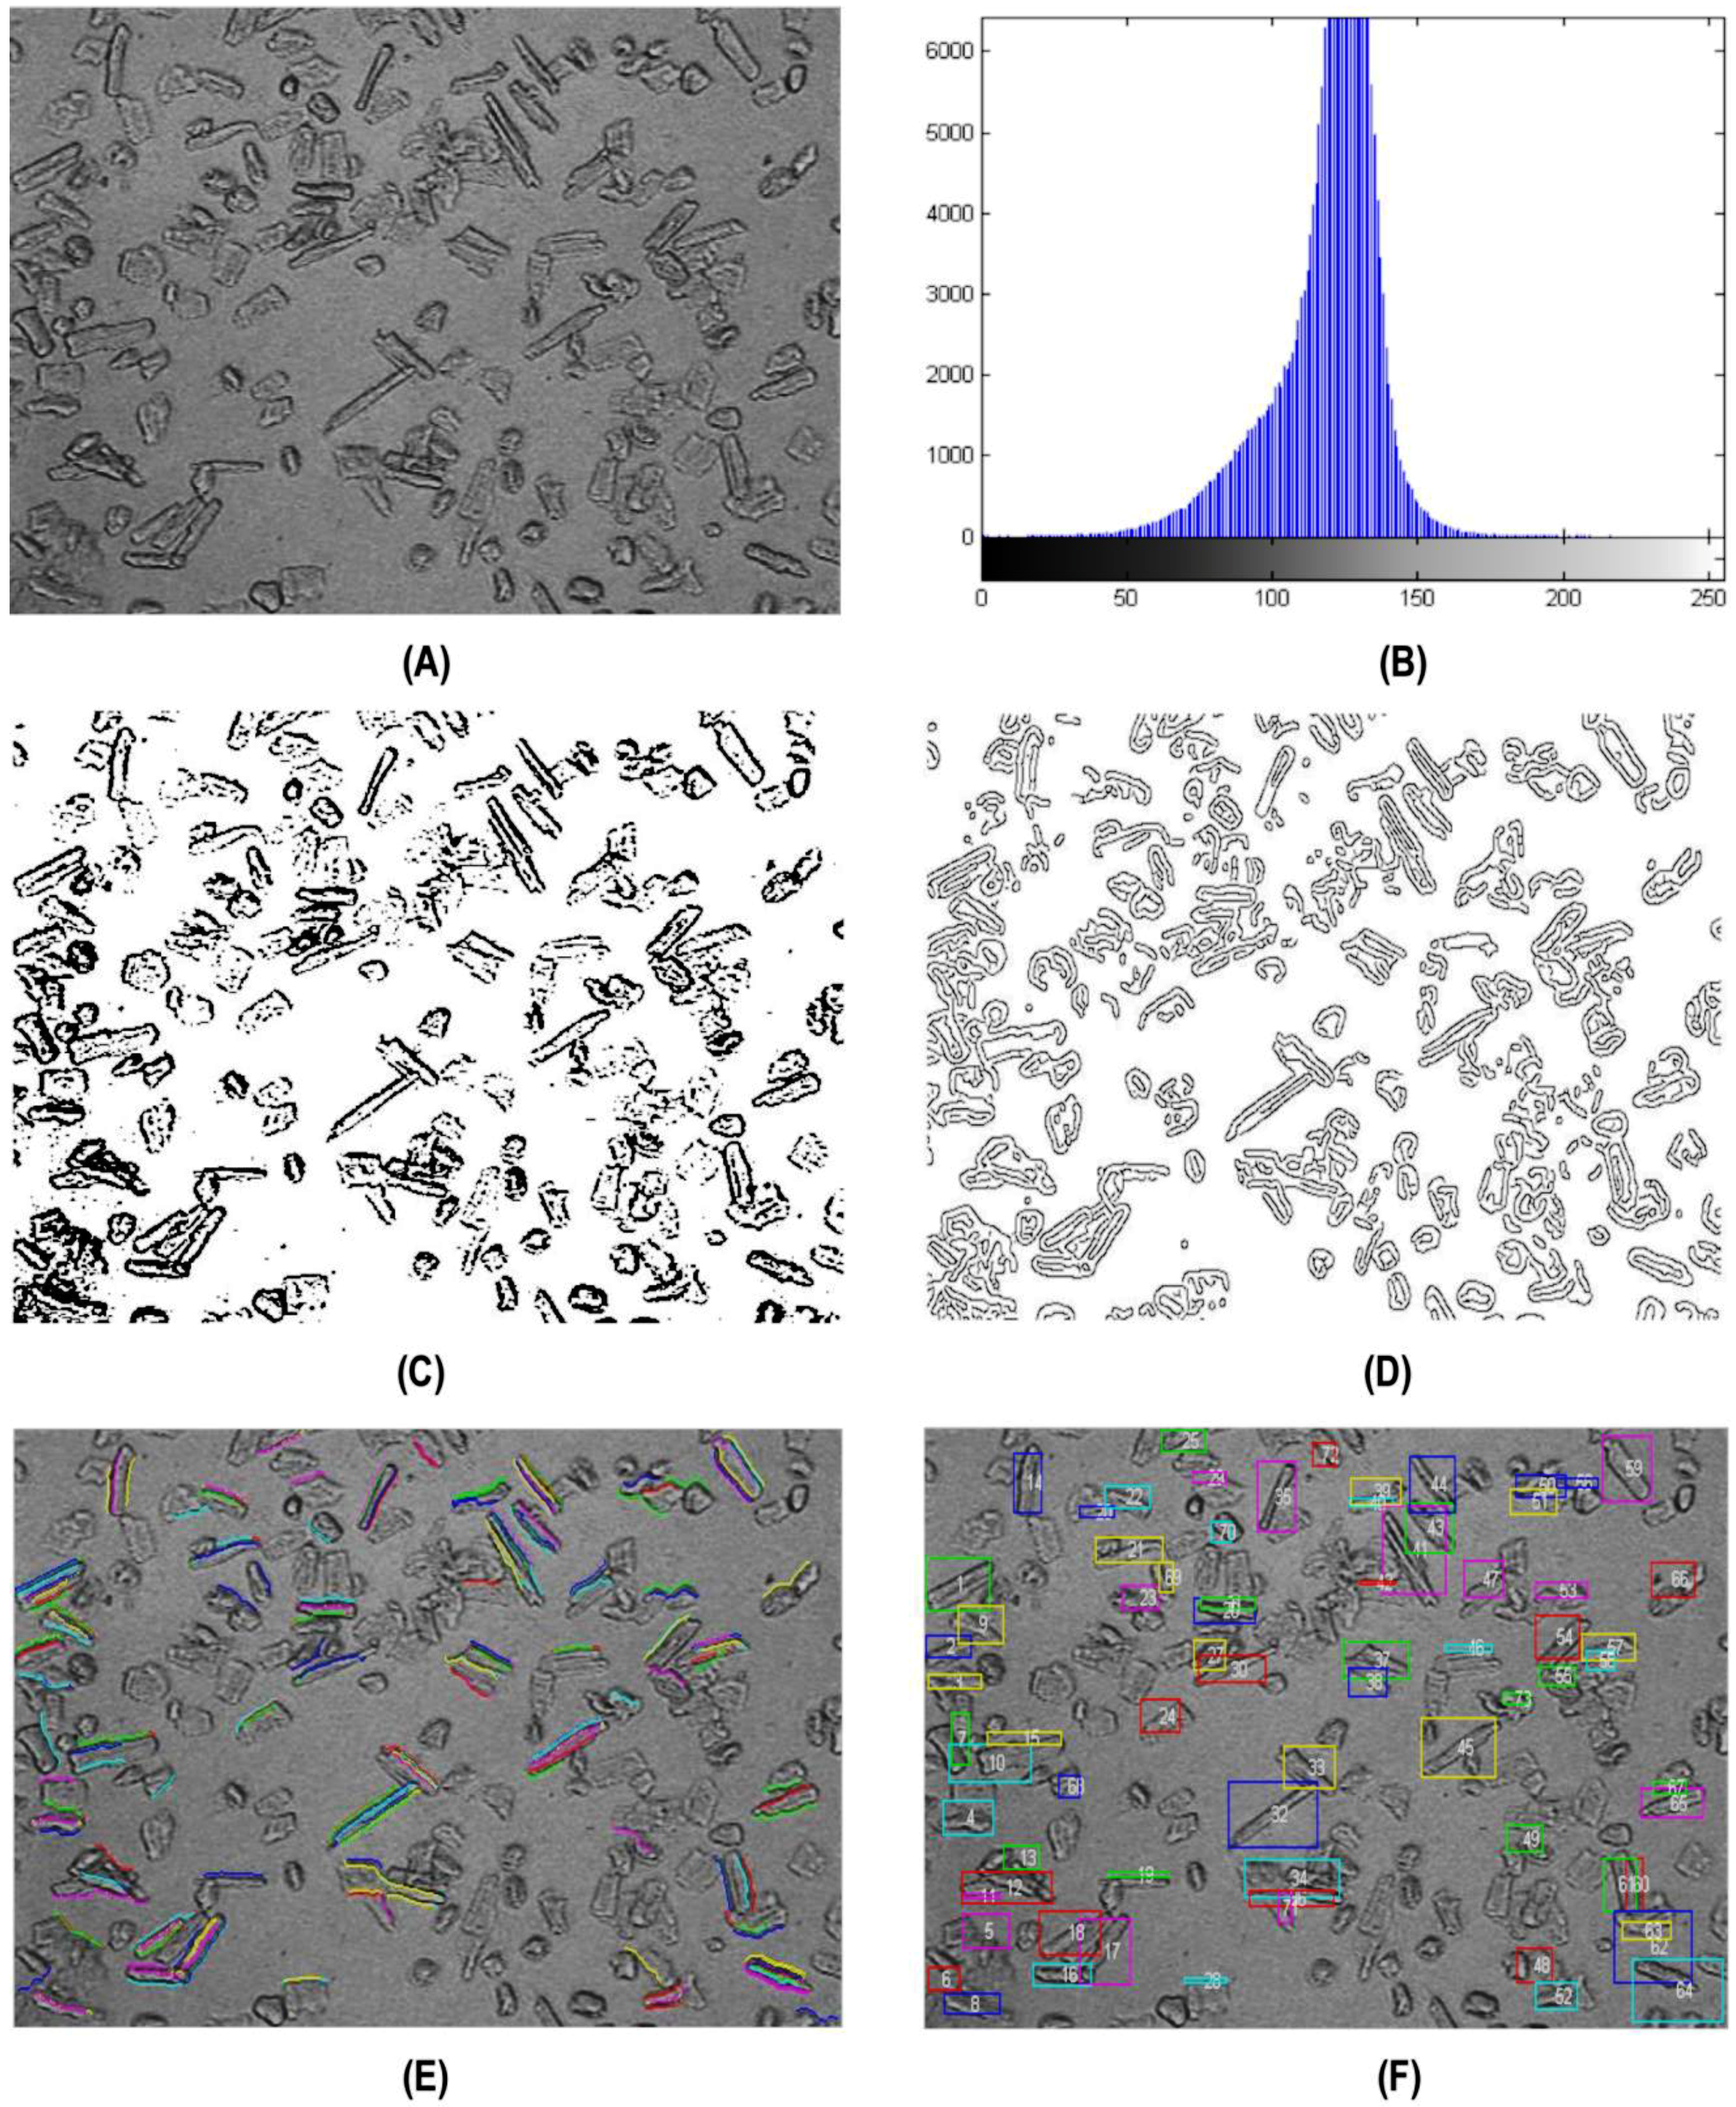
3.3. Automatic Counting for Cardiomyocytes

The proposed system works as follows. First, the experimenter (i.e., medical staff) determines the specific stage of the cardiomyocytes culture process to be analyzed; the system then records a certain part in the cardiomyocytes culture video and stores the video into a time-series image. Furthermore, the system then arbitrarily selects an image in the same time period as shown in Figure 3A. In this paper, based on the unique rod-like characteristics of adult rat cardiomyocytes, a multi-morphological automatic counting algorithm is developed. Secondly, we remove dead cells and other impurities according to the morphological characteristics of cardiomyocytes in the medium, and then automatically count the three types of cells A, B, C, and the cardiomyocytes between these three states, which are observed with naked eye. The different states of cardiomyocytes can be roughly distinguished. Thirdly, in order to let the computer system automatically distinguish the different states of cardiomyocytes, this paper proposes to employ hesitant fuzzy sets and clustering algorithms to automatically classify different forms of cardiomyocytes.
We detail the automatic procedure using a concrete example as follows. The whole process of automatic counting algorithm of cardiac muscle cells is shown in Figure 1. Figure 3 is a more specific explanation of how Figure 1 performs the physical transformation of cell count. Therefore, by combining Figure 1 and Figure 3, we can better understand the whole process of cell count. Figure 3A is the grayscale transformation of one of the color images arbitrarily selected from the time series image. The purpose of automatic cell counting is to remove impurities and dead cardiac cells in Figure 3A and obtain cardiac cells that are still biologically active. In order to be able to extract the edges of the cells, first, the gray histogram statistics are obtained as shown in Figure 3B; the gray value of Figure 3A is concentrated between 105 and 140, and the image can be binarized by repeated experiments of the accuracy of the cell counting. The threshold is set to binarylevel = 105/256 because this threshold makes the edge sharpness of the cell the highest. Then, the grayscale image in Figure 3A is converted into binary image by threshold transformation method, and the grayscale value of the cell edge contour is converted into 255 and the others into 0, which lays a foundation for the next step of cell edge extraction, as shown in Figure 3C. Then, we need to extract the edge of the cell; canny edge detection algorithm is mainly used [43], which can be divided into the following five steps: (a) Gaussian filtering is applied to smooth the image with the purpose of removing noise; (b) find the intensity gradients of the image; (c) non-maximum suppression technology is applied to eliminate side error detection; (d) apply the method of double threshold to determine the possible (potential) boundary; and (e) use lag technology to track boundaries.
According to the normal ratio of length to width of cardiomyocytes { 4 l 6 } :1, the system set the length of cardiomyocytes at { 30 l 70 } and the width range to { 10 d 20 } (d is the width of the cardiomyocytes) in millimeters. Then, the rod-shaped cardiomyocytes are distinguished from dead cells and impurities as shown in Figure 3D by following these three steps: (i) calculate the offset of the slope of each segment; (ii) calculate the angle of each segment; and (iii) filter the results. Before delineating the edge of rod-shaped cardiomyocytes, we first obtain the information on all the line segments, and then filter out the short and non-straight-line segments. The remaining line segments are the straight lines of the rod-shaped cardiomyocytes we are interested in. Then, we perform linear regression analysis, obtain the length slope of these lines, and other information to prepare for the following clusters. At this point, we get the results of linear regression as shown in Figure 3E, and finally cluster the results according to the distance relationship. The line segment (within the range of reasonable cardiomyocyte width) is considered to be the edge of the same cell as shown in Figure 3F. In our example, the total number of identified cardiomyocytes was 73.

3.4. Hesitant Fuzzy Sets for Clustering

We will focus on the relevant contents of hesitation fuzzy sets (HFSs) [19] and correlation coefficients of HFSs [44].
Definition 1.
[19]let X be a reference set, a hesitant fuzzy set (HFS) A on X is defined in terms of a function hA(x) when applied to X returns a finite subset of [0,1], i.e.,
A = { < x , h A ( x ) > | x X }
where h A ( x ) is a set of some different values in [0,1], representing the possible membership degrees of the element x X to A. For convenience, we call h A ( x ) a hesitant fuzzy element (HFE).
Let X = { x 1 , x 2 , , x n } be a discrete universe of discourse, A and B be two HFSs on X denoted as A = { < x i , h A ( x i ) > | x i X , i = 1 , 2 , , n } and B = { < x i , h B ( x i ) > | x i X , i = 1 , 2 , , n } , respectively.
It is noted that the number of values in different HFEs may be different. To compute the correlation coefficients between two HFSs, let l i = max { l   ( h A ( x i ) ) , l   ( h B ( x i ) ) } for each x i in X, where l   ( h A ( x i ) )   and   l   ( h B ( x i ) ) represent the number of values in h A ( x i )   and   h B ( x i ) , respectively. When l   ( h A ( x i ) ) l   ( h B ( x i ) ) , one can make them to have the same number of elements by adding some elements to the HFE, which has less number of elements. In terms of the pessimistic principle, the smallest element will be added, while in the opposite case, the optimistic principle may be adopted. In the present work, we use the former case. Especially, if l   ( h A ( x i ) ) < l   ( h B ( x i ) ) , then h A ( x i ) should be extended by adding the minimum value in it until it has the same length as h B ( x i ) . This idea has been successfully applied to distance and similarity measures for HFSs.
According to [19], a hesitant fuzzy set (HFS) A on a reference set X is defined in terms of a function h A ( x ) , which takes X as input and returns a finite subset of [0,1]. The correlation [44] between two HFS’s A and B are defined as:
C H F S ( A , B ) = i = 1 n ( 1 l i j = 1 l i h A σ ( j ) ( x i ) · h B σ ( j ) ( x i ) )
where A δ ( i ) indicates the j-th largest value in A. In practical applications, the elements X i ’s ( i = 1 , 2 , , n   in   X ) all have different weights. Let w = ( w 1 , w 2 , , w n ) T be the weight vector of x i with w i 0 , and i = 1 n w i = 1 . In our proposed algorithm, we normalize the correlation coefficient as follows:
ρ H F S ( A , B ) = C H F S ( A , B )   [ C H F S ( A , A ) ] 1 2 ·   [ C H F S ( B , B ) ] 1 2 = i = 1 n w i ( 1 l i j = 1 l i h A σ ( j ) ( x i ) h B σ ( j ) ( x i ) )   [ i = 1 n w i ( 1 l i j = 1 l i h A σ ( j ) 2 ( x i ) ) ] 1 2 ·   [ i = 1 n w i ( 1 l i j = 1 l i h B σ ( j ) 2 ( x i ) ) ] 1 2
Definition 2.
[44] Let A j ( j = 1 , 2 , , m ) be m HFSs, and C = ( ρ i j ) m × m be a correlation matrix, where ρ i j = ρ ( A i , A j ) denotes the correlation coefficient of two HFSs A i and A j and satisfies:
1. 
0 ρ i j 1 ,   i , j = 1 , 2 , , m ;
2. 
ρ i i = 1 ,   i = 1 , 2 , , m ;
3. 
ρ i j = ρ j i ,   i , j = 1 , 2 , , m .
We will introduce the related properties of the correlation coefficient of the hesitant fuzzy set in the literature [45] to explain, as follows.
Definition 3.
Let C = ( ρ i j ) m   ×   m be a correlation matrix, if C 2 = C ° C = ( ρ ¯ i j ) m   ×   m   , then C 2 is called a composition matrix of C, where
  ρ ¯ i j = max k   { min   ( ρ i k , ρ k j ) } ,   i , j = 1 , 2 , , m .
Theorem 1.
Let C = ( ρ i j ) m   ×   m be a correlation matrix. Then, the composition matrix C 2 = C   ° C = ( ρ ¯ i j ) m   ×   m is also a correlation matrix.
Theorem 2.
Let C be a correlation matrix. Then, for any nonnegative integers m 1 and m 2   , the composition matrix   C m 1 + m 2 derived from C m 1 + m 2 = C m 1 × C m 2 is still a correlation matrix.
Definition 4.
Let C = ( ρ i j )   m   ×   m be a correlation matrix, if C 2 C , i.e.,
max k   { min   { ρ i k , ρ k j } } ρ i j ,   i , j = 1 , 2 , , m ,
then C is called an equivalent correlation matrix.
Theorem 3.
Let C = ( ρ i j ) m × m be a correlation matrix. Then, after the finite times of compositions: C C 2 C 4 C 2 k   , there must exist a positive integer k such that C 2 k = C 2 ( k + 1 ) and C 2 k is also an equivalent correlation matrix.
Definition 5.
Let C = ( ρ i j ) m   ×   m be an equivalent correlation matrix. Then, we call C λ = ( ρ i j   ( λ ) ) m   ×   m the λ -cutting matrix of C, where
ρ i j   ( λ ) = { 0   if   ρ i j <   λ , 1   if   ρ i j   λ ,   i , j = 1 , 2 , , m
and λ is the confidence level with   λ   [ 0 , 1 ]   .
In multi-attribute decision making, different attributes play different roles in the final decision and should be given different weights. In this paper, different weights represent the priorities of different attributes for categorizing cardiomyocytes. We use A = ( A 1 , A 2 , , A m ) , X = ( X 1 , X 2 , , X n ) , w = ( w 1 , w 2 , , w n ) T to indicate the object set, the attribute set, and the weight vector, respectively. The formal algorithm of extending hesitant fuzzy sets for classifying cardiomyocytes is as follows: Firstly, according to Equation (3), to calculate the correlation coefficient ρ i j of any two hesitant fuzzy sets (i.e., two different cardiomyocytes) A i   and A j under the attribute set, we construct a correlation matrix C = ( ρ i j ) m   ×   m , where ρ i j = ρ ( A i , A j ) . Secondly, we check whether C = ( ρ i j ) m   ×   m is an equivalent correlation matrix. In other words, we check whether C 2 C , where C 2 = C   °   C = ( ρ i j ) m   ×   m , ρ i j = M A X k   { M I N   ( ρ i k , ρ k j ) } , and 1 i k j m . If it does not hold, we repeatedly construct the equivalent correlation matrix C 2 k : C C 2 C 4 , until C 2 k = C 2 k + 1 . Thirdly, for a confidence level λ , we construct a λ -cutting Matrix C λ = ( ρ i j ( λ ) ) m   ×   m in order to classify the HFS’s H j s ( j = 1 , 2 , , m ) . If all elements of the i-th line (column) in C λ are the same as the corresponding elements of the j-th line (column) in C λ , then the HFS’s A i and A j are of the same type. See Algorithm 1 for details.
Algorithm 1. Automatic classification algorithm of cardiomyocytes based on hesitating fuzzy set
1. Cardiomyocytes to be evaluated were selected as the evaluation objects of the hesitating fuzzy set, and denoted by { A 1 , A 2 , , A m };
2. According to the given attribute parameters, the correlation coefficient between them is calculated according to formula (3), and a matrix of correlation coefficients C = ( ρ i j ) m   ×   m is constructed;
3. If C = ( ρ i j ) m   ×   m is an equivalent correlation matrix, then
Check whether it satisfies C 2 C , where C 2 = C   °   C = ( ρ ¯ i j ) m   ×   m ,   ρ ¯ i j = m a x k   { min   ( ρ i k , ρ k j ) } ,
i , j = 1 , 2 , , m .
Otherwise, construct the equivalent correlation matrix C 2 k :
C C 2 C 4 C 2 k ,   u n t i l   C 2 k = C 2 ( k + 1 )
End if
5. Using definition 5, construct a λ -cutting Matrix C λ = ( ρ i j ( λ ) ) m   ×   m in order to classify the HFS’s H j s ( j = 1 , 2 , , m ) .
6. If λ = 1 then
All the elements are in a class of their own
7. Otherwise, classify these m cardiomyocytes according to λ
8. End if
Following the above Algorithm 1, we can classify all m HFS’s. Obviously, when λ = 1 , each object forms a class by itself; as the value of λ decreases, the object gradually becomes coarser and merged into a bigger class. When λ changes from 1 to 0, the number of classifications changes from m to 1 and finally forms a dynamic cluster spectrum.

4. Experimentation and Evaluation

4.1. Experimental Setup

The dataset was provided by our collaborator from the Xuzhou Medical College. We utilized a complex wavelet transform domain local phase coherence-based method for no-reference image sharpness assessment [46]. Sharpness assessment is often measured through blurriness evaluation, as blur is the most common cause of the degradation of image sharpness. Spatial domain algorithms often rely on detecting the variations of global or local statistical features such as variance, autocorrelation, kurtosis, derivative energy, and edge spread. Transform domain methods are mostly based on the fact that blur leads to energy attenuation at high spatial frequencies. The global or local frequency energy falloff can then be measured in different ways to identify image blur. We need to evaluate the activity of cardiomyocytes not only from the aspect ratio and edge sharpness of cardiomyocytes, but also from the definition of individual cardiomyocytes. Here, we introduced the energy gradient function [47] d CON to reflect the contrast of individual cardiomyocytes, so as to evaluate the definition of images in real time. As described in the literature [47], the ratio of the maximum value and the average value is obtained through the dynamic focusing window to measure the image definition.

4.2. Parameter Space

Table 1 presents the relevant parameters used in our experiments. ( l : d ) indicates the ratio of length to width of cardiomyocytes; E e s indicates the sharpness of the edge of cardiomyocytes; its maximum sharpness value is 100. However, according to the evaluation of this algorithm, the edge sharpness of the image cells in this experiment can reach up to 70, as shown in Table 1. When its value reaches 70, it can be rated as 1. d C O N   indicates the contrast of cardiomyocyte images to represent the energy gradient of each cardiomyocyte. As shown in Table 1, the attribute set in our study is composed of three properties: X = { X 1 , X 2 , X 3 } , where X 1 indicates the length:width ratio of the cell, X 2 indicates the entirety of the cytomembrane, and X 3 indicates the clarity of the cell, respectively. The according weight vector is w = { w 1 , w 2 , w 3 } T = { 0.5 , 0.25 , 0.25 } T .

4.3. Clustering Cardiomyocyte Cells

For the sake of brevity, we only show the steps of applying the proposed algorithm for the first 10 cardiomyocytes. According to the early assumptions, the cardiomyocytes are divided into three categories. The value of λ in this example is set to 0.9795 < λ < 0.9904 . Table 2 reports the mean value of each attribute of each cardiomyocyte in the evaluation. For instance, A 7 belongs to class A cardiomyocytes, A 5   belongs to class C cells, and others belong to class B cells. This result, to some extent, shows only the probability (or confidence intervals), as a result of applying fuzzy sets. We would like to highlight that for certain applications like cardiomyocyte classification, a precise result is often not required; usually, the experimenter only needs a high-level understanding of different classifications represented by the myocardial cells.
For the integrity of the experiment, we performed the same clustering operation on the remaining cardiomyocytes, and obtained the following results: { A 18 , A 26 , A 32 , A 35 , A 59 } belong to class A cardiomyocytes, { A 20 , A 23 , A 24 , A 28 , A 29 , A 47 , A 48 , A 51 , A 53 , A 56 , A 67 , A 73 } belong to class C cardiomyocytes, and others belong to class B cells. From the point of the results of statistics, 17.8% of the myocardial cells had died, and only 8.2% are in the best active state.

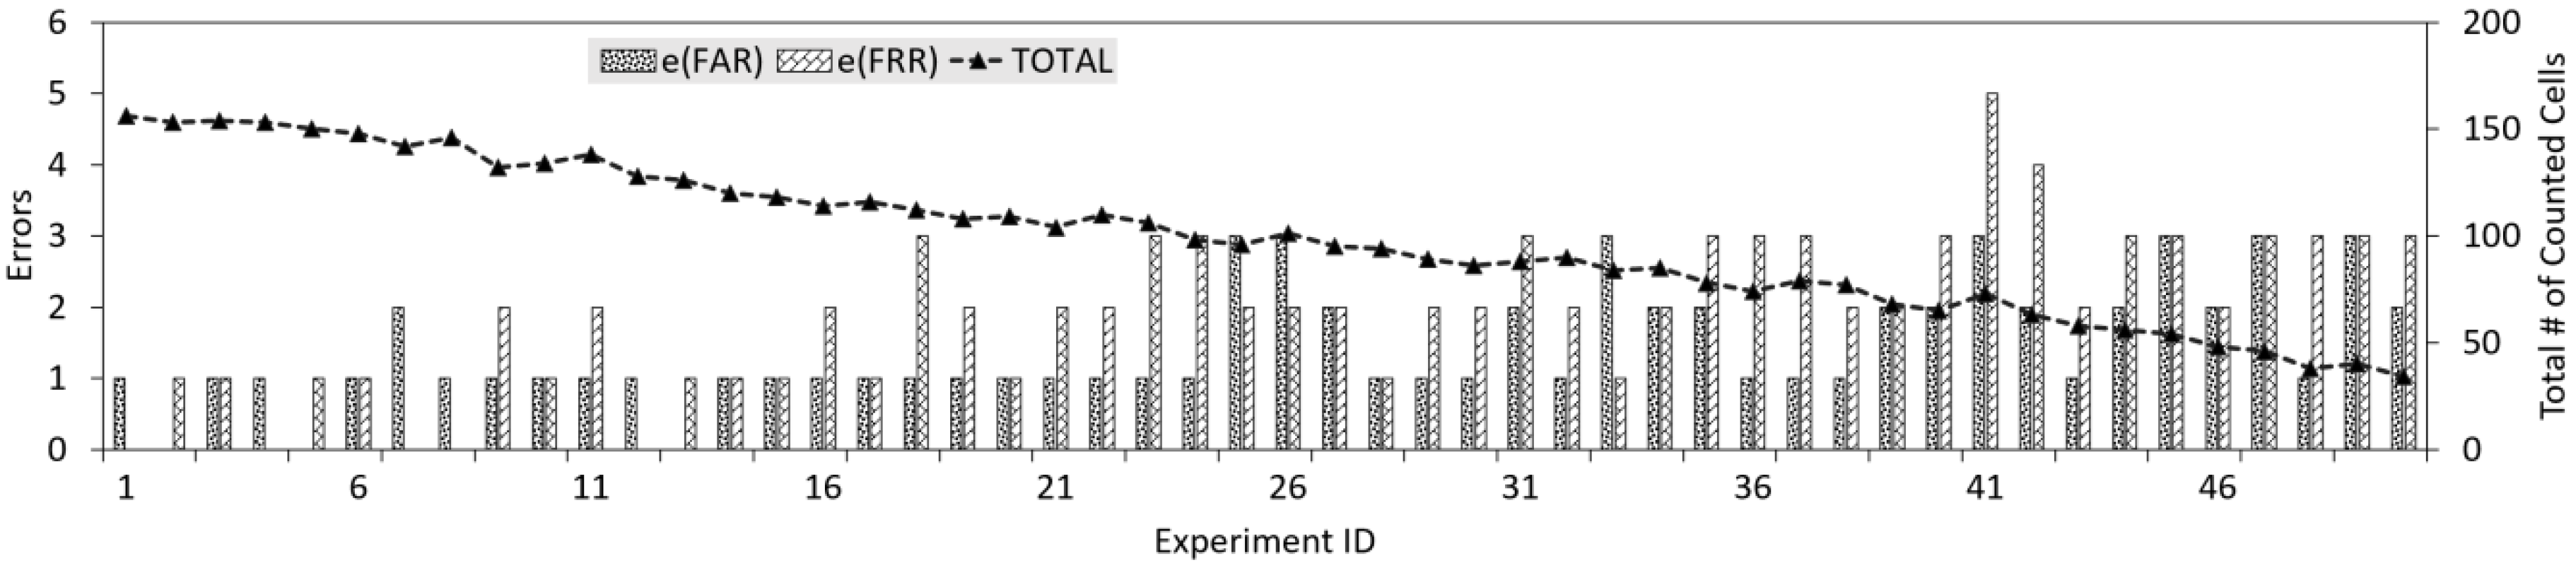
4.4. Evaluating Cell Counting

When evaluating cell counting, we use two metrics to evaluate the reliability, namely the false accept rate (FAR) and the false reject rate (FRR). FAR represents the ratio of dead cells that are mistakenly counted toward to the result; FRR represents the ratio of living cells that are not counted in the number of viable cells. Formally, FAR and FRR are defined as: FAR = E F A R / N F A R and FRR = E F R R / N F R R , where E F A R indicates the miscalculated number of dead cardiomyocytes, E F R R indicates the number of living cardiomyocytes that were not counted in the total cardiomyocytes, and N F R R and N F A R indicate the total number of cardiomyocytes in both scenarios, respectively. A high FAR makes the cell-counting system inaccurate because the system accounts for too many dead cells or impurities; a high FRR causes the system to miss the living cells and the number of live cells counted is not accurate. One design goal of our proposed system is to achieve low, if not negligible, FAR and FRR rates. Although cardiomyocytes can generally survive for about seven days in the medium, they basically lose the rod-like characteristics on the third day. Therefore, in our experiment, only 50 microscope fields are collected for the first 48 h. Cardiomyocyte counts are performed in 50 different regions. For the same reason, experiments conducted at different timestamps do exhibit discrepant results. Specifically, we expect that in the initial stage of culture, the accuracy should be higher than that of the later stages because most of the cardiomyocytes in the early stage retain the rod shape and are easy to be detected by our system. In the image-processing experiments above, the cardiomyocytes are cultured for 6–8 h.
We report the experimental results in Figure 4. The X-axis indicates the experimental serial number (ID), e(FAR) indicates the number of dead cardiomyocytes that are mistakenly counted in a specific experiment, e(FRR) indicates the number of live cardiomyocytes that should have been counted in a specific experiment, and TOTAL represents the total number of cardiomyocytes counted each time. That is, E F A R = i = 1 n e i ( F A R ) and E F R R = i = 1 n e i ( F R R ) , where i corresponds to the experiment ID in Figure 4. The accuracy of the counting system is higher in the earlier stages because the myocardial cells retain the rod-like shapes. Overall, by looking at the span of 50 h, our system achieves both low error rates: FAR = 1.46%, FRR = 1.97%. However, when the cardiomyocytes are analyzed in the time range of 36–48 h, the errors rates increase to: FAR = 3.26%, FRR = 4.94%.

4.5. Comparison to the Conventional Approach

The automatic classification and counting algorithm for cardiomyocytes is rarely reported in the scientific literature. The main contribution of this paper is the proposal of a new computerized tool for automatically counting the cells with both high accuracy and high performance. To this end, the proposed system is mainly compared to the state-of-the-practice manual counting. We select 50 fields of images for each incubation period to count, calculate the mean values, and compare the two approaches in Figure 5.
As shown in Figure 5A, we can see that the accuracy of the proposed system does as expected; it decreases over time as the accuracy of manual counting increases. We have previously explained why the accuracy would decrease for automatic counting. The results of the manual case can be best explained by the fact that the number of rod-shaped cardiomyocytes decreases at later stages and therefore the human errors in manual counting is significantly reduced. Of note, the highest accuracy rate of manual counting reaches 82.1%, yet is still lower than the lowest possible accuracy rate of the proposed system, 89.1%. It should be also noted that at the most important timing (i.e., the first observation), the highest accuracy rate of the automatic tool is as high as 98.7%, compared to the mediocre accuracy of the manual approach under 75%. The largest part of this automatic cardiomyocyte classification algorithm is that it can timely inform the experimenter of the status of cardiomyocytes in the culture medium, so as to facilitate the experimenter to add culture liquid later. If the whole culture process is looked at, this algorithm can help the experimenter to focus on the whole apoptosis process of a specific cardiomyocyte.
As shown in Figure 5B, the time required for automatic counting is almost unchanged, ranging between 3.9–5.3 s. For manual counting, the consumed time is roughly negatively proportional to the number of live cells. As a result, there is a decrease in the time consumption over time. To be more exact, the time of manual counting takes 92 s at the beginning and 49 s in the last observation, which is orders of magnitude slower than the proposed system. This clearly shows the advantage of our proposed method in saving time during the counting of myocardial cells. On larger scales (i.e., selecting images of different stages), our proposed method would perform even better at a wide range when compared to the manual approach. Hence, our proposed approach eliminates various challenges faced with manual counting and relieves medical staff of the huge stress experienced during manual counting, which is more prone to experimental errors.

5. Conclusions and Discussion

This paper presents the design and implementation of an automatic counting system for adult cardiomyocytes. The key idea is to extend the hesitant fuzzy set theory and customize it in the context of a biomedical environment. Hesitant fuzzy sets have obvious advantages for fuzzy image classification. This system solved the movement noise influence of the traditional algorithm and the amorphous particle image automatic clustering to ensure medical subjects quickly understand the entire process of the myocardial cell culture. The system is extensively evaluated with adult cardiomyocytes and compared with the state-of-the-practice approaches. Experimental results show that the proposed system incurs low error rates (as low as 1.85%) and outperforms the manual counting approach in terms of both accuracy (98.7% vs. 75%) and performance (3.9 s vs. 92 s). In the future, we plan to carry out extreme-scale experiments to verify the applicability and effectiveness of the proposed system. We also plan to extend the platform to new applications in addition to cardiomyocyte analysis.

Author Contributions

Conceptualization, J.W.; methodology, J.W. and O.T.T.; project administration, L.J. and D.Z.; software writing—original draft preparation, J.W.; writing—review and editing, J.W., D.Z., and O.T.T.; validation, J.W., L.J., and D.Z.

Funding

This work is in part supported by a NSFC award under contract #61775139.

Acknowledgments

Dongfang Zhao is in part supported by a Google Research Award. The authors would like to thank Yi Zhao (Department of Biomedical Engineering, The Ohio State University) for his insightful feedback and discussion.

Conflicts of Interest

The authors declare no conflict of interest.

References

  1. Kasbe, T.; Pippal, R.S. Design of heart disease diagnosis system using fuzzy logic. In Proceedings of the 2017 International Conference on Energy, Communication, Data Analytics and Soft Computing (ICECDS), Chennai, India, 1–2 August 2017; pp. 3183–3187. [Google Scholar]
  2. Masaki, I.; Ji-Dong, F.; Paul, D.O.; Vasanth, V.; Yohei, H.; Bruneau, B.G.; Deepak, S. Direct reprogramming of fibroblasts into functional cardiomyocytes by defined factors. Nihon Rinsho Jpn. J. Clin. Med. 2011, 142, 375–386. [Google Scholar] [CrossRef]
  3. Senyo, S.E.; Steinhauser, M.L.; Pizzimenti, C.L.; Yang, V.K.; Lei, C.; Mei, W.; Ting-Di, W.; Jean-Luc, G.K.; Lechene, C.P.; Lee, R.T. Mammalian heart renewal by pre-existing cardiomyocytes. Nature 2013, 493, 433–436. [Google Scholar] [CrossRef] [PubMed]
  4. Ping, L.; Feng, L.; Lee, A.S.; Tingyu, G.; Veronica, S.F.; Yongming, W.; Sebastian, D.; Karim, S.; Knowles, J.W.; Wang, P.J. Drug screening using a library of human induced pluripotent stem cell-derived cardiomyocytes reveals disease-specific patterns of cardiotoxicity. Circulation 2013, 127, 1677. [Google Scholar] [CrossRef]
  5. Li, Q.; Yu, H.; Ian, S.C.; Amy, F.; Vasanth, V.; Lei, L.; Conway, S.J.; Ji-Dong, F.; Deepak, S. In vivo reprogramming of murine cardiac fibroblasts into induced cardiomyocytes. Nature 2012, 485, 593–598. [Google Scholar] [CrossRef]
  6. Benderskaya, E.N. Cluster analysis problems and bio-inspired clustering methods. In Proceedings of the 2017 IEEE International Conference on Soft Computing and Measurements, St. Petersburg, Russia, 24–26 May 2017. [Google Scholar] [CrossRef]
  7. Tas, M.; De Haan-Meulman, M.; Kabel, P.J.; Drexhage, H.A. Defects in monocyte polarization and dendritic cell clustering in patients with Graves’ disease. A putative role for a non-specific immunoregulatory factor related to retroviral p15E. Clin. Endocrinol. 2010, 34, 441–448. [Google Scholar] [CrossRef]
  8. Takaaki, M.; Siripong, T.; Tomoko, M.; Hisaya, K.; Takuji, N.; Yoshio, H.; Yoshikazu, H.; Hitoshi, O.; Yasumasa, B. Canopy1, a positive feedback regulator of FGF signaling, controls progenitor cell clustering during Kupffer’s vesicle organogenesis. Proc. Natl. Acad. Sci. USA 2011, 108, 9881–9886. [Google Scholar]
  9. Nosaka, R.; Fukui, K. HEp-2 cell classification using rotation invariant co-occurrence among local binary patterns. Pattern Recognit. 2014, 47, 2428–2436. [Google Scholar] [CrossRef]
  10. Chen, C.L.; Mahjoubfar, A.; Tai, L.C.; Blaby, I.K.; Huang, A.; Niazi, K.R.; Jalali, B. Deep Learning in Label-free Cell Classification. Sci. Rep. 2016, 6, 21471. [Google Scholar] [CrossRef]
  11. Frankel, D.S.; Frankel, S.L.; Binder, B.J.; Vogt, R.F. Application of neural networks to flow cytometry data analysis and real-time cell classification. Cytometry 2015, 23, 290–302. [Google Scholar] [CrossRef]
  12. Wu, S. Survey on K-means Algorithm. New Technol. Libr. Inf. Serv. 2011, 29, 433–439. [Google Scholar]
  13. Pérez-Suárez, A.; Martńez-Trinidad, J.F.; Carrasco-Ochoa, J.A.; Medina-Pagola, J.E. A New Overlapping Clustering Algorithm Based on Graph Theory. In Proceedings of the Mexican International Conference on Artificial Intelligence, San Luis Potosí, Mexico, 27 October–4 November 2012. [Google Scholar]
  14. He, Y.; Tan, H.; Luo, W.; Mao, H.; Ma, D.; Feng, S.; Fan, J. MR-DBSCAN: An Efficient Parallel Density-Based Clustering Algorithm Using MapReduce. In Proceedings of the IEEE International Conference on Parallel & Distributed Systems, Tainan, Taiwan, 7–9 December 2011. [Google Scholar]
  15. Tsai, W.K.; Sheu, M.H. An Efficient Foreground Object Detection Method Using a Color Cluster-Based Background Modeling Algorithm. In Proceedings of the International Symposium on Computer, Xi’an, China, 4–6 July 2016. [Google Scholar]
  16. Buck, R. Cluster-Based Salient Object Detection Using K-Means Merging and Keypoint Separation with Rectangular Centers. Master’s Thesis, Utah State University, Logan, UT, USA, 2016. [Google Scholar]
  17. Chen, T.; Lu, S.; Fan, J. S-CNN: Subcategory-aware convolutional networks for object detection. IEEE Trans. Pattern Anal. Mach. Intell. 2017, 40, 2522–2528. [Google Scholar] [CrossRef] [PubMed]
  18. Fang, G.; Huang, Z.; Wang, S.; Ji, X. A Scalable Object Detection Framework Based on Embedded Manycore Cluster. In Proceedings of the International Conference on Cyber-enabled Distributed Computing & Knowledge Discovery, Chengdu, China, 13–15 October 2016. [Google Scholar]
  19. Torra, V.; Narukawa, Y. On Hesitant Fuzzy Sets and Decision. In Proceedings of the IEEE International Conference on Fuzzy Systems, Jeju Island, South Korea, 20–24 August 2009. [Google Scholar]
  20. Du, X. Correlation coefficient of hesitant fuzzy sets. In Proceedings of the 2017 32nd Youth Academic Annual Conference of Chinese Association of Automation (YAC), Hefei, China, 19–21 May 2017. [Google Scholar]
  21. Torra, V. Hesitant fuzzy sets. Int. J. Intell. Syst. 2010, 25, 529–539. [Google Scholar] [CrossRef]
  22. Atanassov, K.T. Intuitionistic fuzzy sets. Fuzzy Sets Syst. 1986, 20, 87–96. [Google Scholar] [CrossRef]
  23. Dubois, D. Fuzzy Sets and Systems: Theory and Applications; Academic Press, Inc.: Orlando, FL, USA, 1980. [Google Scholar]
  24. Yager, R.R. On the theory of bags. Int. J. Gen. Syst. 1986, 13, 23–37. [Google Scholar] [CrossRef]
  25. Ye, Y.; Zhang, Z.; Yang, X.; Yeo, J.H.; Jiang, L.J.; Jiang, D. Blood cell counting and classification by nonflowing laser light scattering method. J. Biomed. Opt. 2004, 3897, 995–1001. [Google Scholar]
  26. Serafini, R.; Longobardi, V.; Spadetta, M.; Neri, D.; Ariota, B.; Gasparrini, B.; Di, P.R. Trypan blue/giemsa staining to assess sperm membrane integrity in salernitano stallions and its relationship to pregnancy rates. Reprod. Domest. Anim. 2014, 49, 41–47. [Google Scholar] [CrossRef]
  27. Liu, T.X.; Chu, C.C. Comparison of absolute estimates of Thrips tabaci (Thysanoptera: Thripidae) with field visual counting and sticky traps in onion field in south Texas. Southwest. Entomol. 2004, 29, 83–89. [Google Scholar]
  28. Liu, X.; Iyengar, S.G.; Rittscher, J. Monitoring cardiomyocyte motionin real time through image registration and time series analysis. In Proceedings of the IEEE International Symposium on Biomedical Imaging, Barcelona, Spain, 2–5 May 2012. [Google Scholar]
  29. Hu, N.; Fang, J.; Li, H.; Su, K.; Wang, P. Dual-function microelectrode array system for simultaneously monitoring electromechanical integration status of cardiomyocytes. In Proceedings of the Transducers-International Conference on Solid-state Sensors, Anchorage, AK, USA, 21–25 June 2015. [Google Scholar]
  30. Piccinini, F.; Tesei, A.; Paganelli, G.; Zoli, W.; Bevilacqua, A. Improving reliability of live/dead cell counting through automated image mosaicing. Comput. Methods Progr. Biomed. 2014, 117, 448–463. [Google Scholar] [CrossRef]
  31. Cibej, U.; Lojk, J.; Pavlin, M.; Sajn, L. Automatic adaptation of filter sequences for cell counting. In Proceedings of the International Convention on Information & Communication Technology, Electronics & Microelectronics, Opatija, Croatia, 25–29 May 2015. [Google Scholar]
  32. Maji, P.; Mandal, A.; Ganguly, M.; Saha, S. An automated method for counting and characterizing red blood cells using mathematical morphology. In Proceedings of the 2015 Eighth International Conference on Advances in Pattern Recognition (ICAPR), Kolkata, India, 4–7 January 2015; pp. 1–6. [Google Scholar]
  33. Sarrafzadeh, O.; Dehnavi, A.M.; Rabbani, H.; Ghane, N.; Talebi, A. Circlet based framework for red blood cells segmentation and counting. In Proceedings of the 2015 IEEE Workshop on Signal Processing Systems (SiPS), Hangzhou, China, 14–16 October 2015. [Google Scholar]
  34. Loddo, A.; Putzu, L.; Ruberto, C.D.; Fenu, G. A Computer-Aided System for Differential Count from Peripheral Blood Cell Images. In Proceedings of the International Conference on Signal-image Technology & Internet-based Systems, Naples, Italy, 28 November–1 December 2016. [Google Scholar]
  35. Ji, G.; Zheng, G.; Jun, C.; Jun, L.; John, N.; Zongyi, Y.; Chen, W.; Yu, S. A system for counting fetal and maternal red blood cells. IEEE Trans. Biomed. Eng. 2014, 61, 2823–2829. [Google Scholar] [CrossRef]
  36. Lou, J.; Mei, Z.; Li, Q.; Chen, Y.; Liu, H.; Lou, J.; Mei, Z.; Li, Q.; Chen, Y.; Liu, H. An automatic red blood cell counting method based on spectral images. In Proceedings of the International Congress on Image & Signal Processing, Datong, China, 15–17 October 2016. [Google Scholar]
  37. Yellin, F.; Haeffele, B.D.; Vidal, R. Blood cell detection and counting in holographic lens-free imaging by convolutional sparse dictionary learning and coding. In Proceedings of the IEEE International Symposium on Biomedical Imaging, Melbourne, Australia, 18–21 April 2017. [Google Scholar]
  38. Huang, X.; Jiang, Y.; Liu, X.; Xu, H.; Han, Z.; Rong, H.; Yang, H.; Yan, M.; Yu, H. Machine Learning Based Single-Frame Super-Resolution Processing for Lensless Blood Cell Counting. Sensors 2016, 16, 1836. [Google Scholar] [CrossRef]
  39. Ghosh, P.; Bhattacharjee, D.; Nasipuri, M. Blood smear analyzer for white blood cell counting: A hybrid microscopic image analyzing technique. Appl. Soft Comput. 2016, 46, 629–638. [Google Scholar] [CrossRef]
  40. Relli, C.D.S.; Facon, J.; Ayala, H.L.; Britto, A.D.S. Automatic counting of trypanosomatid amastigotes in infected human cells. Comput. Biol. Med. 2017, 89, 222–235. [Google Scholar] [CrossRef]
  41. Melo, G.J.A.D.; Gomes, V.; Baccili, C.C.; Almeida, L.A.L.D.; Lima, A.C.D.C. A robust segmentation method for counting bovine milk somatic cells in microscope slide images. Comput. Electron. Agric. 2015, 115, 142–149. [Google Scholar] [CrossRef]
  42. Fuyong, X.; Hai, S.; Janna, N.; Lin, Y. Automatic Ki-67 counting using robust cell detection and online dictionary learning. IEEE Trans. Biomed. Eng. 2014, 61, 859. [Google Scholar] [CrossRef]
  43. Ding, L.; Goshtasby, A. On the Canny edge detector. Pattern Recognit. 2001, 34, 721–725. [Google Scholar] [CrossRef]
  44. Na, C.; Xu, Z.; Xia, M. Correlation coefficients of hesitant fuzzy sets and their applications to clustering analysis. Appl. Math. Model. 2013, 37, 2197–2211. [Google Scholar]
  45. Xu, Z.; Jian, C.; Wu, J. Clustering algorithm for intuitionistic fuzzy sets. Inf. Sci. 2008, 178, 3775–3790. [Google Scholar] [CrossRef]
  46. Hassen, R.; Zhou, W.; Salama, M. No-reference image sharpness assessment based on local phase coherence measurement. In Proceedings of the IEEE International Conference on Acoustics Speech & Signal Processing, Dallas, TX, USA, 14–19 March 2010. [Google Scholar]
  47. Guo, J.; Hong, H.; Wang, L.; Peng, Q.; Li, X. Design of Focusing Window Based on Energy Function of Gradient. Infrared Technol. 2016, 38, 197–202. [Google Scholar]
Figure 1. Workflow of automatic cardiomyocyte clustering and counting.
Applsci 09 02875 g001
Figure 2. Different categories from the collected cardiomyocytes: (A) Normal Cardiomyocytes; (B) The cardiomyocytes contain small bubbles; (C) Contractures of cardiomyocytes at both ends; (D) Dead cardiomyocytes.
Applsci 09 02875 g002
Figure 3. Example of various key phases in categorizing and counting cardiomyocytes: (A) Raw data; (B) histograms; (C) binarization; (D) edging; (E) qualification; (F) counting.
Applsci 09 02875 g003
Figure 4. Counting of cardiomyocyte during a 48 h period.
Applsci 09 02875 g004
Figure 5. Comparison with the conventional approach: (A) Accuracy of the manual method and the proposed system, (B) performance of the manual method and the proposed system.
Applsci 09 02875 g005
Table 1. Parameter space.
TypeParametersScores
l:d(0,1]:10
l:d(1,2]:1(0.3,0.6]
l:d(2,4]:1(0.6,0.8]
l:d(4,6]:1(0.8,1]
E e s [0,10][0,0.2]
E e s (10,20](0.2,0.5]
E e s (20,30](0.5,0.6]
E e s (30,40](0.6,0.7]
E e s (40,50](0.7,0.8]
E e s (50,60](0.8,0.9]
E e s (60,70](0.9,1]
d C O N [1,1.25]:1[0,0.2]
d C O N (1.25,1.8]:1(0.2,0.4]
d C O N (1.8,2]:1(0.4,0.6]
d C O N (2,3]:1(0.6,0.9]
d C O N (3,5]:1(0.9,1]
Table 2. Categorization confidence.
Parameter TypesX1X2X3
A1{0.7,0.8,0.9}{0.7,0.8}{0.7,0.8,0.9}
A2{0.6,0.7}{0.6,0.7}{0.5,0.6}
A3{0.2,0.3}{0.2,0.3}{0.2,0.4}
A4{0.3,0.4}{0.2,0.3}{0.2,0.5}
A5{0.2,0.3}{0.3,0.4}{0.2}
A6{0.5}{0.4,0.6}{0.4}
A7{0.6,0.8}{0.7,0.8}{0.7,0.8,0.9}
A8{0.6,0.7}{0.4,0.5}{0.6}
A9{0.5,0.7}{0.5,0.6}{0.4,0.5}
A10{0.7,0.8}{0.6,0.7}{0.5,0.6}

