Control Strategy Based on the Flexible Multi-State Switch for Maximum Consumption of Distributed Generations in Distribution Network


Abstract
:1. Introduction
2. Analysis of the Principle of FMSS Promoting the Consumption of DG
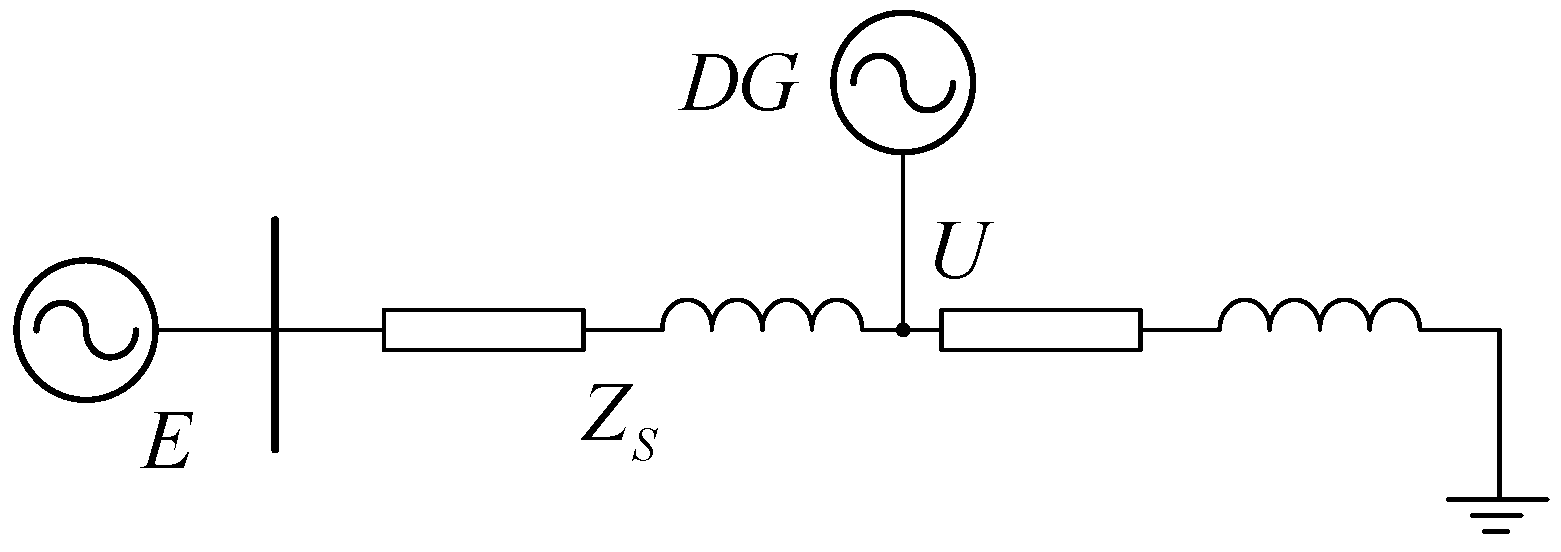
2.1. Analysis of the Capacity of Traditional Distribution Network to Consume DG
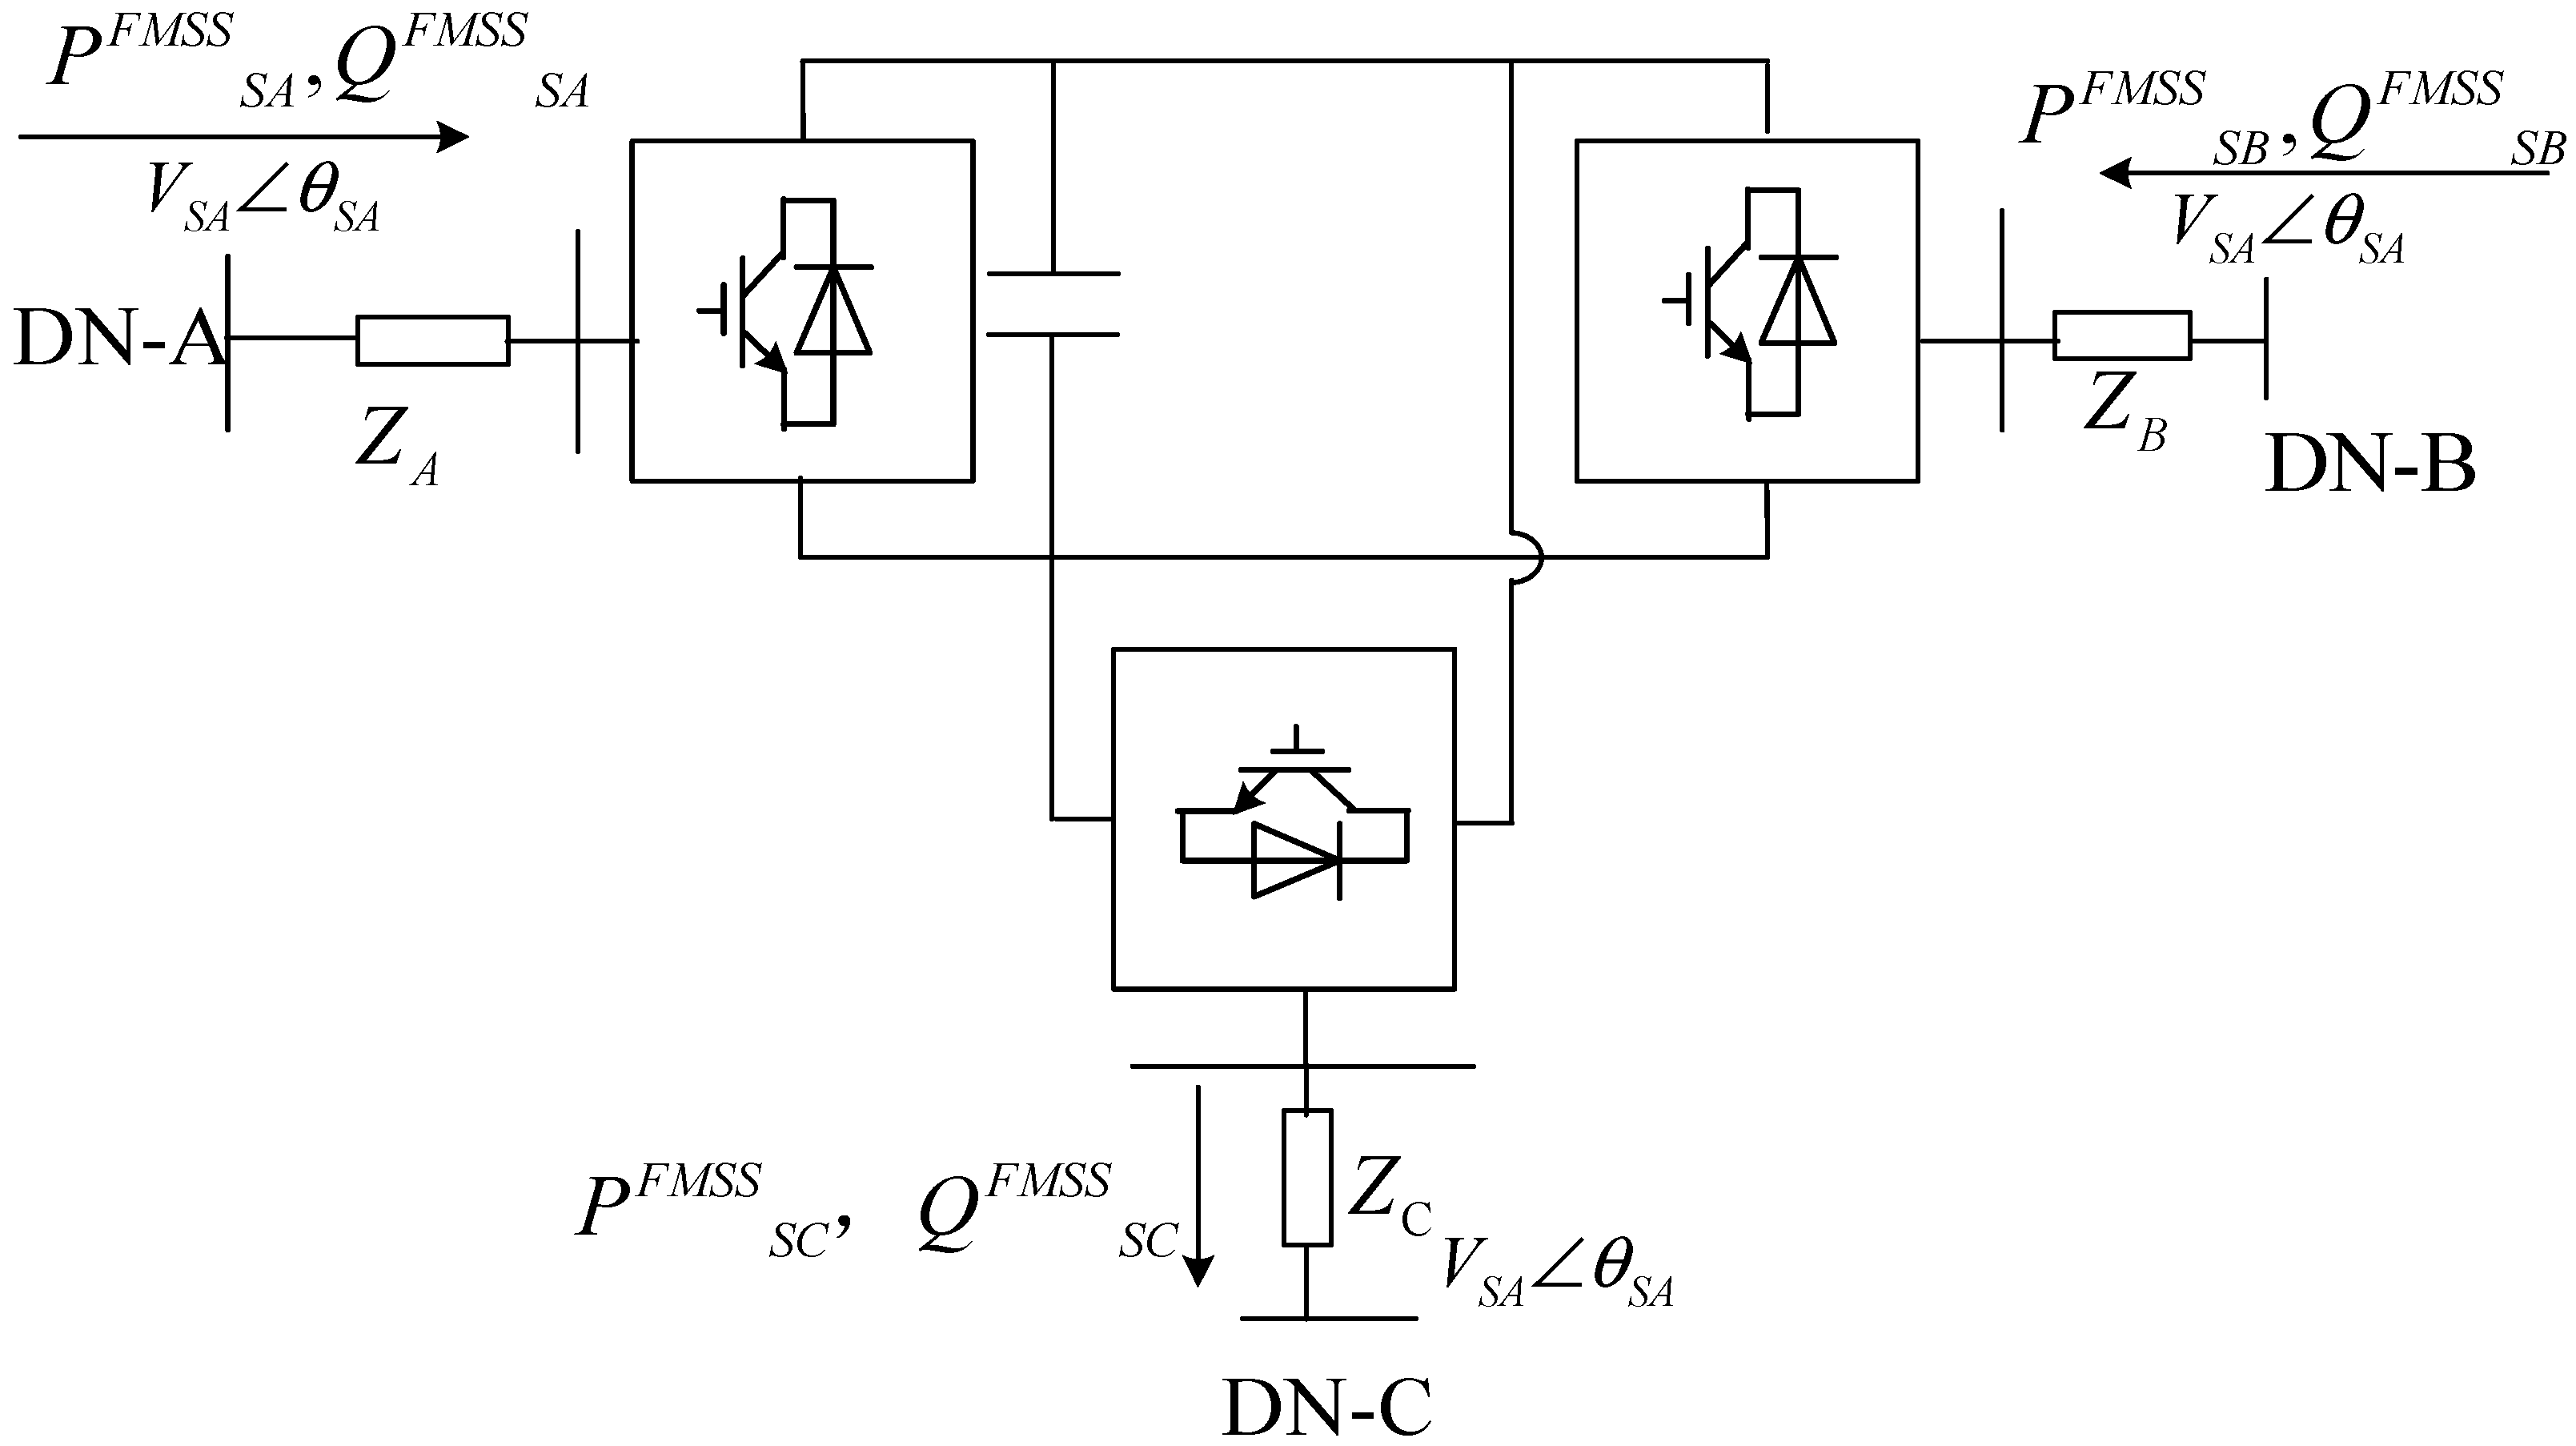
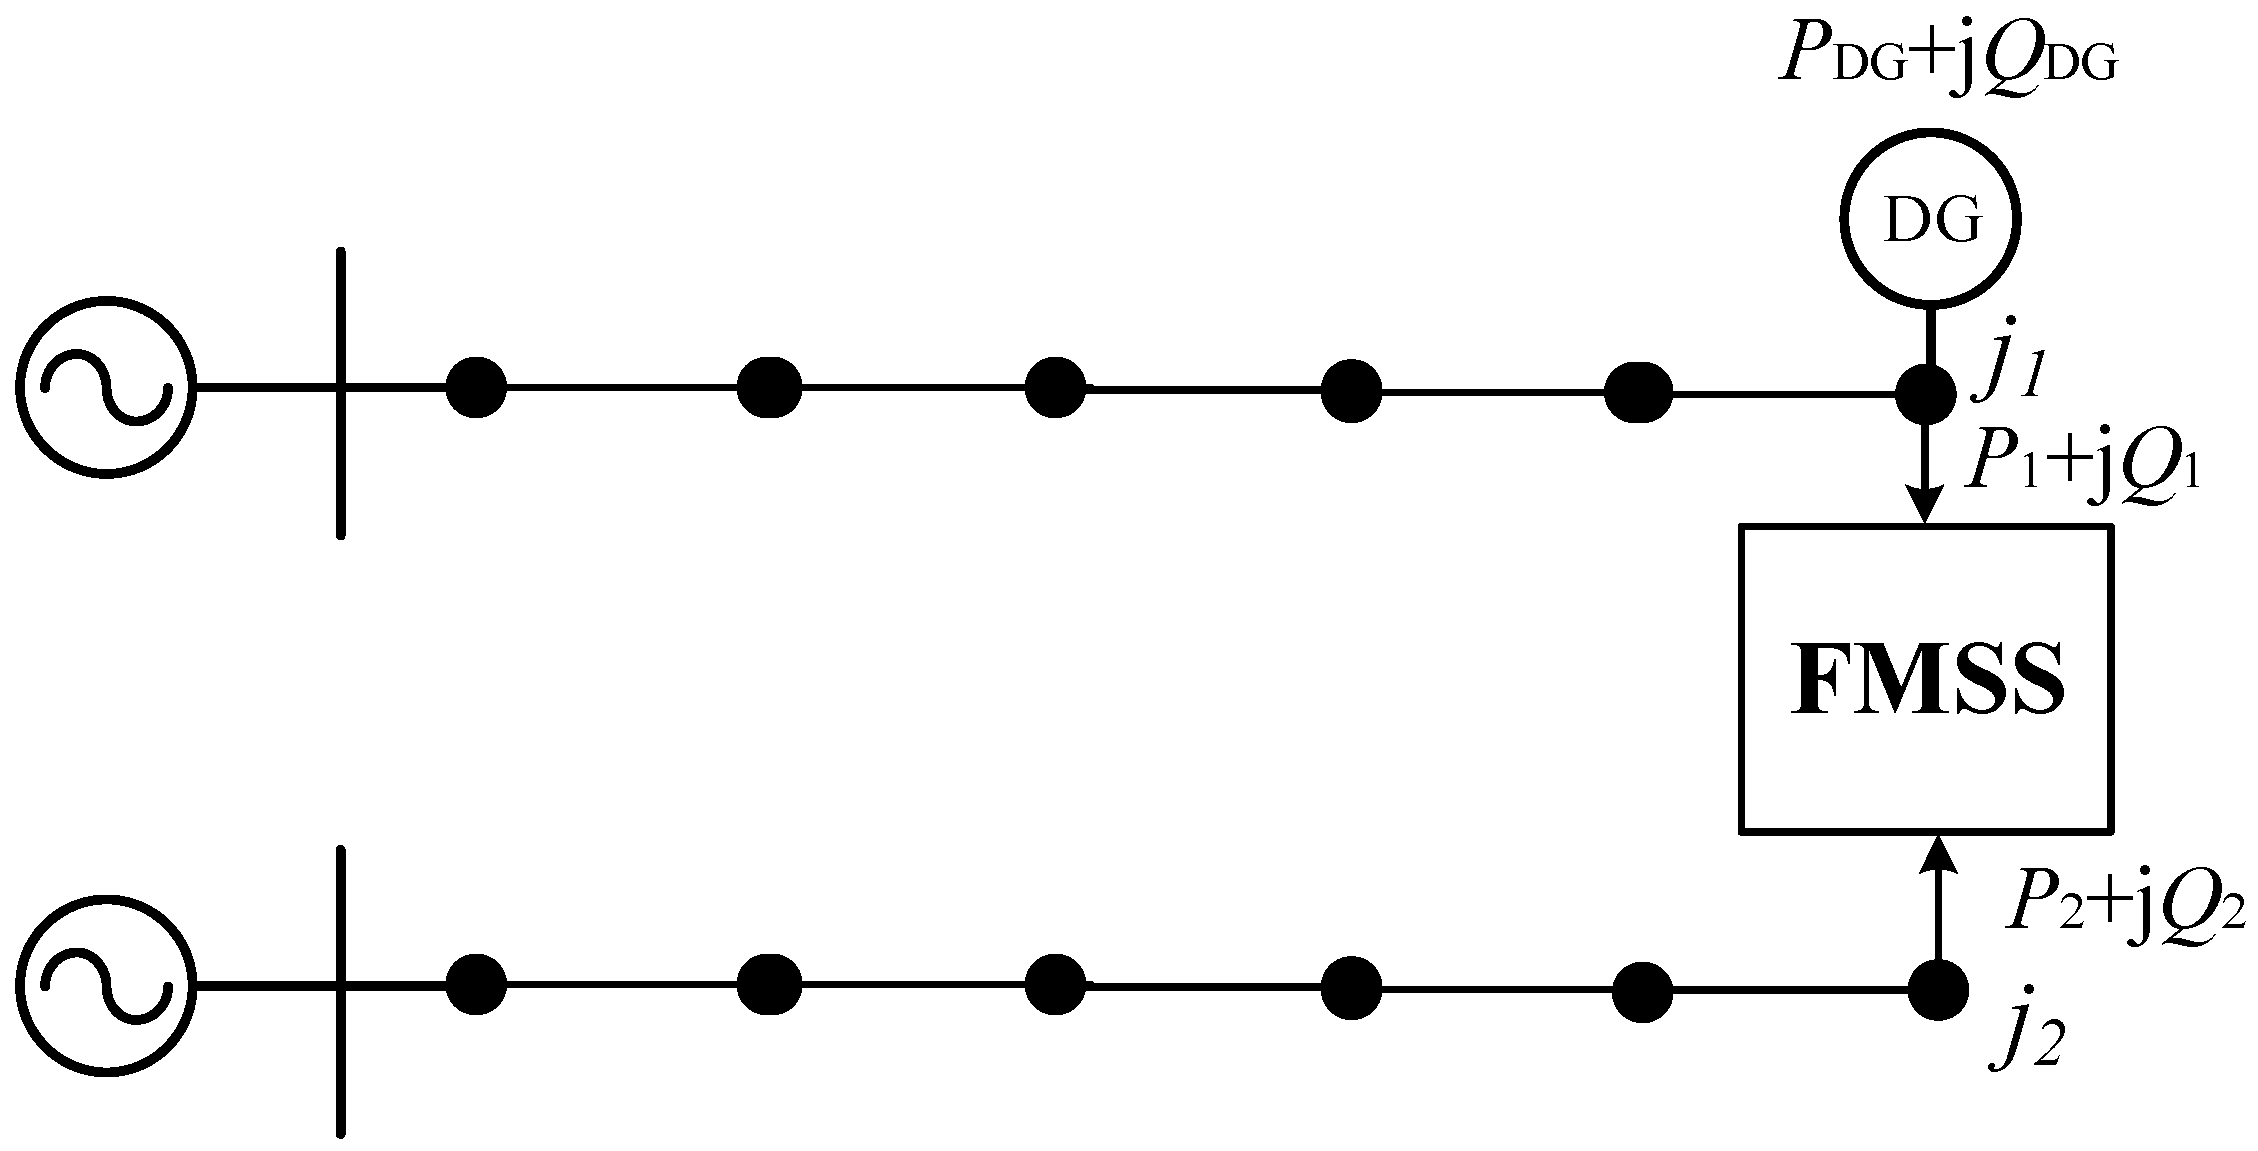
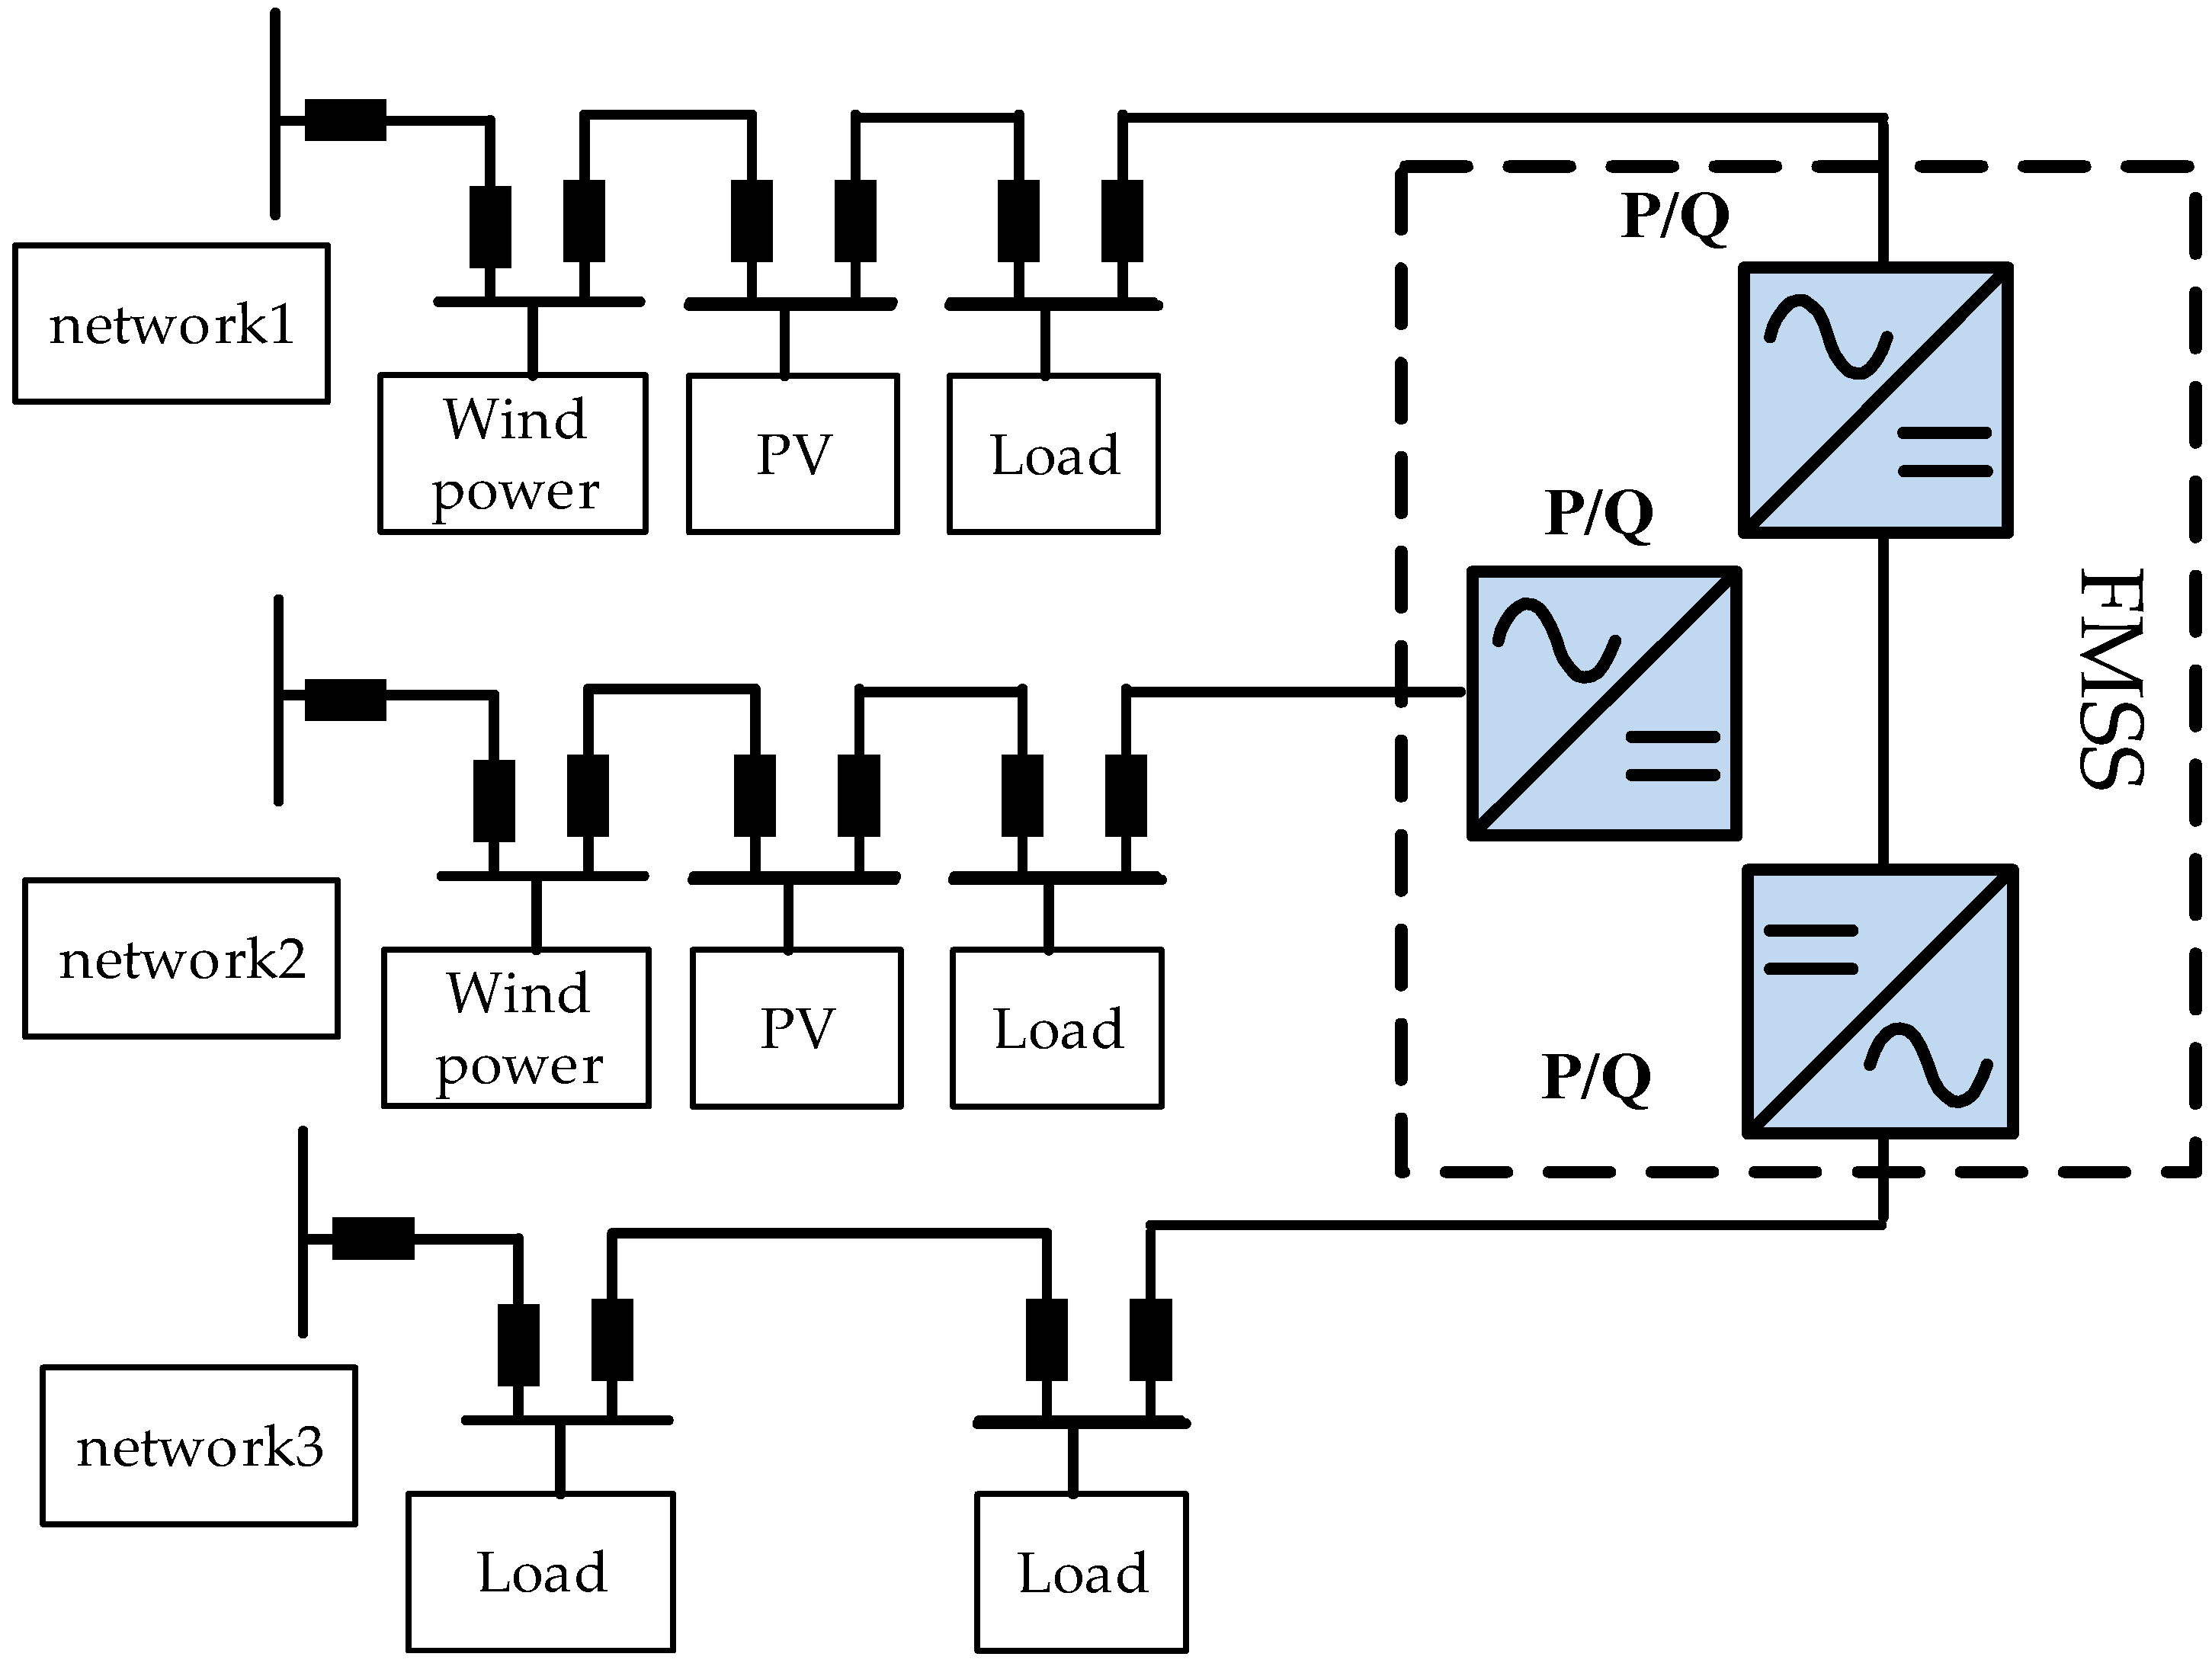
2.2. Analysis of Consumption Capacity of DG after FMSS Is Connected
3. The Control Strategy of FMSS for Maximum Consumption of DG
3.1. The Objective Function for Consumption of DG Is Established
3.1.1. DG Maximizes Consumption Indexes
3.1.2. Objective Function Weight Coefficient Selection Method
3.2. Constraints of Distribution Network Operation Including Flexible Multi-State Switch
3.2.1. Operating Constraints of Flexible Multistate Switches
3.2.2. System Operating Constraints
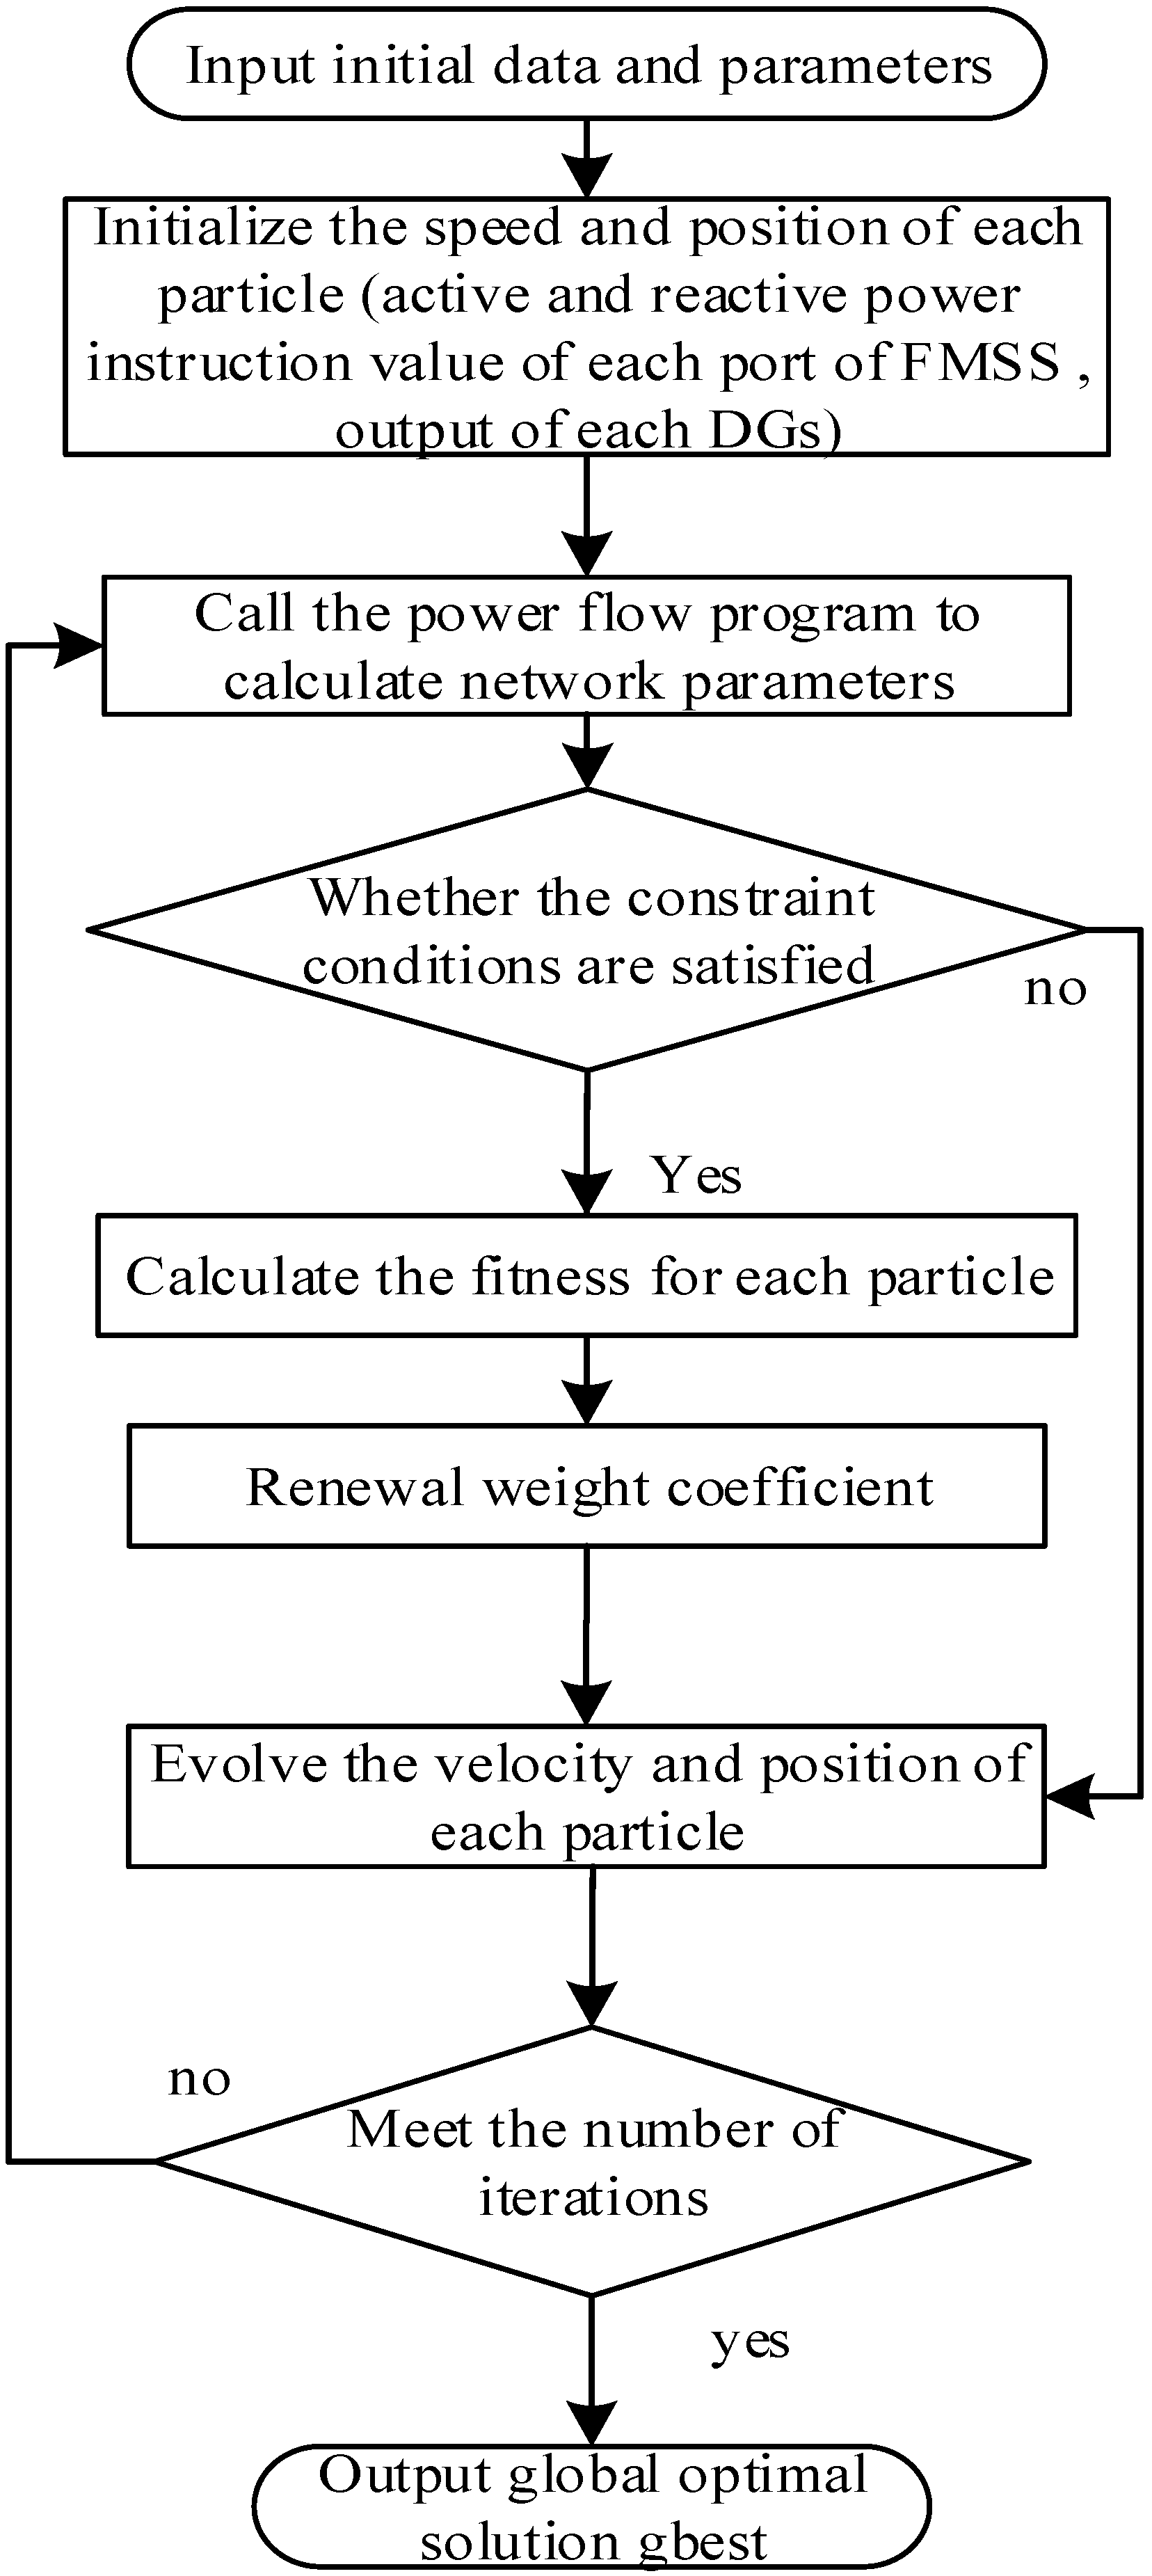
4. Optimal Algorithm for Maximum Consumption of DG
- (1)
- Using the weight coefficient ωj obtained by the analytic hierarchy process to construct a single objective function, the fitness function of PSO is used to conduct an iterative solution of PSO;
- (2)
- The optimal position reached by each particle (including the local optimal solution and the global optimal solution) is recorded, as are the four single objective function values which correspond to the optimal position of each particle as the basic data;
- (3)
- The use of basic data on the entropy weight of each objective function value calculation, and according to (13), the comprehensive consideration of the analytic hierarchy process and entropy weight method of each objective function weight coefficient λ1, λ2 through the integration of the two methods obtains the objective function index weight coefficient as λ1 = 0.734, λ2 = 0.266.
5. Example Simulation
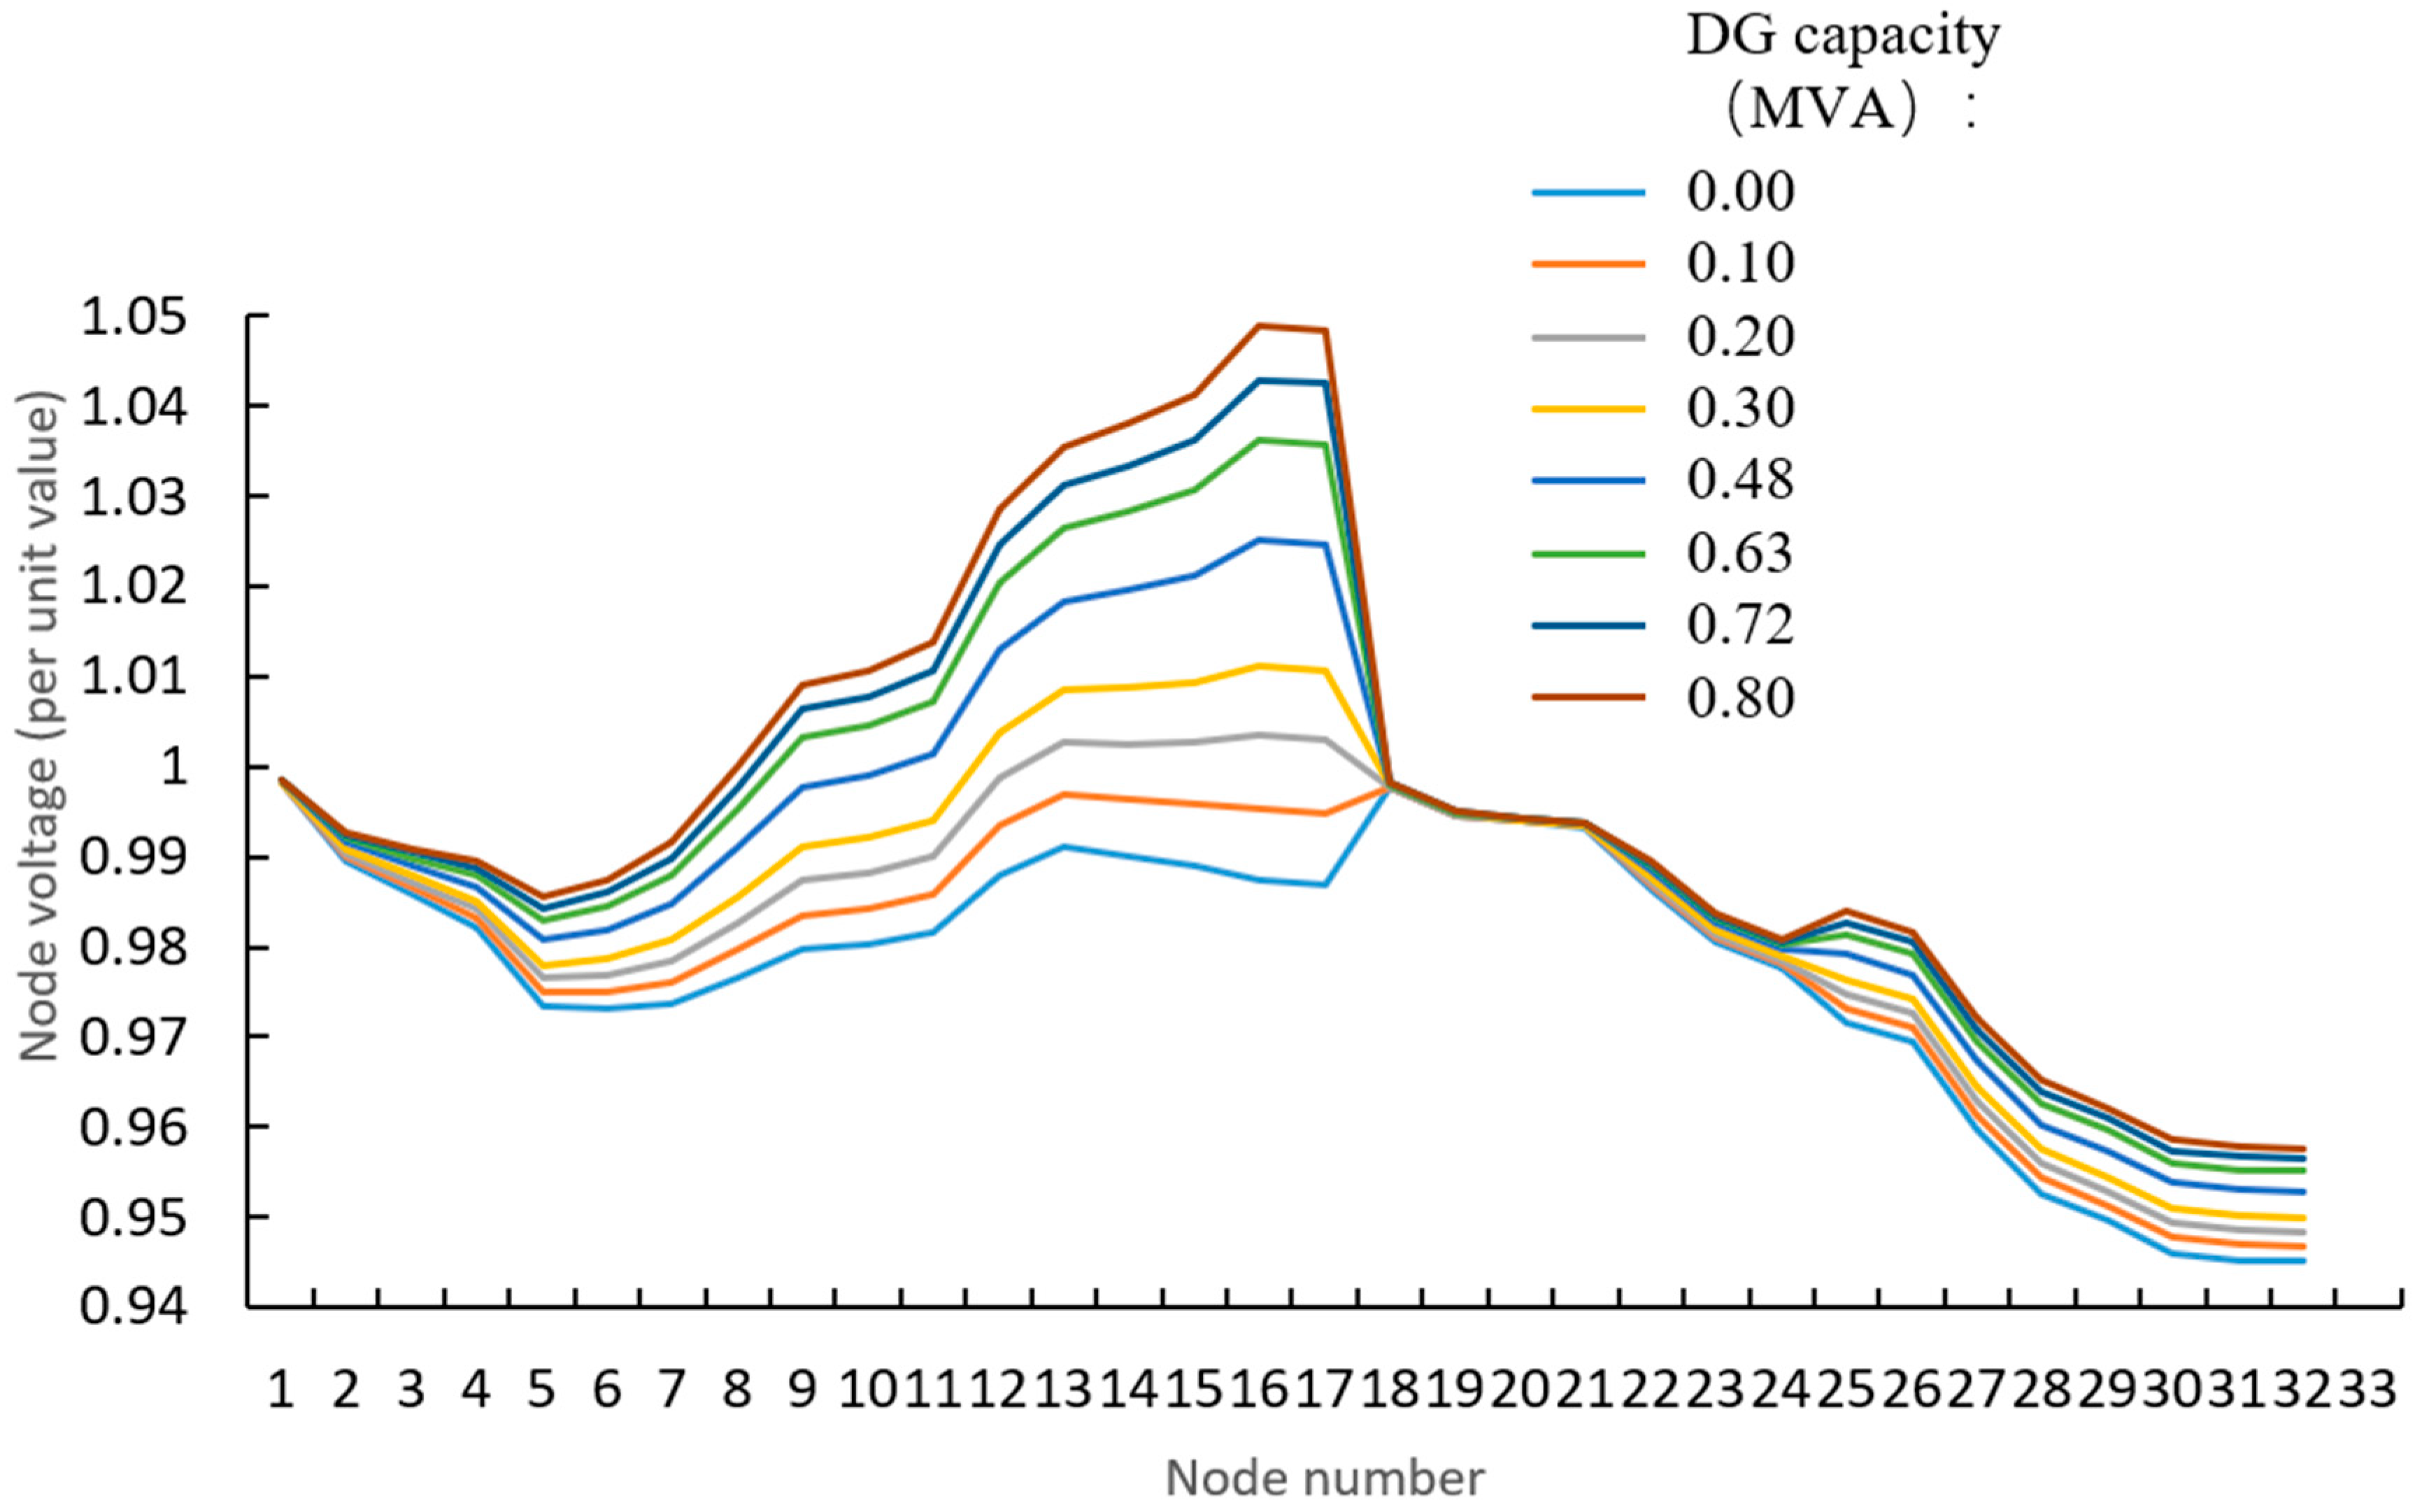
5.1. Simulation of Consumption Capacity of Traditional Distribution Network
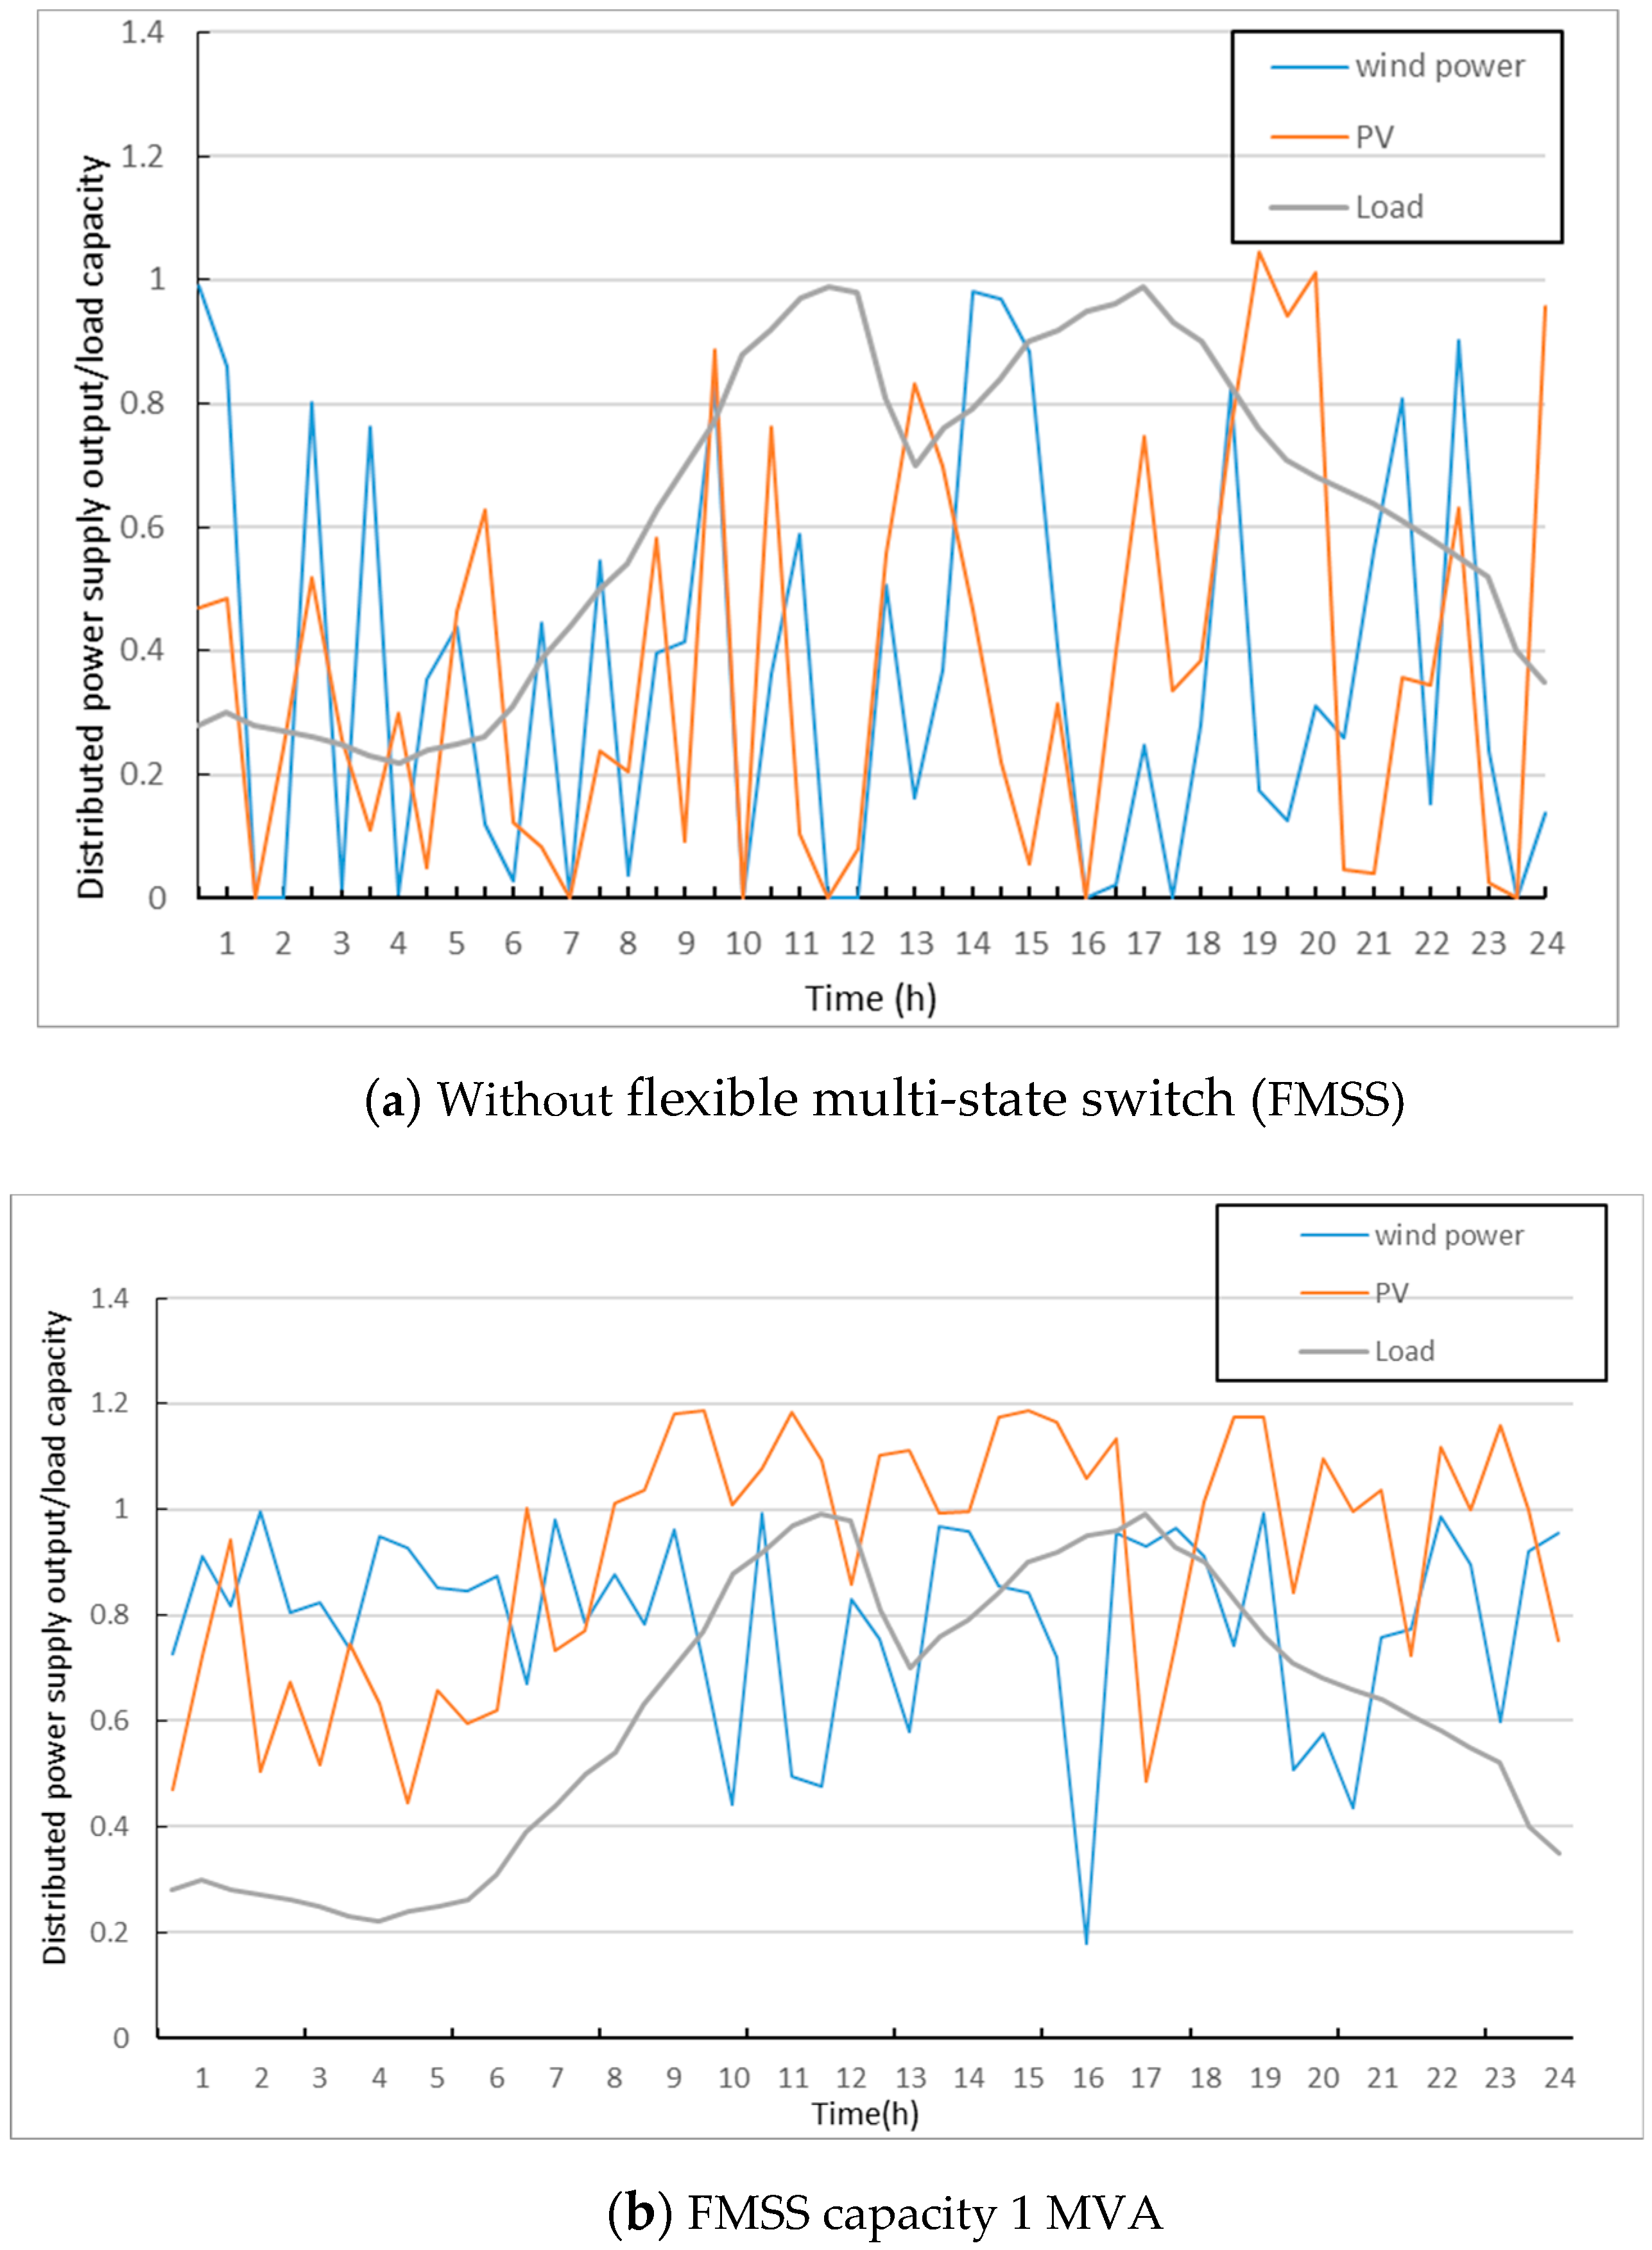
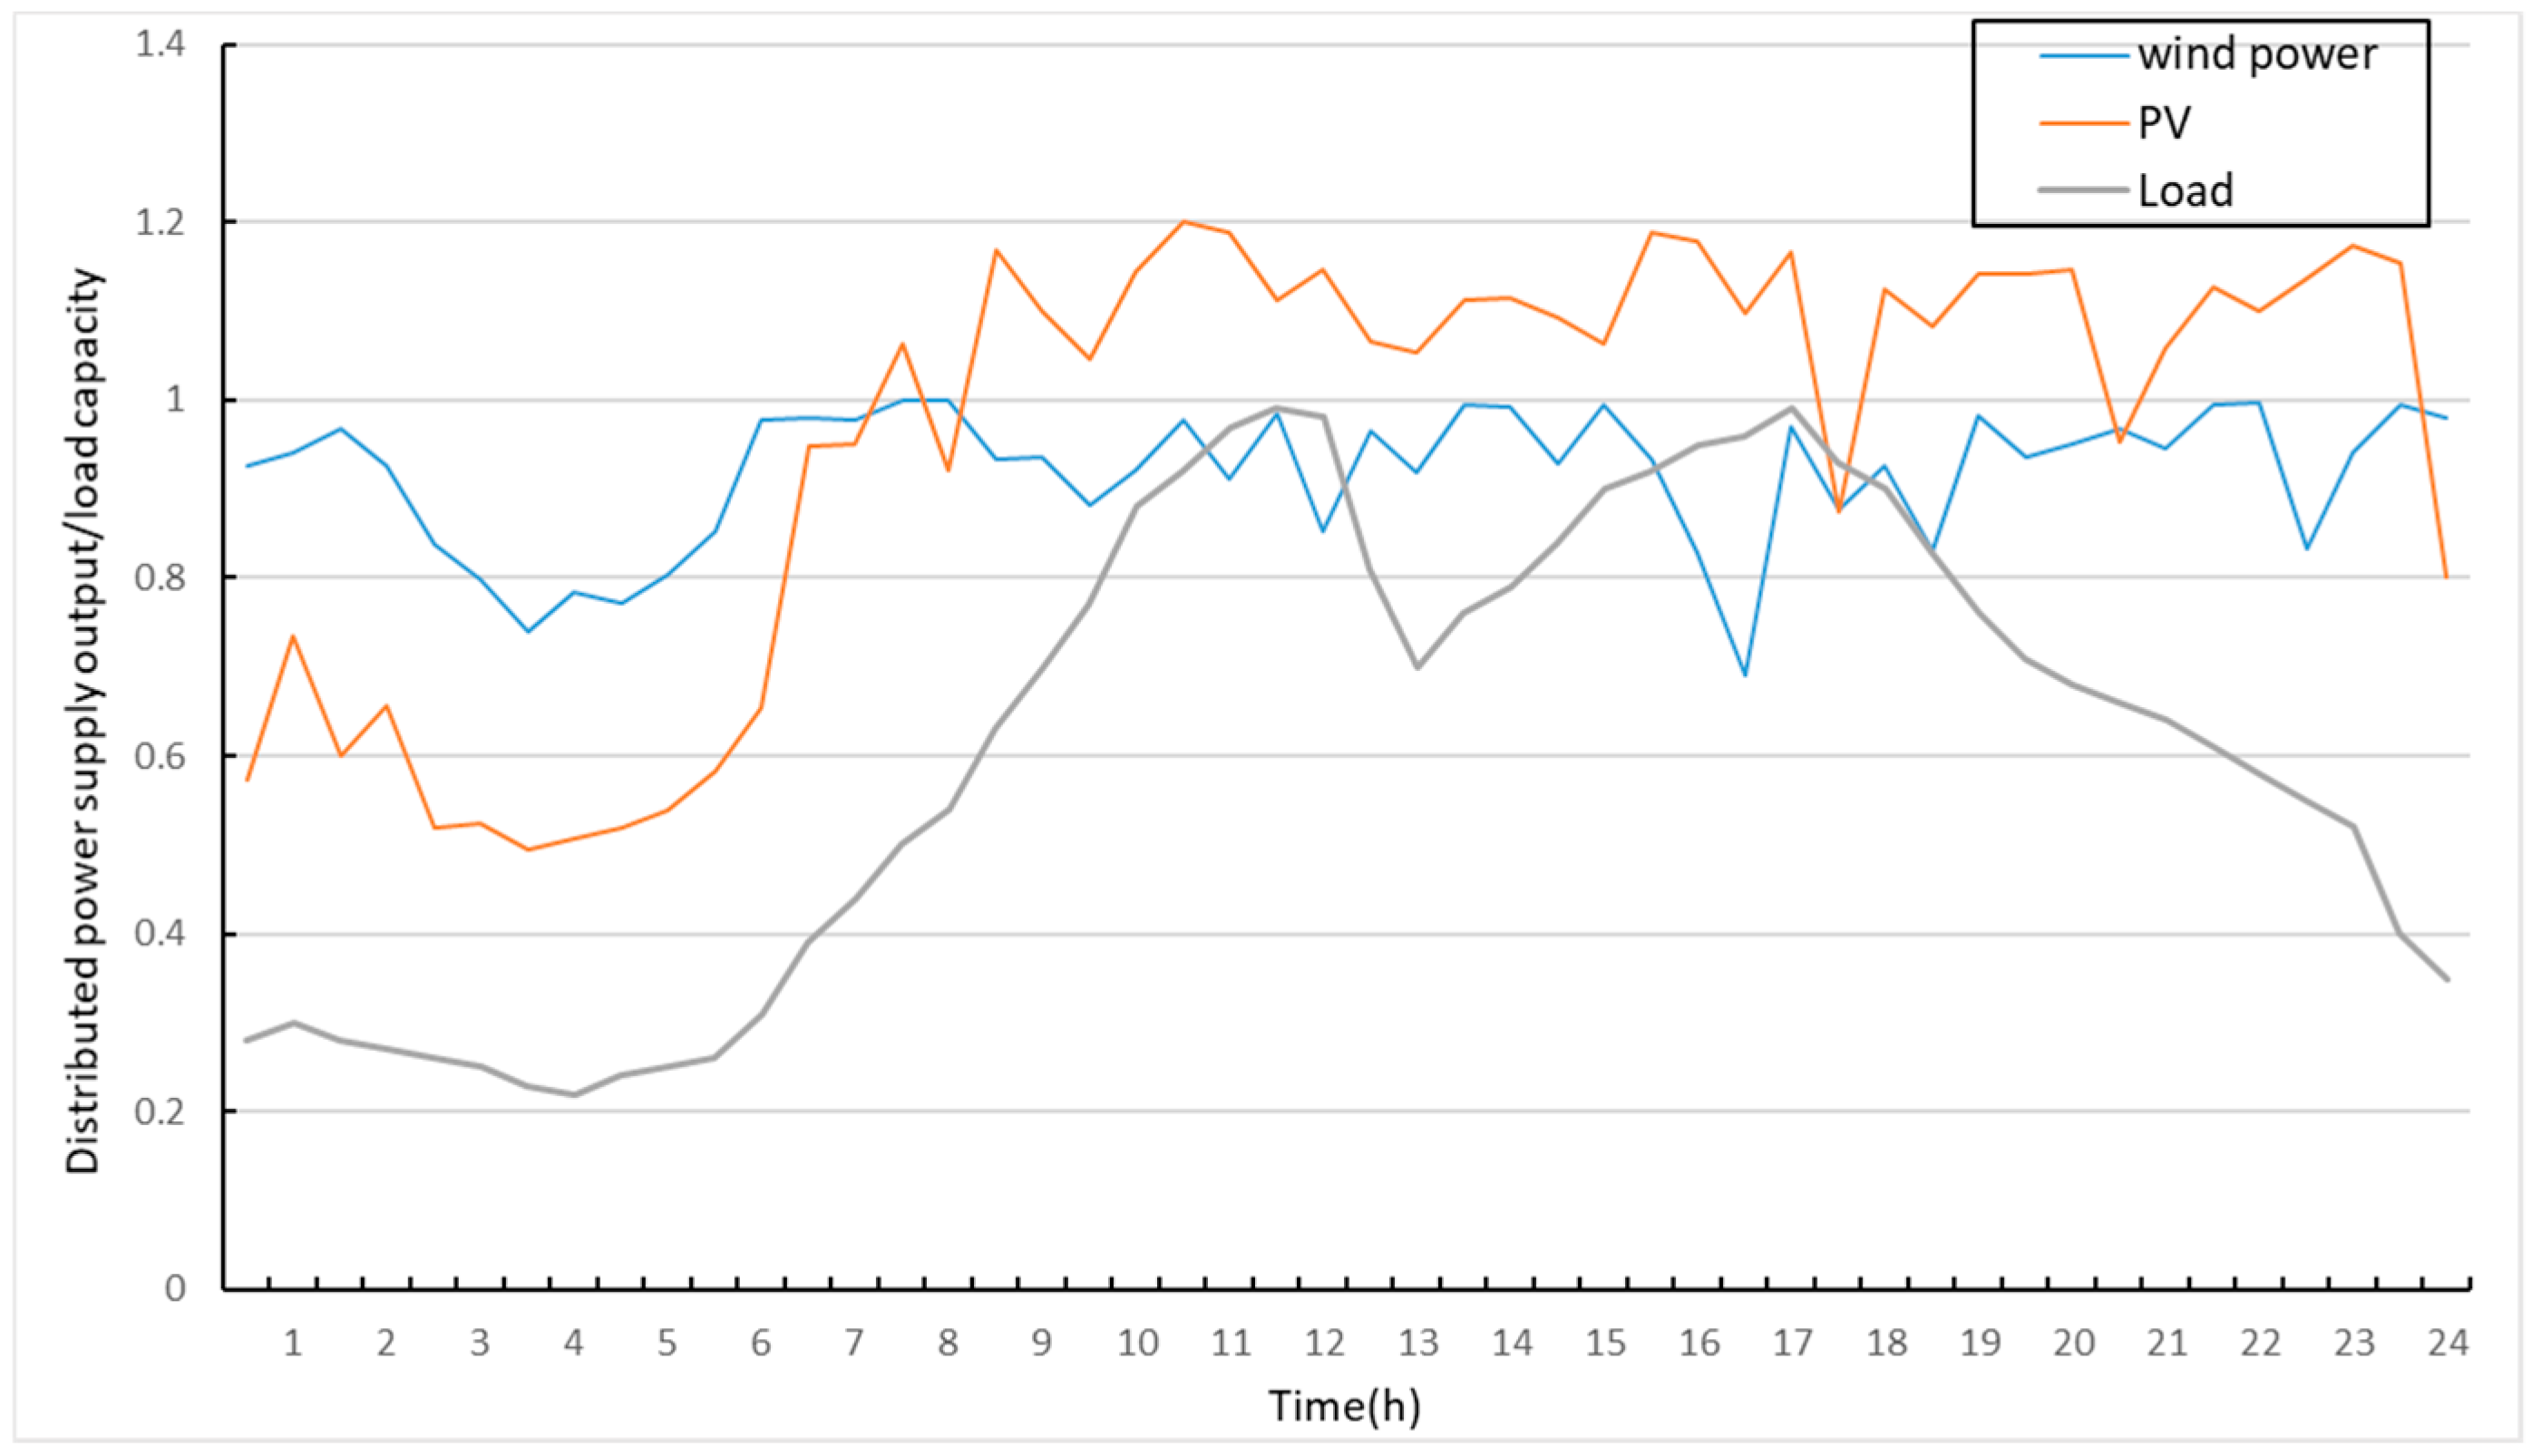
5.2. Simulation of Consumption Capacity of Distribution Network with FMSS
6. Results and Discussions
6.1. Verification of DG Absorption Strategy Based on FMSS
6.2. Verification of Voltage Fluctuation Suppression Effect of Distribution Network
6.3. Comparison with Traditional Reactive Power Compensation Device
7. Conclusions
- The main limiting factor of the consumption capacity of DG of the distribution network is the voltage deviation of network lines. FMSS can reduce the voltage deviation of the line by adjusting the active and reactive power flow distribution of the network, thus promoting the consumption ability of DG of the distribution network.
- By comparing with traditional reactive power compensation devices, such as SVC and STATCOM, it can be seen that FMSS can simultaneously affect active and reactive power flows and have a stronger ability to consume DG.
- In a certain range, appropriately increasing the rated capacity of FMSS can improve the consumption capacity of DG.
- In the more complex distribution system, a regulation strategy based on FMSS proposed in this paper, which is oriented to the maximum absorption of the distributed power supply, can dynamically adjust with the change of the system state and has good real-time regulation characteristics. This improves the economy and efficiency of the distribution system.
Author Contributions
Funding
Conflicts of Interest
References
- Mahmud, N.; Zahedi, A. Review of control strategies for voltage regulation of the smart distribution network with high penetration of renewable distributed generation. Renew. Sustain. Energy Rev. 2016, 64, 582–595. [Google Scholar] [CrossRef]
- Qu, H.; LI, X.; Yang, L.; Huang, Y.; Wang, M.; Huang, J. Multi-objective distribution network dynamic reconfiguration and DG control considering time variation of load and DG. High. Volt. Eng. 2019, 45, 873–881. [Google Scholar]
- Razavi, S.E.; Rahimi, E.; Javadi, M.S.; Nezhad, A.E.; Lotfi, M.; Shafie-khah, M.; Catalão, J.P. Impact of distributed generation on protection and voltage regulation of distribution systems: A review. Renew. Sustain. Energy Rev. 2019, 105, 157–167. [Google Scholar] [CrossRef]
- Badran, O.; Mekhilef, S.; Mokhlis, H.; Dahalan, W. Optimal reconfiguration of distribution system connected with distributed generations: A review of different methodologies. Renew. Sustain. Energy Rev. 2017, 73, 854–867. [Google Scholar] [CrossRef]
- Siyu, G.; Wei, W.; Yuanfu, X.U. Reconfiguration of distribution network for the maximum consumption of distributed generations. Proc. CSU-EPSA 2017, 29, 7–11. [Google Scholar]
- Napis, N.; Khatib, T.; Hassan, E.; Sulaima, M. An Improved Method for Reconfiguring and Optimizing Electrical Active Distribution Network Using Evolutionary Particle Swarm Optimization. Appl. Sci. 2018, 8, 804. [Google Scholar] [CrossRef]
- Ling, X.F. Optimizing scheduling of active distribution network with flexible DC devices. Electr. Power Constr. 2016, 37, 41–49. [Google Scholar]
- Xu, X.; Xu, Z.; Lyu, X.; Li, J. Optimal SVC placement for Maximizing Photovoltaic Hosting Capacity in Distribution Network. IFAC PapersOnLine 2018, 51, 356–361. [Google Scholar] [CrossRef]
- Ahmadnia, S.; Tafehi, E. Comparison of Optimum Wind–Solar DG, Statcom and Capacitor Placement and Sizing Based on Voltage Stability Margin Enhancement in Microgrid with Three Different Evolutionary Algorithms. Iran. J. Sci. Technol. Trans. Electr. Eng. 2017, 41, 241–253. [Google Scholar] [CrossRef]
- Dong, X.; Liu, Z.; Li, P.; Song, G.; Wu, Z.; Chen, L. Intelligent distribution network control technology based on multi-terminal flexible distribution switch. Proc. CSEE 2018, 38, 86–92. [Google Scholar]
- Bloemink, J.M.; Green, T.C. Increasing distributed generation penetration using soft normally-open points. In Proceedings of the IEEE PES General Meeting, Providence, RI, USA, 25–29 July 2010. [Google Scholar]
- Qi, Q.; Wu, J. Increasing distributed generation penetration using network reconfiguration and soft open points. Energy Procedia 2017, 105, 2169–2174. [Google Scholar] [CrossRef]
- Abdelrahman, M.A.; Long, C.; Wu, J.; Jenkins, N. Optimal operation of Multi-Terminal Soft Open Point to Increase hosting capacity of distributed generation in medium voltage networks. In Proceedings of the 2018 53rd International Universities Power Engineering Conference (UPEC), Glasgow, UK, 4–7 September 2018; pp. 1–6. [Google Scholar]
- Liang, H.S.; Li, S.W.; Bai, L.Q.; Liu, C.; Li, W.; Xu, J.; Wang, Q.B. Calculation of maximum access capacity of distributed power supply in flexible distribution network based on SNOP. Power Constr. 2008, 39, 69–76. [Google Scholar]
- Wang, C.; Sun, C.; Li, P.; Wu, J.; Xing, F.; Yu, Y. SNOP-based Operation Optimization and Analysis of Distribution Network. Autom. Electr. Power Syst. 2015, 39, 82–87. [Google Scholar]
- Wang Chengshan, S.O.N.G.; Guanyu, L. Ahybrid Optimization Method for Distribution Network Operation with SNOP and Tie Switch. Proc. CSEE 2016, 36, 2315–2321. [Google Scholar]
- Ji, H.; Wang, C.; Li, P.; Ding, F.; Wu, J. Robust Operation of Soft Open Points in Active Distribution Networks with High Penetration of Photovoltaic Integration. IEEE Trans. Sustain. Energy 2018, 10, 280–289. [Google Scholar] [CrossRef]
- Wang, Q.; Liao, J.; Su, Y.; Lei, C.; Wang, T.; Zhou, N. An optimal reactive power control method for distribution network with soft normally-open points and controlled air-conditioning loads. Int. J. Electr. Power Energy Syst. 2018, 103, 421–430. [Google Scholar] [CrossRef]
- Zhang, T.T.; Liu, C.; Gong, J.F.; Zhao, W.X. Research on Distributed Generation Access System in Distributed Grid. Northeast. Electr. Power Technol. 2016, 37, 4–7. [Google Scholar]
- Bloemink, J.M.; Green, T.C. Increasing photovoltaic penetration with local energy storage and soft normally-open points. In Proceedings of the 2011 IEEE Power and Energy Society General Meeting, Detroit, MI, USA, 2011; pp. 1–8. [Google Scholar]
- Chen, S.J. Study on Distribution Network Optimal Operation and Distributed Generation Hosting Capacity; Tianjin University: Tianjin, China, 2016. [Google Scholar]
- Zeng, D.; Yao, J.; Yang, S.; Wang, K.; Li, Y. Economy comparison of VSC-HVDC with different voltage Levels. Autom. Electr. Power Syst. 2011, 35, 98–102. [Google Scholar]
- Sha, Y.; Qiu, X.Y.; Ning, X.J.; Han, X. Multi-Objective Optimization of Active Distribution Network by Coordinating Energy Storage System and Flexible Load. Power Syst. Technol. 2016, 40, 1394–1399. [Google Scholar]


| Network | Node Number | DG Type | The Largest Output |
|---|---|---|---|
| 1 | 9 | Wind power | 1.0 MVA |
| 1 | 14 | PV | 1.2 MVA |
| 1 | 17 | PV | 1.2 MVA |
| 2 | 10 | Wind power | 1.0 MVA |
| 2 | 13 | PV | 1.2 MVA |
| 2 | 16 | PV | 1.2 MVA |
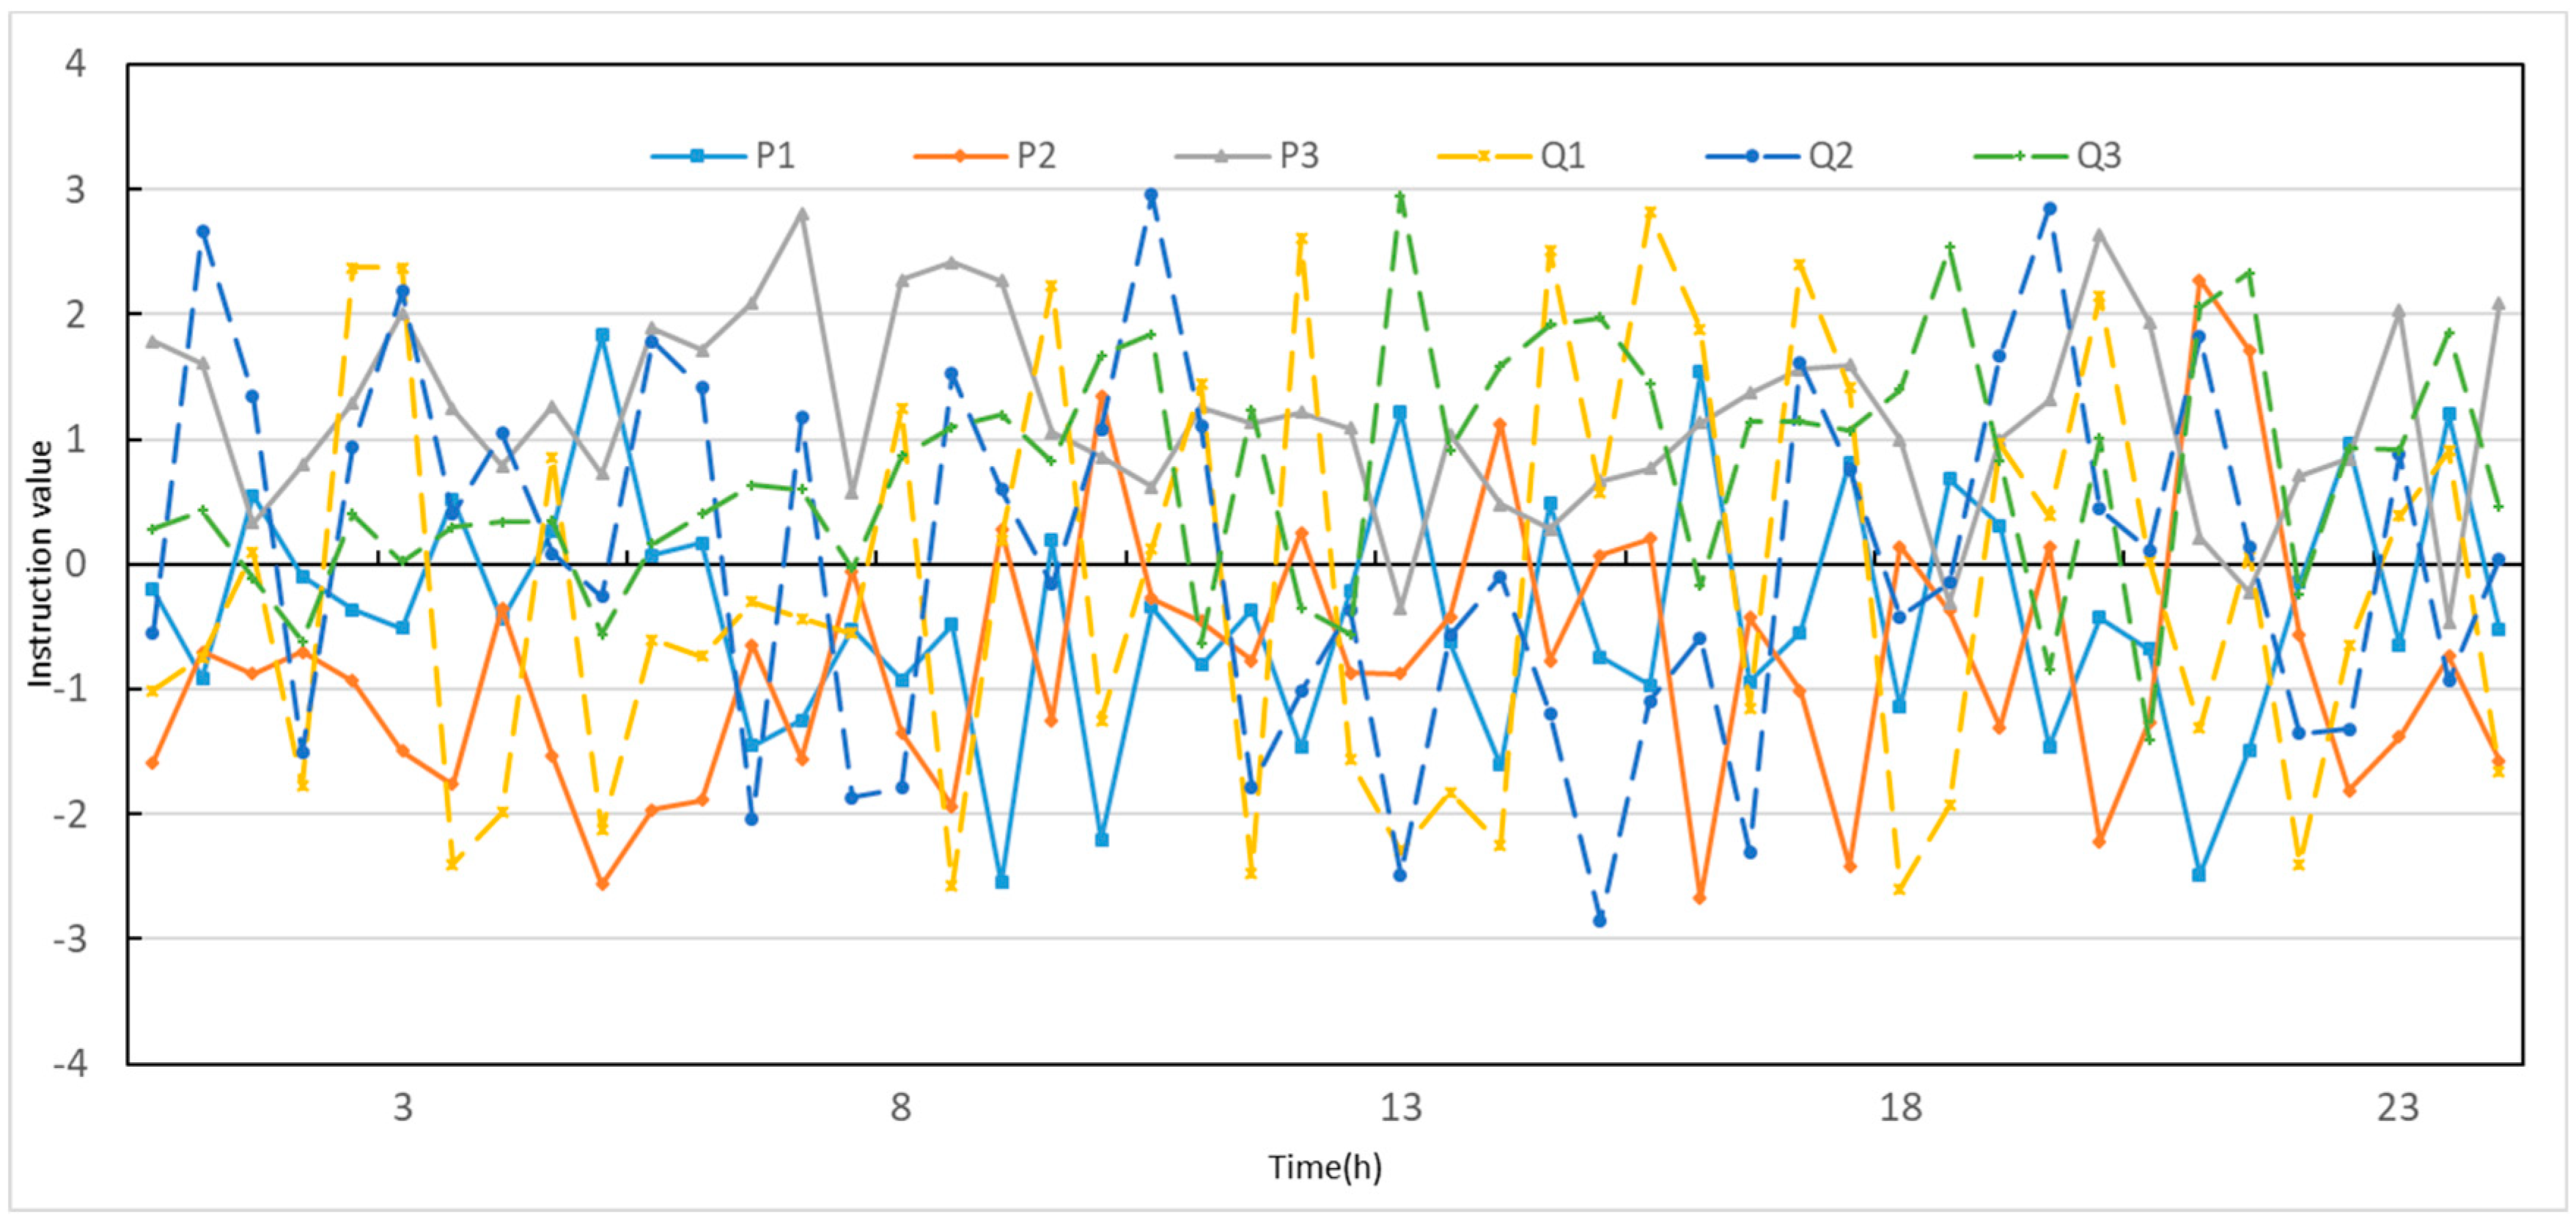
| Time | 0.5 | 1 | 1.5 | 2 | 2.5 | 3 | 3.5 | 4 |
|---|---|---|---|---|---|---|---|---|
| P1 | −0.20057 | −0.90772 | 0.54854 | −0.09768 | −0.36662 | −0.51317 | 0.521791 | −0.43873 |
| P2 | −1.58659 | −0.70286 | −0.87732 | −0.70019 | −0.9288 | −1.49431 | −1.76383 | −0.34716 |
| P3 | 1.78716 | 1.610584 | 0.32878 | 0.797874 | 1.295425 | 2.007476 | 1.242042 | 0.785884 |
| Q1 | −1.01279 | −0.74397 | 0.103522 | −1.77163 | 2.377847 | 2.373122 | −2.39969 | −1.98806 |
| Q2 | −0.55298 | 2.66953 | 1.353455 | −1.50465 | 0.944353 | 2.185228 | 0.399828 | 1.047951 |
| Q3 | 0.279531 | 0.427288 | −0.1135 | −0.61834 | 0.402047 | 0.019273 | 0.296871 | 0.341887 |
© 2019 by the authors. Licensee MDPI, Basel, Switzerland. This article is an open access article distributed under the terms and conditions of the Creative Commons Attribution (CC BY) license (http://creativecommons.org/licenses/by/4.0/).
Share and Cite
Zhao, G.; Liu, J.; Liu, S.; Zhou, X.; Li, J.; Lu, Y. Control Strategy Based on the Flexible Multi-State Switch for Maximum Consumption of Distributed Generations in Distribution Network. Appl. Sci. 2019, 9, 2871. https://doi.org/10.3390/app9142871
Zhao G, Liu J, Liu S, Zhou X, Li J, Lu Y. Control Strategy Based on the Flexible Multi-State Switch for Maximum Consumption of Distributed Generations in Distribution Network. Applied Sciences. 2019; 9(14):2871. https://doi.org/10.3390/app9142871
Chicago/Turabian StyleZhao, Guopeng, Jiaxing Liu, Siyuan Liu, Xinwei Zhou, Jihong Li, and Yi Lu. 2019. "Control Strategy Based on the Flexible Multi-State Switch for Maximum Consumption of Distributed Generations in Distribution Network" Applied Sciences 9, no. 14: 2871. https://doi.org/10.3390/app9142871
APA StyleZhao, G., Liu, J., Liu, S., Zhou, X., Li, J., & Lu, Y. (2019). Control Strategy Based on the Flexible Multi-State Switch for Maximum Consumption of Distributed Generations in Distribution Network. Applied Sciences, 9(14), 2871. https://doi.org/10.3390/app9142871