Abstract
Recent outbreaks of infectious diseases remind us the importance of early-detection systems improvement. Infodemiology is a novel research field that analyzes online information regarding public health that aims to complement traditional surveillance methods. However, the large volume of information requires the development of algorithms that handle natural language efficiently. In the bibliography, it is possible to find different techniques to carry out these infodemiology studies. However, as far as our knowledge, there are no comprehensive studies that compare the accuracy of these techniques. Consequently, we conducted an infodemiology-based study to extract positive or negative utterances related to infectious diseases so that future syndromic surveillance systems can be improved. The contribution of this paper is two-fold. On the one hand, we use Twitter to compile and label a balanced corpus of infectious diseases with 6164 utterances written in Spanish and collected from Central America. On the other hand, we compare two statistical-models: word-grams and char-grams. The experimentation involved the analysis of different gram sizes, different partitions of the corpus, and two machine-learning classifiers: Random-Forest and Sequential Minimal Optimization. The results reach a 90.80% of accuracy applying the char-grams model with five-char-gram sequences. As a final contribution, the compiled corpus is released.
Data Set License: CC0
1. Introduction
Epidemics exert great pressure on public health services because they can collapse health services and cause panic among society. Although epidemic outbreaks have been appearing since antiquity (black plague, Spanish flu, cholera, etc.), even in the 21st century they are still one of the most serious problems in current society. Recent events, such as the Severe Acute Respiratory Syndrome (SARS) in 2012, the Influenza H1H1 Pandemic in 2009, or recent cases of the Zika virus in Central America, remind us of the serious impact that the outbreaks of infectious diseases cause on many spheres of the society. The World Health Organisation (WHO) annually offers a series of global health statistics, consisting of data from 194 countries. In its 2018 report (https://apps.who.int/iris/bitstream/handle/10665/272596/9789241565585-eng.pdf?ua=1), WHO reported that neglected tropical diseases (NTDs) required mass or individual treatment for 1.5 billion people.
Infodemiology is a novel research field that consists of the analysis of online information regarding public health that aims to complement traditional surveillance methods and, therefore, improve the early detection of these outbreaks [1]. Internet content can be exploited, either by monitoring query searches and by the analysis of the user’s opinions on social networks. However, both scenarios deal with large volumes of information. It is necessary, therefore, to develop efficient algorithms for Information Retrieval (IR) specialized in surveillance tasks, but the challenge lies in the fact that these algorithms need to handle texts written in natural language that express subjective concerns in an efficient way.
Consequently, in this work we conducted an infodemiology-based study to detect positive or negative utterances related to infectious diseases so that future syndromic surveillance systems could be improved. In addition, this study compares two different information retrieval models: (1) word-grams and (2) char-grams. As a final contribution, we provide a balanced corpus of tweets compiled from countries from Central America related to the mosquito-borne infectious diseases domain.
Specifically, the contributions of this work can be summarized as:
- Development of a balanced corpus of mosquito-borne infectious diseases composed by 6124 tweets written in the Spanish. This corpus was manually labelled by different volunteers that worked individually. Therefore, the corpus is ordered by consensus, with the tweets that the volunteers agreed on the most in the first positions.
- Compare the accuracy between two Information Retrieval models: Word-grams and Char-grams. The comparison is performed against different partitions of the corpus and between two machine-learning classifiers: random-forest (RF), a decision-tree classifier, and sequential minimal optimization (SMO), a support vector machines (SVM) classifier.
The remainder of this paper is organized as follows: Section 2 provides some background information concerning infodemiology and opinion mining. Section 3 describes the development of the corpora used in this research. Section 4 describes the experiment performed whereas Section 5 contains the link to the resources generated. Finally, Section 6 summarizes the conclusions of the paper and indicates further line actions.
2. Background Information
In this paper we conduct an infodemiolgy-based study to predict subjective opinions towards infectious diseases. Accordingly, this section contains background information regarding (1) infodemiology (see Section 2.1) and (2) opinion mining (see Section 2.2).
2.1. Infodemiology
Traditional surveillance systems involved to track data from different sources, such as school absenteeism logs or emergency call systems. However, the design of effective and reliable methods to detect outbreaks is a challenge because the interval between a person becomes infected until their diagnosis is confirmed can be delayed from weeks to months. Moreover, this situation is aggravated in areas where there are not reliable resources for diagnosis, so the infection may remain undetected or be diagnosed when the treatment is less effective.
Infodemiology may be defined as the science that deals with information on the Internet with the aim to inform public health and public policy [2]. This research field has different benefits. For example, infodemiology facilitates the extraction of feedback from patients, since they have more confidence and are calmer at home, an environment that encourages sincerity, since its privacy is often perceived as absolute.
To conduct infodemiolgy studies it is necessary to find data sources that can be processed. On the one hand, some researches used search queries to obtain the information. In this sense, Google Trends is the de facto data source. Forough et al. [3] used Google Trends to analyze search queries regarding cancer to determine the distribution of information seeking in English-speaking countries. Their results show a seasonality pattern in searching for cancer. Mavragani et al. [4] measured the online seeking behaviour towards asthma in the United States from 2004 to 2015 with the objective of predict future trends regarding asthma. Their results show robust forecasting models for a five-year period. However, Google Trends is not the only data-source used for search queries. Wikipedia, for example, is another popular data-source that has been used to analyze the searching behaviour towards epilepsy and epileptic seizures for English-speaking internet users [5]. On the other hand, social networks, especially Twitter, is the other major Infodemiology data source. In this sense, Alessio et al. [6] analyzed tweets related to the health domain, showing how and when people make use of the internet with the aim of providing clues about future health concerns and expectations. Other works, such as [7] explored the reliability of Twitter as a real-time content and sentiment trend-tracking tool by the analysis of two million Twitter posts about swine flu, swineflu, and H1N1. Their results indicate that tweets containing information from news websites were the most popular sources, over government and health agencies.
Ideal infodemiology systems should work in real time and produce reliable evidence-based content [8]. To achieve these goals, it is necessary the existence of corpora that permit to validate new tools and methods. Mike Conway et al. [9] published a gold-standard corpus to test how syndromic surveillance systems are able to identify semantics with respect to disease outbreak events. This corpus contains 200 documents based on news, with geographic metadata and specific information of different infectious diseases such as bird flu. A more recent corpus can be found in [10], where the authors compiled 1090 tweets to identify texts written in Filipino related to infodemiology. However, as far as our knowledge, the corpus is not publicly available.
2.2. Opinion Mining
Opinion mining (OM) is a natural language processing (NLP) technique that creates predictive models capable of inferring the subjective opinion towards a specific topic. Opinion mining can handle different degrees of specificity. In their most simpler approach, it can classify documents as a whole (document-level classification), by predicting an unique sentiment in the whole document. Document-level approaches are effective when the goal is to discover a general predisposition. Besides, when the documents to be classify are large, document-level is more reliable than other approaches because it provides better word co-occurrence for finding discriminating features. Nevertheless, as users can like or dislike certain aspects of the same topic, or even express contradictory ideas, it is possible to split the documents into: (1) sentences (sentence-level classification) or (2) aspects (aspect-level classification). An an aspect level classification consists of the representation of sentiments as triplets {user, feature, sentiment}. In this sense, ontologies have been proved to be an effective method to extract the aspects for an specific domain [11,12,13,14,15,16].
The polarity of an utterance can be obtained by two approaches: (1) semantic-orientation, and (2) machine-learning. Semantic-orientation consists of the identification of specific linguistic units that are associated to sentiments. In this sense, it is needed the use of lexicons such as SentiWordNet [17], that contains words with scores related to positive and negative sentiments. A machine-learning approach, on the other hand, consists of the training of a machine-learning classifier from a labelled corpus.
A machine-learning approach requires to encode texts as vectors. Bag of words (BoW) is a statistical-model that measures the frequency of each word in the corpus. BoW model is widely used as a baseline model for some NLP tasks; however, it presents some drawbacks: (1) it considers words without context, so it does not take into account linguistic phenomenons such as the figurative language, the presence of typos, or grammatical errors; (2) it is not truly language-independent. Language independence means that, once an algorithm is developed, it can trivially be extended to another language as long as we have available a large amount of training data. But in the BoW model, this is only true for non-agglutinative and western languages, such as Spanish, English, Italian or Portuguese, where words usually have a single inflectional morpheme to denote multiple grammatical, syntactic, or semantic features. In agglutinative languages, on the other hand, complex words are formed by stringing together morphemes without changing them in spelling or phonetics which hinders the frequency of the word-grams; and (3) it suffers from the curse of dimensionality, because it tends to create over-fitted models due to the vocabulary size. This problem is aggravated in agglutinative languages because it produces a large number of word forms that can be obtained from a single root. In order to solve these drawbacks some researchers have proposed different alternatives. For example, some researchers argue that the use combinations of joint words minimize the absence of context [18]. In this sense, bigrams and trigrams are capable of extract concepts expressed with compound words, such as the bigram New York instead of the unigrams New and York.
On the other hand, n-grams generates even large vectors that aggravate the high dimensionality problem and may introduce redundant features. The usage of sequences of characters (char-grams), instead words, has also been proposed [19]. Char-grams presents some advantages over the word-grams model: First, char-grams capture (1) lexical information, such as the use of punctuation symbols, and (2) morphological information, such as prefixes or suffixes. Second, char-grams are robust against grammatical errors, because a misspelled word and its correct version should share common char-grams. Third, char-grams can deal with agglutinative languages because it is capable of extract the individual phonemes from compound words.
Apart from the statistical models, there are linguistic models which represents texts written in natural language as the percentage of psychological-relevant words what convey what the text say, and how it says it. LIWC [20] is a tool widely used for conducting opinion mining that has been applied to different domains, such as the financial domain [21], or deceit detection [22]. However, linguistic models present the drawback that they are highly language-dependant so it is difficult to adapt them to other languages.
3. Methods
In this work, a balanced corpus formed by 6164 tweets was compiled and manually classified. The description of this corpus is explained in Section 3.1. The statistical models and the machine-learning classifiers are explained in Section 3.2. Finally, Section 3.3 and Section 3.4 contains the description of results obtained by the word-gram model, and the char-gram model respectively.
3.1. Data Acquisition
The creation of healthcare web-based data involves mainly two steps. The first step consisted of the data acquisition, whereas the second step involved human intervention for classifying and checking the results. Machine learning techniques required an existing labelled corpus to work. The manual classification and labelled of a corpus is a very time-consuming task. Distant supervision is a technique that consists of the automatic classification of the texts based on certain hypothesis [23] such as the presence of emoticons for satire identification. However, distant-supervision is not always possible.
We used Twitter, a popular micro-blogging platform, as the data-provider for corpus compilation. In Twitter, users can create and share their opinions in micro-posts of 248 characters maximum known as tweets. In Twitter, (1) posts are public and easy to obtain by using Twitter API. In addition, (2) due to the text limit of the posts, it is easy to spot posts focused in one specific topic. These two facts has leaded Twitter to be widespread used for text-analysis experiments.
We used a self-developed tool that uses Twitter API to obtain, systematically, tweets that contain the terms related to neglected tropical diseases: zika, chinkungunya, malaria and dengue. These tweets were compiled from some countries of Central America, with the geographical coordinates (−0.1596997, −78.452125313) with a radius of 1500 kilometres. This area includes the countries of Central America such as Ecuador, Colombia, and Panama. It also includes some areas from Venezuela, Peru, and Brasil (see Figure 1). Then, we apply a normalization process to the tweets consisted in transform some entities, such as hyperlinks, to fixed tokens and to remove duplicated items.
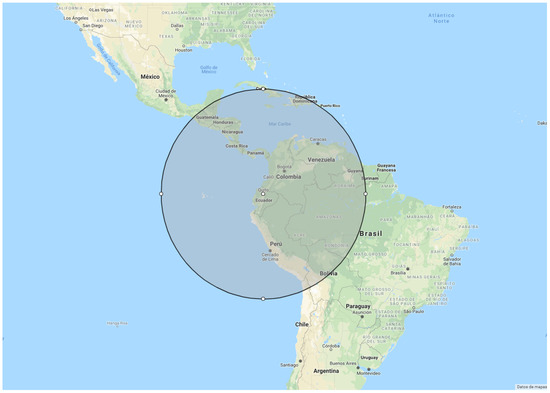
Figure 1.
Geographical area from Central America where tweets were collected.
As no reliable techniques for distant-supervision were identified, we relied in a manual classification. Tweets were manually classified by a total of 20 volunteers from the University of Guayaquil. Volunteers were provided with a manual of the tool, and with some examples concerning what kind of statements are expected to be positive, negative, neutral, and out-of-context tweets. During the classification stage, the performance of the volunteers were monitored in order to identify possible issues as soon as possible. Each week, the performance of each volunteer was measured individually to ensure that the number and quality of the ratings were constant. The overall performance of the volunteers among time is shown in Figure 2 that illustrate the classification process. We can observe that the work was continuous during the weekdays.
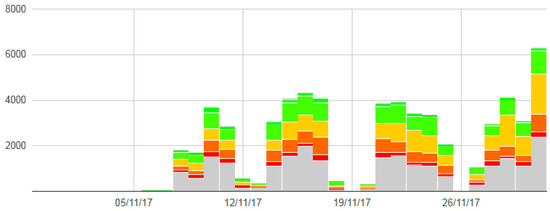
Figure 2.
Volunteers performance over time. Each colour represents a different classification, where green represents positive tweets, red represents negative tweets and grey colours represents neutral and out-of-context tweets. The horizontal axis is measured with GMT+01:00.
Each tweet was rated individually by different volunteers. This strategy allowed us to obtain a global score that indicates the level of agreement, or disagreement, among the volunteers. A screen-capture of this tool is shown in Figure 3. In a nutshell, the volunteers opened the tool using a log-in system. Once the volunteers were authenticated, the system generated a random list of tweets still unrated by him. Then, each volunteer can rate each tweet assigning one option from a drop-down list. The texts were normalized version of the tweets, without images nor links. However, it was possible to volunteers to visualize the original tweet from Twitter. However, volunteers were discouraged to do it because we were only interested in the sentiment of the text, but not the sentiment of external resources or media.
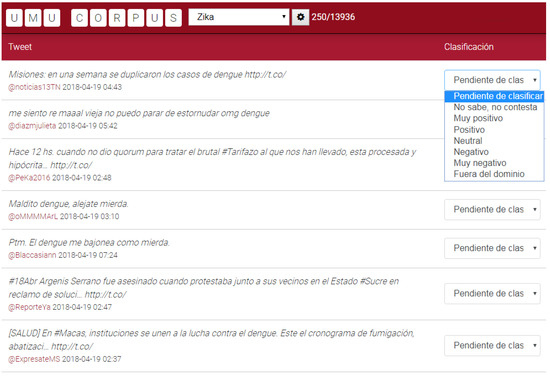
Figure 3.
Screen-capture of the corpus classifier tool with some examples of tweet.
As a result, a balanced corpus composed by 3082 positive tweets and 3082 negative tweets was obtained. In total, the corpus contains 3719 different accounts from Twitter with a mean of 1.39 tweets per account with a standard deviation of 0.98. The large amount of users suggests that this corpus represents an heterogeneous group of users, such as individuals, media or organizations. In addition, the performance of the volunteers was also monitored. Volunteers performed 2567 ratings of average, reaching to 51,359 ratings. The metrics of the corpus are summarized in Table 1. As a side-note, the extraction of the corpus started from November, 2017. A preliminary version of this corpus was used in previous works of our research group [24,25].

Table 1.
Corpus statistics.
Then tweets were sorted by agreement. Each rating of the volunteers score 1 point for positive and very positive tweets and score −1 point for negative and very negative tweets. Tweets with a total score near 0 means that they had contradictory ratings and its sentiment was not clear. We used these scores to divide the corpus into smaller chunks. The smaller version of the corpus consisted of the 100 elements with major score among the volunteers (50 positive and 50 negative). Then, we doubled the amount of tweets until we reached the maximum of the available tweets.
In addition, as statistical-models tend to generate large amounts of features, we applied a cut-off filter for removing uninformative grams, based on the assumption that those rare grams represented obscure words, misspellings or non-words. The threshold of the cut-off filter was set as 5%. This value was selected after trying different values in order to keep only the more significant grams for larger corpora corpus-6 and corpus-7. Table 2 shows the details of the all the generated corpora.
Table 2.
Details of the corpora splits.
3.2. Statistical Models
We used word-grams and char-grams as statistical models (see Section 2.2). In addition, we applied the term-frequency-inverse document frequency (TF-IDF) to measure the relevance of each feature. Specifically, the normalized term frequency of TF was applied. This version of the algorithm divides the number of times that an specific feature appears in the text by the number of features extracted (see Equation (2)). This normalization over the term-frequency (TF) helps to prevent bias in longer or shorter documents.
For the comparison between the statistical models, we have selected two machine-learning classifiers: (1) RF and (2) SMO. On the one hand, RF is a classification algorithm based on a decision tree [26]. It is an ensemble method, so this technique combines the predictions from multiple machine-learning algorithms together to make more accurate predictions than any individual model. Specifically, Random-Forest is an improvement over bagged decision-trees because the sub-trees are learned to produce less correlation and the results are not over-fitted. On the other hand, SMO is a SVM method, that is a classification algorithm which finds the optimum hyper-plane that distinctly separates the classes in a data-set [27]. SMO can be used to model non-linear relationships used in conjunction, such as specific kernels. However, to find which kernel is most suitable for specific data is a trial–error experiment. To solve this issue we chose a universal kernel based on the Pearson VII function (PUK) [28]. RF and SMO were selected because (1) SMO is an algorithm that can handle non-linearly separable data what it may the case of high-dimensionality problems; (2) RF, although it is not straightforward, allows the use of interpretation techniques that involves to understand what are the features which mostly contributes to its outputs. In this sense, Anna Palczewska et al., proposed in [29] a method capable of determining the influence of each feature variable for specific instances; (3) both algorithms were applied in the past to perform NLP [30]; and (4) decision-trees and SVM were included among the 25 best classifiers identified in a deep analysis performed in [31].
The experiments described in this paper were executed in the WEKA platform [32]. Both machine-learning classifiers were trained with a 10-fold cross validation approach. The comparison between the machine learning classifiers was performed by comparing its accuracy (see Equation (4)), because it was simple to measure, and because the corpus was balanced, so there was not a dominant class which can lead to high accuracy rates only predicting the dominant class. In addition, the measures of precision (see Equation (5)), recall (see Equation (6)) and F-measure (see Equation (7)) were used in the experiment.
where TP (true positives) is the number of tweets classified as positive and, indeed, they are positive; TN (true negatives) is the number of tweets classified as negative and they are negative; FP (false positives) is the number of tweets classified as positive but they were negative; and, finally, FN (false negatives) stands for the the number of tweets classified as negative but they were labelled as positive.
3.3. Word Gram Model
To generate the features for the word-gram model, we defined the word-delimiter token. In Spanish, words with underscores and/or hyphens are usually treated as individual units because hyphens as used in Spanish (1) to join two first names, when the second one can be confused with the surname; (2) to establish circumstantial relationships among proper names; (3) to create compounds terms by the union of two nouns, of which the second acts, in apposition, as modifier of the first, forming both a unitary concept; (4) to establish relationships among concepts or units; and (5) to create a division of words at the end of the line. Then, HTML tags, numbers, and hyperlinks were stripped from the text and sequences of two or more consecutive spaces and line-breaks were merged. Once the normalization process was finished, the unigrams, bigrams and trigrams were extracted. For example, the tweet virus con síntoma del zika avanza en el Zulia (in English, virus with symptoms of Zika advances in Zulia) produced the following unigrams: avanza, con, del, el, en, síntoma, virus, zika and zulia. Finally, a vector containing the TF-IDF scores per feature was generated. These vectors were used as input for the machine-learning classifiers.
The results of the different configurations are described below. First, the results of the performance of applying unigrams, bigrams, and trigrams, used in isolation, for the word-gram model are shown in Table 3. The results highlight that unigrams achieve better accuracy than bigrams and trigrams. SMO achieved its best result on the corpus-3 with an accuracy of 90.50%. The accuracy of RF was slightly lower, with 88.00% with the same corpus. The relationship between the accuracy of unigrams with the corpus size is shown in Figure 4 for RF and in Figure 5 for SMO. In these figures we can observe how RF and SMO behaved similar from corpus-1 (100 tweets) to corpus-6 (3200 tweets) for unigrams. The accuracy decreased in corpus-7 (6164 tweets) with 77.90% for RF and 77.30% for SMO. This loss of accuracy is caused by the cut-off filter because, as the corpus size gets larger, some features do not pass the threshold.
Table 3.
Performance of unigrams, bigrams and trigrams for the word-gram model.
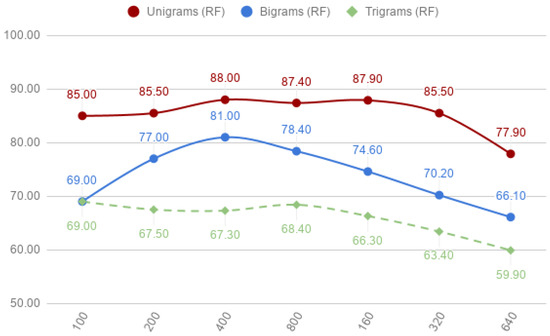
Figure 4.
Word-grams: unigrams, bigrams and trigrams of random-forest (RF) classifier per corpora.
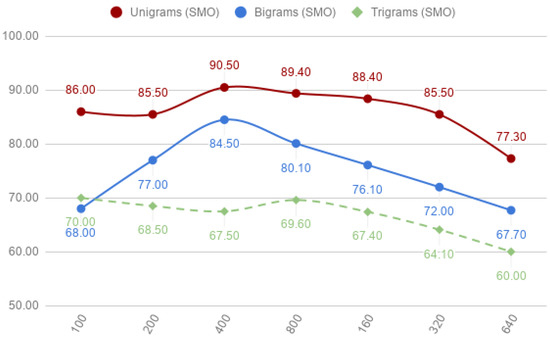
Figure 5.
Word-grams: unigrams, bigrams and trigrams of sequential minimal optimization (SMO) classifier per corpora.
Regarding the bigrams, the results shown in Table 3 indicate that word-pairs achieve good performance in all corpus for both classifiers, RF with a mean of 73.76% and a standard deviation of 5.46% and SMO with a mean of 75.06% and a standard deviation of 6.23%. As expected, the accuracy of the bigrams was less than in the unigrams. The relationship between the accuracy of bigrams with the corpus size is shown in Figure 4 for RF and in Figure 5 for SMO. In these figures we can observe how both models begin with little accuracy in the small corpus, reach their peaks of accuracy in the intermediate-sized corpus and, finally, decrease linearly their accuracy each time the corpus size is doubled. The use of trigrams achieved the lowest results, behaving in some cases as random classifiers. However, the use of trigrams (or even bigger grams) should not be dismissed so lightly, because they can represent idioms or quotes much better than unigrams.
With respect to the classification algorithms, it can be seen that SMO achieved better results than RF in unigrams, bigrams and trigrams models. The difference in unigrams is significant, SMO achieves an accuracy of 90.50% for corpus-3 since RF achieves an accuracy of 88.00%. On the other hand, the differences in the results of SMO and RF in trigrams decreases. SMO model achieves better accuracy than RF because SMO is performs better on sparse data. Word-grams model tends to produce large amounts of features but only a small fraction of these features may have a value greater than zero. In addition, we can observe that the difference between SMO and RF was stable among the different corpus.
Figure 4 and Figure 5 show that unigrams always achieved better accuracy than bigrams or trigrams. SMO improved slightly the accuracy of RF in the case of unigrams, but the overall behaviour of both models was similar (except when comparing RF and SMO in corpus-1).
Different combinations of unigrams, bigrams and trigrams to detect if there is any improvement were also studied. The results for combinations of (1) unigrams and bigrams, (2) bigrams and trigrams, and, finally, (3) unigrams, bigrams and trigrams are shown in Table 4.
Table 4.
Performance of combinations of unigrams, bigrams and trigrams.
The combination of unigrams and bigrams, shown in the first section of Table 4, improved the accuracy obtained by unigrams applying RF. However, this increment was slightly, with 89.00%. With SMO, the accuracy presents a slight reduction with 89.30%.
The combinations of unigrams, bigrams and trigrams achieve the best accuracy for the corpus-3 with 89.80% for RF and 88.30% for SMO. The comparison of these results with individual unigrams, bigrams or trigrams presents two differences. On the one hand, RF increased the accuracy from 88.00% to 89.70%. SMO, on the other hand, decreased its accuracy from 90.50% to 88.30%. Compared to bigrams, RF and SMO improved their accuracy, RF with 89.80% and SMO with 88.30%. When compared with trigrams, the best accuracy of both classifiers is reached with the smaller corpus (corpus-1).
With respect to the classification algorithms, it can be seen that SMO achieves better results than RF in unigrams in the combination of (1) unigrams and bigrams, (2) bigrams and trigrams. However, RF achieves slightly better accuracy for the combination of unigrams, bigrams and trigrams. In this experiment, some features are dependant for other because we have features to represent the same concepts. For example, the expression El Zika, which stands for the Zika disease will produce the following word-grams: Él (The), Zika, El Zika. In this sense, these features are redundant and they do not add relevant information. RF internally selects optimal splits so redundant features should not affect them. However, massive redundancy it could cause that the the redundant feature-set was selected instead better splits decreasing the quality of the model.
When comparing SMO and RF with smaller corpus size, we can observe how there is a major difference between them. SMO achieves lower results, specially significantly for the combination of unigrams and trigrams and the combination of unigrams, bigrams and trigrams. In this sense, as the features have more redundancy, SMO is not capable of perform a good separation of the positive and negative classes.
Figure 6 and Figure 7 shows the relationship between the accuracy with the corpus size for the RF and SMO classifiers, respectively.
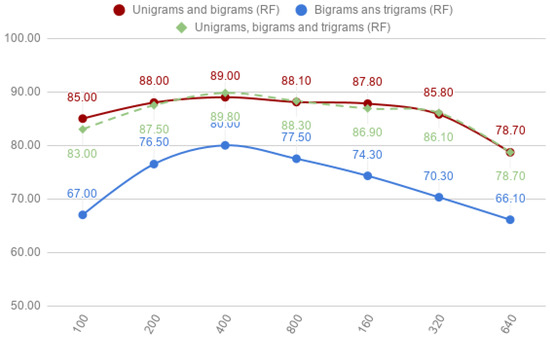
Figure 6.
Combinations of unigrams and bigrams, bigrams and trigrams, and unigrams, bigrams and trigrams for the random-forest (RF) classifier.
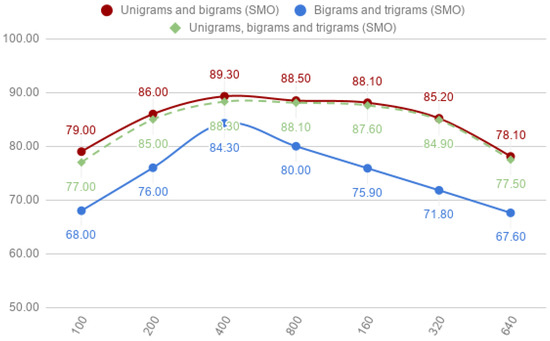
Figure 7.
Combinations of unigrams and bigrams, bigrams and trigrams, and unigrams, bigrams and trigrams for the Sequential Minimal Optimization (SMO) classifier.
3.4. Char-Grams Models
In this suite of experiments, we applied the char-gram model instead of the word-gram model. Char-grams were generated similar to word-grams. In a nutshell, the pipeline can be described as follows. First, tweets were transformed to lowercase; then, non-informative characters, such as line-breaks, tabs, html entities, or non-ascii characters were removed and, finally, multiple spaces were collapsed into single spaces. If we take the example that we used above to illustrate the output features for the word-gram models, the same text (virus con síntoma del zika avanza en el Zulia), generates the following five-length char-grams: _avan, _con_, _del_, _el_z, _en_e, _sínt, _zika, _zuli, a_ava, a_del, a_en_, anza_, avanz, con_s, del_z, el_zi, el_zu, en_el, ika_a, íntom, irus_, ka_av, l_zik, l_zul, ma_de, n_el_, n_sín, ntoma, nza_e, oma_d, on_sí, rus_c, s_con, sínto, toma_, us_co, vanza, virus, za_en, zika_.
First, the results of the performance of applying five-, six-, seven- and eight-length char-grams for the char-gram model are shown in Table 5.
Table 5.
Results with five-, six-, seven- and eight-length char-grams.
The results concerning fixed length char-grams, shown in Table 5, indicate a minor improvement con respect word-grams. First, the results for five-char-grams achieve its best accuracy for the RF classifier and corpus-3 with a 90.70%; SMO, however, requires the double of tweets to reach until an accuracy of 90.00%. With sequences of six-char-grams, the overall accuracy of both classifiers decreases, but in different level; whereas SMO only losses an 0.20% of accuracy (89.80%), RF decreases an 5.70% (85.00%). Similar to the five-char-grams, SMO also requires the double of tweets than RF to achieve its best result. The best accuracy is obtained with seven-char-grams for RF and SMO requires less tweets that the best accuracy for the six-char-grams. As we increase the length of the char-grams to seven, we can observe how the accuracy of the model decreases gradually reaching to an 83.30% for the RF classifier and to 85.50% for SMO; both with the corpus-3. The results for the eight-char-grams achieve a best accuracy for the RF classifier with 85.00% with the corpus-1 and SMO achieves an 89.80% with the corpus-3.
The usage of char-grams instead of word-grams have reduced the sparsity of the data. However, there are much more redundant features in the corpora. As we are applying supervised learning for prediction, this extra features does not lowers the accuracy. However, they increase the storage and speed concerns. In addition, the differences between RF and SMO with smaller corpus size are significant. With unigrams, bigrams and trigrams, SMO and RF achieve similar results (See Table 3). However, char-grams performed worse with less corpus-size. This was due to the same features being able to appear both in positive and negative tweets and SMO was not capable of performing a good separation between then.
The accuracy among the size of the corpus for the RF model is shown in Figure 8 and for the SMO model in Figure 9. We can observe the accuracy of five, six and seven char-grams achieve a peak of the accuracy for the corpus-3. As the number of tweets increases, the accuracy of each length of char-grams keeps the same distance, with the best accuracy of five-char-grams and decreases a mean of 2.5% each time we increase in 1 the length of the char-grams sequences.
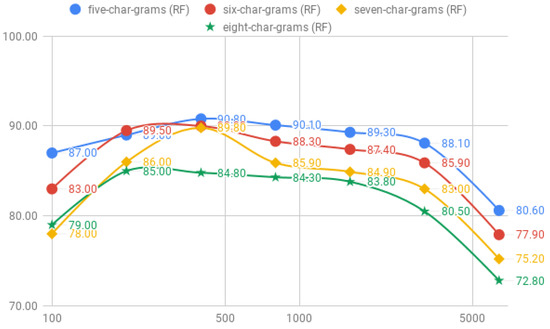
Figure 8.
Comparison of the accuracy between five-, six-, seven- and eight-char-grams for the RF classifier.
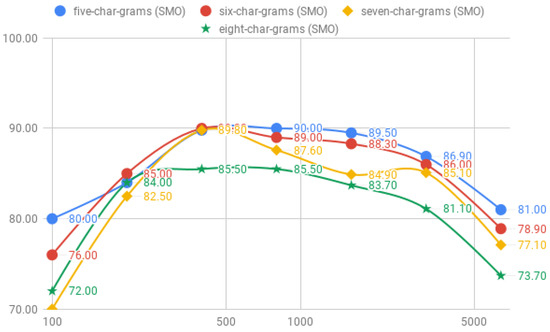
Figure 9.
Comparison of the accuracy between five-, six-, seven- and eight-char-grams for the SMO classifier.
The results for the combinations of {5, 6}, {6, 7} and {7, 8} char-grams are shown in Table 6. These results indicate that, as long has we increase the length of the char-grams, the performance of the classifiers decreases slightly. In concrete, the accuracy of RF goes down from 90.50%, with the combinations of {5, 6} char-grams, to 89.80% with the combination of {6, 7} char-grams and, finally, until 88.00%. Comparing SMO, we observed a similar loss of accuracy; from 89.30% with the combination of {5, 6} char-grams, to 88.50% with the combination of {6, 7} until 88.30% with the combination of {7, 8} char-grams. We can also observe that there was less accuracy with the fixed char-grams individually, where RF achieved also an accuracy of 90.80% with five-char-grams and SMO 90.00% (see Table 5).
Table 6.
Results using pair combinations of fixed-length characters for the char-gram model.
Regarding the machine-learning classifiers, RF improves the results in {5, 6} char-grams and {6, 7} char-grams. However, with {7, 8} char-grams is SMO the classifier that achieves better results. As we can expect, the difference between SMO and RF with smaller corpus are huge. However, the results have not worsened from the previous experiment where char-grams were applied without combinations.
The progression of the accuracy of combinations of pairs of char-grams for the RF model is shown in Figure 10 and for the SMO model in Figure 11, where we can observe that the accuracy varies significantly among the corpus size for the SMO classifier. For example, combination of {7, 8} char-grams only achieves an 67.00% of accuracy with the corpus-1, but increases until an 82.50% of accuracy with only 100 more tweets corpus-2; however, RF behaves more regularly with less instances besides it reaches slightly less better accuracy than SMO.
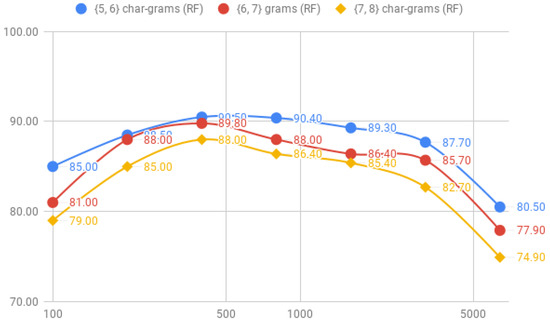
Figure 10.
Comparison of the accuracy between {5, 6}, {6, 7}, {7, 8} char-grams for the RF classifier.
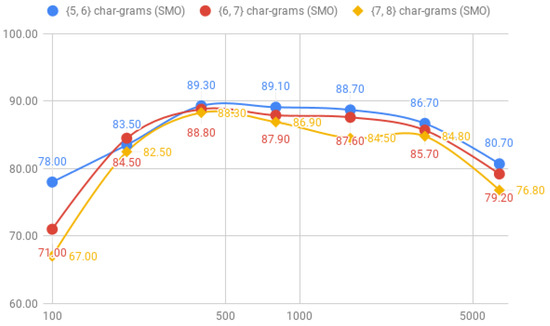
Figure 11.
Comparison of the accuracy between {5, 6}, {6, 7}, {7, 8} char-grams for the SMO classifier.
Finally, we measured the performance of combinations of {5, 6, 7}, {6, 7, 8} and {5, 6, 7, 8} char-grams. The results are available in Table 7.
Table 7.
Results using triplets of fixed-length character for the char-gram model and by mixing all the fixed length character combinations.
The results in Table 7 highlights that the combinations of all fixed-length results in the highest accuracy for the RF classifier with a 90.30% with the corpus-3. SMO, however, achieves better accuracy only combining char-grams of five-, six and seven-char-grams, but the difference with the full combination of char-grams is minimal. If we compare the results with the use of individual fixed-length, there are no improvement so we can conclude that the addition of more combinations of char-grams can only produce an overhead for the machine-learning classifiers.
Regarding the differences of the machine-learning classifiers, RF always achieves best results than SMO in all combinations. It draws our attention that the best result of SMO with combinations of {five, six, seven and eight} char-grams is worse than RF even with the double of the corpus size.
Figure 12 and Figure 13 shows how the accuracy varies among the corpus size, where we can observe that the behaviour of the classifiers gets similar with corpus-3, corpus-4 and corpus-5.
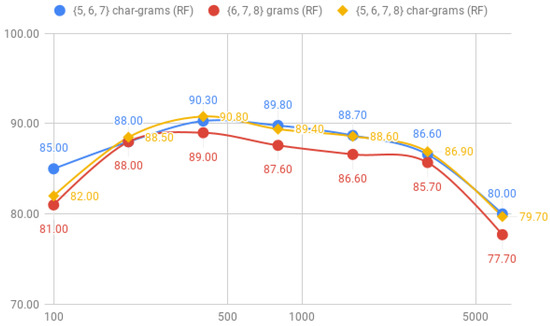
Figure 12.
Comparison of the accuracy between {5, 6, 7}, {6, 7, 8} and {5, 6, 7, 8} char-grams for the RF classifier.
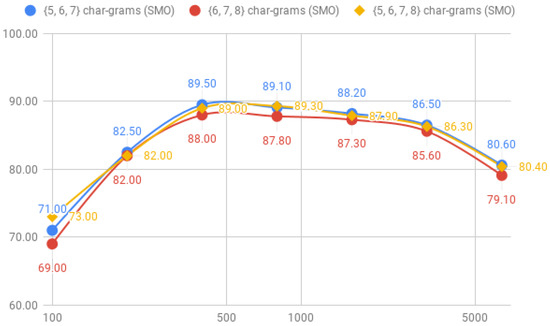
Figure 13.
Comparison of the accuracy between {5, 6, 7}, {6, 7, 8} and {5, 6, 7, 8} char-grams for the SMO classifier.
4. Discussion
The results achieved indicates a slightly increase of the accuracy of char-gram over word-grams. We observed that the use of short char-grams improves the results from larger values of N. Regarding the corpus size, the best accuracies were obtained by the corpus-2 and corpus-3, composed respectively by 200 and 400 tweets. As mentioned above, tweets were ordered by agreement among the users. Therefore, this fact remarks that it is more important to have a consensual corpus rather than a larger number of instances, which provides better accuracy in less time.
Information gain measures the relevance for each feature for the class prediction. This value is the key-factor which RF uses to decide when a new branch has to be created. In addition, information gain provides what are the most informative word-grams and char-grams. This metric could be used to understand the behaviour of the model and allows to perform adjustments for avoiding some features which may cause over-fitting. Accordingly, we obtained the unigrams, bigrams and trigrams which achieved better information gain. The ten best-scored features are shown in Figure 14. However, as we observed during the extraction of information gain, char-grams tend to provided very similar characteristics that may over-fit tweets with words that are used regularly.
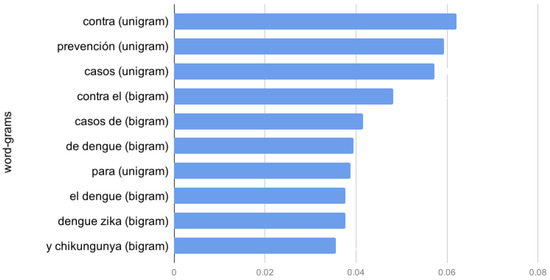
Figure 14.
Information gain for the best ten unigrams, bigrams and trigrams of the word-gram model.
Figure 14 shows shows that unigrams appear more frequently in the first 10 positions. Specifically, those unigrams are contra (preposition, against), prevención (substantive, prevention), casos (substantive, cases) and para preposition, for. Finding prepositions, such as contra or para suggests that a large number of positive or negative texts are phrases that express concrete and specific action. Therefore, we calculated the mean and the standard deviation of this prepositions and discover that the preposition para was used 3.23 more times of mean for positive than negative tweets. For the para preposition, the results showed a proportion of 3.23:1 between positive and negative tweets and for the contra preposition, the proportion was 5.75:1. The substantive casos, which may be used for reporting specific outbreak cases, appears mostly in negative utterances with a proportion of 1:5.5.
Concerning char-grams, the ten best-scored features are shown in Figure 15.
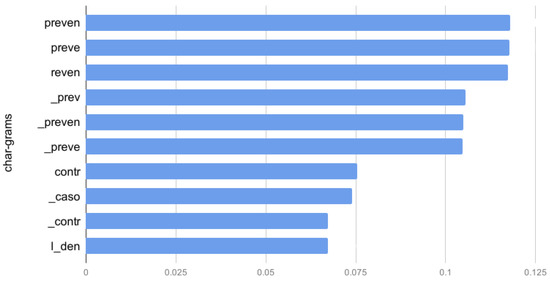
Figure 15.
Information gain for the best five-, six-, seven- and eight-char-grams.
The results shown in Figure 15 indicate that similar char-grams are interchangeable. For example, we can observe that the char-gram preven, which is a lemma for the substantive prevención (prevent), and for the verb prevenir (to prevent) appears on the top with equal relevance.
Char-gram model solve some of the drawbacks identified for the word-gram models (see Section 2.2). However, char-grams produces a high number of similar features so, for real-time applications, we will require of a feature selection process in order to identify the ones that are most effective for a specific machine-learning task. Word-grams, on the other hand, can produce less number of features with the proper usage of cut-off filters to avoid irrelevant features and these features requires less post-processing.
5. Materials and Methods
Accordingly to Twitter guidelines (https://developer.twitter.com/en/developer-terms/more-on-restricted-use-cases), we distributed the corpus by providing the list of the IDs of the tweets. With this, the authors of the Tweets conserve the rights about the right to delete their content on the internet. The corpus is available at http://semantics.inf.um.es/joseagd/infectious-diseases-ecuador-tweets-ids.rar. It is divided into 7 files, each with a partition of the corpus. The first file contains 100 tweets; a half of them were labelled as positive with major consensus among the volunteers; and the other half where the tweets which were labelled as negative with major consensus. So, the next file doubles the amount of tweets and it keeps the tweets from the previous file but also includes the following top-rated tweets. So, all corpus are (1) balanced, and (2) sorted by agreement (See Table 2).
6. Conclusions and Future Work
In this paper, we compare two statistical models to conduct opinion mining based on Infodemiology. The best result shown an accuracy of 90.80%, with sequences of five-char-grams applying random-forest. The word-gram model, on the other hand, achieved an accuracy of 90.50% with unigrams applying the support vector machines. Both models, char-grams and word-grams, achieved their best results with a subset (corpus-3) of the whole corpus, composed by the 400 tweets with more consensus among the volunteers. In addition, the analysis showed that the addition of bigrams or trigrams to the word-gram model does not significantly improves its accuracy. The same behaviour is detected in the char-gram model, where the best results are obtained by the use of fixed sequences of char-grams of length five. The combinations of larger sequences and combinations of char-grams do not improve the accuracy. We conclude that it is more important to compile a corpus with a certain degree of consensus than a large one. In addition, Infodemiology systems require us to measure the capability of predicting possible outbreaks in short and medium term. However, as the infectious diseases domain is very complex, we are planning to use other domains, such as weather or stock-market, to measure the reliability of creating predictive models for other domains.
As future work, we will introduce neutral tweets to observe if the accuracy of the statistical-models is affected for each machine-learning classifier. However, in the infectious diseases domain, it is very difficult to distinguish between neutral or negative tweets because news related to an outbreak are usually perceived as negative, so it is difficult to keep the balanced corpus. In addition, we will compare these statistical-models with a linguistic-model in order to use psychology-relevant linguistic features instead of simple grams or char-grams with the expectation to increase the interpretability of the models.
The methods described in this work will be used to create an automatic tool capable of monitoring infectious-diseases trends. We are now exploring three different areas: (1) social-networks, as described in this paper; (2) official documents, where we will apply NLP tasks, such as document-classification, named-entity recognition, and opinion mining; and (3) gamification techniques, to promote citizen participation, from identifying possible causes of infectious diseases, such as poor sanitary conditions or the presence of mosquitoes in the nearby areas. These data-sources will be available for health-care professionals through a dashboard capable of monitoring different geographical areas. This project also involves the application of ontologies to model the infectious diseases domain, and we will explore the reliability of block-chain, to create a trust-system of anonymous data sources.
Author Contributions
Conceptualization, Ó.A.-A., J.A.G.-D. and R.V.-G.; data curation, J.M.-M. and H.L.-A.; funding acquisition, R.V.-G.; investigation, Ó.A.-A.; project administration, R.V.-G.; resources, Ó.A.-A., J.M.-M. and H.L.-A.; Software, J.A.G.-D.; supervision, R.V.-G.; visualization, J.A.G.-D.; writing—original draft, all.
Funding
This research was funded by the Spanish National Research Agency (AEI) and the European Regional Development Fund (FEDER / ERDF) through project KBS4FIA (TIN2016-76323-R). This research has been also supported by CDTI through project CollaborativeHealth (UNI-20180001/IDI-20180989).
Conflicts of Interest
The authors declare no conflict of interest.
References
- Eysenbach, G. Infodemiology: The epidemiology of (mis) information. Am. J. Med. 2002, 113, 763–765. [Google Scholar] [CrossRef]
- Eysenbach, G. Infodemiology and infoveillance: Framework for an emerging set of public health informatics methods to analyze search, communication and publication behavior on the Internet. J. Med Internet Res. 2009, 11, e11. [Google Scholar] [CrossRef] [PubMed]
- Foroughi, F.; Lam, A.K.; Lim, M.S.; Saremi, N.; Ahmadvand, A. “Googling” for cancer: An infodemiological assessment of online search interests in Australia, Canada, New Zealand, the United Kingdom, and the United States. JMIR Cancer 2016, 2, e5. [Google Scholar] [CrossRef] [PubMed]
- Mavragani, A.; Sampri, A.; Sypsa, K.; Tsagarakis, K.P. Integrating Smart Health in the US Health Care system: Infodemiology Study of asthma monitoring in the Google era. JMIR Public Health Surveill. 2018, 4, e24. [Google Scholar] [CrossRef] [PubMed]
- Brigo, F.; Otte, W.M.; Igwe, S.C.; Ausserer, H.; Nardone, R.; Tezzon, F.; Trinka, E. Information-seeking behaviour for epilepsy: An infodemiological study of searches for Wikipedia articles. Epileptic Disord. 2015, 17, 460–466. [Google Scholar] [PubMed]
- Signorini, A.; Segre, A.M.; Polgreen, P.M. The use of Twitter to track levels of disease activity and public concern in the US during the influenza A H1N1 pandemic. PLoS ONE 2011, 6, e19467. [Google Scholar] [CrossRef]
- Chew, C.; Eysenbach, G. Pandemics in the age of Twitter: Content analysis of Tweets during the 2009 H1N1 outbreak. PLoS ONE 2010, 5, e14118. [Google Scholar] [CrossRef]
- Zeraatkar, K.; Ahmadi, M. Trends of infodemiology studies: A scoping review. Health Inf. Libr. J. 2018, 35, 91–120. [Google Scholar] [CrossRef]
- Conway, M.; Kawazoe, A.; Chanlekha, H.; Collier, N. Developing a disease outbreak event corpus. J. Med. Internet Res. 2010, 12, e43. [Google Scholar] [CrossRef]
- Espina, K.; Estuar, M.R.J.; Ix, D.J.S.; Lara, R.J.E.; de los Reyes, V.C. Towards an infodemiological algorithm for classification of filipino health tweets. Procedia Comput. Sci. 2016, 100, 686–692. [Google Scholar] [CrossRef]
- Penalver-Martinez, I.; Garcia-Sanchez, F.; Valencia-Garcia, R.; Rodriguez-Garcia, M.A.; Moreno, V.; Fraga, A.; Sanchez-Cervantes, J.L. Feature-based opinion mining through ontologies. Expert Syst. Appl. 2014, 41, 5995–6008. [Google Scholar] [CrossRef]
- Salas-Zárate, M.D.P.; Medina-Moreira, J.; Lagos-Ortiz, K.; Luna-Aveiga, H.; Rodriguez-Garcia, M.A.; Valencia-Garcia, R. Sentiment analysis on tweets about diabetes: An aspect-level approach. Comput. Math. Methods Med. 2017, 2017, 5140631. [Google Scholar] [CrossRef] [PubMed]
- Peñalver-Martínez, I.; Valencia-García, R.; García-Sánchez, F. Ontology-guided approach to feature-based opinion mining. In Proceedings of the International Conference on Application of Natural Language to Information Systems, Alicante, Spain, 28–30 June 2011; pp. 193–200. [Google Scholar]
- Dragoni, M.; Poria, S.; Cambria, E. OntoSenticNet: A commonsense ontology for sentiment analysis. IEEE Intell. Syst. 2018, 33, 77–85. [Google Scholar] [CrossRef]
- Schouten, K.; Frasincar, F.; de Jong, F. Ontology-enhanced aspect-based sentiment analysis. In Proceedings of the International Conference on Web Engineering, Rome, Italy, 5–8 June 2017; pp. 302–320. [Google Scholar]
- de Kok, S.; Punt, L.; van den Puttelaar, R.; Ranta, K.; Schouten, K.; Frasincar, F. Aggregated aspect-based sentiment analysis with ontology features. Prog. Artif. Intell. 2018, 7, 295–306. [Google Scholar] [CrossRef]
- Baccianella, S.; Esuli, A.; Sebastiani, F. Sentiwordnet 3.0: An enhanced lexical resource for sentiment analysis and opinion mining. In Proceedings of the International Conference on Language Resources and Evaluation, LREC 2010, Valletta, Malta, 17–23 May 2010; Volume 10, pp. 2200–2204. [Google Scholar]
- Wilson, T.; Raaijmakers, S. Comparing word, character, and phoneme n-grams for subjective utterance recognition. In Proceedings of the Ninth Annual Conference of the International Speech Communication Association, Brisbane, Australia, 22–26 September 2008. [Google Scholar]
- Kulmizev, A.; Blankers, B.; Bjerva, J.; Nissim, M.; van Noord, G.; Plank, B.; Wieling, M. The power of character n-grams in native language identification. In Proceedings of the 12th Workshop on Innovative Use of NLP for Building Educational Applications, Copenhagen, Denmark, 8 September 2017; pp. 382–389. [Google Scholar]
- Tausczik, Y.R.; Pennebaker, J.W. The psychological meaning of words: LIWC and computerized text analysis methods. J. Lang. Soc. Psychol. 2010, 29, 24–54. [Google Scholar] [CrossRef]
- Salas-Zarate, M.D.P.; Valencia-Garcia, R.; Ruiz-Martinez, A.; Colomo-Palacios, R. Feature-based opinion mining in financial news: An ontology-driven approach. J. Inf. Sci. 2017, 43, 458–479. [Google Scholar] [CrossRef]
- Almela, A.; Valencia-Garcia, R.; Cantos, P. Seeing through deception: A computational approach to deceit detection in written communication. In Proceedings of the Workshop on Computational Approaches to Deception Detection, Association for Computational Linguistics, Avignon, France, 23 April 2012; pp. 15–22. [Google Scholar]
- Go, A.; Bhayani, R.; Huang, L. Twitter sentiment classification using distant supervision. CS224N Proj. Rep. Stanf. 2009, 1, 2009. [Google Scholar]
- Medina-Moreira, J.; Salavarria-Melo, J.O.; Lagos-Ortiz, K.; Luna-Aveiga, H.; Valencia-García, R. Opinion Mining for Measuring the Social Perception of Infectious Diseases. An Infodemiology Approach. In Proceedings of the Technologies and Innovation: 4th International Conference, CITI 2018, Guayaquil, Ecuador, 6–9 November 2018; Volume 883, p. 229. [Google Scholar]
- García-Díaz, J.A.; Apolinario-Arzube, Ó.; Medina-Moreira, J.; Luna-Aveiga, H.; Lagos-Ortiz, K.; Valencia-García, R. Sentiment Analysis on Tweets related to infectious diseases in South America. In Proceedings of the Euro American Conference on Telematics and Information Systems, Fortaleza, Brazil, 12–15 November 2018; p. 21. [Google Scholar]
- Ho, T.K. Random decision forests. In Proceedings of the 3rd International Conference on Document Analysis and Recognition, Montreal, QC, Canada, 14–16 August 1995; Volume 1, pp. 278–282. [Google Scholar]
- Platt, J. Sequential Minimal Optimization: A Fast Algorithm for Training Support Vector Machines; Technical Report MSR-TR-98-14; Microsoft: Washington, DC, USA, 1998. [Google Scholar]
- Üstün, B.; Melssen, W.J.; Buydens, L.M. Facilitating the application of support vector regression by using a universal Pearson VII function based kernel. Chemom. Intell. Lab. Syst. 2006, 81, 29–40. [Google Scholar] [CrossRef]
- Palczewska, A.; Palczewski, J.; Robinson, R.M.; Neagu, D. Interpreting random forest classification models using a feature contribution method. In Integration of Reusable Systems; Springer: Berlin, Germany, 2014; pp. 193–218. [Google Scholar]
- Al Amrani, Y.; Lazaar, M.; El Kadiri, K.E. Random forest and support vector machine based hybrid approach to sentiment analysis. Procedia Comput. Sci. 2018, 127, 511–520. [Google Scholar] [CrossRef]
- Fernández-Delgado, M.; Cernadas, E.; Barro, S.; Amorim, D. Do we need hundreds of classifiers to solve real world classification problems? J. Mach. Learn. Res. 2014, 15, 3133–3181. [Google Scholar]
- Hall, M.; Frank, E.; Holmes, G.; Pfahringer, B.; Reutemann, P.; Witten, I.H. The WEKA data mining software: An update. ACM SIGKDD Explor. Newsl. 2009, 11, 10–18. [Google Scholar] [CrossRef]
© 2019 by the authors. Licensee MDPI, Basel, Switzerland. This article is an open access article distributed under the terms and conditions of the Creative Commons Attribution (CC BY) license (http://creativecommons.org/licenses/by/4.0/).